the Creative Commons Attribution 4.0 License.
the Creative Commons Attribution 4.0 License.
 | 18 Jun 2024
Anomalous North Pacific subtropical mode water volume and density decrease in a recent stable Kuroshio Extension period from Argo observations
Jing Sheng
Yanzhen Gu
Peiliang Li
Fangguo Zhai
Ning Zhou
North Pacific subtropical mode water (NPSTMW) is formed as a low-stratification water mass in the wintertime mixed layer south of the Kuroshio Extension (KE). In a recent period of 2018–2021, the KE jet was in a persistent stable dynamic state. But based on analysis of Argo observation, the mean volume of NPSTMW in the ventilation region dropped anomalously by ∼ 21 % during 2018–2021 relative to 2012–2015, when the KE jet was likewise stable. Moreover, the NPSTMW volume in a denser density range (approximately σθ>25.2 kg m−3) has started to decrease since 2018. The decreases in the NPSTMW subduction and formation rate are associated with anomalously shallow wintertime mixed-layer depth (MLD) and weak heat loss in the NPSTMW formation region. The decrease in air–sea heat exchange acts to weaken the vertical mixing and decrease the MLD, resulting in the weakening of subduction. The interannual variations in the air–sea heat exchange and wintertime MLD reflect the variability in the overlying atmosphere, which is correlated with a Pacific Decadal Oscillation (PDO) shift in 2018–2021. When the PDO shifted from its positive phase to a negative phase in the analysis period, the effects of local wind stress anomalies seemed to play an evident role in driving the variability in NPSTMW on interannual timescales. The MLD and heat loss change during the cold season in 2018–2021 were strongly coupled with the poleward shift of the westerlies – which cause weaker wintertime wind and easterly wind anomalies over the NPSTMW formation region. The declines in heat loss and southward Ekman transport, owing to the wind stress anomalies, further prohibit upper-ocean convection and mixed-layer deepening and cooling. Additionally, the insufficient development of wintertime MLD in 2018–2021 may also be associated with the significantly intensified preconditioning of near-surface stratification (< 150 m depth) due to the persistent near-surface warming and the weak vertical entrainment process in winter.
- Article
(12037 KB) - Full-text XML
- BibTeX
- EndNote


North Pacific subtropical mode water (NPSTMW) is one of the most remarkable low-potential-vorticity (PV denotes potential vorticity) (i.e., low-stratification) water masses that can be found in the subsurface layer of the western part of the subtropical gyre in the North Pacific Ocean (Oka and Qiu, 2012; Suga et al., 1989). The NPSTMW formation processes are involved in the transformation, formation, and subduction of the water mass in the upper ocean (i.e., thermodynamic and dynamic processes; Marshall et al., 1999; Nishikawa et al., 2013). Hence, the mode waters retain the memory of the atmospheric condition at the formation time and are key to understanding interannual-to-interdecadal climate variability (Wu et al., 2020, 2021). The re-emergence areas of winter sea surface temperature (SST) anomalies in the Northern Hemisphere and the Southern Hemisphere correspond to the mode water formation areas (Hanawa and Sugimoto, 2004). The change in water properties from the formation area to the re-emergence area clearly indicates that waters with winter SST anomalies move from the formation area to the re-emergence area in a year (Sugimoto and Hanawa, 2005). The mode waters play an important role in modulating the ocean ventilation process accompanying biogeochemical variability (Oka et al., 2015, 2019).
NPSTMW is formed in a deep wintertime mixed layer (ML) south of the Kuroshio and the Kuroshio Extension (KE), controlling the ventilation process of the upper ocean due to ocean–atmospheric interaction in wintertime (Oka and Qiu, 2012). Many previous observations and numerical experiments have studied the related factors of interannual to decadal variations in NPSTMW. The early studies have pointed out that the few strong wintertime air–sea heat flux loss events driven by the East Asian monsoon (e.g., Hanawa and Kamada, 2001; Masuzawa, 1969; Rainville et al., 2007; Suga and Hanawa, 1995; Taneda et al., 2000) dominate the interannual variations in NPSTMW formation. Davis et al. (2011) then identified that the interannual variability in NPSTMW volume is correlated with the role of the surface heat flux and large-scale wind stress patterns due to the Pacific Decadal Oscillation (PDO; Newman et al., 2016) shift with a zero time lag. A negative (positive) PDO index implies a weaker (stronger) Aleutian Low (AL), weaker (stronger) westerlies, and higher (lower) sea surface temperature (SST) in the western North Pacific subtropical gyre region (Qiu, 2003). A weaker (stronger) wind stress over the NPSTMW formation region results in less (more) heat loss to the atmosphere and less (more) NPSTMW. In addition, the weaker westerlies in the NPSTMW formation area produce less Ekman transport of the cold water from the north, and the resulting warmer subsurface ocean inhibits wintertime convection and deep ML formation. However, Qiu and Chen (2006) attributed the decadal variability in NPSTMW to the role of first-mode baroclinic Rossby waves and quasi-decadal variability in the dynamic state of the KE jet in association with the PDO. This mechanism has been demonstrated by successive studies (e.g., Cerovečki and Giglio, 2016; Oka et al., 2015; Qiu et al., 2007; Sugimoto and Hanawa, 2010; Toyama et al., 2015). During the positive (negative) PDO phase, namely when the AL is stronger (weaker), positive (negative) wind stress curl anomalies that are generated give rise to enhanced Ekman flux divergence, resulting in negative (positive) sea surface height (SSH) and main-thermocline-depth (MTD) anomalies in the central North Pacific, and then propagate westward at the speed of the first-mode baroclinic Rossby waves. When the anomalies reach the area east of Japan with a time lag of 3–5 years, the KE turns into an unstable (stable) state accompanying high (low) regional eddy activity (Qiu and Chen, 2005). Especially during the unstable KE period, more cyclonic eddies are detached from the KE to the southern recirculation gyre (Sasaki and Minobe, 2015), supplying the relatively high PV water from north of the KE to hinder the formation of a deep ML. Anomalous shoaling of the MTD and stronger background stratification in the NPSTMW formation region, both associated with a negative PDO phase, provide unfavorable oceanic conditions for the development of a deep wintertime ML associated with NPSTMW (Sugimoto and Hanawa, 2010; Sugimoto and Kako, 2016). Cerovečki and Giglio (2016) also demonstrated that the strong NPSTMW density decrease that was documented by Argo in 2009 is modulated by a negative density anomaly that started to propagate westward from the central Pacific about 3 years later, when the PDO index switched from positive to negative. Finally, the surface density decrease provided oceanic preconditioning for preferential surface formation of a lighter variety of NPSTMW. Cerovečki et al. (2019) expand on the Davis et al. (2011) analysis of the strong NPSTMW volume decrease in 1996–1999; they also found that a strong NPSTMW density decrease played a crucial role in the strong NPSTMW volume decrease in 1999. The near-surface density decrease was caused by a temperature increase, which in turn was caused by an increase in KE geostrophic transport at the time when the KE jet changes from a contracted to an elongated state, which started in 1997 (Qiu, 2000). Both processes increased the PV in the NPSTMW region, decreasing the volume of water in the NPSTMW density range. Although locally governed by different physical processes, both NPSTMW volume and density decrease are part of quasi-decadal variability caused by basin-wide changes in wind stress curl.
In August 2017, the KE switched from an unstable state to a stable state in association with the occurrence of the Kuroshio large-meander (LM) path south of Japan (Fig. 1), although negative SSH and MTD anomalies associated with the positive PDO phase had been arriving from the central North Pacific (Qiu et al., 2020). Since then, Kuroshio LM and the stable state of the KE have lasted – for more than 6 years now (Qiu and Chen, 2021; Qiu et al., 2023; Usui, 2019) – while the NPSTMW volume has declined (Oka et al., 2021). It is worth noting that the current stable KE state seems to have begun with the initiation of the LM (Qiu et al., 2020); it has also been supported by basin-wide wind forcing (Qiu et al., 2023). Thus, it is of interest to examine what predominantly determines such variability in NPSTMW (2018–2021). By analyzing in situ observational data, we are about to identify the physical processes governing the persistent decline in NPSTMW in recent years when the KE jet is stable. Argo observations were used to gain a better understanding of the temporal variability in NPSTMW and to identify its associated atmospheric forcing and oceanic dynamics. The rest of this paper is structured as follows: Sect. 2 describes the data, methods, and mean characteristics of NPSTMW defined in this study. Section 3.1–3.3 describe the recent decreases in NPSTMW volume and density corresponding to the subduction and surface formation rate anomalies, respectively. The mechanisms that give rise to interannual variations in the subduction and formation of NPSTMW are further discussed in Sect. 3.4. Section 4 contains a summary and concluding remarks.
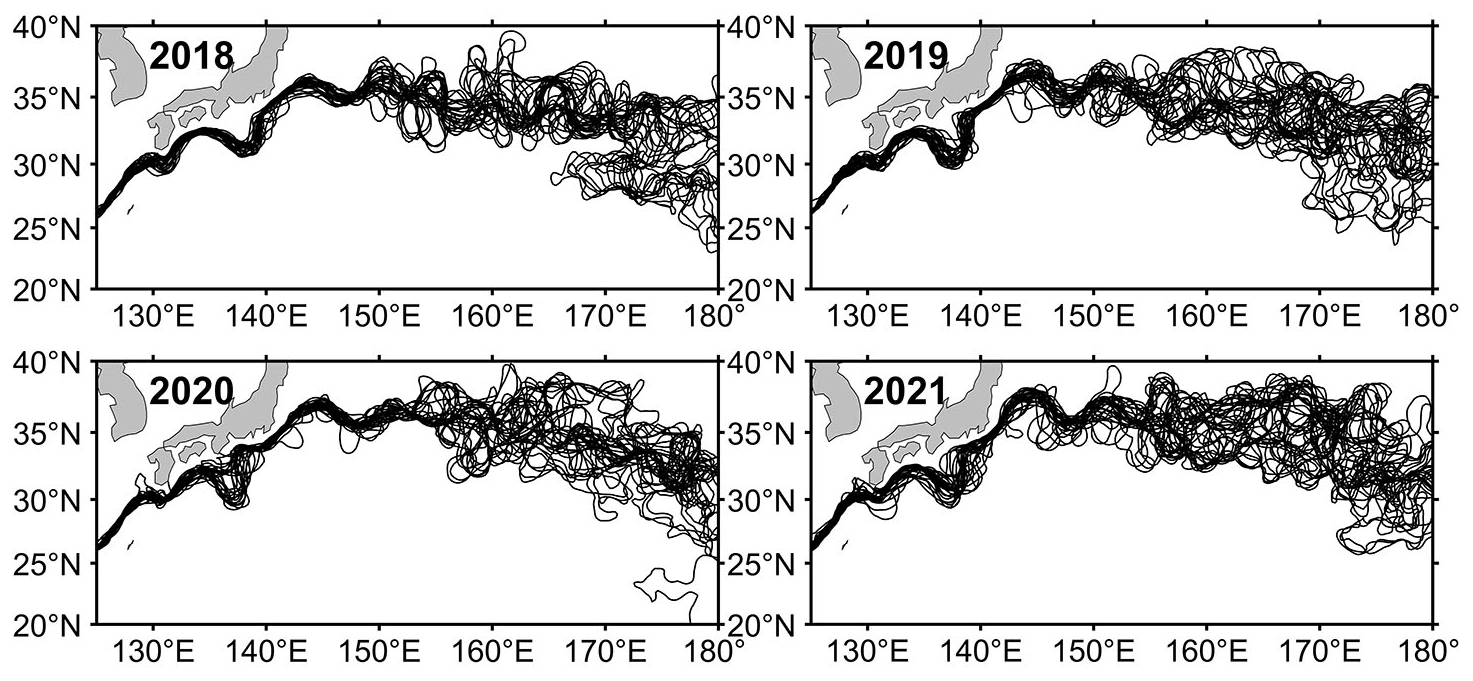
Figure 1Yearly (in the Kuroshio LM period) paths of the Kuroshio and its extension defined by 110 cm contours in the weekly SSH fields that were reconstructed from Copernicus Marine Environment Monitoring Service satellite-derived altimetry SSH anomaly data and mean dynamic topography data. Here paths are plotted every 14 d.
2.1 Data
The formation and distribution of NPSTMW briefly occur in an area bounded by 20–40° N and 125–180° E (east of the islands of Japan; Liu et al., 2017). We use the most recent updated gridded Argo product with a horizontal resolution of 1° × 1° obtained by Roemmich and Gilson (referred to as the RGA dataset below; Roemmich and Gilson, 2009), which includes the Argo-only-derived monthly temperature and salinity fields covering the period from 2004–2021. We also use another updated gridded dataset (horizontal resolution: 1° × 1°; vertical resolution: 25 levels from 10 to 2000 m) provided by JAMSTEC, which includes monthly Argo data and other available water temperature and salinity data since January 2001 (referred to as the MOAA-GPV dataset below; Hosoda et al., 2008). In addition, we also use individual Argo profiles, owing to their better vertical resolution than the gridded data, to ensure the recent variability in NPSTMW in the NPSTMW formation region and to enable a detailed description of NPSTMW change. The quality-controlled individual Argo profiles are edited according to the procedures of Oka et al. (2007). The profiles almost cover the whole region of the NPSTMW formation and distribution, especially in the zone west of 155° E (Fig. 2a).
The monthly atmospheric variables of net surface heat flux (Qnet, positive into the sea surface; the sum of latent heat flux, sensible heat flux, net surface longwave radiation flux, and net shortwave radiation flux), evaporation (E), precipitation (P), sea level pressure (SLP), and wind stress for periods from 2004–2021 are from the ECMWF ERA5 reanalysis with a horizontal resolution of ° × ° (Hersbach et al., 2019). The zonal and meridional surface geostrophic velocity anomalies, sea surface height (SSH) anomaly data, and mean dynamic topography data are provided by the Copernicus Marine Environment Monitoring Service (CMEMS). The CMEMS dataset derived from satellite altimetry has a 1 d temporal resolution and a ° spatial resolution from January 1993 to December 2021.
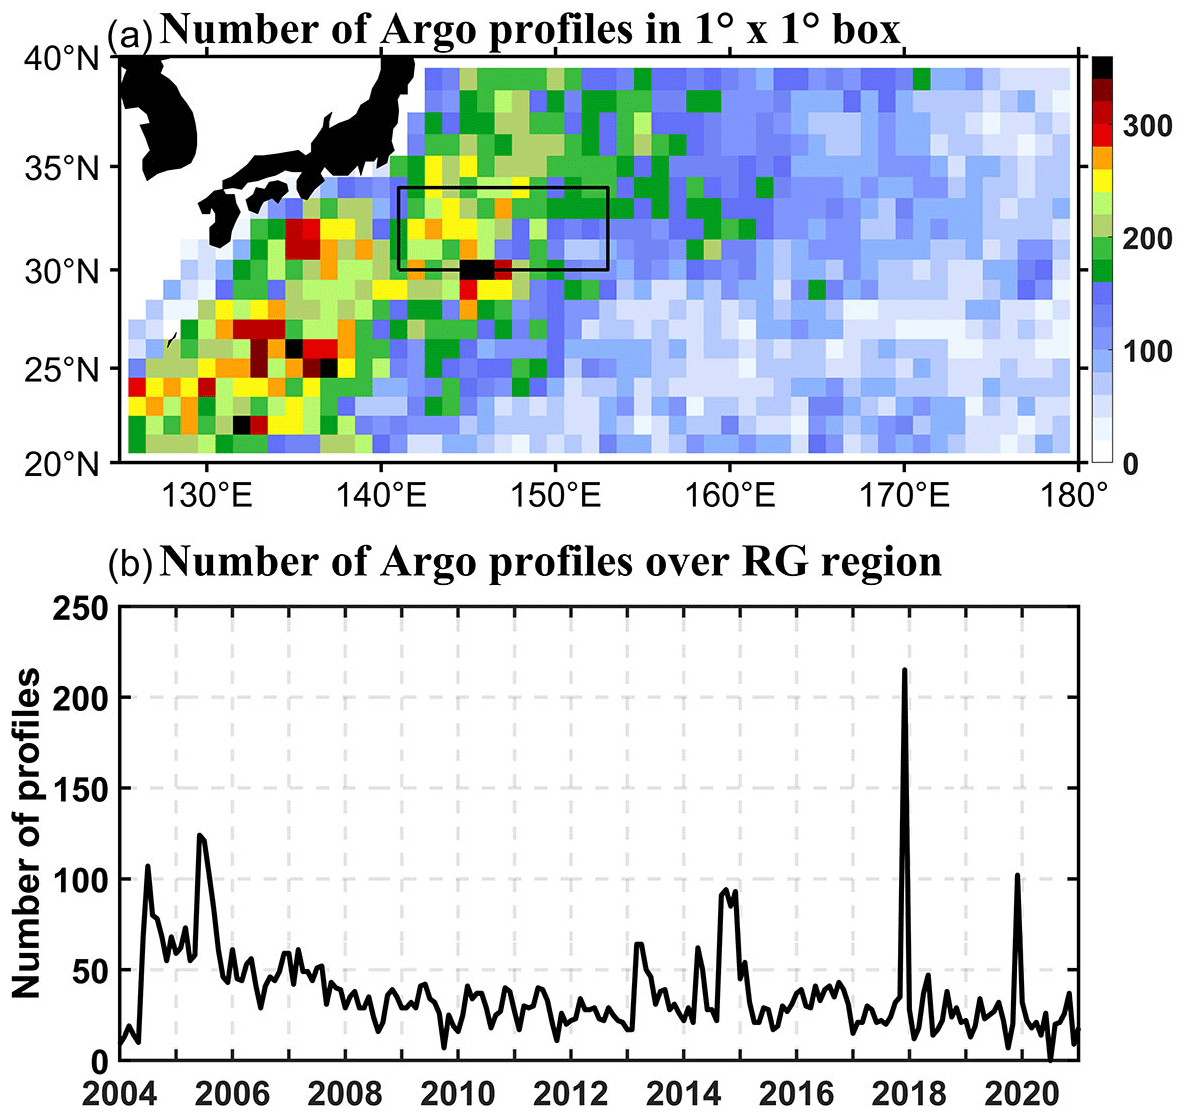
Figure 2Number of Argo profiles (a) in each 1° × 1° box (solid black box shows the recirculation gyre region south of the KE) and (b) over the entire upstream KE recirculation gyre (30–34° N, 141–153° E) for the period from January 2004 to December 2021 (note that profiles north of the KE are excluded).
2.2 Mean characteristics of NPSTMW
NPSTMW is formed in the deep winter (January–March) ML (Suga and Hanawa, 1990). In this study, NPSTMW is defined as a water mass with a low PV (PV< 2.0 × 10⁻¹⁰ m−1 s−1) in the potential density range of σθ=25.0–25.5 kg m−3 (Fig. 3). The PV is defined as , where f is the Coriolis parameter, ρ is a reference density (1025 kg m−3), and σθ is the potential density (Liu et al., 2017). The mixed-layer depth (MLD) is defined as the depth at which the potential density is different from the sea surface (10 m) density by 0.125 kg m−3 (Levitus, 1982).
The narrow latitudinal extent of the NPSTMW formation extends from 30° N to the KE jet near 35° N (i.e., the upstream KE recirculation gyre; referred to as the RG region below). This part of NPSTMW can then be advected downstream to the date line and to the subtropical front (Oka and Qiu, 2012; Qiu et al., 2006). Due to focusing on individual profiles detecting NPSTMW formation in the RG region south of the KE (30–34° N, 141–153° E; Fig. 2a), we use only profiles with temperature (T) >16 °C at 200 m to minimize the possibility of identifying subarctic profiles coming from the north of the KE, according to the procedures of Sugimoto and Kako (2016). Figure 2b displays the number of profiles in which the MLD and thickness of NPSTMW were detected in the RG region south of the KE, revealing that more than 30 profiles are available for most months. Temperature and salinity for each profile are interpolated onto a 1 m vertical grid using the Akima spline (Akima, 1970). We use a 12° isotherm as an indicator of the MTD in the western part of the North Pacific subtropical gyre (Uehara et al., 2003).
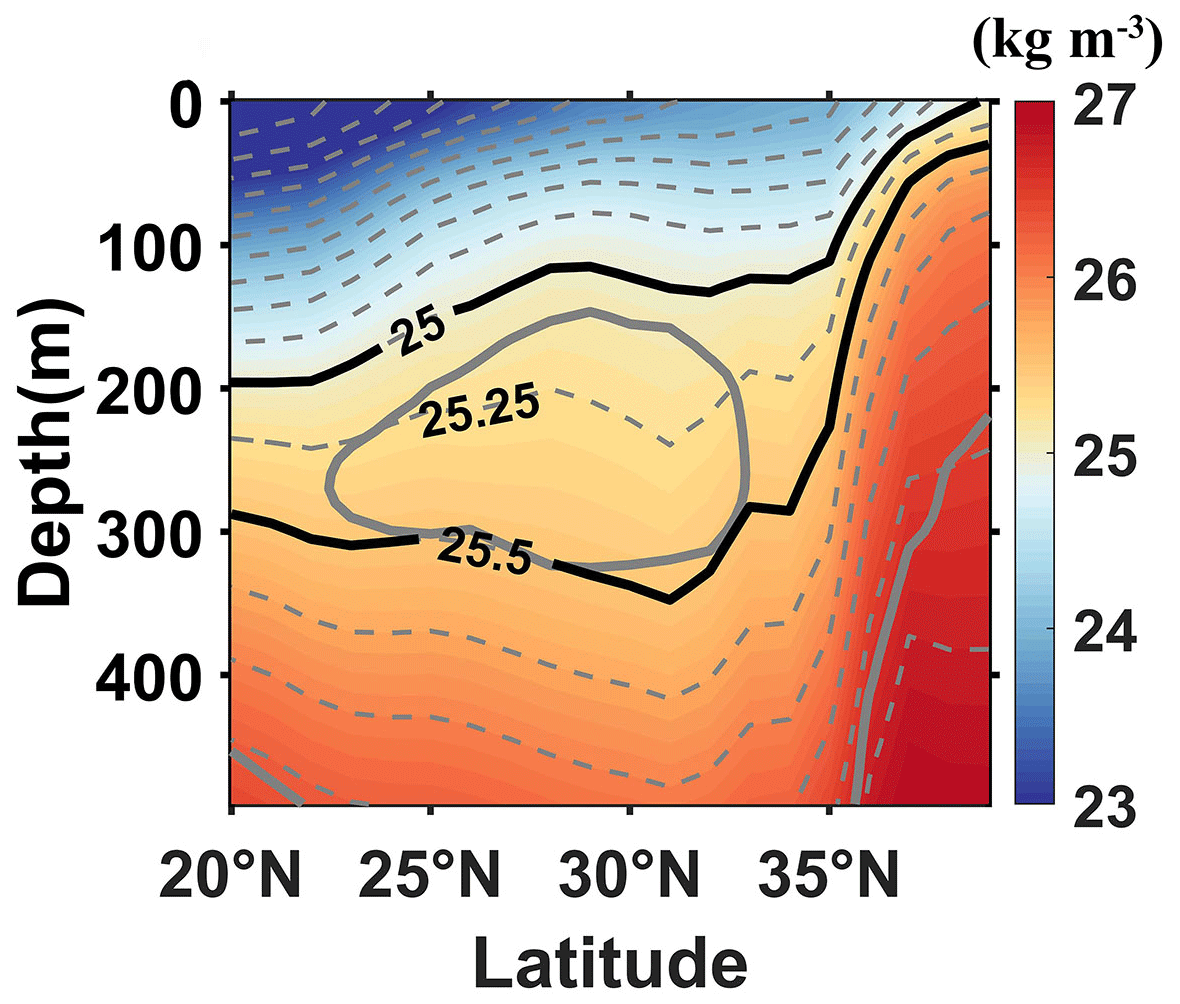
Figure 3The meridional section at 150° E of the climatological annual mean potential density (color shading and thin dashed gray contours with σθ=0.25 kg m−3 interval) based on the 2004–2021 period averages of the RGA dataset. The thick solid black contours (σθ=25.0 and σθ=25.5 kg m−3) are the isopycnals bounding the density range of NPSTMW, and the thick solid gray contour bounds the low-PV pool with PV < 2 × 10⁻¹⁰ m−1 s−1.
2.3 Formation and subduction of NPSTMW
The subduction rate is defined as the rate at which the water mass is transferred from the ocean surface layer into the main thermocline. The instantaneous subduction rate (s(t)) of water mass that leaves the ML in the Eulerian coordinates is given by Cushman-Roisin (1987):
where h is the mixed-layer depth (MLD). The rate of mixed-layer shoaling is the temporal induction (). The lateral induction rate at which the water is swept beneath the shallowing MLD is by horizontal advection , −w refers to the vertical pumping and ∇ is the horizontal gradient operator. Using the temperature and salinity profiles at each grid point from the RG dataset, we compute the horizontal geostrophic velocity field u relative to a reference level of 1000 m (Oka et al., 2011) with a horizontal resolution of 1° × 1°. The vertical pumping is calculated from wind stress (τ) provided by ERA5, and ρ=1025 kg m−3.
Practically, the formation process of mode water is that the low-PV water mass at the base of the late-winter ML is subducted into the ocean interior (Oka and Qiu, 2012). Thus, the PV of subducted water is related to the subduction rate by (Williams, 1989, 1991)
where ub is the horizontal velocity at the base of the mixed layer. ρm and ρ are the mixed-layer density and reference density, respectively. s represents the subduction rate.
Since the instantaneous subduction rate fluctuates considerably, the annual mean subduction rate (sann) is defined as (Wu et al., 2021)
where T0 is 1 year and and are the times when effective subduction starts and ends, respectively. The effective subduction period is fixed in late winter (February–April; Oka et al., 2015).
Before the effective subduction period in late winter, the fluid passes laterally across outcropping isopycnals at the sea surface in winter; the transformation of fluid that makes up a particular density layer is modified by surface buoyancy flux, vertical diffusion, or eddy buoyancy fluxes (e.g., Garrett and Tandon, 1997; D. Marshall, 1997; J. Marshall et al., 1999; Walin, 1982). In practice, the water mass transformation F at time t is calculated using discrete density intervals but considering the air–sea flux only (neglecting interior mixing; Cerovečki et al., 2019; Cerovečki and Marshall, 2008):
Here, is the surface area of the outcrop window for σθ within the density interval [, ] separated by the density increment Δσθ. Transformation has units of sverdrups (Sv; 1 Sv = 106 m3 s−1). The surface buoyancy flux (Bsurf) is given by
where α and β are the thermal expansion and saline contraction coefficients, respectively. Cp is the specific heat of seawater. S0 is the sea surface water salinity. ρ0 is the sea surface density.
The convergence of the air–sea transformation rate (F) in the density interval [, ] yields the air–sea formation rate (Guo et al., 2018; Small et al., 2022):
Here, M is the water mass accumulation per unit density (i.e., the convergence of water mass transformation in density space) and MΔσθ is referred to as the water mass formation (with units of Sv).
2.4 Steric height change
Outside the tropics, the SSH signal derived from satellite altimetry (CMEMS dataset) is dominated by large-scale seasonally varying steric processes. Steric height changes are caused by the expansion or contraction of the water column (Stammer, 1997). They can be written to show the contribution from heat and salt as in Vivier et al. (1999):
The integration is limited to the upper ocean that is affected by atmospheric buoyancy fluxes, where T′ and S′ are the departures from temporal mean temperature and salinity; the first term of the right-hand side of Eq. (7) is substantially larger than the second term in most of the Pacific Ocean. Thus, only thermal processes are considered. As the steric height signals are not the focus of this study, due to thermal expansion is removed hereinafter in the SSH signal derived from satellite altimetry. Removal of the steric height signals has little impact upon the SSH signals that are indirectly induced by the surface buoyancy fluxes (Qiu, 2000).
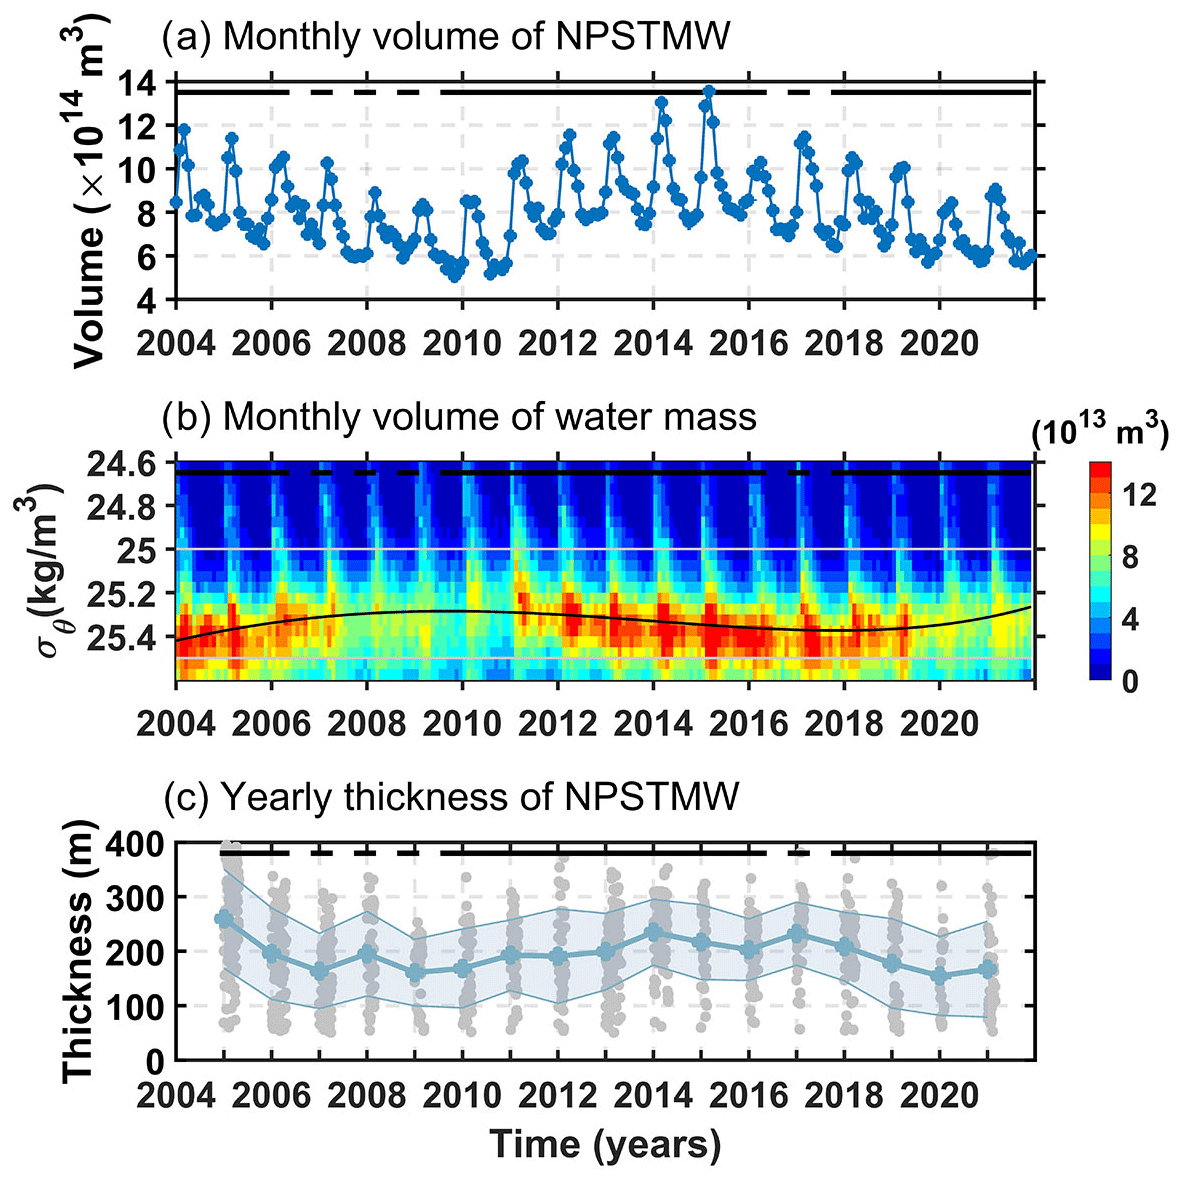
Figure 4(a) Monthly time series of volume of NPSTMW with σθ=25.0–25.5 kg m−3 obtained from the RGA dataset. (b) Monthly averaged water mass volume (1013 m3) estimated from the RGA dataset for the years 2004–2021, in the potential density range σθ=24.6–25.6 kg m−3 (color, right bar) with PV < 2 × 10⁻¹⁰ m−1 s−1. The black line is cubically fit to the monthly volume maximum. Gray contours of the 25 and 25.5 kg m−3 isopycnal surfaces are constant when plotted against density. Both estimates are obtained over the analysis region 20–40° N, 125–180° E, east of Japan. (c) The time series of NPSTMW thickness during the period of yearly maximum thickness (April–May). Gray circles represent values observed from individual Argo profiles in the RG region. The line with circles represents mean values, and the shading around the line shows the standard deviation. Solid (dashed) bars indicate stable (unstable) periods of the KE.
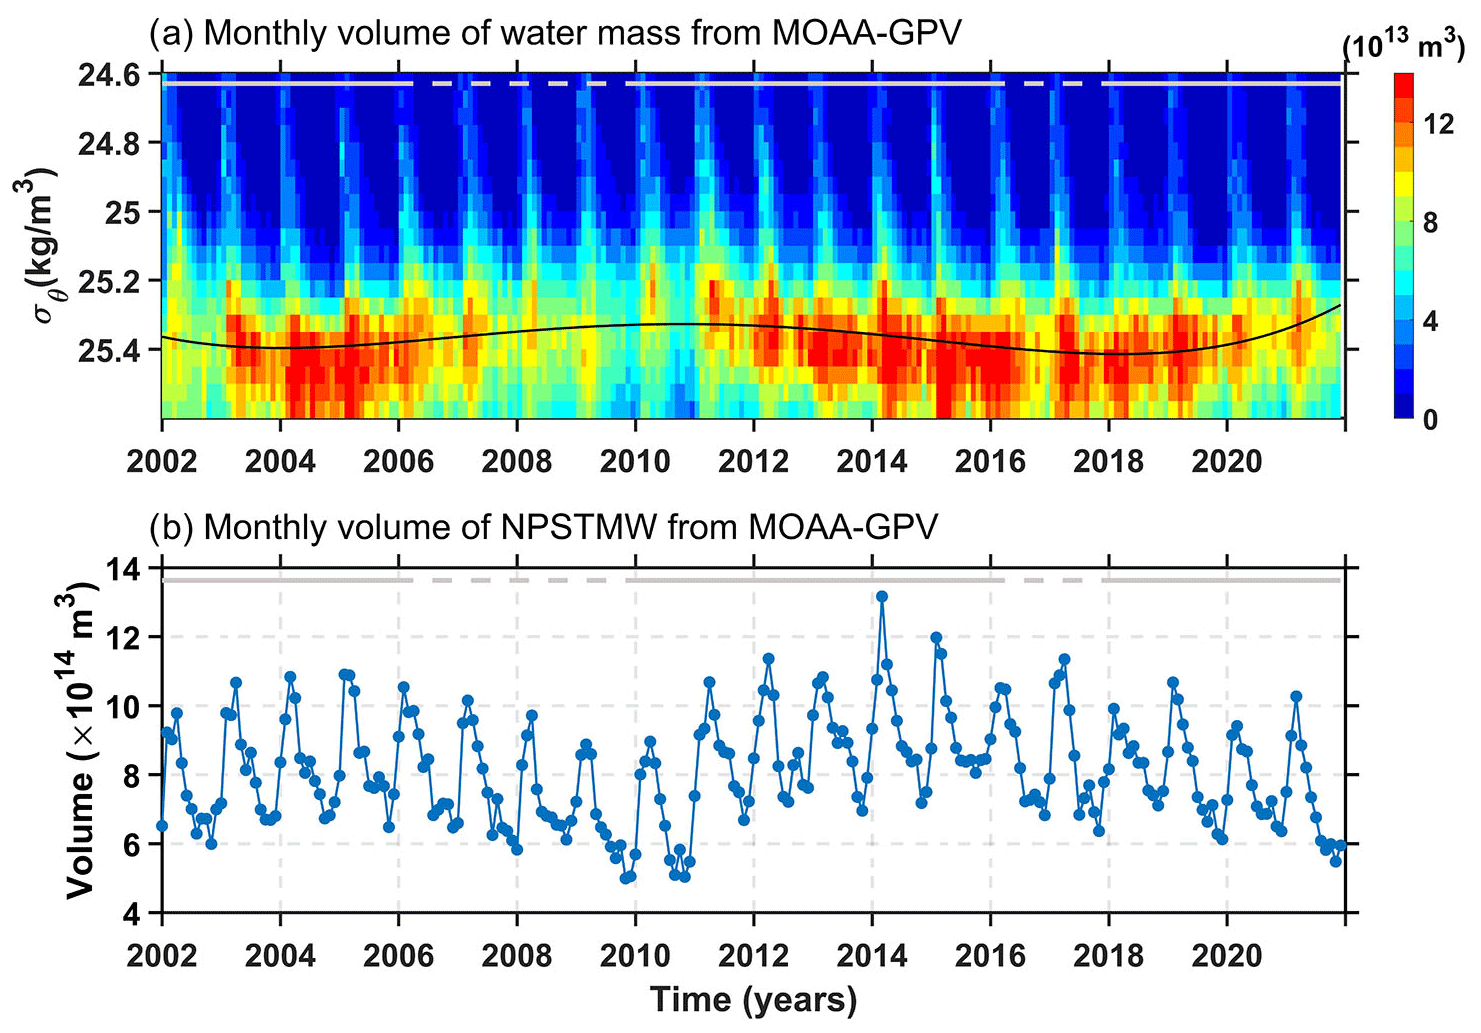
Figure 5(a) Monthly averaged water mass volume (1013 m3) estimated from the MOAA-GPV dataset for the years 2004–2021, in the potential density range σθ=24.6–25.6 kg m−3 (color, right bar) with PV < 2 × 10⁻¹⁰ m−1 s−1. The black line is cubically fit to the monthly volume maximum. (b) Monthly time series of volume of NPSTMW with σθ=25.0–25.5 kg m−3 obtained from the MOAA-GPV dataset. Both estimates are obtained over the analysis region 20–40° N, 125–180° E, east of Japan. Solid (dashed) bars indicate stable (unstable) periods of the KE.
2.5 ML heat budget analysis
We perform the heat budget analysis in the surface ocean ML referring to the method of Qiu (2000):
where Tm denotes the mixed-layer temperature (MLT), Qnet is the net surface heat flux, ρ is the reference density of seawater, h is the MLD, ue is the Ekman velocity and is related to the surface wind stress vector τ by , we is the entrainment velocity, Td is the water temperature at 20 m below the base of the ML, ug is the sea surface geostrophic velocity, and qd is the downward radiative flux at the base of the ML (Sugimoto and Kako, 2016). Herein, we refer to the five terms in Eq. (8) as the temperature tendency term, the air–sea heat exchange term, the vertical entrainment term, the Ekman advection term, and the geostrophic advection term, respectively.
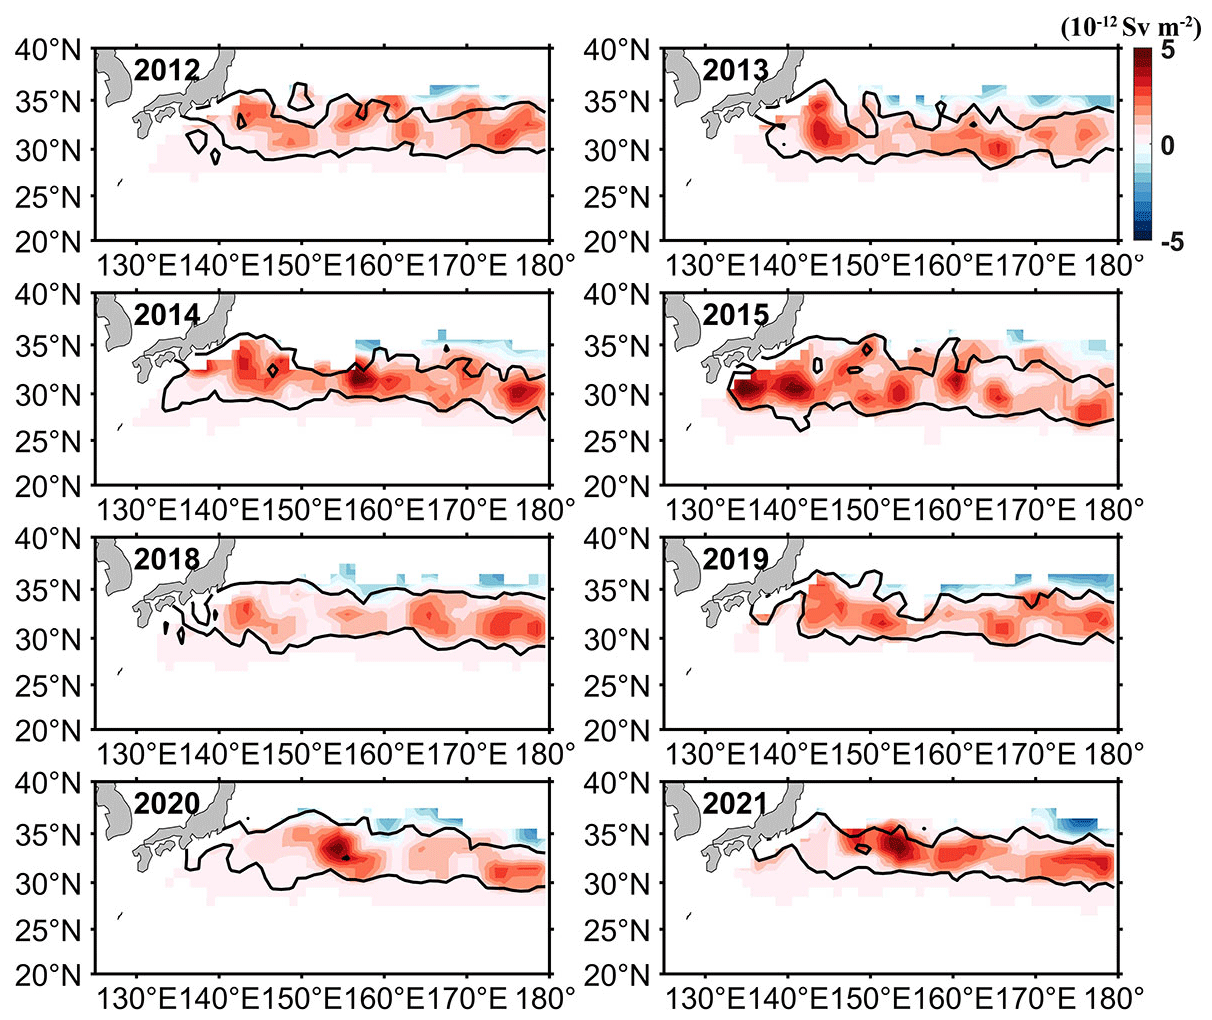
Figure 6Maps of averaged surface formation rate per unit area (10−12 Sv m−2) during wintertime in the NPSTMW density range. The solid lines bound the σθ=25.0–25.5 kg m−3 outcrop region, time-averaged from January–March.
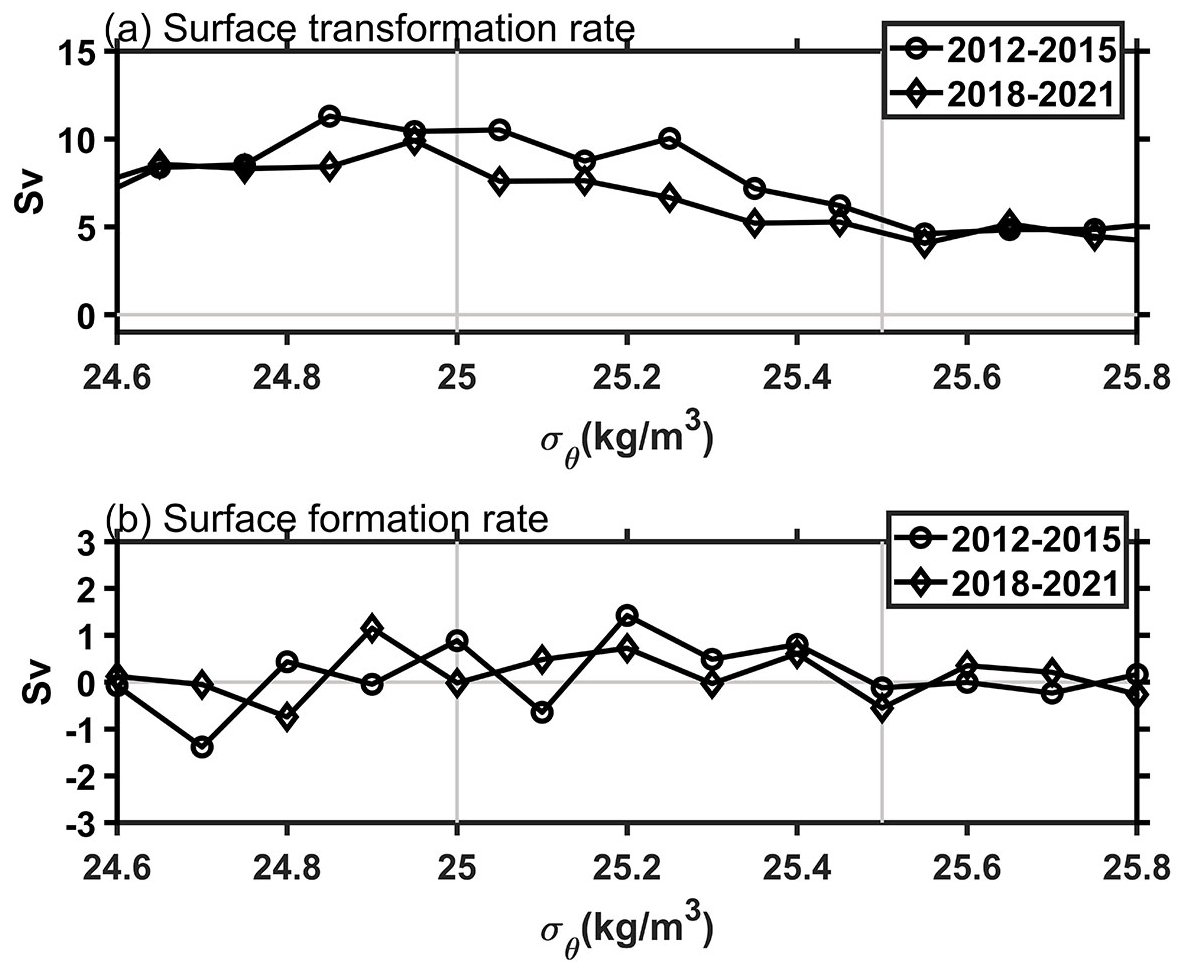
Figure 7(a) The averaged surface transformation rate and (b) the formation rate during the wintertime of 2012–2015 and 2018–2021 obtained from ERA5 air–sea buoyancy flux using the Walin (1982) framework within the wintertime isopycnal outcrop region.
3.1 NPSTMW volume loss and density decrease in 2018–2021
The monthly time series of NPSTMW volume and that binned into potential density at σθ=0.05 kg m−3 are shown in Fig. 4a and b. The NPSTMW volume change is modulated by the variability in the KE state since 2004 (Oka et al., 2021). In a short time of 2006–2009 when the KE jet is unstable, the NPSTMW volume dramatically decreased. The volume of NPSTMW was restored and subsequently increased significantly during 2012–2015, when the KE was stable. But regarding the recent stable KE period, it is worth noting that NPSTMW volume in the analysis region has gradually decreased since 2018. The mean total volume of NPSTMW dropped by ∼ 21 % during 2018–2021 (7.38 × 10¹⁴ m3) on average relative to 2012–2015 (9.29 × 10¹⁴ m3) (Fig. 4a). Oka et al. (2021) investigated NPSTMW change in the region (15–40° N, 120° E–170° W) using Argo float observations. They showed that annual mean volume increased slightly in the northeast region (28–40° N, 140° E–170° W) from 2017–2019, while that in the other region decreased significantly. In fact, NPSTMW in the whole region has gradually decreased in recent years. Hence, the recent decline in NPSTMW observed in the RGA dataset is definitely consistent with the results of Oka et al. (2021). Particularly, the mean NPSTMW volume in the denser density range (approximately σθ>25.2 kg m−3) appears to decrease from 11.07 × 10¹³ m3 in 2012–2015 to 8.77 × 10¹³ m3 in 2018–2021 (Fig. 4b). Meanwhile, we also conduct the Mann–Kendall test on the NPSTMW volume in the denser density range (approximately σθ>25.2 kg m−3) from 2012–2018 following the method of Xu et al. (2022). For the present study, the null hypothesis of no trend is rejected when the absolute value of the standard deviation |Z|>1.96 at the significance level of 0.05. There is a decreasing trend for the change in the NPSTMW volume in the denser density range (). This suggests that the density of NPSTMW declined, accompanied by the NPSTMW volume loss in 2018–2021. The averaged maximum NPSTMW thickness in April to May when the annual NPSTMW formed has also started to gradually decrease since 2018 (Fig. 4c). The mean thickness of NPSTMW in April–May from 2018–2021 dropped by approximately 50 m. There similarly seems to be a persistent loss of newly NPSTMW formation in 2018–2021. To examine the results of the gridded RGA dataset and elongate the timescale of RGA dataset, we also analyze the results from the MOAA-GPV dataset. Besides 2012–2015, the KE is also in a stable state during 2003–2005. The volume and density changes in NPSTMW in 2003–2005 have the same pattern as those in 2012–2015 (Fig. 5). The variability in the KE dynamic state is the significant mechanism in modulating the variabilities in NPSTMW in both periods of a stable KE state pointed out by previous studies (Oka et al., 2015, 2019). In addition, the increase in NPSTMW volume and density is dramatic in 2012–2015 compared to that in 2003–2005. Thus, the comparisons of changes in NPSTMW and mechanisms between in 2012–2015 and 2018–2021 (both in the relatively long time of a stable KE period) are mainly presented hereinafter.
The NPSTMW volume and density increase in 2012–2015 coincided with a period when the KE is in its stable dynamic state. However, what causes the anomalous decline in NPSTMW during a recent period of a stable KE state? Was the observed decrease in newly formed NPSTMW volume and density in 2018–2021 predominantly caused by a decrease in surface formation in the NPSTMW density range and a decrease in subduction of low-PV water in the NPSTMW density range? Furthermore, was the observed decrease in NPSTMW in a recent stable KE period related in some ways to local and distant effects of atmospheric forcing or oceanic preconditions, as suggested by Davis et al. (2011) and Sugimoto and Hanawa (2010)? We address these questions in the subsequent sections.
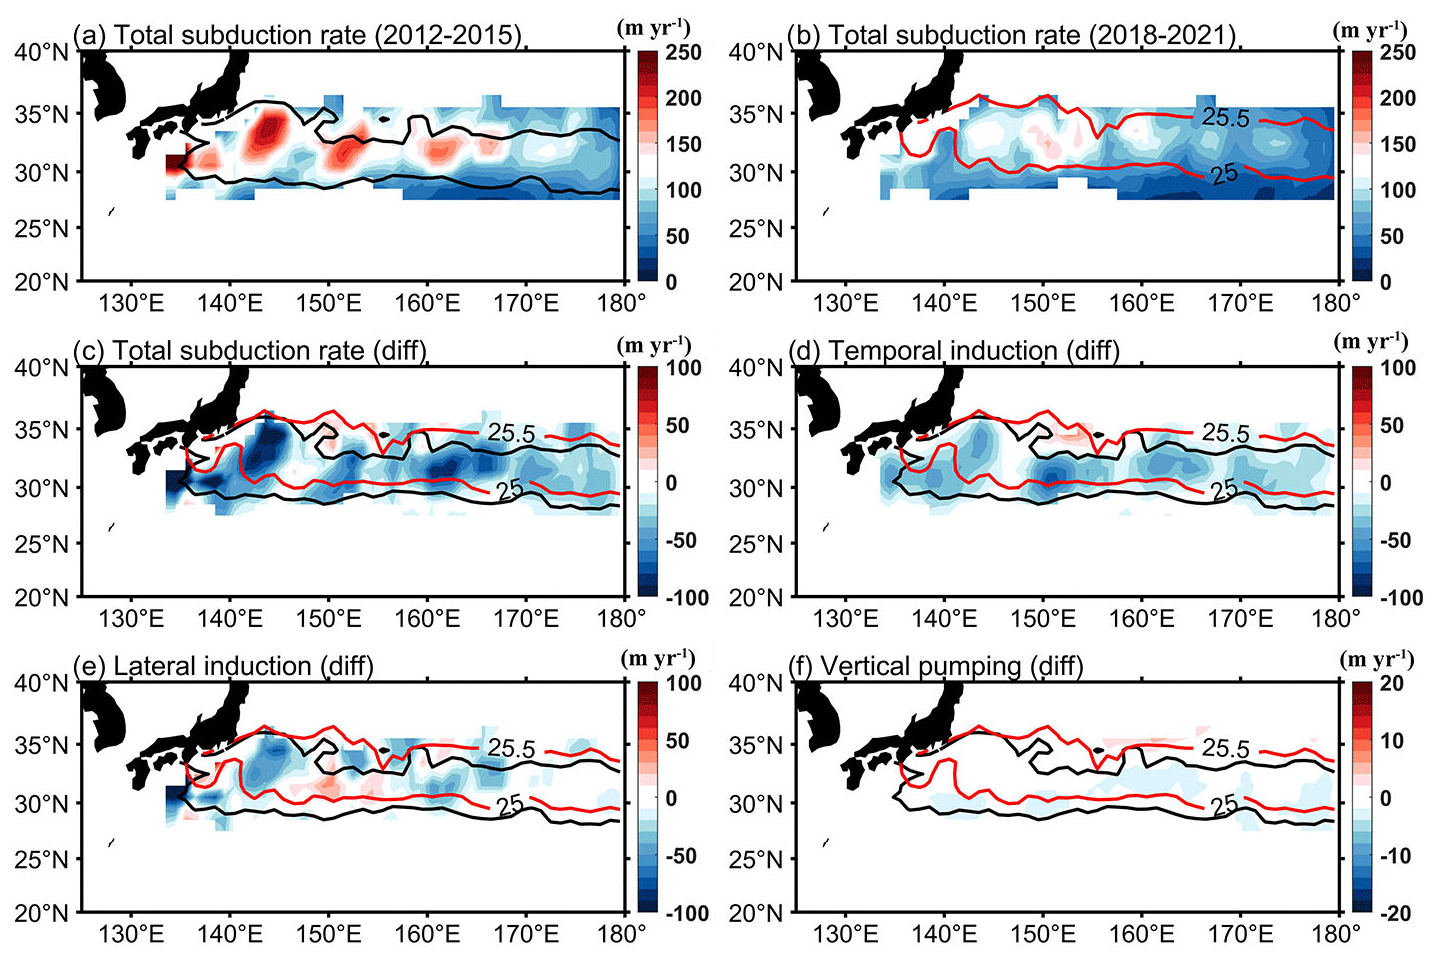
Figure 8(a) The total subduction rate of 2012–2015. (b) The total subduction rate of 2018–2021. (c) The difference (the values of 2018–2021 minus those of 2012–2015) between the subduction rate (m yr−1) and three components responsible for the subduction rate change in the outcrop region: (d) temporal induction , (e) lateral induction , and (f) vertical pumping . Here, t is time, T0 is 1 year, and and are the times when effective subduction starts and ends, respectively (i.e., from February–April) (Marshall et al., 1993). The outcropping lines of σθ=25.0 kg m−3 (the southernmost one) and 25.5 kg m−3 (the northernmost one) are superimposed with solid black (2012–2015) and solid red (2018–2021) contours. The results are obtained from RGA and ERA5 datasets imposing the PV constraint (< 2 × 10⁻¹⁰ m−1 s−1 of Eq. 2).
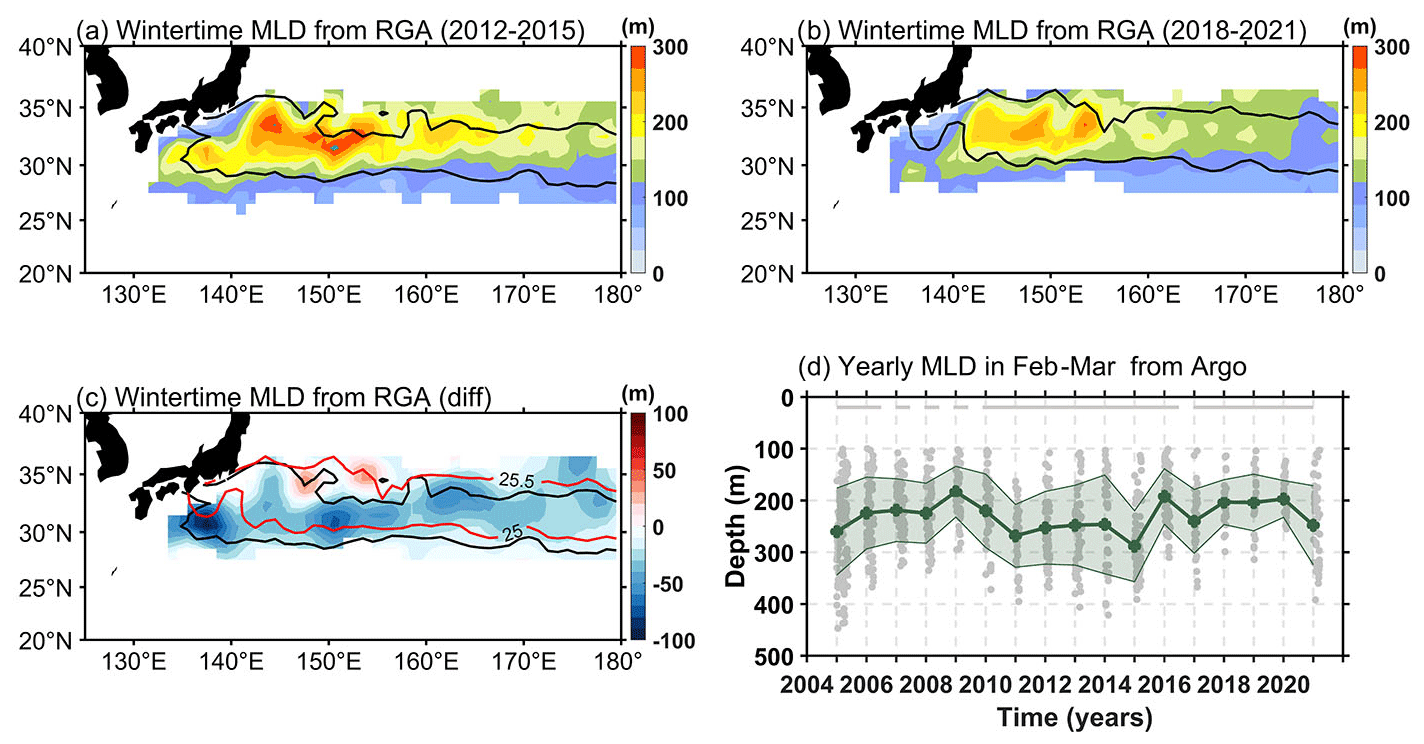
Figure 9The wintertime MLD (m) in the outcrop region from the monthly mean RGA dataset in (a) 2012–2015 and (b) 2018–2021. (c) The difference (the values of 2018–2021 minus that of 2012–2015) between (b) and (a). The outcropping lines of σθ=25.0 kg m−3 (the southernmost one) and 25.5 kg m−3 (the northernmost one) are superimposed with solid black (2012–2015) and solid red (2018–2021) contours in (c). (d) The time series of MLD in February–March in the RG region south of the KE (30–34° N, 141–153° E). Gray circles represent values observed from individual Argo profiles in the RG region. The line with circles represents mean values, and the shading around the line shows the standard deviation. Solid (dashed) bars indicate stable (unstable) periods of the KE.
3.2 Decrease in the NPSTMW surface formation
Surface water mass transformation and formation rates were introduced in Sect. 2.3. Inputs to this analysis are monthly estimates of air–sea buoyancy flux and of surface density in winter. First, maps of the annually averaged surface formation rate in the NPSTMW density range during 2012–2015 and 2018–2021 when the KE is similarly in a stable state are shown in Fig. 6. The averaged areas of the NPSTMW outcrop window (i.e., the averaged formation area of NPSTMW) of 2.67 × 10¹² m2 during 2018–2021 do not shrink remarkably relative to 3.08 × 10¹² m2 during 2012–2015 (Fig. 6) because of the fewer changes in the position of the KE jet when the KE is in a stable state period, unlike the case in 2006–2009 when the smallest NPSTMW outcropping window was attributed to the spatially convoluted path of the KE in the unstable state (Cerovečki and Giglio, 2016). In a stable KE period of 2012–2015, the strong surface formation tended to happen upstream of the KE (141–153° E). However, the averaged surface formation upstream of the KE has declined in a recent stable KE period (Fig. 6). Equation (4) shows that the water mass transformation will be weak owing to the lower surface ocean buoyancy loss over the outcropping window.
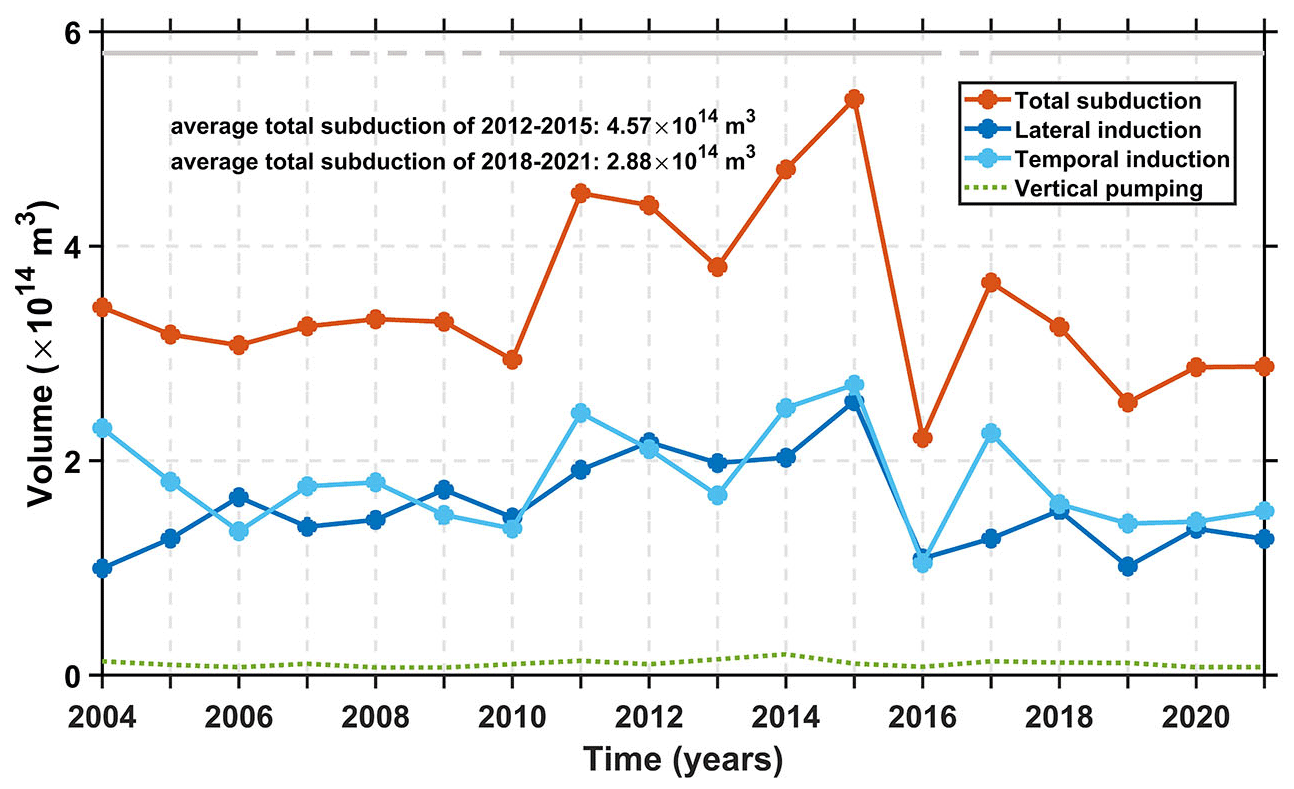
Figure 10Annually averaged total subduction volume and its three components: temporal induction volume from the monthly mean RGA dataset, lateral induction volume from the monthly mean RGA dataset, and vertical pumping from the monthly mean ERA5 data and annually averaged volume of NPSTMW over the northwestern Pacific Ocean (125–180° E, 20–40° N) from the monthly mean RGA dataset for 2004–2021. The results are obtained imposing the PV constraint (< 2 × 10⁻¹⁰ m−1 s−1 of Eq. 2). Solid (dashed) bars indicate stable (unstable) periods of the KE.
Furthermore, in each of the years considered, the annually averaged surface transformation and formation rates were binned into the potential density at σθ=0.1 kg m−3. Figure 7a and b show the averaged surface transformation and formation rate in 2012–2015 and 2018–2021, respectively. The averaged surface formation rate over the time period 2018–2021 increased significantly at σθ=25.1 kg m−3, while the negative formation rate occurred in 2012–2015. This suggests that formation of NPSTMW in the lighter NPSTMW density range (approximately σθ < 25.2 kg m−3) accelerated in 2018–2021. Meanwhile, over the time period of 2018–2021, the peak formation rate shifted toward lower densities (approximately σθ < 25.2 kg m−3) compared to the time period of 2012–2015, so in 2018–2021 only the lighter variety of water in the NPSTMW density range was replenished by surface formation. Over the time period 2018–2021, averaged transformation rates (15.22 Sv) in the lighter NPSTMW density range (approximately σθ< 25.2 kg m−3) compared to that in the time period 2012–2015 (19.26 Sv) were greatly reduced by 21 %. Decreased transformation also reflects a decrease in surface buoyancy loss in 2018–2021, as indicated by Eq. (4).
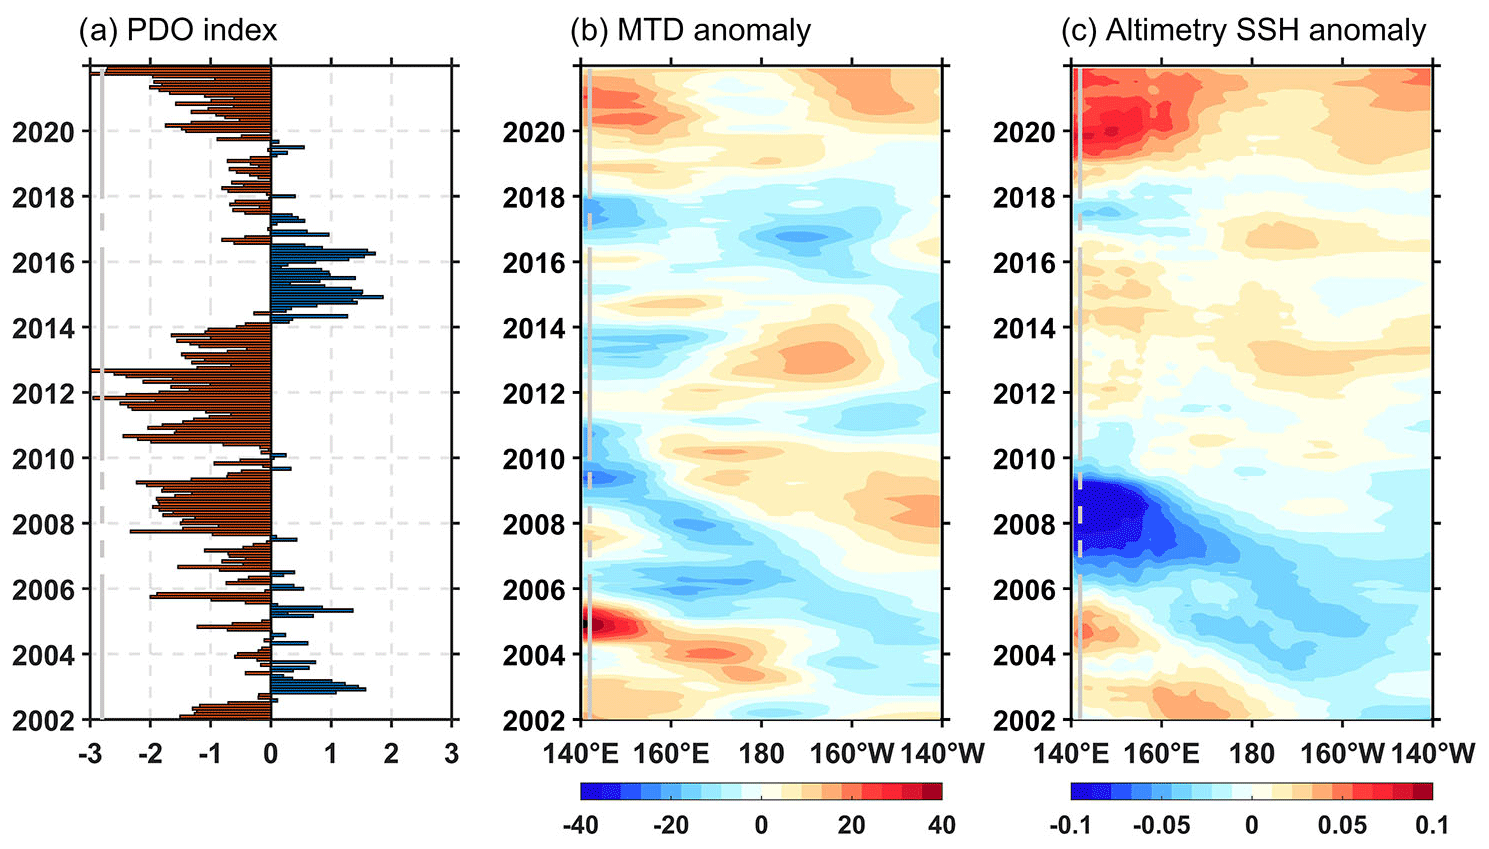
Figure 11(a) Monthly values of the PDO index (Mantua, 1999). (b) Longitude–time diagram of the MTD anomaly (m) (the MTD anomaly is obtained from the MOAA-GPV dataset) averaged for a zonal band of 30–34° N. Positive (negative) values represent deep (shallow) anomalies. (c) As in (b) but for the SSH anomaly (m) (steric height changes are removed). Solid (dashed) bars indicate stable (unstable) periods of the KE.
3.3 Decrease in the subduction rate and NPSTMW subduction variability
After formation of the low-PV water within the NPSTMW density range in winter, the new wintertime low-PV water mass is subsequently subducted into the ocean interior, forming NPSTMW in late winter and early spring. Figure 8 compares the patterns of the subduction rate between 2012–2015 and 2018–2021. The large subduction of NPSTMW usually occurs in the RG region south of the KE, as depicted in Fig. 8a. However, the total subduction rate of 2018–2021 reduced significantly in the RG region and even dropped by reaching 90 m yr−1 (Fig. 8c). Here, the subduction rate changes in 2018–2021 are predominantly caused by the temporal induction and lateral induction terms, while the vertical pumping term is negligible (Fig. 8d–f). The evident negative anomalies of temporal induction and lateral induction can be attributed to the anomalously shallow MLD located south of the KE (Fig. 9). The MLD in February–March in the RG region from individual Argo float profiles (Fig. 9d) is shown in the same way as in Fig. 9c: the MLD in 2018–2021 is anomalously shallower than 2012–2015 by approximately 50 m on average in a stable KE period. Additionally, it is interesting to note that the mean outcropping isopycnals in the NPSTMW density range had a clear northward movement in 2018–2021, compared to those that occurred in 2012–2015.
The tendency of temporal induction and lateral induction, both due to the MLD in late winter, is consistent with that of the total subduction (Fig. 10). The interannual variations in MLD in February to March (observed from individual Argo profiles; Fig. 9d) show a similar trend to the total subduction. Meanwhile, the spatial distribution of temporal induction anomalies between 2012–2015 and 2018–2021 (Fig. 8d) is also consistent with the wintertime MLD difference in Fig. 9c. In 2018–2021, the reduction in temporal induction and lateral induction, representing the effects of horizontal advection and the horizontal gradient of MLD in late winter, contributes most of the subduction weakening in the NPSTMW formation region. Thus, the weakening of the subduction rate in the NPSTMW formation region is mainly related to changes in local MLD in late winter, which is consistent with previous studies that suggested changes in the subtropical subduction rate in the North Pacific are mainly due to changes in the MLD variation in late winter (Qu and Chen, 2009; Hu et al., 2011; Wang et al., 2015). In 2018–2021, the decrease in NPSTMW subduction in the south of the KE region is mostly attributed to the lateral induction and temporal induction volume. Due to the anomalously shallow wintertime MLD, the subduction rate that occurred in the NPSTMW formation region dropped largely in 2018–2021. Consequently, the subduction volume of NPSTMW dropped from 5.60 × 10¹⁴ m3 in 2015 to 2.99 × 10¹⁴ m3 in 2021 (Fig. 10). Especially in 2018–2021, the total subduction volume of NPSTMW in the whole analysis region declined by 37 % on average relative to the values of 2012–2015.
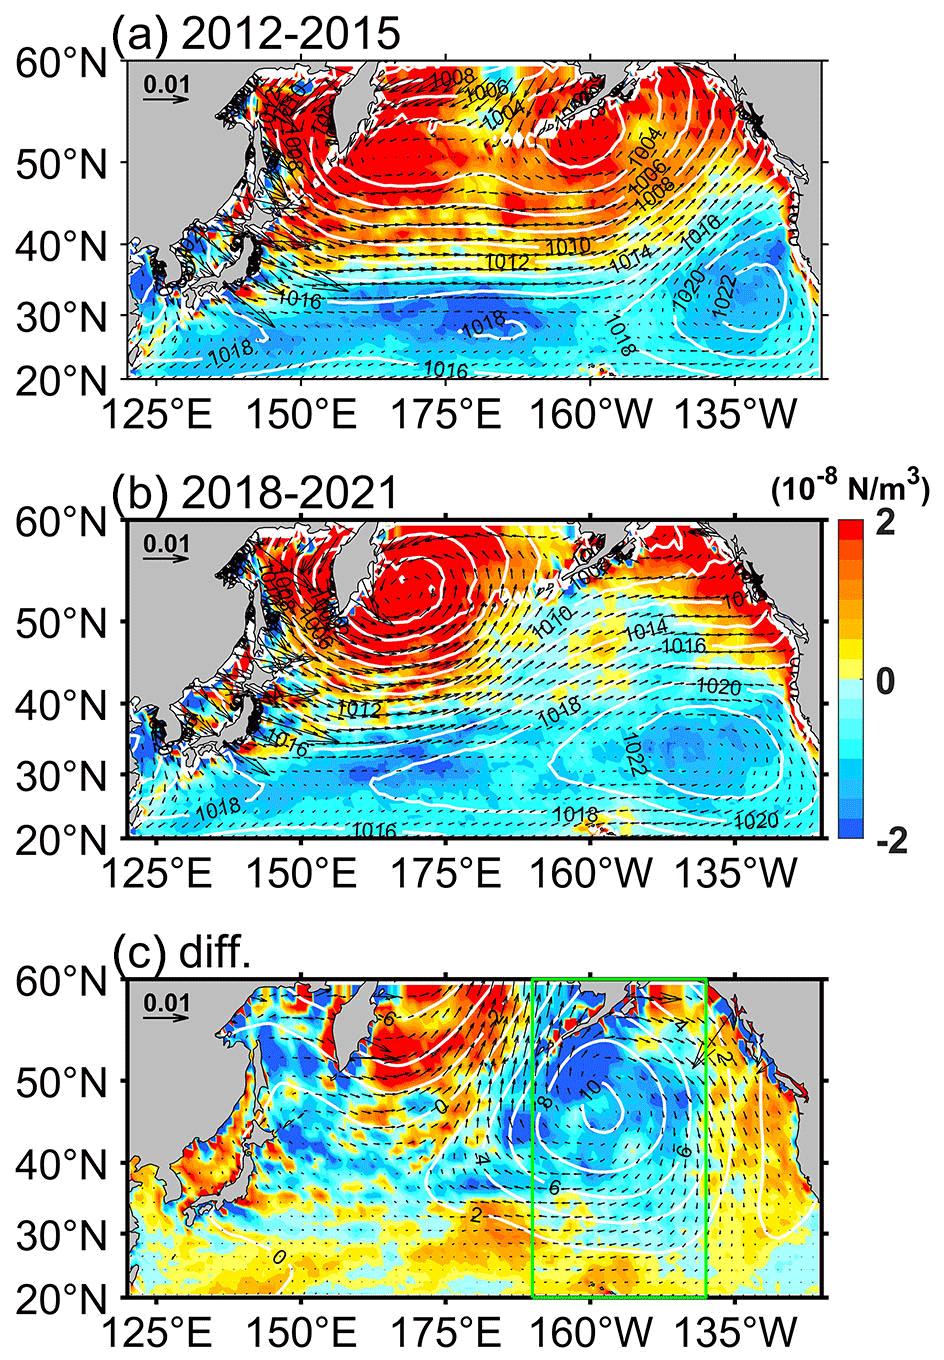
Figure 12The wintertime (January–March) surface wind stress (vectors; N m−2), SLP (white contours; hPa), and wind stress curl (color shading; N m−3) in the North Pacific Ocean from ERA5 in (a) 2012–2015 and (b) 2018–2021; (c) the difference between (b) and (a) (i.e., b minus a). The outcropping lines of σθ=25.0 kg m−3 (the southernmost one) and 25.5 kg m−3 (the northernmost one) are superimposed with solid black (2012–2015) and solid red (2018–2021) contours. The green box in (c) indicates the central North Pacific (140–170° W).
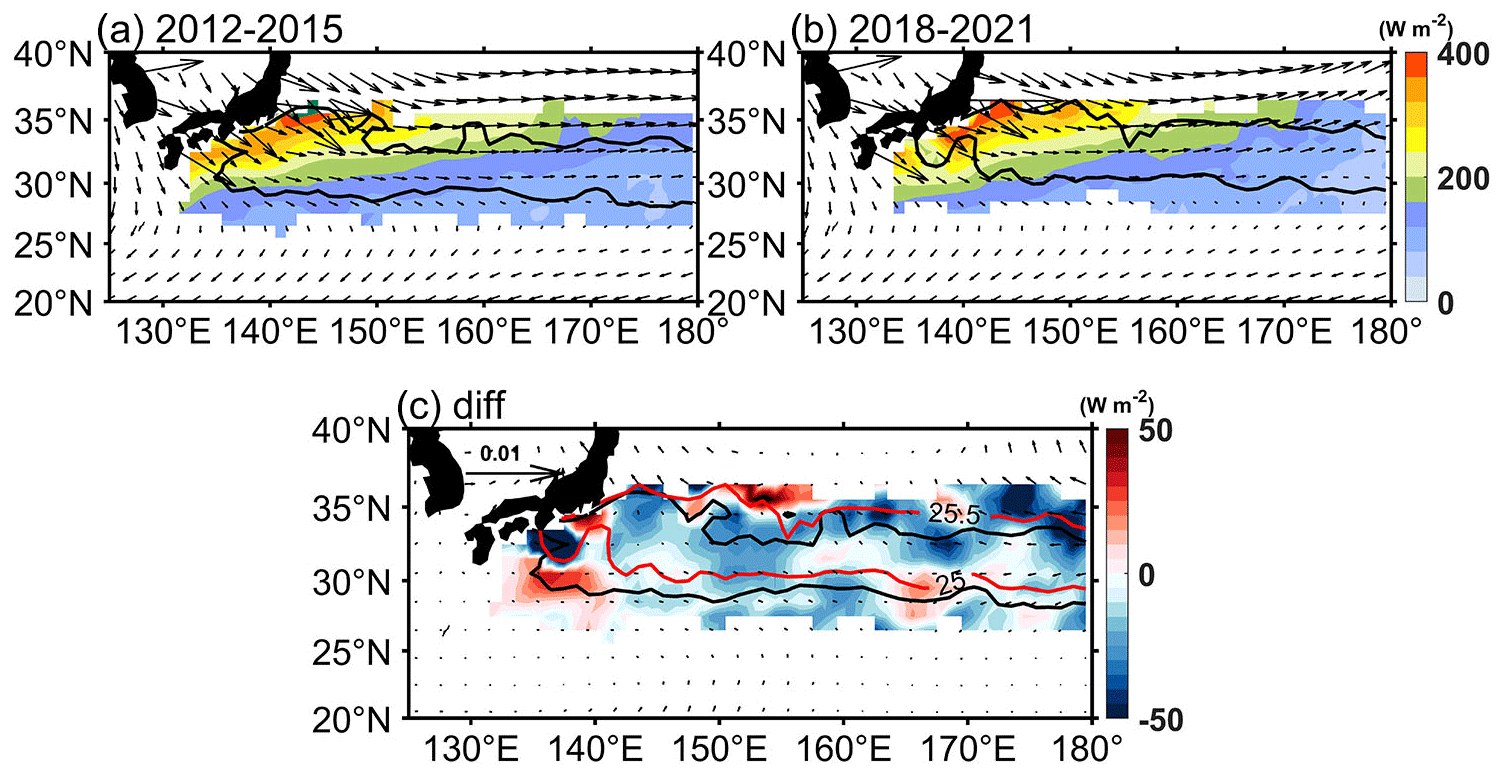
Figure 13The averaged −Qnet (W m−2) from ERA5 for the years (a) 2012–2015 and (b) 2018–2021 in winter. The solid lines bound the σθ=25.0–25.5 kg m−3 outcrop region, time-averaged from January–March. (c) The difference (the values of 2018–2021 minus those of 2012–2015) from ERA5 in the outcrop region between the wintertime −Qnet (W m−2) in 2018–2021 and that in 2012–2015 (positive values represent larger ocean heat loss). The outcropping lines of σθ=25.0 kg m−3 (the southernmost one) and 25.5 kg m−3 (the northernmost one) are superimposed with solid black (2012–2015) and solid red (2018–2021) contours. The wintertime surface wind stress (vectors; N m−2) and difference are also superimposed from ERA5.
3.4 Local and distant effects on NPSTMW properties
The air–sea heat exchange and the anomalously shallow wintertime MLD are both associated with the overlying atmosphere. In addition to the KE dynamic state change, the NPSTMW interannual variability has been closely tied to the basin-wide changes in both atmospheric forcing and oceanic preconditions associated with the PDO, in both observations (Qiu and Chen, 2006) and numerical model results (Davis et al., 2011). The NPSTMW volume variations in 2006–2009 (2012–2015) (Fig. 4a) are closely controlled by the MTD because the stronger (weaker) PDO-related subsurface stratification from the seasonal thermocline to the main thermocline propagated from the central North Pacific (Fig. 11). Meanwhile, Fig. 11 also shows the distant effects of MTD (i.e., subsurface stratification) change on NPSTMW formation in the western North Pacific with some time lag (about 3–4 years). Although the PDO is positive during 2014–2017, such signals of negative MTD, which propagate westward as oceanic Rossby waves, vanishingly affect the NPSTMW formation region due to the persistent strong sea surface warming (with a positive SSH anomaly as its proxy) in the NPSTMW formation region during 2018–2021 (Fig. 11). However, since 2018, the PDO has transitioned from a positive to negative phase (Fig. 11a), with a concomitant positive SSH anomaly and deepened MTD (Fig. 11b and c). The positive MTD anomaly, which weakens the background stratification, should have facilitated the development of wintertime MLD and NPSTMW formation, as suggested by that in 2012–2015. On the contrary, the MLD and the subduction of NPSTMW do not have such sufficient developments in the late winter of 2018–2021 (Figs. 8 and 9). Additionally, the recently anomalous NPSTMW decline also follows the PDO phase shift. Thus, the subtle time lag between the PDO shift and NPSTMW may have more important implications to investigate next.
Here, the dynamics and thermodynamics of anomalous NPSTMW variability in 2018–2021, particularly in the recently persistent stable KE state, are sought by examining wind stress and surface heat flux associated with an instantaneous response to events in the central Pacific (i.e., the PDO phase shift). The current stable KE state seems to have begun with the initiation of the LM (Qiu et al., 2020); it has also been supported by basin-wide wind forcing (Qiu et al., 2023). The dominant surface wind stress forcing in the midlatitude North Pacific basin is related to the PDO phases (Qiu et al., 2023). When the PDO phase turned from a positive into negative phase in 2018–2021, the AL shifted northward (Fig. 12a and b) and negative wind stress curl anomalies were generated in the central Pacific (Fig. 12c). The basin-scale atmospheric forcing has a remarkable influence on the subtropical gyre region (Fig. 13). It appears that the AL northward shift (Fig. 12) and subsequent changes in the intensity of westerlies correspond to the reduced NPSTMW formation in 2018–2021 compared with that in 2012–2015. The weaker westerlies in the NPSTMW formation area lead to less Ekman transport of the cold water from the north (Fig. 13). The averaged magnitude of southward meridional Ekman transport () that occurred in the NPSTMW formation region declined by 31 % during 2018–2021 relative to 2012–2015. The horizontal heat advection rate by the Ekman velocity correspondingly declined by 16 % during 2018–2021 relative to 2012–2015. The mean heat flux loss in the outcrop window during 2018–2021 decreased by 14 % relative to 2012–2015 (Fig. 13). During the time of 2018–2021, the weak surface heat flux loss may have been associated with the weak regional wind stress in winter (Fig. 13).
First, the recently observed NPSTMW volume loss appears to be closely related to the intensity of the prevailing westerlies during the period of PDO phase shift. During 2018–2021, the westerlies occur between 30 and 50° N, with the AL residing to the north over the subpolar gyre (Fig. 12c). The intensity of the westerlies weakens in the western part of the basin (Fig. 12). The northward shift of the westerlies causes a weaker wind to its south in the area of NPSTMW formation and subduction (Fig. 13c). Consequently in 2018–2021, a persistent weakening of the intensity of wintertime surface wind stress is led over the outcropping window (Fig. 13c). During the cold season, weakening of the overlying wind stress can subsequently prohibit the local heat loss in the NPSTMW formation region (Bond and Cronin, 2008). Meanwhile, the monthly time–depth sections of temperature and stratification () anomalies relative to the 2004–2021 climatology and MLD averaged within the ventilation region are indicated in Fig. 14. The intensified preconditioning of near-surface stratification (< 150 m) in the warm season since 2018 (Fig. 15) has increased due to the remarkable near-sea-surface warming (Fig. 14). This may further inhibit the necessary wintertime convection (i.e., the origin of the deep MLD in winter), essential for new NPSTMW formation in the following winter (Tomita et al., 2010).
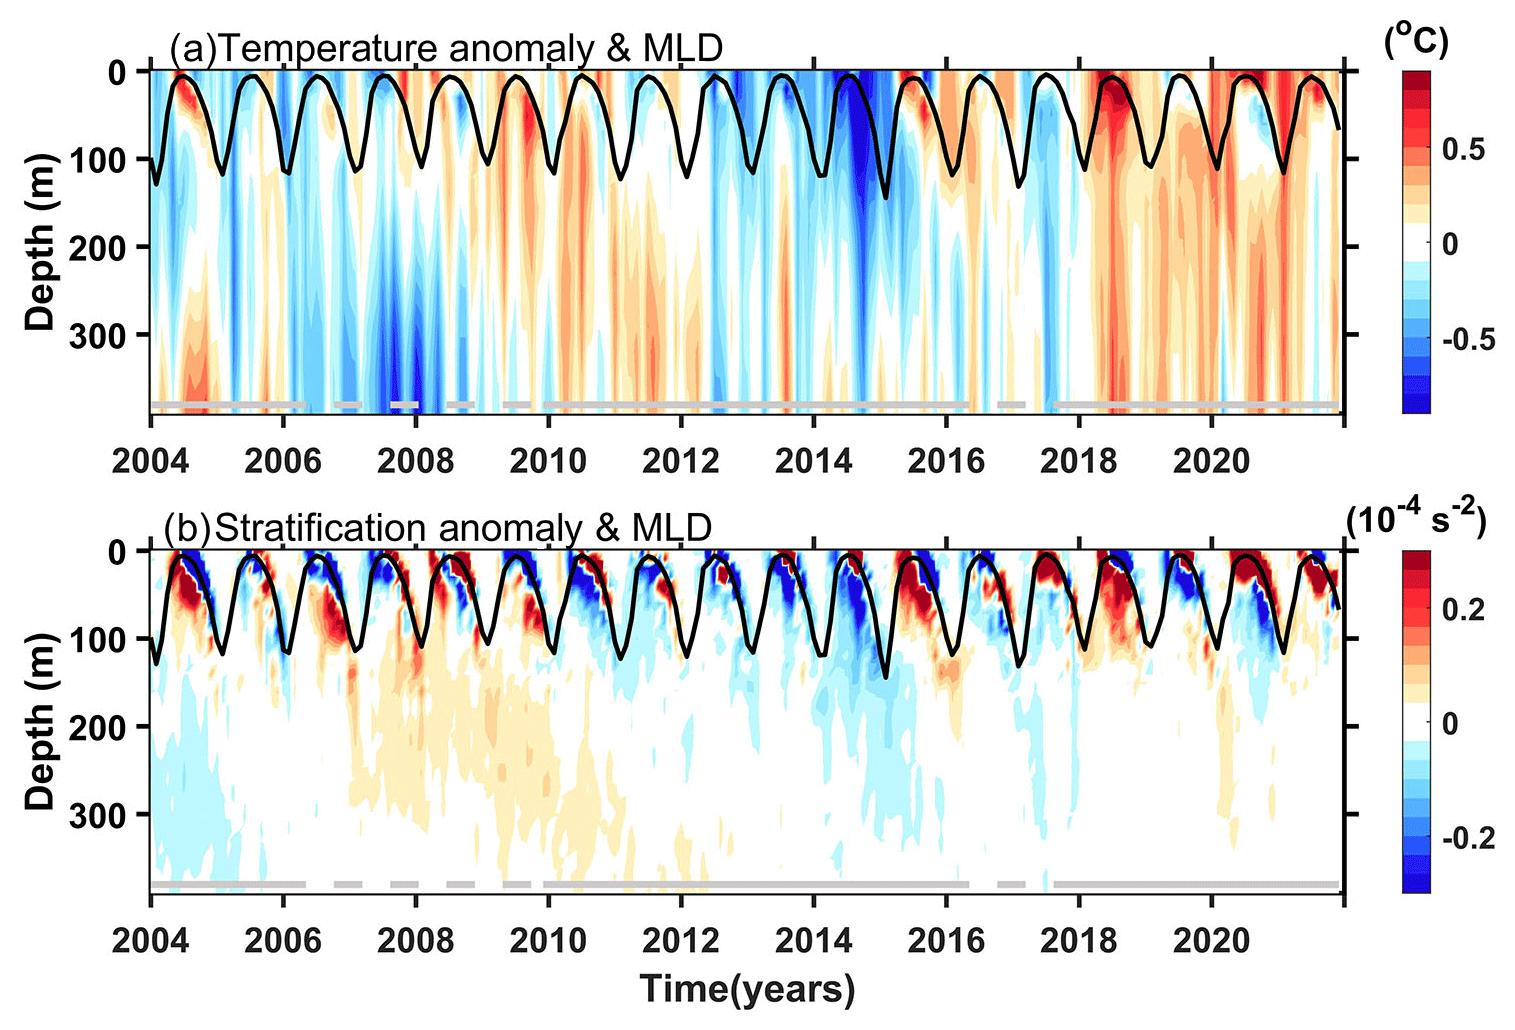
Figure 14Monthly time series of (a) the temperature anomaly (°C) relative to the 2004–2021 climatology and (b) the stratification anomaly (10−4 s−2) relative to the 2004–2021 climatology and MLD (black lines) obtained from RGA dataset averaged over the NPSTMW formation region. Solid (dashed) bars indicate stable (unstable) periods of the KE.
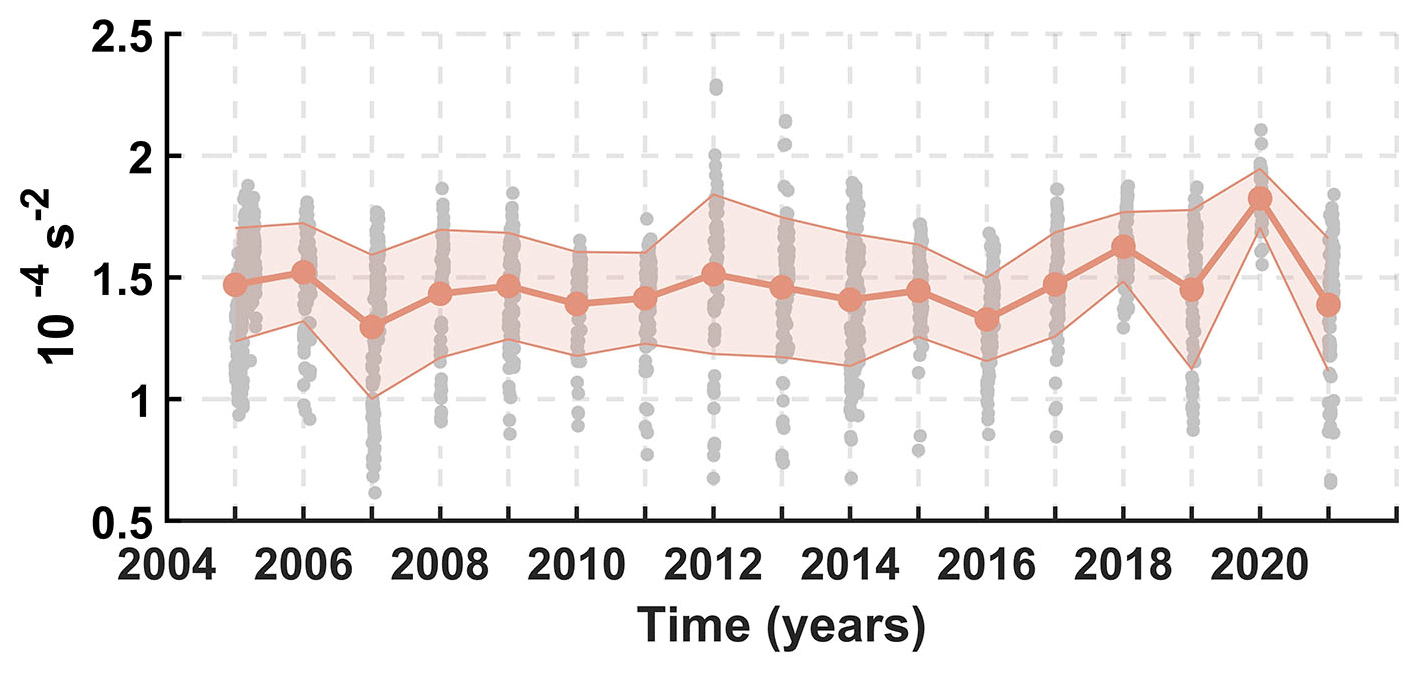
Figure 15The time series of near-surface (< 150 m) stratification during the warm season (July–September). Gray circles represent values observed from individual Argo profiles in the RG region. The line with circles represents mean values, and the shading around the line shows the standard deviation.
Indeed, as a result of the poleward shift of the westerlies, local easterly wind anomalies are shown over the NPSTMW formation region during the winter of 2018–2021 (Fig. 13c), which caused northward Ekman transport. The anomalous northward Ekman advection of the shallow ML with lighter densities would cause the northward migration of the NPSTMW outcropping lines (Fig. 16c). Thus, the suppressed local heat loss and northward migration of lighter densities from the south are coherent with the appearance of wintertime surface lighter-density water mass (Fig. 16).
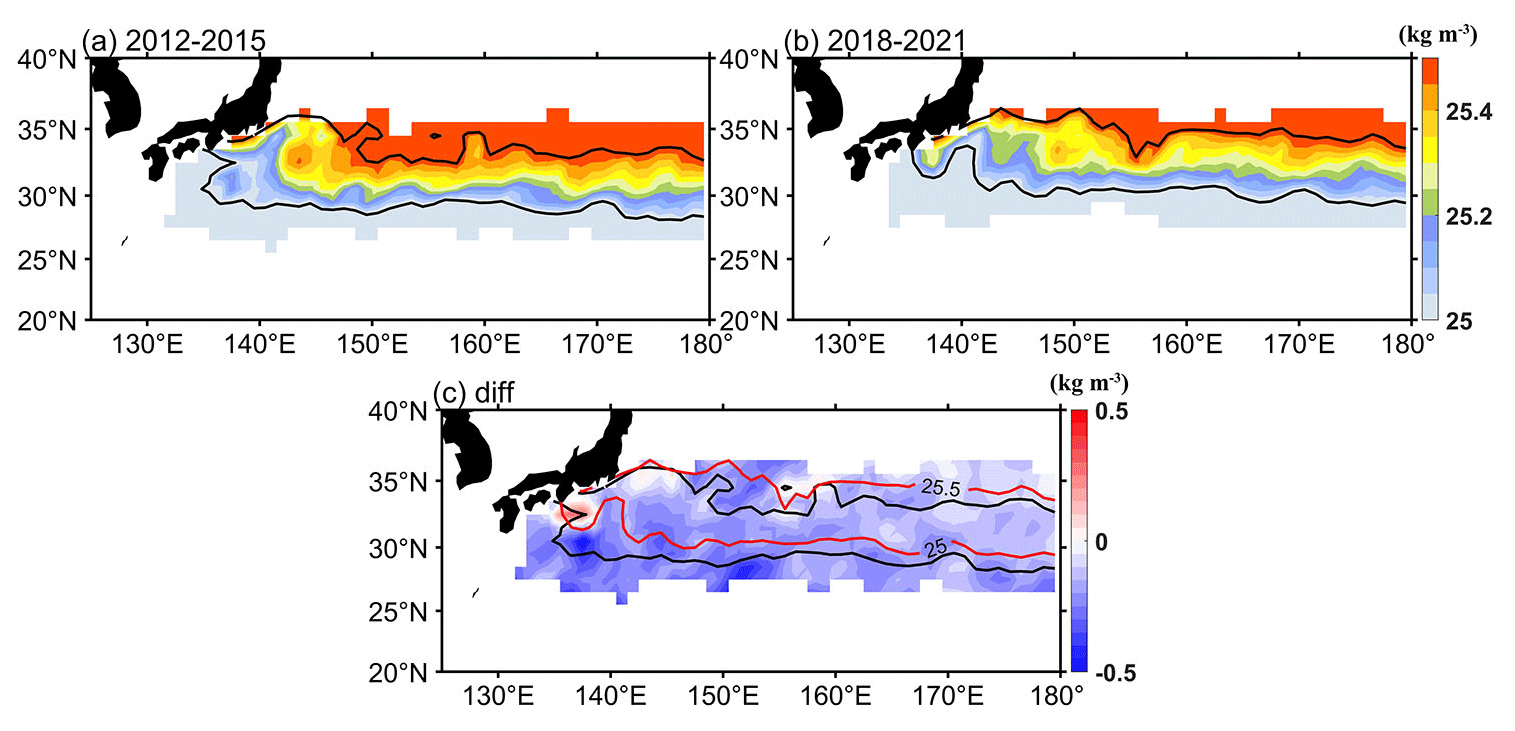
Figure 16The averaged surface potential density (kg m−3) for the years (a) 2012–2015 and (b) 2018–2021 in winter. The solid lines bound the σθ=25.0–25.5 kg m−3 outcrop region, time-averaged from January to March. (c) Anomalies of the surface potential density for the years 2018–2021, as a deviation from the wintertime mean (over 2012–2015) of the surface potential density, in kg m−3. The outcropping lines of σθ=25.0 and 25.5 kg m−3 are superimposed with solid black (2012–2015) and solid red (2018–2021) contours.
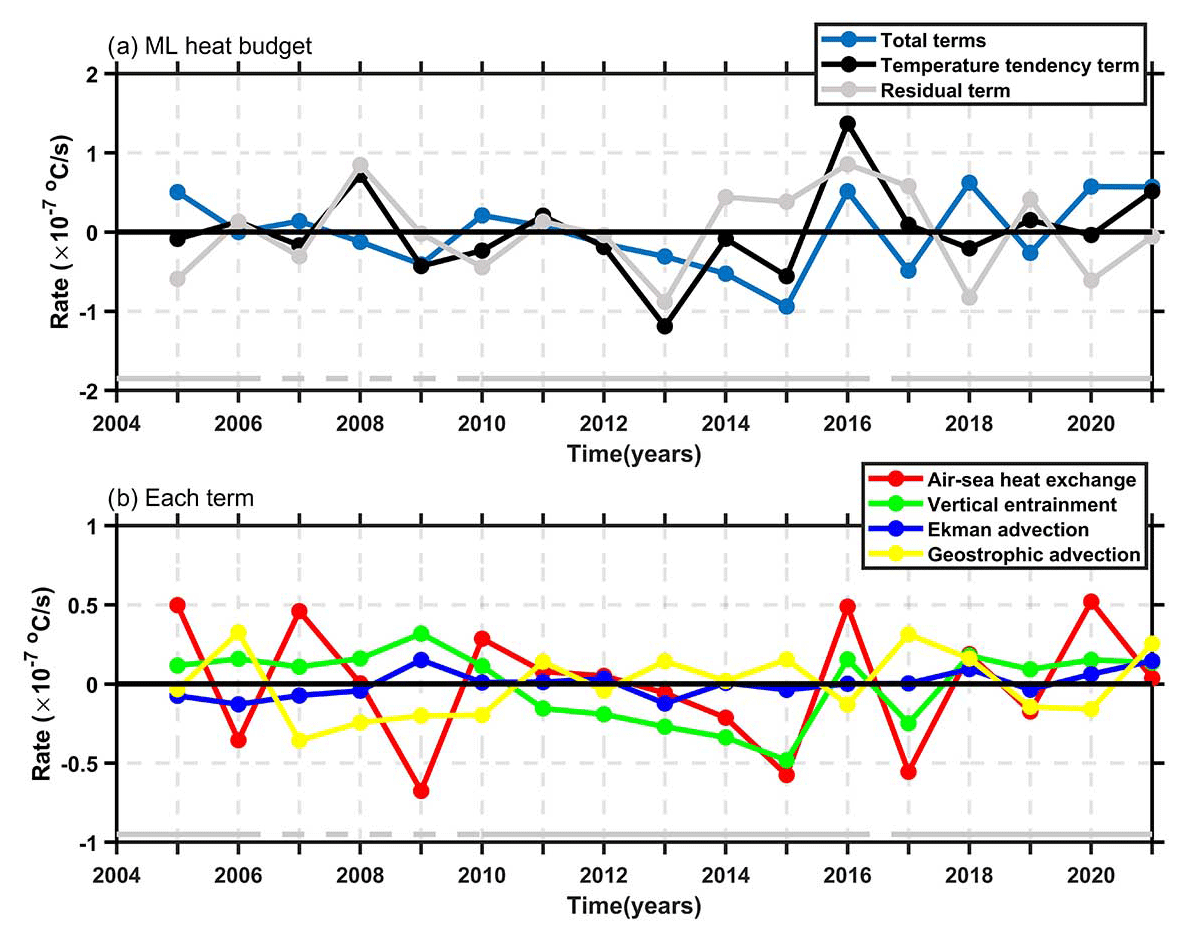
Figure 17Yearly time series of the anomaly of values (positive values indicate that the term increases MLT) relative to the 2004–2021 climatology from October of the previous year to March (cooling season) in Eq. (8) for (a) the temperature tendency term and residual term; in (a) total terms are represented as the sum of those shown in (b): the air–sea heat exchange term, the vertical entrainment term, the Ekman advection term, and the geostrophic advection term. Values are averaged in the wintertime ventilation region of 30–34° N, 141–180° E. Solid (dashed) bars indicate stable (unstable) periods of the KE.
Though the KE jet was in a persistent stable state during the recent time of 2018–2021, which is somewhat analogous to the stable KE state in 2012–2015, anomalous decreases in the NPSTMW volume and density in 2018–2021 have been observed from the Argo observation data. This is particularly pronounced in the subtropical RG region during winter and is most evident near the KE bounded by 30–34° N, 141–153° E. The mean NPSTMW volume dropped by ∼ 21 % during 2018–2021 relative to 2012–2015 in the whole NPSTMW formation region. The density decrease is presented as the loss of NPSTMW volume in the denser density range (approximately σθ> 25.2 kg m−3) since 2018.
Although the KE was in a persistent stable state in 2018–2021, the NPSTMW volume loss is found in an analysis period when the PDO changes from its positive phase to a negative phase. The correlation between NPSTMW volume variability and the PDO index suggests that the NPSTMW variability is link to the modulation of the basin-scale atmospheric forcing. We can be enlightened about how these mechanisms may play a role in interannual NPSTMW variability through an identification of analogous cases in preceding studies. Previous studies have linked the KE dynamic state changes to the basin-scale wind pattern. For more than 2 decades since 1993, the decadal variability in NPSTMW has been modulated by the decadal variability in the KE system associated with the PDO and the westward propagation of the MTD anomalies in the central North Pacific (Qiu and Chen, 2006; Rainville et al., 2014; Oka et al., 2015; Cerovečki and Giglio, 2016). However, the distant effect is the first baroclinic Rossby wave as the primary message of wind variability from the central Pacific to the NPSTMW formation region over a time lag of ∼ 4 years (Sugimoto and Hanawa, 2010). The variabilities in MTD anomalies and the KE state due to the PDO (a ∼ 4-year lag) correspond to the propagation speed of the first baroclinic Rossby wave. However, Davis et al. (2010) also demonstrated that an interannual signal of the NPSTMW volume variability is also correlated with the PDO with zero time, which implies the connection of NPSTMW to the basin-scale ocean circulation. With this, modulations of upper-ocean properties driven by the varying strength and the position of the westerlies as well as the regional air–sea heat flux pattern are recognized as the significant contributions to the variability in NPSTMW volume on interannual timescales. The results presented in this study show that there is no significant time lag of the distant effect between NPSTMW variability and the change in the basin-scale wind stress pattern (i.e., the PDO phase shift). Meanwhile, the current stable KE state seems to have begun with the initiation of the LM (Qiu et al., 2020); it has also been supported by basin-wide wind forcing (Qiu et al., 2023). This suggests that different mechanisms account for the recent NPSTMW decrease on interannual timescales, which resembles the theoretical framework in Davis et al. (2010) and not in Qiu and Chen (2006) and Sugimoto and Hanawa (2010). Over 2018–2021, the interannual signal was evident in the changes in NPSTMW volume and density and in outcropping isopycnals moving, with this signal determined by the yearly difference in NPSTMW formation and subduction. The distinct interannual signal of NPSTMW in 2018–2021 correlates well with PDO changes from a positive phase to a negative phase in recent years. This is supported by studies of the formation and subduction rate in the northwestern Pacific. In 2018–2021, the surface formation rate intensely declined upstream of the KE (141–153° E). Meanwhile, in 2018–2021 only the lighter variety of water in the NPSTMW density range was replenished by surface formation. The total subduction volume of NPSTMW in the ventilation region has subsequently declined by 37 % on average. Furthermore, the interannual variability in NPSTMW subduction is directly linked to the ML change. Such insufficient development of the wintertime ML in the ventilation region of the northwestern Pacific and decline in NPSTMW formation are associated with the lower heat loss and large-scale wind stress change in 2018–2021. This result is in agreement with the negative phase of the PDO shift studied here.
Although it occurs locally, interannual variability in NPSTMW is intensely associated with the shift in the basin-scale wind pattern. Based on this work, the dynamic impact of large-scale wind modification on the recent NPSTMW changes has been further examined. A scenario for these correlations of the physical causality is outlined as follows. (1) The northward shift of the westerlies with the PDO shift from a positive to a negative phase in 2018–2021 produced a weaker wintertime wind stress over the NPSTMW formation region, resulting in less heat loss to the atmosphere and shallower wintertime ML. Furthermore, the annual subduction dominated by lateral induction and temporal induction subsequently declined significantly, associated with the wintertime ML change. (2) The recent decrease in air–sea heat exchange acted to weaken the vertical mixing and decrease the MLD, resulting in the weakening of subduction. (3) The air–sea heat exchange and anomalously shallow wintertime MLD are both associated with the overlying atmosphere. As a result of the poleward shift of the westerlies, easterly wind anomalies in the NPSTMW formation region cause the northward Ekman transport of the shallower ML with lighter densities from the south. The significantly intensified preconditioning of near-surface stratification (< 150 m depth) associated with near-surface warming is also a relevant factor. This restrains wintertime convection and deepening of the ML, resulting in reduced transformation and formation of water in the NPSTMW density range. In addition, Wu et al. (2021) and Kawakami et al. (2023) have revealed that the northward KE shift was mostly caused by the trend of wind stress curl in the North Pacific during 1993–2021. The surface warming due to the northward KE shift may have inhibited the deepening of the ML south of the KE in the winter of 2018–2021. We thus perform heat budget analysis in the surface ocean ML (Fig. 17) based on Eq. (8): this counterbalanced result is basically consistent with that pointed out by Qiu and Kelly (1993), even though the residual term is generally larger than the tendency term for the period from 2018–2021. The residual term usually includes effects such as eddy heat flux and horizontal diffusion (Qiu and Kelly, 1993; Sugimoto and Kako, 2016). In this study, we mainly focus on each term that contributes to the total terms regardless of the residual term (Fig. 17b). The average of the temperature tendency anomaly during the cooling season (October of the previous year to March) of 2018–2021 is positive. It is contributed to by the air–sea heat exchange (38.0 %), the vertical entrainment through the base of the ML (37.0 %), the Ekman advection (17.6 %), and the geostrophic advection (7.4 %). This quantitative assessment further indicates that, in the NPSTMW formation region, the weak process of the vertical entrainment besides the weak air–sea heat exchange may intensify the ML warming and the shoaling of the local ML in winter, which in turn led to local subduction weakening during 2018–2021.
The salient contribution of this study is that it reveals that the anomalously decreasing NPSTMW in 2018–2021 was strongly associated with a response to a PDO-phase-shift event. We believe that the results of this study will be a step toward the deep understanding of the relationship between NPSTMW interannual variations and modulation of the basin-scale wind pattern in recent years. Owing to the wide range of NPSTMW influence, the present study may have broad implications for climate change and biogeochemical cycles (Holbrook et al., 2019; Kuroda and Setou, 2021; Tak et al., 2021).
The gridded Argo product was obtained from Roemmich-Gilson Argo Climatology (https://sio-argo.ucsd.edu/RG_Climatology.html, last access: 6 June 2024, Roemmich and Gilson, 2009; Argo, 2000). The monthly mean net heat flux, sea level pressure, and wind stress products were obtained from ECMWF ERA5 (https://doi.org/10.24381/cds.f17050d7, Hersbach et al., 2019). The sea surface height anomaly was provided by CMEMS (https://doi.org/10.48670/moi-00148, Global Ocean Gridded, 2023a, https://doi.org/10.48670/moi-00149, Global Ocean Gridded, 2023b).
The MOAA-GPV datasets were provided by the Japan Agency for Marine-Earth Science and Technology (https://www.jamstec.go.jp/argo_research/dataset/moaagpv/moaa_en.html, last access: 17 June 2024, Hosoda et al., 2008; Hosoda, 2007).
JS and CL planned the study. JS, CL, and YZG designed the analysis framework. JS processed data, conducted the analysis, and wrote the paper. JS and NZ collected the data. CL, YZG, FGZ, and PLL contributed with the analysis performance and interpretation of the results. JS and CL revised and edited the final version of the paper.
The contact author has declared that none of the authors has any competing interests.
Publisher’s note: Copernicus Publications remains neutral with regard to jurisdictional claims made in the text, published maps, institutional affiliations, or any other geographical representation in this paper. While Copernicus Publications makes every effort to include appropriate place names, the final responsibility lies with the authors.
The Argo program is part of the Global Ocean Observing System. These data were collected and made freely available by the international Argo program and the national programs that contribute to it (http://www.argo.ucsd.edu, last access: 17 June 2024; http://argo.jcommops.org, last access: 17 January 2020). Eitarou Oka, Fumiaki Kobashi, and the anonymous reviewer provided useful and constructive comments that improved the manuscript.
The work was jointly supported by the Hainan provincial joint project of Sanya Yazhou Bay Science And Technology City (grant no. 2021CXLH0020), National Natural Science Foundation of China (grant no. 42206003), and scientific and technological projects of Zhoushan (grant no. 2022C1004).
This paper was edited by Bernadette Sloyan and reviewed by Eitarou Oka, Fumiaki Kobashi, and one anonymous referee.
Akima, H.: A new method of interpolation and smooth curve fitting based on local procedures, J. ACM JACM, 17, 589–602, 1970.
Argo: Argo float data and metadata from Global Data Assembly Centre (Argo GDAC), SEANOE [data set], https://doi.org/10.17882/42182, 2000.
Bond, N. A. and Cronin, M. F.: Regional Weather Patterns during Anomalous Air–Sea Fluxes at the Kuroshio Extension Observatory (KEO), J. Clim., 21, 1680–1697, https://doi.org/10.1175/2007JCLI1797.1, 2008.
Cerovečki, I. and Giglio, D.: North Pacific Subtropical Mode Water Volume Decrease in 2006–09 Estimated from Argo Observations: Influence of Surface Formation and Basin-Scale Oceanic Variability, J. Clim., 29, 2177–2199, https://doi.org/10.1175/JCLI-D-15-0179.1, 2016.
Cerovečki, I. and Marshall, J.: Eddy modulation of air–sea interaction and convection, J. Phys. Oceanogr., 38, 65–83, 2008.
Cerovečki, I., Hendershott, M. C., and Yulaeva, E.: Strong North Pacific Subtropical Mode Water Volume and Density Decrease in Year 1999, J. Geophys. Res.-Ocean., 124, 6617–6631, https://doi.org/10.1029/2019JC014956, 2019.
Cushman-Roisin, B.: Subduction. Dynamics of the oceanic surface mixed layer: Proc. 'Aha Huliko'a Hawaiian winter Workshop, Vol. 181, p. 196, University of Hawaii at Manoa, 1987.
Davis, X. J., Rothstein, L. M., Dewar, W. K., and Menemenlis, D.: Numerical Investigations of Seasonal and Interannual Variability of North Pacific Subtropical Mode Water and Its Implications for Pacific Climate Variability, J. Clim., 24, 2648–2665, https://doi.org/10.1175/2010JCLI3435.1, 2011.
Garrett, C. and Tandon, A.: The effects on water mass formation of surface mixed layer timedependence and entrainment fluxes, Deep-Sea Res. Pt. I, 44, 1991–2006, 1997.
Global Ocean Gridded: Global Ocean Gridded L 4 Sea Surface Heights And Derived Variables Reprocessed 1993 Ongoing, E.U. Copernicus Marine Service Information (CMEMS), Marine Data Store (MDS) [data set], https://doi.org/10.48670/moi-00148, 2023a.
Global Ocean Gridded: Global Ocean Gridded L 4 Sea Surface Heights And Derived Variables Nrt, E.U. Copernicus Marine Service Information (CMEMS), Marine Data Store (MDS) [data set], https://doi.org/10.48670/moi-00149, 2023b.
Guo, Y., Lin, X., Wei, M., Liu, C., and Men, G.: Decadal Variability of North Pacific Eastern Subtropical Mode Water, J. Geophys. Res.-Ocean., 123, 6189–6206, https://doi.org/10.1029/2018JC013890, 2018.
Hanawa, K. and Kamada, J.: Variability of core layer temperature (CLT) of the North Pacific Subtropical Mode Water, Geophys. Res. Lett., 28, 2229–2232, https://doi.org/10.1029/2000GL011716, 2001.
Hanawa, K. and Sugimoto, S.: “Reemergence” areas of winter sea surface temperature anomalies in the world's oceans, Geophys. Res. Lett., 31, L10303, https://doi.org/10.1029/2004GL019904, 2004.
Hersbach, H., Bell, B., Berrisford, P., Biavati, G., Horányi, A., Muñoz Sabater, J., Nicolas, J., Peubey, C., Radu, R., Rozum, I., Schepers, D., Simmons, A., Soci, C., Dee, D., and Thépaut, J.-N.: ERA5 monthly averaged data on single levels from 1979 to present, Copernic. Clim. Change Serv. C3S Clim. Data Store CDS, 10, 252–266, 2019.
Holbrook, N. J., Scannell, H. A., Sen Gupta, A., Benthuysen, J. A., Feng, M., Oliver, E. C. J., Alexander, L. V., Burrows, M. T., Donat, M. G., Hobday, A. J., Moore, P. J., Perkins-Kirkpatrick, S. E., Smale, D. A., Straub, S. C., and Wernberg, T.: A global assessment of marine heatwaves and their drivers, Nat. Commun., 10, 2624, https://doi.org/10.1038/s41467-019-10206-z, 2019.
Hosoda, S.: Grid Point Value of the Monthly Objective Analysis using the Argo data, JAMSTEC [data set], https://doi.org/10.17596/0000102, 2007.
Hosoda, S., Ohira, T., and Nakamura, T.: A monthly mean dataset of global oceanic temperature and salinity derived from Argo float observations, JAMSTEC Rep. Res. Dev., 8, 47–59, 2008.
Hu, H., Liu, Q., Zhang, Y., and Liu, W.: Variability of subduction rates of the subtropical North Pacific mode waters, Chin. J. Oceanol. Limnol., 29, 1131–1141, 2011.
Kawakami, Y., Nakano, H., Urakawa, L. S., Toyoda, T., Aoki, K., and Usui, N.: Northward shift of the Kuroshio Extension during 1993–2021, Sci. Rep., 13, 16223, https://doi.org/10.1038/s41598-023-43009-w, 2023.
Kuroda, H. and Setou, T.: Extensive Marine Heatwaves at the Sea Surface in the Northwestern Pacific Ocean in Summer 2021, Remote Sens., 13, 3989, https://doi.org/10.3390/rs13193989, 2021.
Levitus, S.: Climatological atlas of the world ocean, p. 173, US Government Printing Office, NOAA professional paper 13, 1982.
Liu, C., Xie, S., Li, P., Xu, L., and Gao, W.: Climatology and decadal variations in multicore structure of the North Pacific subtropical mode water, J. Geophys. Res.-Ocean., 122, 7506–7520, https://doi.org/10.1002/2017JC013071, 2017.
Mantua, N.: The Pacific Decadal Oscillation: a brief overview for non-specialists, Encycl. Environ. Change, Joint Institute for the Study of the Atmosphere and Oceans University of Washington, Seattle, Washington, USA, 1999.
Marshall, D.: Subduction of water masses in an eddying ocean, J. Mar. Res., 55, 201–222, https://doi.org/10.1357/0022240973224373, 1997.
Marshall, J., Jamous, D., and Nilsson, J.: Reconciling thermodynamic and dynamic methods of computation of water-mass transformation rates, Deep-Sea Res. Pt. I, 46, 545–572, https://doi.org/10.1016/S0967-0637(98)00082-X, 1999.
Masuzawa, J.: Subtropical mode water, Deep-Sea Res. Oceanogr. Abstr., 16, 463–468, https://doi.org/10.1016/0011-7471(69)90034-5, 1969.
Newman, M., Alexander, M. A., Ault, T. R., Cobb, K. M., Deser, C., Di Lorenzo, E., Mantua, N. J., Miller, A. J., Minobe, S., Nakamura, H., Schneider, N., Vimont, D. J., Phillips, A. S., Scott, J. D., and Smith, C. A.: The Pacific Decadal Oscillation, Revisited, J. Clim., 29, 4399–4427, https://doi.org/10.1175/JCLI-D-15-0508.1, 2016.
Nishikawa, S., Tsujino, H., Sakamoto, K., and Nakano, H.: Diagnosis of water mass transformation and formation rates in a high-resolution GCM of the North Pacific: DIAGNOSIS OF WATER MASS TRANSFORMATION, J. Geophys. Res.-Ocean., 118, 1051–1069, https://doi.org/10.1029/2012JC008116, 2013.
Oka, E. and Qiu, B.: Progress of North Pacific mode water research in the past decade, J. Oceanogr., 68, 5–20, https://doi.org/10.1007/s10872-011-0032-5, 2012.
Oka, E., Talley, L. D., and Suga, T.: Temporal variability of winter mixed layer in the mid-to high-latitude North Pacific, J. Oceanogr., 63, 293–307, https://doi.org/10.1007/s10872-007-0029-2, 2007.
Oka, E., Suga, T., Sukigara, C., Toyama, K., Shimada, K., and Yoshida, J.: “Eddy Resolving” Observation of the North Pacific Subtropical Mode Water, J. Phys. Oceanogr., 41, 666–681, https://doi.org/10.1175/2011JPO4501.1, 2011.
Oka, E., Qiu, B., Takatani, Y., Enyo, K., Sasano, D., Kosugi, N., Ishii, M., Nakano, T., and Suga, T.: Decadal variability of Subtropical Mode Water subduction and its impact on biogeochemistry, J. Oceanogr., 71, 389–400, https://doi.org/10.1007/s10872-015-0300-x, 2015.
Oka, E., Yamada, K., Sasano, D., Enyo, K., Nakano, T., and Ishii, M.: Remotely Forced Decadal Physical and Biogeochemical Variability of North Pacific Subtropical Mode Water Over the Last 40 Years, Geophys. Res. Lett., 46, 1555–1561, https://doi.org/10.1029/2018GL081330, 2019.
Oka, E., Nishikawa, H., Sugimoto, S., Qiu, B., and Schneider, N.: Subtropical Mode Water in a recent persisting Kuroshio large-meander period: Part I – formation and advection over the entire distribution region, J. Oceanogr., 77, 781–795, 2021.
Qiu, B.: Interannual variability of the Kuroshio Extension system and its impact on the wintertime SST field, J. Phys. Oceanogr., 30, 1486–1502, 2000.
Qiu, B.: Kuroshio Extension Variability and Forcing of the Paci?c Decadal Oscillations: Responses and Potential Feedback, J. Phys. Oceanogr., 33, 2465–2482, https://doi.org/10.1175/1520-0485(2003)033<2465:KEVAFO>2.0.CO;2, 2003.
Qiu, B. and Chen, S.: Variability of the Kuroshio Extension Jet, Recirculation Gyre, and Mesoscale Eddies on Decadal Time Scales, J. Phys. Oceanogr., 35, 2090–2103, https://doi.org/10.1175/JPO2807.1, 2005.
Qiu, B. and Chen, S.: Decadal Variability in the Formation of the North Pacific Subtropical Mode Water: Oceanic versus Atmospheric Control, J. Phys. Oceanogr., 36, 1365–1380, https://doi.org/10.1175/JPO2918.1, 2006.
Qiu, B. and Chen, S.: Revisit of the occurrence of the Kuroshio large meander South of Japan, J. Phys. Oceanogr., 51, 3679–3694, 2021.
Qiu, B. and Kelly, K. A.: Upper-ocean heat balance in the Kuroshio Extension region, J. Phys. Oceanogr., 23, 2027–2041, 1993.
Qiu, B., Hacker, P., Chen, S., Donohue, K. A., Watts, D. R., Mitsudera, H., Hogg, N. G., and Jayne, S. R.: Observations of the Subtropical Mode Water Evolution from the Kuroshio Extension System Study, J. Phys. Oceanogr., 36, 457–473, https://doi.org/10.1175/JPO2849.1, 2006.
Qiu, B., Chen, S., and Hacker, P.: Effect of Mesoscale Eddies on Subtropical Mode Water Variability from the Kuroshio Extension System Study (KESS), J. Phys. Oceanogr., 37, 982–1000, https://doi.org/10.1175/JPO3097.1, 2007.
Qiu, B., Chen, S., Schneider, N., Oka, E., and Sugimoto, S.: On the reset of the wind-forced decadal Kuroshio Extension variability in late 2017, J. Clim., 33, 10813–10828, 2020.
Qiu, B., Chen, S., and Oka, E.: Why did the 2017 Kuroshio large meander event become the longest in the Past 70 years?, Geophys. Res. Lett., 50, e2023GL103548, https://doi.org/10.1029/2023GL103548, 2023.
Qu, T. and Chen, J.: A North Pacific decadal variability in subduction rate, Geophys. Res. Lett., 36, L22602, https://doi.org/10.1029/2009GL040914, 2009.
Rainville, L., Jayne, S. R., McClean, J. L., and Maltrud, M. E.: Formation of Subtropical Mode Water in a high-resolution ocean simulation of the Kuroshio Extension region, Ocean Model., 17, 338–356, https://doi.org/10.1016/j.ocemod.2007.03.002, 2007.
Rainville, L., Jayne, S. R., and Cronin, M. F.: Variations of the North Pacific Subtropical Mode Water from Direct Observations, J. Clim., 27, 2842–2860, https://doi.org/10.1175/JCLI-D-13-00227.1, 2014.
Roemmich, D. and Gilson, J.: The 2004–2008 mean and annual cycle of temperature, salinity, and steric height in the global ocean from the Argo Program, Prog. Oceanogr., 82, 81–100, 2009.
Sasaki, Y. N. and Minobe, S.: Climatological mean features and interannual to decadal variability of ring formations in the Kuroshio Extension region, J. Oceanogr., 71, 499–509, https://doi.org/10.1007/s10872-014-0270-4, 2015.
Small, R. J., Bryan, F. O., and Bishop, S. P.: Surface Water Mass Transformation in the Southern Ocean: The Role of Eddies Revisited, J. Phys. Oceanogr., 52, 789–804, https://doi.org/10.1175/JPO-D-21-0087.1, 2022.
Stammer, D.: Steric and wind-induced changes in TOPEX/POSEIDON large-scale sea surface topography observations, J. Geophys. Res.-Ocean., 102, 20987–21009, 1997.
Suga, T. and Hanawa, K.: The mixed-layer climatology in the northwestern part of the North Pacific subtropical gyre and the formation area of Subtropical Mode Water, J. Mar. Res., 48, 543–566, 1990.
Suga, T. and Hanawa, K.: Interannual variations of North Pacific subtropical mode water in the 137° E section, J. Phys. Oceanogr., 25, 1012–1017, 1995.
Suga, T., Hanawa, K., and Toba, Y.: Subtropical mode water in the 137 E section, J. Phys. Oceanogr., 19, 1605–1618, 1989.
Sugimoto, S. and Hanawa, K.: Remote reemergence areas of winter sea surface temperature anomalies in the North Pacific, Geophys. Res. Lett., 32, L01606, https://doi.org/10.1029/2004GL021410, 2005.
Sugimoto, S. and Hanawa, K.: Impact of Aleutian Low activity on the STMW formation in the Kuroshio recirculation gyre region: IMPACT OF AL ON THE STMW FORMATION, Geophys. Res. Lett., 37, L03606, https://doi.org/10.1029/2009GL041795, 2010.
Sugimoto, S. and Kako, S.: Decadal Variation in Winter Mixed Layer Depth South of the Kuroshio Extension and Its Influence on Winter Mixed Layer Temperature, J. Clim., 29, 1237–1252, https://doi.org/10.1175/JCLI-D-15-0206.1, 2016.
Tak, Y.-J., Song, H., and Cho, Y.-K.: Impact of the reemergence of North Pacific subtropical mode water on the multi-year modulation of marine heatwaves in the North Pacific Ocean during winter and early spring, Environ. Res. Lett., 16, 074036, https://doi.org/10.1088/1748-9326/ac0cad, 2021.
Taneda, T., Suga, T., and Hanawa, K.: Subtropical mode water variation in the northwestern part of the North Pacific subtropical gyre, J. Geophys. Res.-Ocean., 105, 19591–19598, https://doi.org/10.1029/2000JC900073, 2000.
Tomita, H., Kako, S., Cronin, M. F., and Kubota, M.: Preconditioning of the wintertime mixed layer at the Kuroshio Extension Observatory, J. Geophys. Res.-Ocean., 115, 2010JC006373, https://doi.org/10.1029/2010JC006373, 2010.
Toyama, K., Iwasaki, A., and Suga, T.: Interannual Variation of Annual Subduction Rate in the North Pacific Estimated from a Gridded Argo Product, J. Phys. Oceanogr., 45, 2276–2293, https://doi.org/10.1175/JPO-D-14-0223.1, 2015.
Uehara, H., Suga, T., Hanawa, K., and Shikama, N.: A role of eddies in formation and transport of North Pacific Subtropical Mode Water: MESOSCALE EDDIES AND NPSTMW, Geophys. Res. Lett., 30, 1705, https://doi.org/10.1029/2003GL017542, 2003.
Usui, N.: Progress of Studies on Kuroshio Path Variations South of Japan in the Past Decade, in: Geophysical Monograph Series, edited by: Nagai, T., Saito, H., Suzuki, K., and Takahashi, M., Wiley, 147–161, https://doi.org/10.1002/9781119428428.ch9, 2019.
Vivier, F., Kelly, K. A., and Thompson, L.: Contributions of wind forcing, waves, and surface heating to sea surface height observations in the Pacific Ocean, J. Geophys. Res.-Ocean., 104, 20767–20788, 1999.
Walin, G.: On the relation between sea-surface heat flow and thermal circulation in the ocean, Tellus, 34, 187–195, https://doi.org/10.1111/j.2153-3490.1982.tb01806.x, 1982.
Wang, R., Yu, F., and Nan, F.: Weakening of subduction in the Subtropical Mode Water formation region observed during 2003–2013, J. Geophys. Res.-Ocean., 120, 7271–7281, 2015.
Williams, R. G.: The influence of air–sea interaction on the ventilated thermocline, J. Phys. Oceanogr., 19, 1255–1267, 1989.
Williams, R. G.: The role of the mixed layer in setting the potential vorticity of the main thermocline, J. Phys. Oceanogr., 21, 1803–1814, 1991.
Wu, B., Lin, X., and Yu, L.: North Pacific subtropical mode water is controlled by the Atlantic Multidecadal Variability, Nat. Clim. Change, 10, 238–243, https://doi.org/10.1038/s41558-020-0692-5, 2020.
Wu, B., Lin, X., and Yu, L.: Poleward Shift of the Kuroshio Extension Front and Its Impact on the North Pacific Subtropical Mode Water in the Recent Decades, J. Phys. Oceanogr., 51, 457–474, https://doi.org/10.1175/JPO-D-20-0088.1, 2021.
Xu, L., Wang, K., and Wu, B.: Weakening and Poleward Shifting of the North Pacific Subtropical Fronts from 1980 to 2018, J. Phys. Oceanogr., 52, 399–417, https://doi.org/10.1175/JPO-D-21-0170.1, 2022.