the Creative Commons Attribution 4.0 License.
the Creative Commons Attribution 4.0 License.
 | 18 Jun 2024
Observed change and the extent of coherence in the Gulf Stream system
Tor Eldevik
Johanne Skrefsrud
Helen L. Johnson
Alejandra Sanchez-Franks
By transporting warm and salty water poleward, the Gulf Stream system maintains a mild climate in northwestern Europe while also facilitating the dense water formation that feeds the deep ocean. The sensitivity of North Atlantic circulation to future greenhouse gas emissions seen in climate models has prompted an increasing effort to monitor the various ocean circulation components in recent decades. Here, we synthesize available ocean transport measurements from several observational programs in the North Atlantic and Nordic Seas, as well as an ocean state estimate (ECCOv4-r4), for an enhanced understanding of the Gulf Stream and its poleward extensions as an interconnected circulation system. We see limited coherent variability between the records on interannual timescales, highlighting the local oceanic response to atmospheric circulation patterns and variable recirculation timescales within the gyres. On decadal timescales, we find a weakening subtropical circulation between the mid-2000s and mid-2010s, while the inflow and circulation in the Nordic Seas remained stable. Differing decadal trends in the subtropics, subpolar North Atlantic, and Nordic Seas warrant caution in using observational records at a single latitude to infer large-scale circulation change.
- Article
(7999 KB) - Full-text XML
-
Supplement
(3225 KB) - BibTeX
- EndNote


The steady supply of warm Gulf Stream water from the subtropics to subpolar latitudes is crucial for maintaining a mild, maritime climate in northwestern Europe (Kwon et al., 2010; Palter, 2015). Projected slowdown of the North Atlantic circulation as a response to global warming (e.g., Manabe and Stouffer, 1994; Weijer et al., 2020; Sen Gupta et al., 2021) has therefore motivated extensive observational efforts to monitor and understand variability and potential future change (Cunningham et al., 2007; Mercier et al., 2015; Lozier et al., 2017; Østerhus et al., 2019; Rhein et al., 2019). Inferences about large-scale circulation change are typically made based on observing systems measuring circulation strength at carefully selected fixed locations. However, it remains unclear to what extent, and on which timescales, the extended Gulf Stream system should be considered a meridionally coherent circulation system. Here, we use North Atlantic and Nordic Seas ocean transport measurement records to investigate meridional coherence, interannual variability, and potential trends within the Gulf Stream system.
As a narrow western boundary current, the Gulf Stream is a part of the subtropical gyre (Fig. 1a). At approximately 35° N, the Gulf Stream separates from the coast and broadens, reaching a maximum of around 150 Sv (sverdrup) at 60° W (Hogg, 1992). The North Atlantic Current continues as the northeastward extension of the Gulf Stream past the Grand Banks, transporting roughly 27 Sv into the eastern subpolar North Atlantic (Roessler et al., 2015). Substantial subtropical and subpolar recirculation characterizes the North Atlantic circulation (e.g., Daniault et al., 2016). Still, almost 2 / 3 of the waters flowing across the Greenland-Scotland Ridge into the Nordic Seas come from the Gulf Stream (Asbjørnsen et al., 2021), highlighting the direct connection between the Gulf Stream and the Atlantic water ultimately reaching the Arctic via the Norwegian Atlantic Current. Here, we consider the North Atlantic Current and the Norwegian Atlantic Current as part of the “Gulf Stream system” but retain the terminology “the Gulf Stream” for the boundary current along the North American coast.
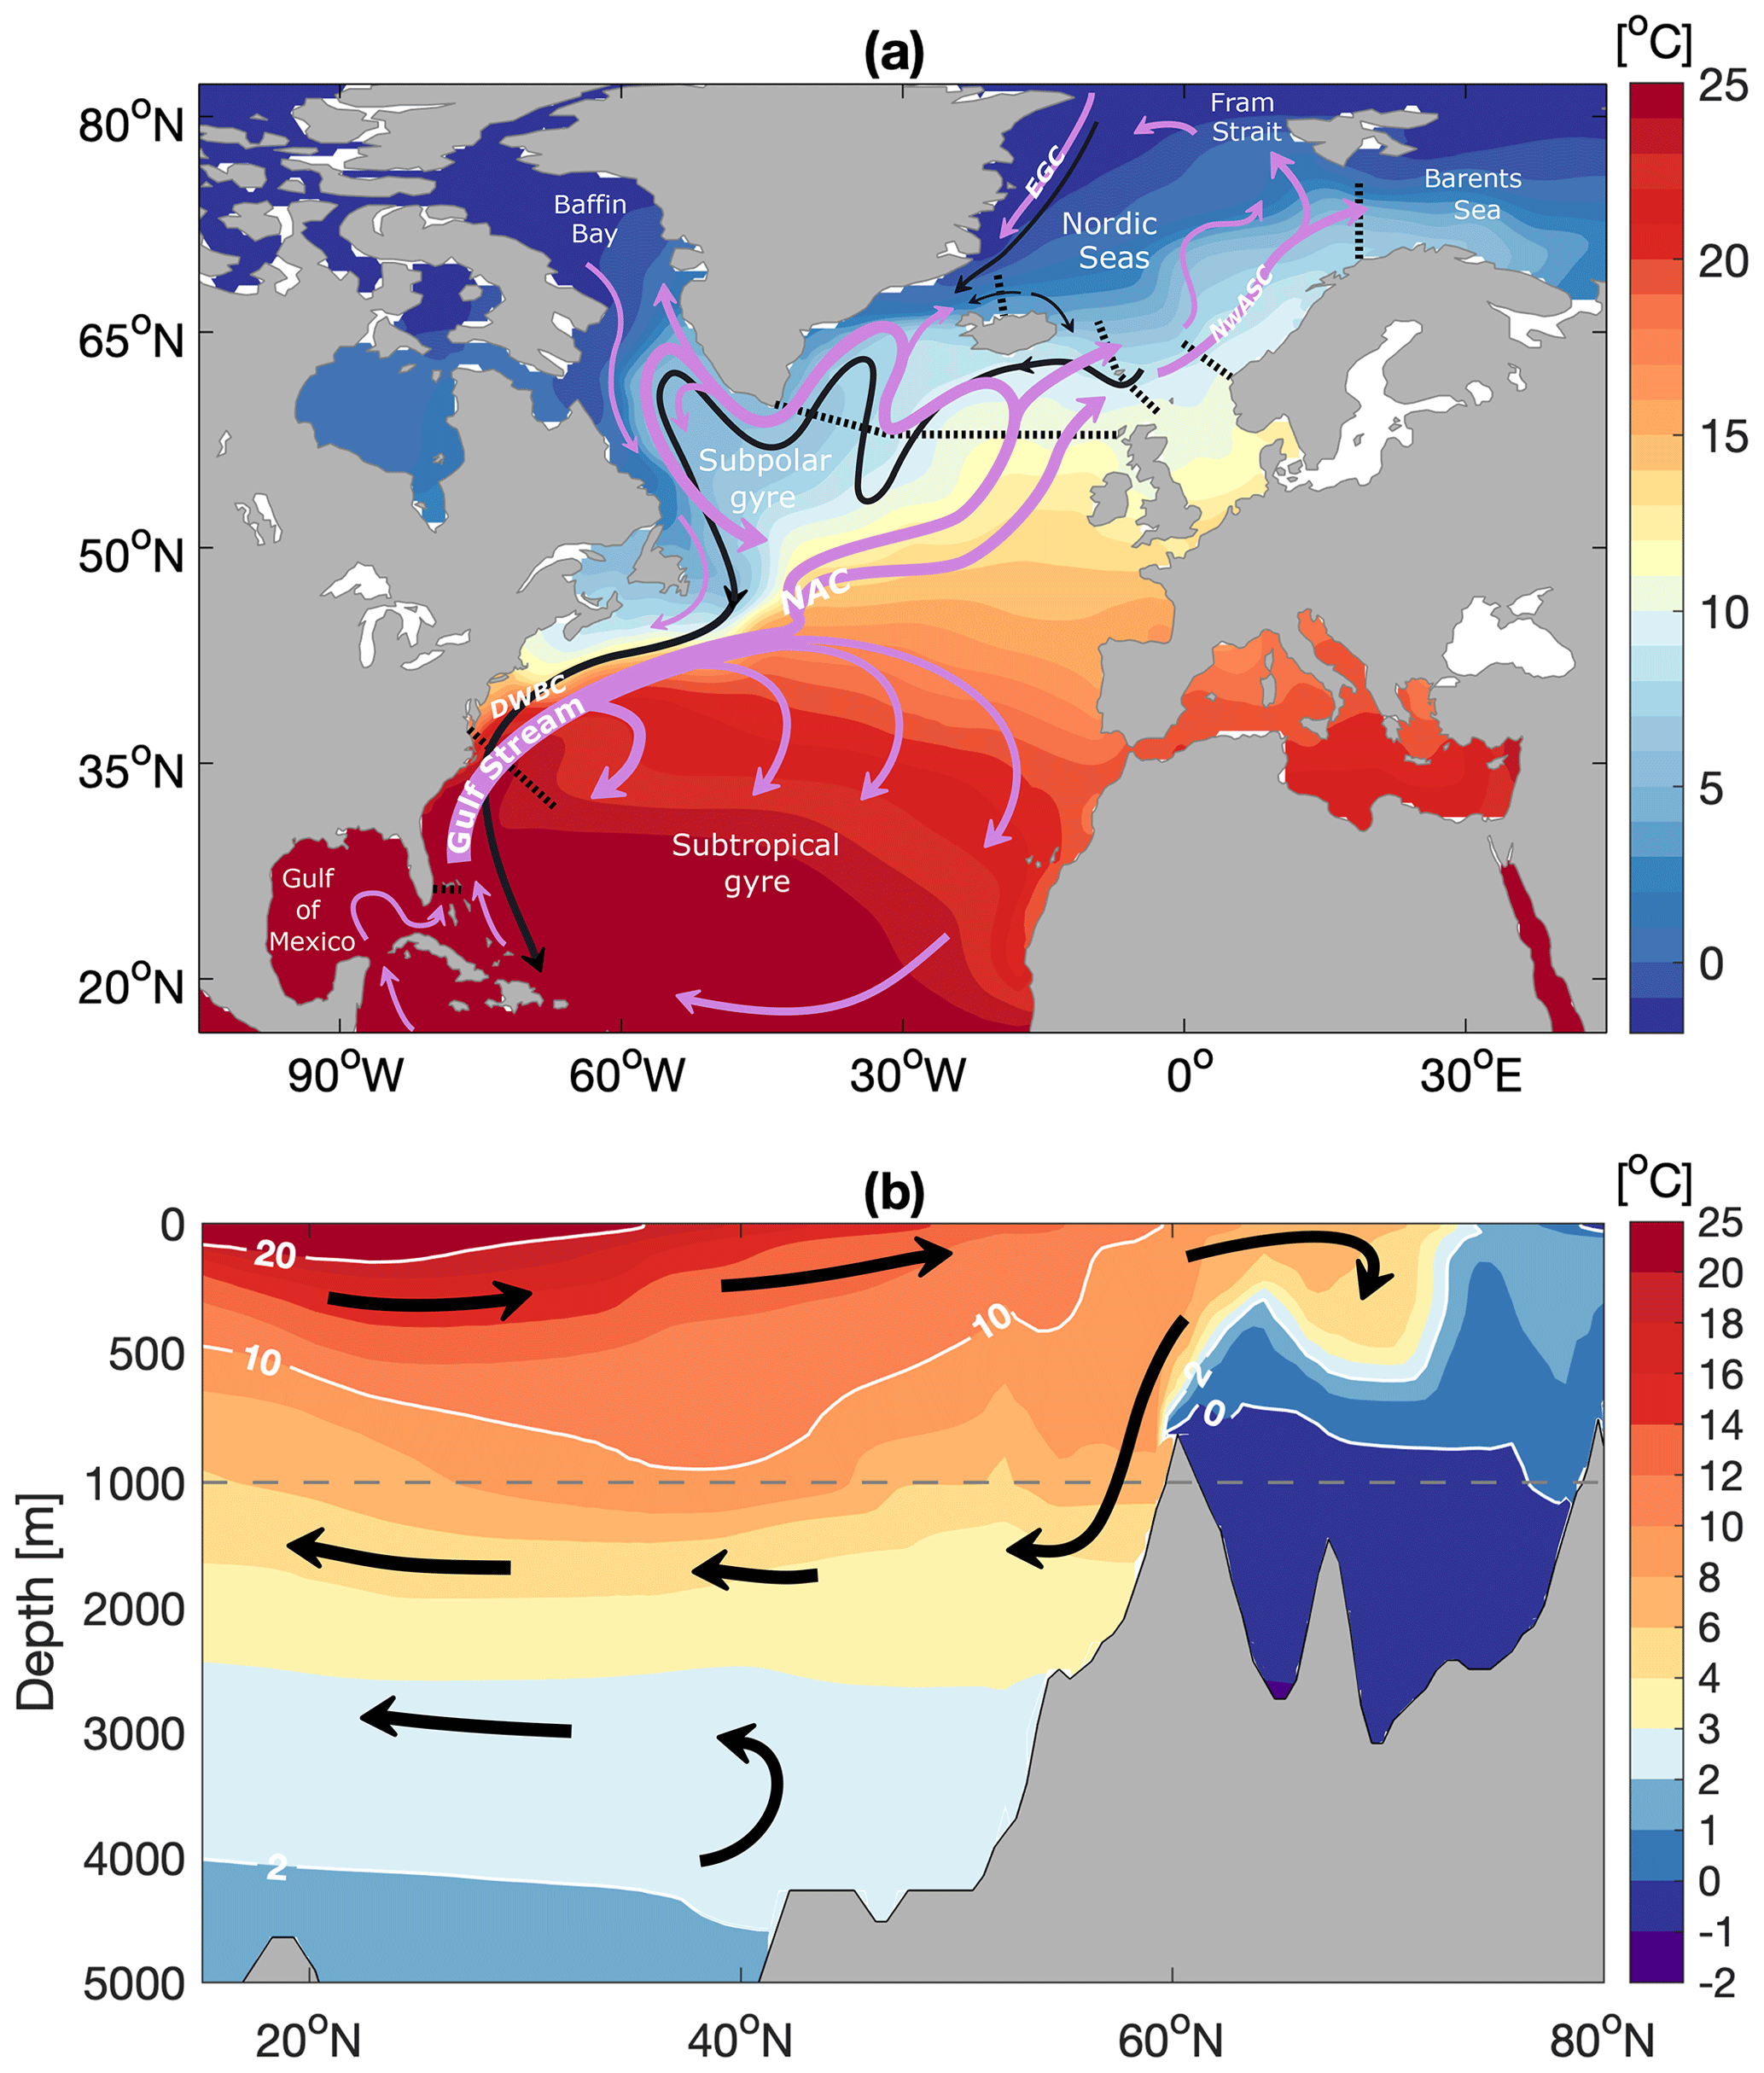
Figure 1Main North Atlantic and Nordic Seas circulation features. Climatological potential temperature from the ECCOv4 ocean state estimate (1992–2017) with major circulation features indicated with arrows. (a) The horizontal view; purple and black arrows indicate upper-ocean and deep-ocean circulation, respectively (DWBC; Deep Western Boundary Current, NAC; North Atlantic Current, NwASC; Norwegian Atlantic Slope Current, EGC; East Greenland Current). (b) The vertical view; transect follows the WOCE A16 section until 52° N, from where it veers into the Nordic Seas over the Iceland-Scotland Ridge and toward the Fram Strait. In panel (a) the dashed lines show the observational sections included in the analysis. Note the nonlinear y axis and nonlinear color bar in panel (b).
The Gulf Stream and its poleward extensions are important to the large-scale overturning circulation where water is transformed from light to dense water masses through surface heat loss and mixing at high latitudes (e.g., Mauritzen, 1996; Lozier, 2012). The Atlantic Meridional Overturning Circulation (AMOC) is quantified as the zonally integrated and vertically accumulated meridional flow in the North Atlantic, of which the Gulf Stream and its extensions form the essential northward-flowing branch between 25 and 70° N. The resulting overturning streamfunction depicts an upper-cell where warm, subtropical water flows northward and cold North Atlantic Deep Water flows southward at depth (Fig. 1b). While considerable effort has been made to observe and understand the AMOC, it is by definition a zonally integrated view of the circulation which masks variability in the individual currents (e.g., Lozier, 2010; Wunsch and Heimbach, 2013; Roquet and Wunsch, 2022). Both model and observational studies show, for instance, limited coherent variability between subtropical and subpolar AMOC on seasonal to decadal timescales (Bingham et al., 2007; Lozier et al., 2010; Mielke et al., 2013; Moat et al., 2020; Jackson et al., 2022). As an alternative to the integrated AMOC view, we do a first assessment of observed variability in the northward-flowing upper-ocean branches within the Gulf Stream system.
The North Atlantic Ocean exhibits pronounced variability on a range of timescales. The dominant mode of interannual atmospheric variability, the North Atlantic Oscillation (NAO; Fig. S1 in the Supplement), drives ocean circulation changes through both wind stress and surface heat flux anomalies on interannual to decadal timescales (e.g., Eden and Willebrand, 2001; Marshall et al., 2001; Sarafanov, 2009). The subpolar North Atlantic has distinct decadal trends in heat and freshwater content linked to subpolar gyre dynamics (Piecuch et al., 2017; Desbruyères et al., 2021; Fox et al., 2022). On multidecadal timescales, warm and cold phases referred to as the Atlantic Multidecadal Variability are characterized by basin-wide sea surface temperature anomalies with AMOC variability thought to be an important driver (Zhang et al., 2019). In addition to internal variability, externally forced global warming is projected to slow down the AMOC over the 21st century by reducing dense water formation at subpolar latitudes (e.g., Lique and Thomas, 2018; Weijer et al., 2020).
The observational record is relatively short considering the wide range of timescales characterizing North Atlantic variability. The AMOC strength has been measured in the subtropics at 26.5° N since 2004 (RAPID; Cunningham et al., 2007) and in the subpolar North Atlantic at approximately 55° N since 2014 (OSNAP; Lozier et al., 2017). The Nordic Seas inflow branches and the Norwegian Atlantic Current have been monitored since the 1990s (Orvik and Skagseth, 2003b; Ingvaldsen et al., 2004; Østerhus et al., 2019). For the interannual to decadal timescales resolved by the records so far, it remains unclear to what extent the different branches of the Gulf Stream system will exhibit coherent variability and thus can be used to make inferences about the large-scale circulation. Distinguishing naturally occurring variability from an externally forced global warming signal is furthermore a major challenge (Baehr et al., 2008; Kelson et al., 2022).
Here, we focus on observational records of circulation strength from the Florida Current in the subtropical North Atlantic to the Norwegian Atlantic Current in the Nordic Seas (Fig. 2). We use the ECCOv4-r4 ocean state estimate to extend the analysis back to 1992 and explore mechanisms of interannual to decadal variability. In evaluating the Gulf Stream and its poleward extensions as an interconnected circulation system within this time period, we identify patterns of connections and disconnections which have implications for the interpretation of single observational records in the context of large-scale circulation change.
The strength of the ocean circulation is monitored by a number of observational arrays in the North Atlantic and Nordic Seas. In Sect. 2.1, we give an overview of the ocean transport measurements used in the analysis (Fig. 2): the Florida Current and Western Boundary Current at 26.5° N, the Gulf Stream at the Oleander section, the North Atlantic Current at OSNAP-East, the Greenland-Scotland Ridge inflows to the Nordic Seas, the Norwegian Atlantic Current at Svinøy, and the Atlantic water inflow to the Barents Sea. While our focus is the upper-ocean circulation, we also show estimates of overturning strength (Fig. 3): maximum of the overturning streamfunction at the RAPID and OSNAP sections, and overflow transports at the Greenland-Scotland Ridge. The ECCOv4-r4 ocean state estimate is described in Sect. 2.2, and the data treatment is explained in Sect. 2.3.
Meinen et al. (2010)Smeed et al. (2018)Moat et al. (2020)Rossby et al. (2019)Fu et al. (2023a)Fu et al. (2023a)Østerhus et al. (2019)Østerhus et al. (2019)Orvik (2022)Ingvaldsen et al. (2004)Table 1Ocean transport measurement records in the North Atlantic and Nordic Seas. The mean transport is the absolute value of the monthly mean volume transport. SD is the standard deviation of the monthly means, with the exception of the Oleander record (*), where SD is the standard deviation of annual means. Records included are the Florida Current (FC) and Western Boundary Current (WBC) at RAPID, Gulf Stream (GS) at the Oleander section, North Atlantic Current (NAC) at OSNAP-East, inflow at the Greenland-Scotland Ridge (GSR), and the Norwegian Atlantic Slope Current (NwASC) at Svinøy and the Barents Sea Opening (BSO). Records quantifying overturning strength are included at RAPID (mocz), OSNAP (mocσ), and the Greenland-Scotland Ridge (GSR overflow). The notation (mocz) and (mocσ) denotes depth-space and density-space overturning strength, respectively.
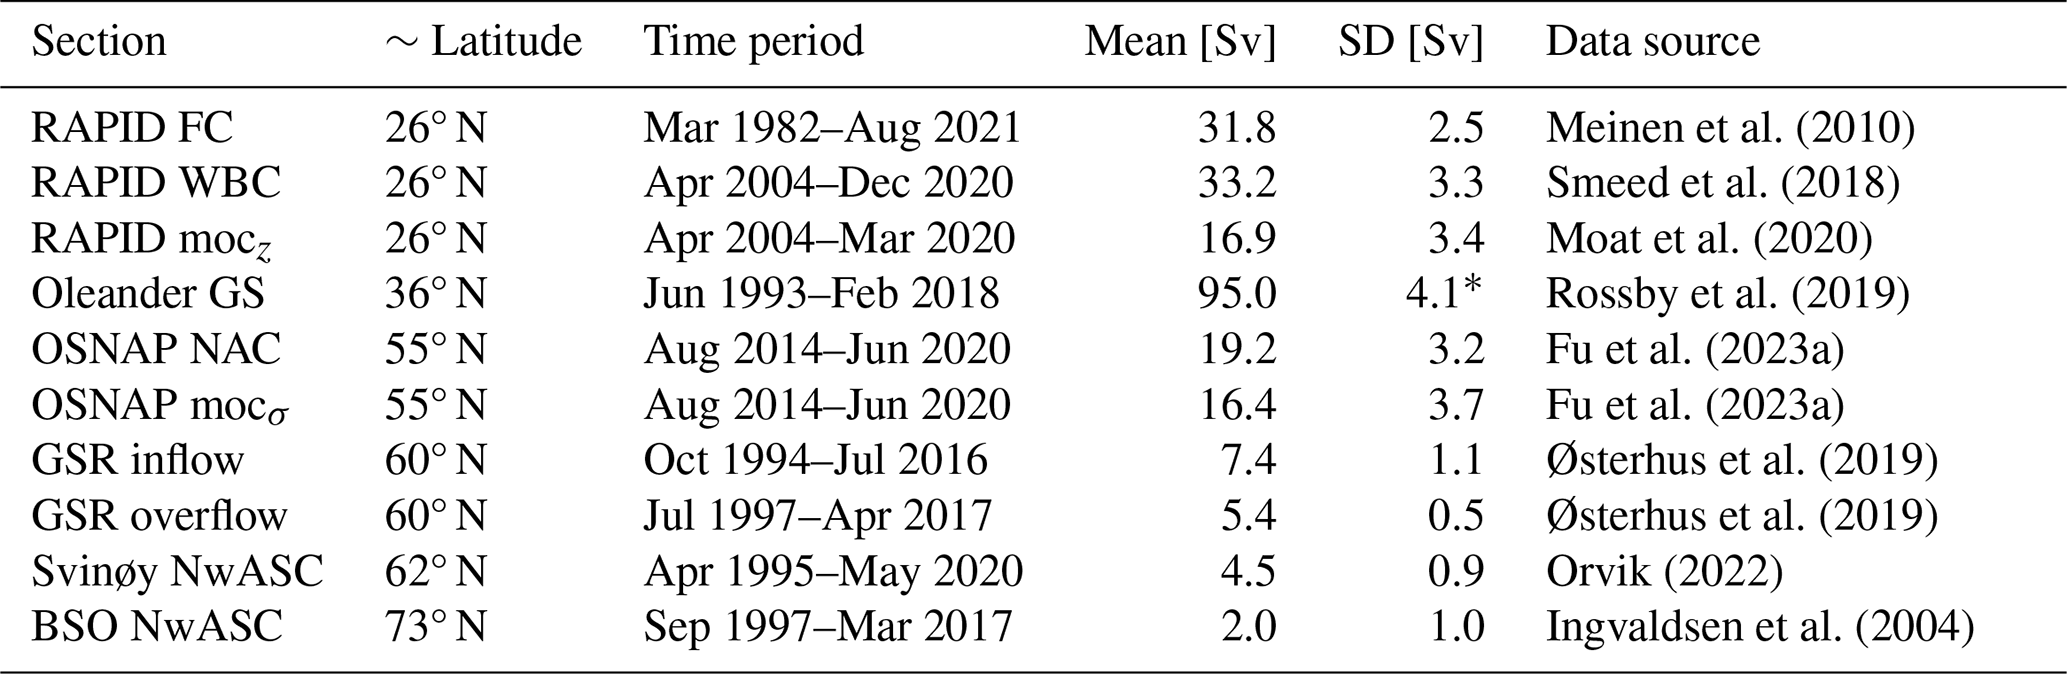
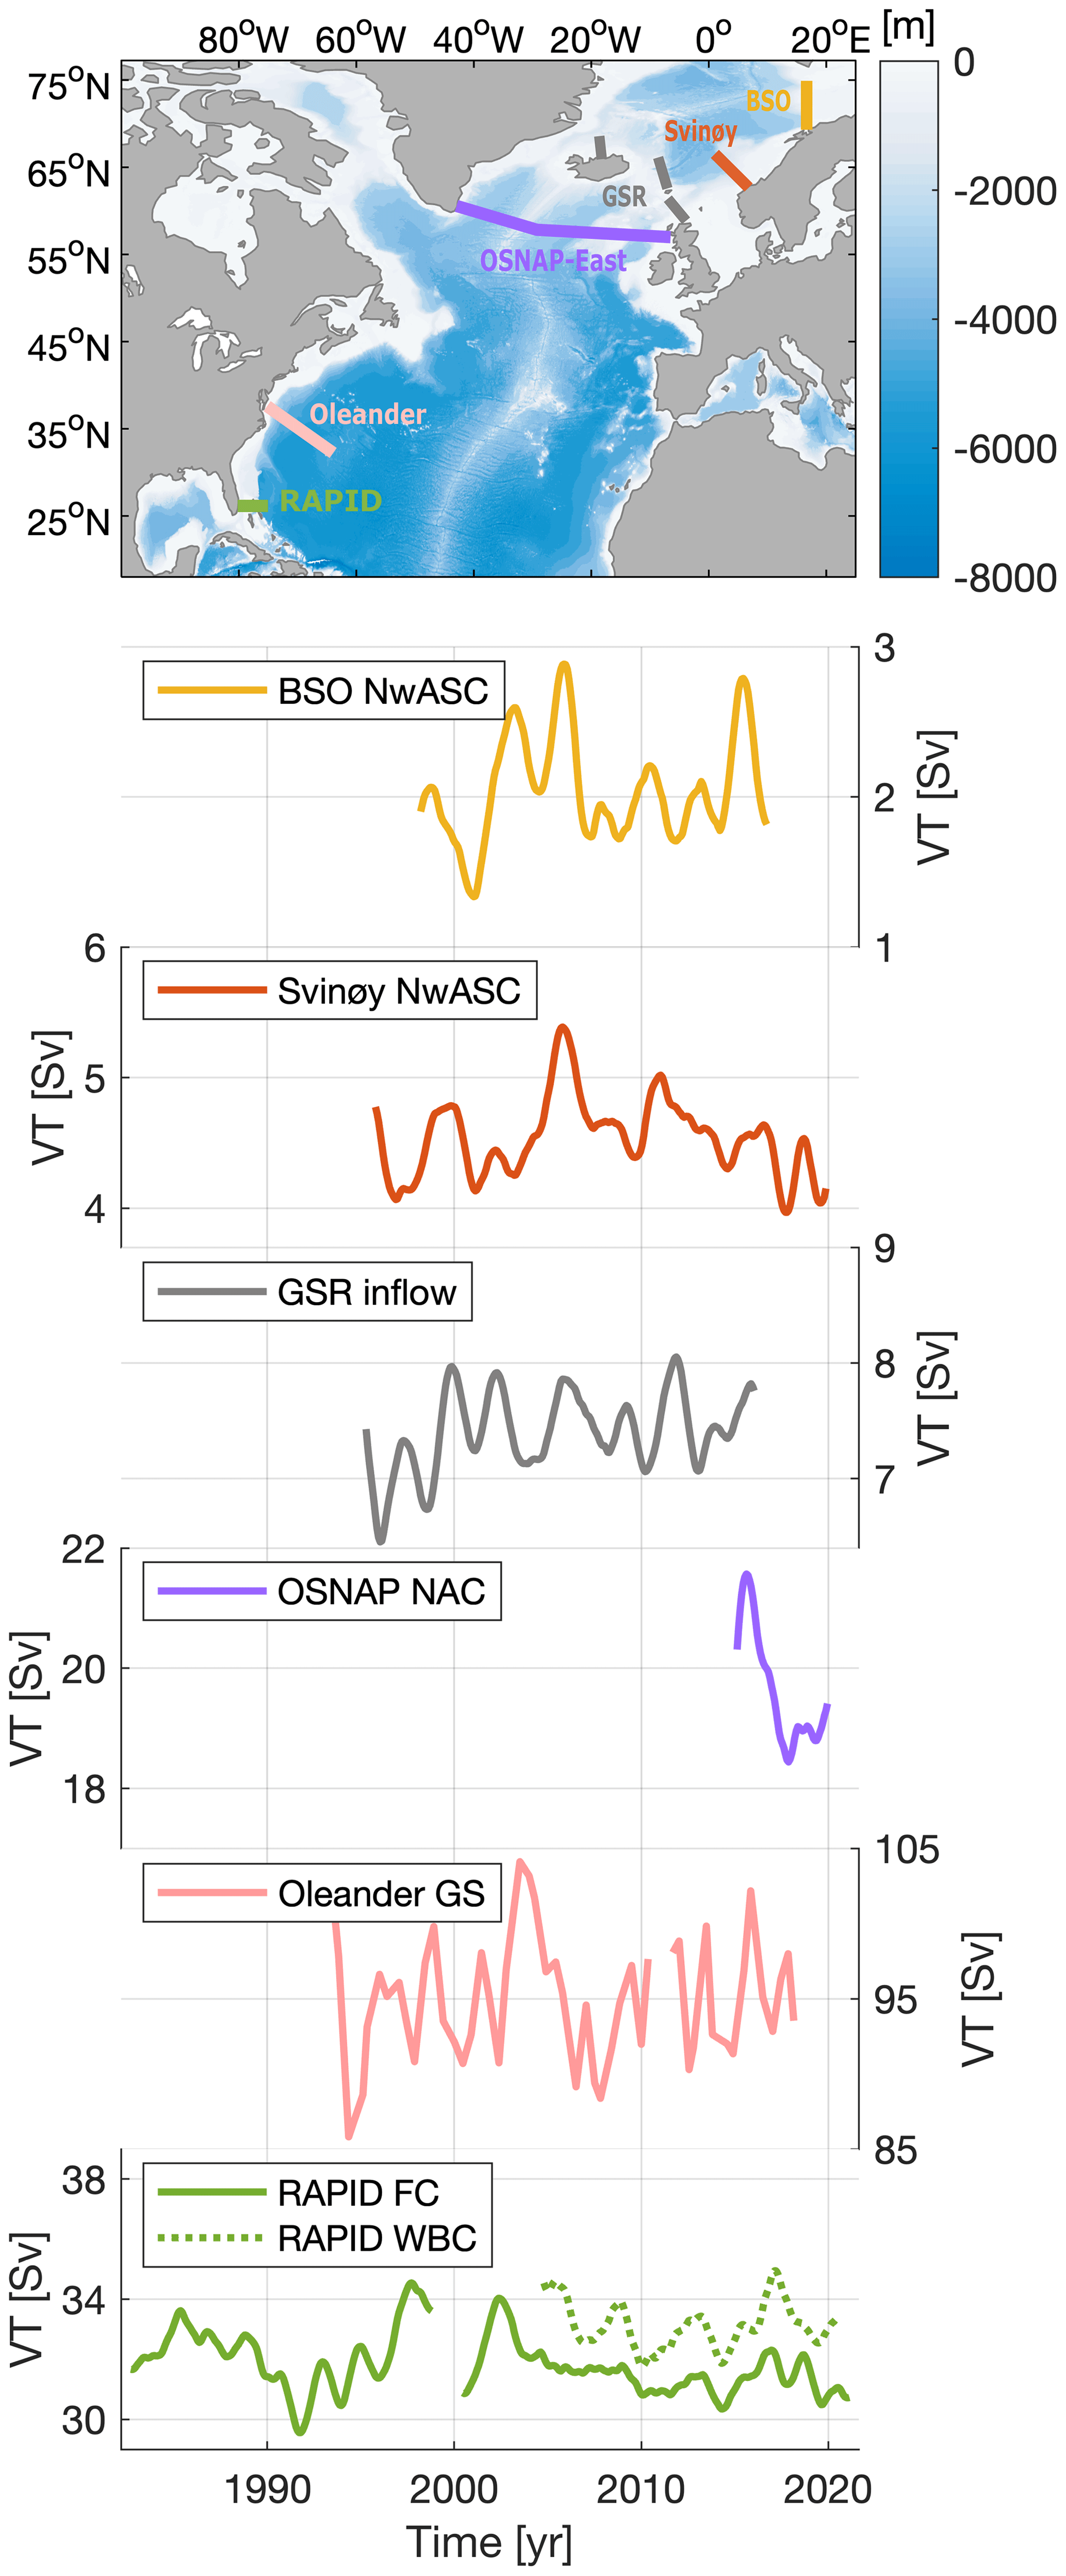
Figure 2Volume transport time series for the observed Gulf Stream system. From the southernmost to the northernmost section: the Florida Current (FC) and Western Boundary Current (WBC; includes the Antilles Current) at RAPID; the Gulf Stream (GS) component at the Oleander section; the North Atlantic Current (NAC) at OSNAP-East; the combined Faroe-Shetland Channel, Iceland-Faroe Ridge, and Denmark Strait inflows at the Greenland-Scotland Ridge (GSR); and the Norwegian Atlantic Slope Current (NwASC) at Svinøy and at the Barents Sea Opening (BSO). The monthly mean time series have been filtered with a 1-year low-pass triangular filter to highlight interannual variability.
2.1 Observing systems
The Florida Current has been measured since 1982 and is the longest, near-continuous volume transport time series in the North Atlantic (Larsen and Sanford, 1985; Baringer and Larsen, 2001). The volume transport is inferred from submarine telephone cables measuring the motionally induced voltage difference across the strait between Florida and Grand Bahama island. The 31.8±2.5 Sv transported by the Florida Current constitutes the starting point of the Gulf Stream together with the Antilles Current to the east (Meinen et al., 2019). Because variability in the Antilles Current is important for the overall variability at the western boundary (Fig. 2), we additionally include the total Western Boundary Current transport as defined in Smeed et al. (2018), transporting on average 33.2±3.3 Sv (Table 1).
The RAPID-MOCHA array has been active since 2004, estimating the flow across 26.5° N (Cunningham et al., 2007; Moat et al., 2020). Considering the circulation to be in near geostrophic balance away from boundaries, the RAPID array estimates the mid-ocean geostrophic transport from the thermal wind relation using dynamic height moorings located at the western and eastern continental shelves and on both sides of the Mid-Atlantic Ridge (McCarthy et al., 2015). The full AMOC estimate additionally relies on current meter moorings measuring the Antilles Current, cable measurements from the Florida Current, and the Ekman transport calculated from ERA5 wind stress (Hersbach et al., 2020). The AMOC strength at RAPID shown in Fig. 3 is the maximum of the estimated overturning streamfunction in depth-space (mocz) and thus reflects the strength of the net upper-ocean circulation at 26.5° N.
An ADCP (acoustic Doppler current profiler) mounted on the container ship CMV Oleander allows for estimating volume fluxes from velocities measured along a transect from New Jersey to Bermuda (Flagg et al., 1998; Rossby et al., 2005). The ADCP measures velocities down to 250–400 m depth for the 1992–2004 period and down to 500–600 m from 2005 and onwards (Sanchez-Franks et al., 2014). Because the measurements do not cover the full depth, the Oleander record is a volume flux for a 1 m thick layer at 52 m depth (unit: Sv m−1). We here focus on the Gulf Stream component defined as the northeastward, high-velocity core as provided in Rossby et al. (2019). Using a scale factor of 700, the total Gulf Stream transport in the 0–2000 m layer can be estimated (Rossby et al., 2014), averaging to 95.0±4.1 Sv (Table 1). Due to variable sampling frequency related to ship time and equipment failure, the Oleander transport is estimated in 1-year segments stepped at half-year intervals. As a result, the Oleander record has different temporal resolution than the other time series displayed in Fig. 2.
The OSNAP observing system, deployed in 2014, monitors the North Atlantic circulation at subpolar latitudes (Lozier et al., 2017). The two subarrays OSNAP-East and OSNAP-West use densely spaced current meter and dynamic height moorings in the boundary currents and over the Reykjanes Ridge. OSNAP also relies on Argo float data, satellite altimetry, glider observations, and the surface wind field to estimate velocities and property fields away from the moorings (Li et al., 2017). Here, we use the North Atlantic Current transport across OSNAP-East (Fig. 2), defined as the net transport east of 25.6° W and above the 27.66 kg m−3 isopycnal. We also show the AMOC strength in density-space (mocσ) for the full OSNAP line (Fig. 3), which quantifies water mass transformation from light to dense water north of the section.
The three inflow branches to the Nordic Seas across the Greenland-Scotland Ridge are monitored by three subarrays with current meter moorings at the Faroe-Shetland Channel (Berx et al., 2013), Iceland-Faroe Ridge (Hansen et al., 2015), and north of the Denmark Strait at the Hornbanki section (Jónsson and Valdimarsson, 2012). Regular CTD (conductivity–temperature–depth) cruises also sample the sections multiple times a year. For the Faroe-Shetland Channel and Iceland-Faroe Ridge, the volume transport time series combine in situ observations with satellite altimetry. On average, 2.7±1.1 Sv is transported in the Faroe-Shetland Channel, 3.8±0.6 Sv across the Iceland-Faroe Ridge, and 0.9±0.3 Sv with the Denmark Strait branch (Østerhus et al., 2019). While the Iceland-Faroe Ridge component has the highest volume transport of the three inflow branches, the Faroe-Shetland Channel component dominates interannual variability (Fig. S2a). In Fig. 3, we show the transport of the Greenland-Scotland Ridge overflows (the Denmark Strait and Faroe-Bank Channel overflows), which quantifies the amount of dense water formed north of the ridge and exported to the Atlantic Ocean (Hansen et al., 2016; Jochumsen et al., 2017).
North of the Greenland-Scotland Ridge, the Norwegian Atlantic Current transports water northward in a two-branch system; the Norwegian Atlantic Slope Current and the Norwegian Atlantic Front Current. A mooring in the Norwegian Atlantic Slope Current has been measuring its variability since 1995 (Orvik and Skagseth, 2003a; Orvik, 2022). The mooring is located at the Svinøy section in the core of the Norwegian Atlantic Slope Current at position 62°48′ N, 4°55′ E. Because the current is nearly a barotropic shelf edge current, a single current meter at 100 m depth can be used to estimate the total transport of the Norwegian Atlantic Slope Current when scaled with the Svinøy section area (Orvik and Skagseth, 2003a). Applying the scaling factor, the mean Svinøy transport is 4.5±0.9 Sv (Table 1).
At the entrance to the Barents Sea, a current meter mooring array has monitored the Atlantic inflow through the Barents Sea Opening since 1997 (Ingvaldsen et al., 2002, 2004). The mooring array extends from 71°30′ N to 73°30′ N, with the exact number of moorings deployed varying over the measurement period. On average, the Atlantic inflow through the Barents Sea Opening is 2±1.0 Sv (Table 1).
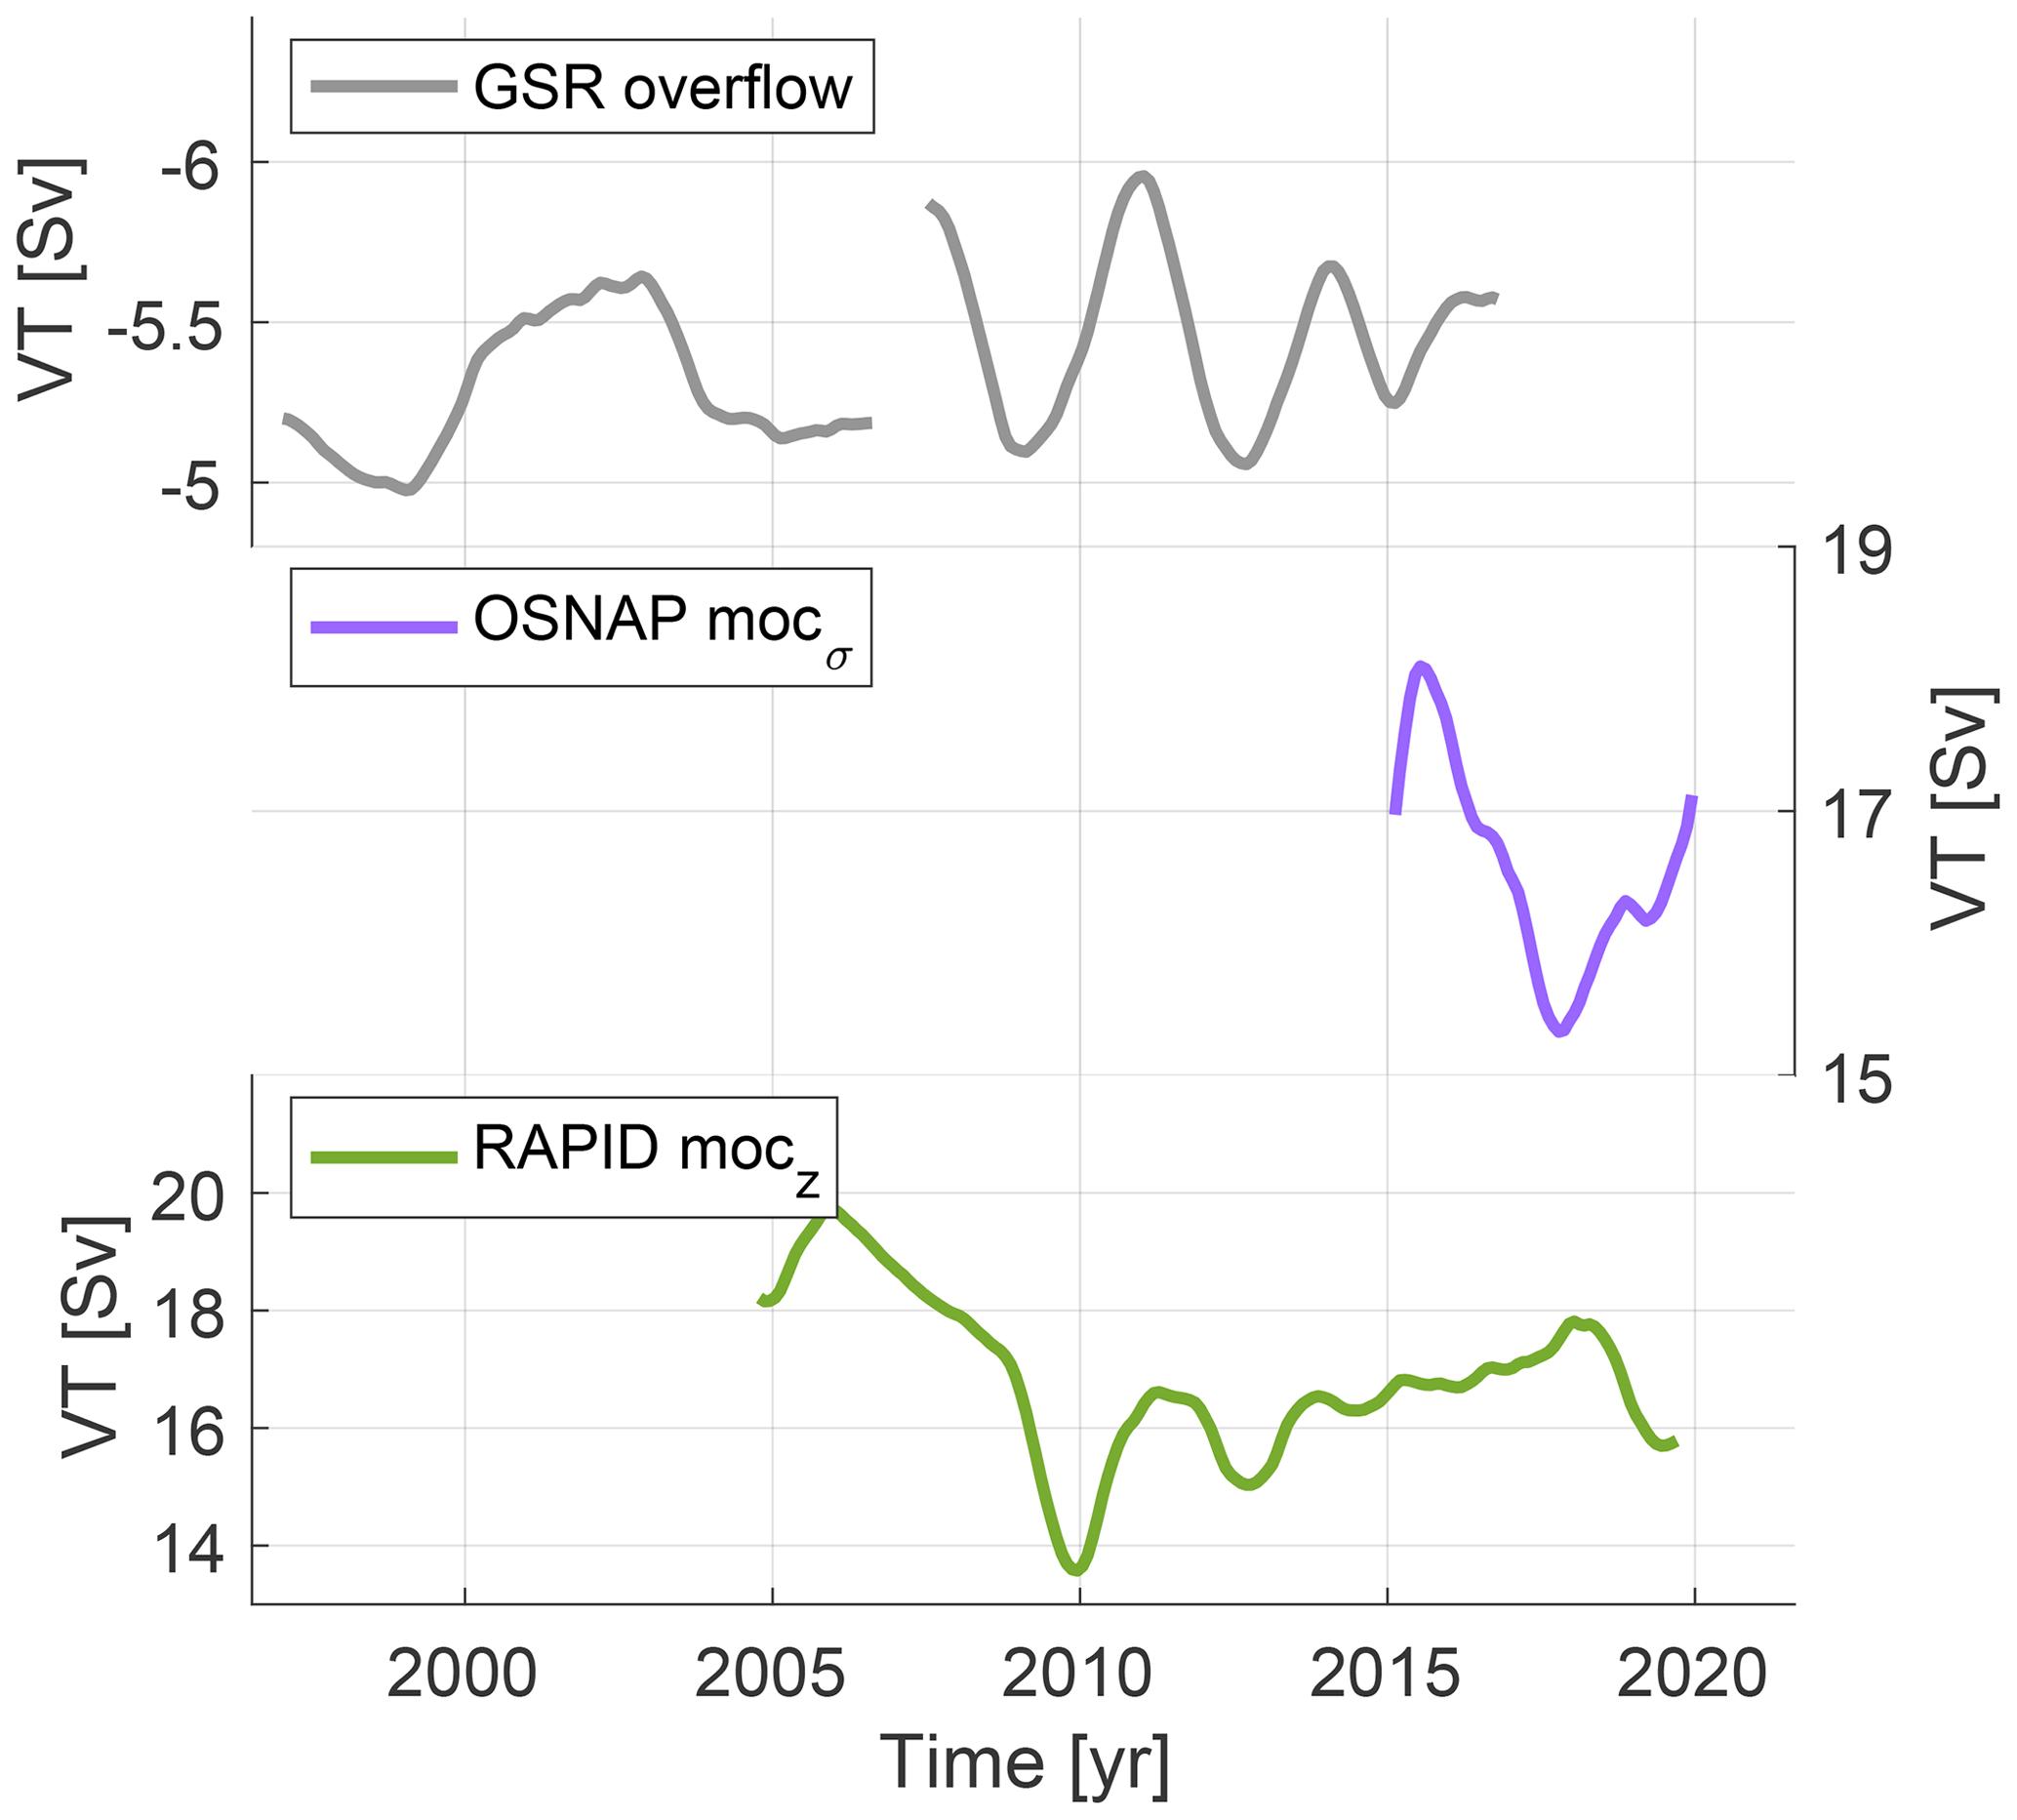
Figure 3Volume transport time series quantifying overturning strength. The Denmark Strait and Faroe-Bank-Channel overflows at the Greenland-Scotland Ridge (GSR), overturning strength in density space (mocσ) at OSNAP, and overturning strength in depth-space (mocz) at RAPID. The monthly mean time series have been filtered with a 1-year low-pass triangular filter to highlight interannual variability. Note that the y axis of the GSR overflow panel has been flipped.
2.2 ECCOv4-r4 ocean state estimate
To supplement relatively short observational records, we analyze circulation strength in the ECCO Version 4 Release 4 (ECCOv4-r4) ocean state estimate spanning 1992–2017. The ECCOv4-r4 estimate provides a dynamically consistent solution for the global ocean and sea ice state by using nearly all modern ocean observations to constrain an ocean general circulation model with a 1° nominal horizontal resolution (Forget et al., 2015; ECCO Consortium et al., 2021). The ECCOv4 framework uses the adjoint method to iteratively reduce the model–data misfit by adjusting initial conditions, surface boundary conditions, and model parameters (Heimbach et al., 2005). The observational constraints consist of profiles from Argo floats, ice-tethered profilers, marine mammals, individual CTD stations, as well as satellite observations of sea level, sea surface salinity and temperature, sea ice concentration, and ocean bottom pressure from GRACE and GRACE-FO. As observed ocean transport time series are not used as direct constraints in the ECCOv4 framework, the observed and ECCOv4-r4 transport estimates shown here can be considered independent.
In defining the transport sections in ECCOv4-r4, we stay as geographically close to the observational transects as the coarse grid allows. For instance, because the complex topography in the Straits of Florida is not fully resolved, we define the Florida Current transport in ECCOv4-r4 as the transport on the continental shelf. For the full Western Boundary Current transport, the secondary core with northward-flowing water off the shelf is additionally included. We use the same definitions of the currents as for the observational transports, given that these remain meaningful definitions when studying the ECCOv4-r4 transects. For instance at OSNAP-East, the same 27.66 kg m−3 isopycnal is used to define the North Atlantic Current in observations and in ECCOv4-r4 as water mass properties are generally well constrained in ECCOv4-r4.
Previous releases of the ECCOv4 state estimate have been shown to reproduce well the observed variability in heat and salt in the subpolar North Atlantic (Piecuch et al., 2017; Sanders et al., 2022) and the Nordic Seas (Asbjørnsen et al., 2019; Tesdal and Haine, 2020). In terms of overturning in the North Atlantic, ECCOv4 skillfully reproduces variability at 26.5° N (Evans et al., 2017; Kostov et al., 2021), though the mean AMOC strength is slightly weaker than in observations (Fig. S3). At the OSNAP-East section, the AMOC strength (here in density-space) is also somewhat weaker than in observations (Fig. S4). ECCOv4-r4 captures the observed peak in mocσ in 2015/16 (Fig. S4c), but the overlapping time period with observations is too short to get a fair assessment of how well interannual variability is represented.
For the upper-ocean components, interannual variability in the Florida Current is very well represented in ECCOv4-r4 (Fig. 4a), though the transport magnitude is slightly lower than in observations (27 Sv versus 32 Sv in observations). At the Oleander section, direct comparison in terms of variability is difficult due to the temporal resolution of the Oleander record. However, we note that the Gulf Stream in ECCOv4-r4 fails to intensify sufficiently when moving northward, leaving it too weak at the Gulf Stream separation latitude – a common issue for ocean and climate models (Sen Gupta et al., 2021). The ECCOv4-r4 estimate captures the volume transport magnitude and variability at the Greenland-Scotland Ridge and Svinøy sections well (Fig. 4a). However, the Greenland-Scotland Ridge inflow in ECCOv4-r4 has a too weak Denmark Strait component (0.2 Sv) and too strong Iceland-Faroe Ridge component (4.7 Sv) compared to observations (0.9 and 3.8 Sv, respectively). The climatological mean for the Barents Sea Opening inflow is accurate in ECCOv4-r4 (2.03 Sv in observations vs. 2.16 Sv in ECCOv4-r4), though there is little agreement on interannual variability as discussed previously in Asbjørnsen et al. (2019).
2.3 Data treatment
For the observational records with a higher-than-monthly temporal frequency, we compute monthly means of the volume transport time series. To highlight interannual variability, we filter with a 1-year low-pass triangular filter (24-month filter width; Fig. 2). Six months are removed at the start and the end of the filtered transport time series to limit the edge effects from filtering. When filtering, shorter gaps in the measurement records (no more than five consecutive months) are smoothed over, while more extensive gaps, such as the one between November 1998 and May 2000 in the Florida Current record, are treated as a discontinuous time series. The filtered volume transport anomalies from the time mean are shown when comparing observations and the ECCOv4-r4 state estimate (Fig. 4). Because the Oleander transport is estimated in 1-year segments stepped at half-year intervals, it is not low-pass filtered like the other time series.
To assess the covariability between the transport time series, we calculate the correlation coefficient between the different low-pass-filtered observational and ECCOv4-r4 time series. We show correlation at lag zero (Table 2), and for the ECCOv4-r4 estimate we also identify the maximum correlation for lag times between 0 and 6 years (Fig. S5). Several of the observational time series have a limited overlapping period of available data, and autocorrelation further limits the number of independent data points. We therefore use the Chelton (1983) method at the 95 % confidence level to assess whether the correlation between two time series is significant. The method uses the effective degrees of freedom to compute a correlation coefficient value as a threshold for significance. The threshold for significant correlation varies substantially, taking a high value when the effective degrees of freedom is low. Throughout, we refer to the correlation analysis between the transport sections as a way to assess meridional coherence within the Gulf Stream system.
We estimate linear trends over the extent of the individual observational records using the least squares method (Table 3). Trends in the ECCOv4-r4 state estimate are evaluated over the 1992–2017 period. The trend calculations are performed on the unfiltered monthly mean time series. To assess whether the trend values are significantly different from zero at the 95 % confidence level, we use the modified Mann–Kendall test for autocorrelated data (Hamed and Rao, 1997). In Fig. S6, we additionally show the 95 % confidence interval for the trend estimates.
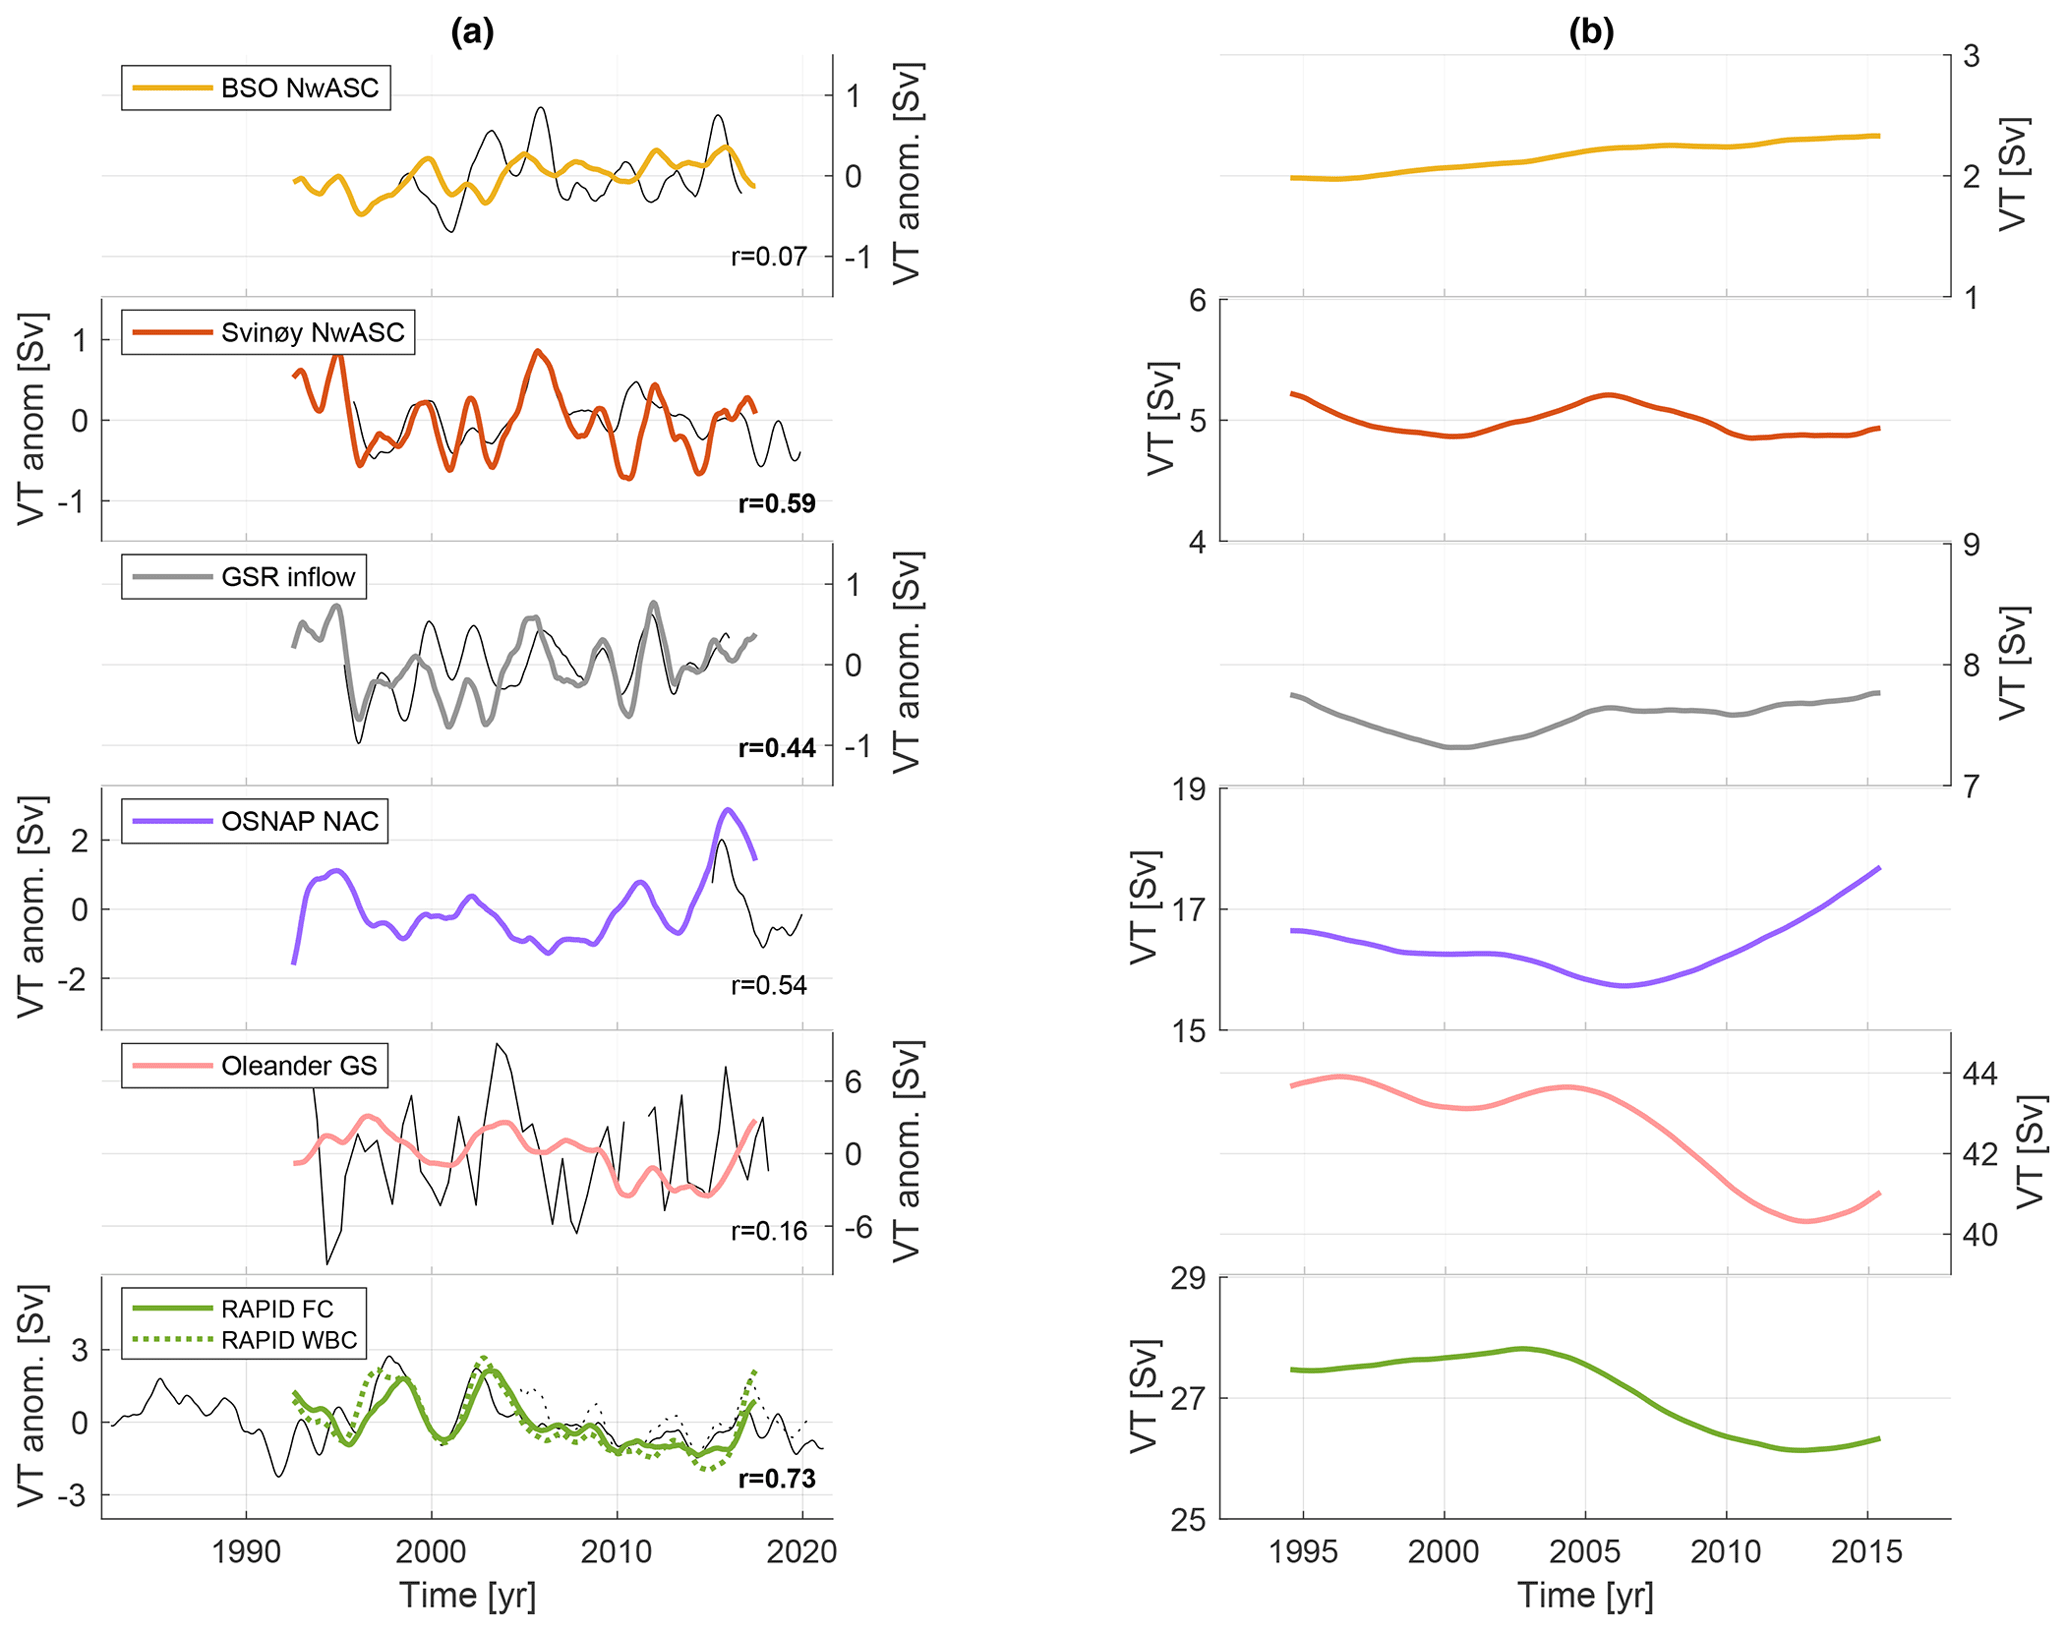
Figure 4Interannual to decadal volume transport variability in ECCOv4-r4 and observations. (a) ECCOv4-r4 transport anomalies from the time mean (1992–2017) are displayed in colors, with corresponding observational time series (as in Fig. 2) in black. Significant correlations between observational and ECCOv4-r4 time series are indicated in bold font. (b) Equivalent ECCOv4-r4 transport sections as in panel (a) but smoothed with a 5-year low-pass filter to highlight decadal variability. The time series show the total volume transport, not anomalies, so that the magnitude of decadal trends is visible.
Observations of circulation strength at fixed locations are often used to make inferences about the state of the large-scale circulation (e.g., Smeed et al., 2018; Østerhus et al., 2019). Here, we view the different circulation components in the context of the extended Gulf Stream system, focusing on observed coherence between the branches monitored on interannual timescales and potential trends over the respective measurement periods.
3.1 Meridional coherence
Circulation in the North Atlantic Ocean adjusts to changes in local surface forcing (wind and buoyancy) through rapid propagation of boundary waves at the western boundary, slow westward propagation of Rossby waves, and advection of density anomalies with the ocean currents (Johnson and Marshall, 2002; Zhang, 2010; Marshall and Johnson, 2013). The range in timescales of these processes communicating change (advection; ∼3–4 years from subpolar to subtropical latitudes, Kelvin waves; <1 year, Rossby waves; interannual-decadal timescales) makes the adjustment period potentially long, and the system's meridional coherence is thought to increase with increasing timescale considered (e.g., Gu et al., 2020). Limited meridional coherence between the subtropical and subpolar AMOC strength is seen in both models and observations (e.g., Bingham et al., 2007; Lozier et al., 2010; Mielke et al., 2013; Jackson et al., 2022). On interannual timescales, variability in subtropical AMOC strength is dominated by local wind stress, which in part explains the limited coherence with subpolar AMOC variability driven by a combination of wind and buoyancy anomalies (Zhao and Johns, 2014; Kostov et al., 2021).
More meridionally coherent signals in the AMOC have been explored in previous studies. Using empirical orthogonal function (EOF) analysis, Zou et al. (2020) identify a meridionally coherent AMOC mode and a gyre-opposing AMOC mode in multiple ocean models. Han (2023) finds a coherent signal on seasonal to interannual timescales in ECCOv4-r3 linked to isopycnal heaving and the associated adiabatic redistribution of water (also called “sloshing”). Still, the lack of coherence in the full signal remains a challenge for the observing systems and detection of potential emerging trends in the North Atlantic circulation (Frajka-Williams et al., 2023).
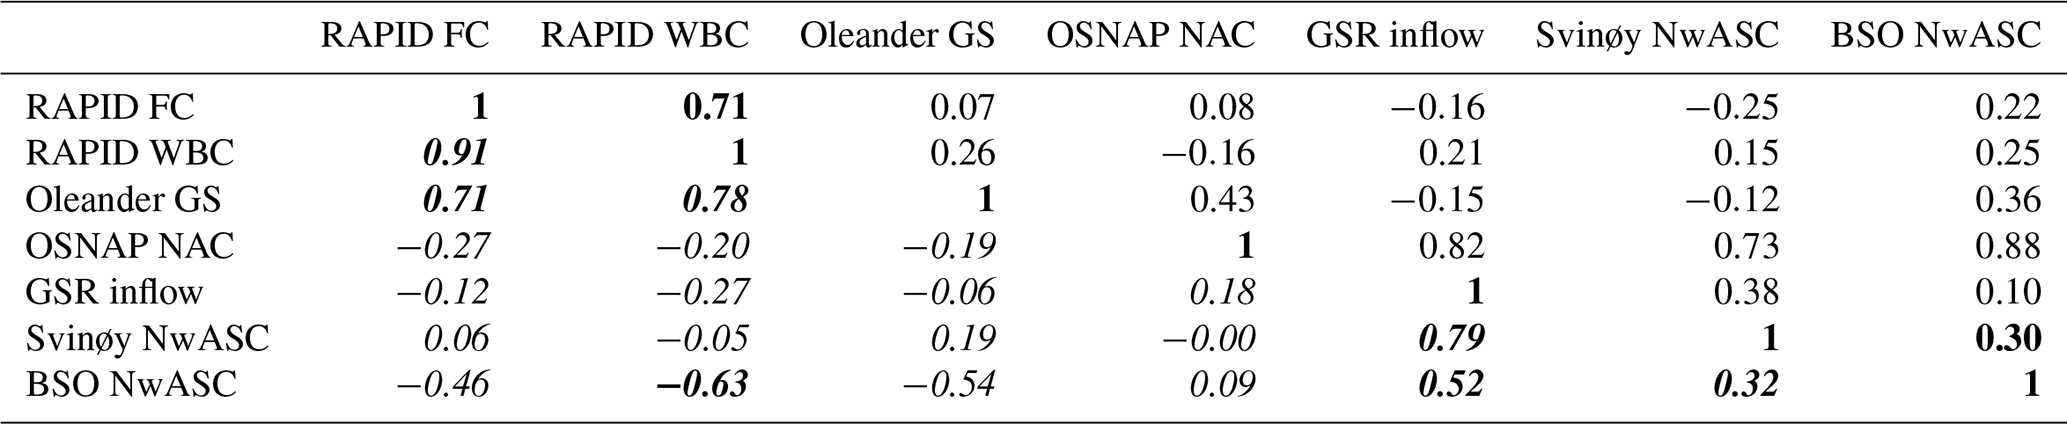
Comparing the volume transport time series of the upper-ocean branches included in our analysis shows limited meridional coherence within the Gulf Stream system on interannual timescales for all sensible lags (Table 2, Fig. S5a). The North Atlantic Current at the OSNAP-East section shows high zero-lag correlation with the Greenland-Scotland Ridge, Svinøy, and Barents Sea Opening sections downstream, but the correlations are not statistically significant as the degrees of freedom are low for the short OSNAP record (Table 2). Between the transport at the Svinøy section and the inflow through the Barents Sea Opening, there is a weak but statistically significant relationship (r=0.30) at zero lag time. The remaining observational records show little sign of covariance. For instance, the correlation between the Western Boundary Current at 26.5° N and the Gulf Stream at Oleander is not significant, which is consistent with previous studies finding surface-layer transport to decorrelate quickly when moving north along the Gulf Stream path (Chi et al., 2023).
In contrast to the observational records, some more distinct patterns of coherence are found within the ECCOv4-r4 estimate (Table 2). The strongest relationships identified are at zero lag time between transport sections that are geographically close and upstream of major recirculation branches. Specifically, we find coherence within the Gulf Stream boundary current (Florida Current/Western Boundary Current at 26.5° N and the Oleander section) and within the Nordic Seas (Greenland-Scotland Ridge inflow, Svinøy, Barents Sea Opening). Covariability at zero lag must be a result of fast boundary wave propagation or the ocean responding to regional-scale atmospheric forcing. Testing for a range of lag times, we find no covariance between the subtropics and the subpolar North Atlantic nor between the subpolar North Atlantic and the Nordic Seas on interannual timescales in ECCOv4-r4 (Fig. S5a).
Within the Ekman layer, the ocean responds to the local surface wind stress independently at each latitude. We therefore additionally check coherence within ECCOv4-r4 when removing the upper 100 m before integrating across the sections (Table S1 in the Supplement). Removing the Ekman layer does not notably increase the correlations or establish any new relationships between the analyzed sections. Similarly to the full section transports, testing for different lag times reveals no systematic patterns of coherence that can be linked to advection times of anomalies (Fig. S5b).
Based on the correlations between the ECCOv4-r4 transport sections, we conclude that meridional coherence in the Gulf Stream system is limited to the gyre structures on interannual timescales, considering the Nordic Seas boundary current system as a separate gyre-like structure. We see, similarly, that the three main gyre structures exhibit differing behaviors also on decadal timescales (Fig. 4b), which is discussed further in Sect. 3.2.
Table 2Correlation between the transport sections. Correlations at zero lag time between low-pass-filtered volume transport anomalies from the time mean for the observational records (upper-right corner; see Table 1 for overlapping time periods), and for the equivalent ECCOv4-r4 transports (lower-left corner (entries in italic font); for the 1992–2017 period). For the Oleander observational record, linear interpolation is used to obtain monthly values for the correlation. Significant correlations at the 95 % confidence level are in bold font (see the Chelton, 1983, method for evaluating significance).
3.2 Change over the observational record
Under future emission scenarios, climate models consistently project a weakened AMOC (e.g., Weijer et al., 2020) and, to a somewhat lesser extent, Gulf Stream (Sen Gupta et al., 2021; Asbjørnsen and Årthun, 2023). There is, however, no consensus on whether such a weakening has already occurred over the past century. Some paleo-reconstructions and proxy reconstructions indicate that the AMOC has already weakened (e.g., Thornalley et al., 2018; Caesar et al., 2021), potentially by as much as 15 % since the mid-20th century (Caesar et al., 2018). Kilbourne et al. (2022) argue, on the other hand, that circulation strength from paleo-records is poorly constrained, and they advise against concluding from subsets of records. When a more complete set of available proxy records for the AMOC is considered, the findings are inconclusive (Moffa‐Sánchez et al., 2019), illustrating the complex relationship between the ocean state and the different proxy types and locations.
Various methods to reconstruct the circulation strength from historical hydrography or sea level are commonly applied as an alternative to paleo-proxies for the most recent century. Fraser and Cunningham (2021) find no statistically significant trend over the past century (1900–2019) when using the Bernoulli inverse to reconstruct the AMOC strength from hydrography at 50° N. Similarly, Rossby et al. (2020) find no long-term trend (1900–2020) in the reconstructed geostrophic transport of the Nordic Seas inflow or in the Gulf Stream volume transport from direct observations (Rossby et al., 2014). Using inverse models based on hydrographic transects, Caínzos et al. (2022) find no systematic change in the AMOC at any latitude when comparing the past 3 decades; neither do Fu et al. (2020). Reconstructing the AMOC at 26° N for the 1981–2016 period from hydrography, Worthington et al. (2021) similarly find no decline in the subtropical AMOC. At the same latitude, Piecuch (2020) finds some indication of a weakening Florida Current over the 1909–2018 period using historical tide gauge measurements and Bayesian analysis. In the observational records analyzed here, only the Florida Current and AMOC at RAPID (both at 26° N) display a statistically significant weakening over their respective observational periods (Tables 3, S2). A weakening Florida Current since 1982 is also found in a recent, more comprehensive analysis, combining the cable measurements with altimetry and in situ measurements as well as their associated observational uncertainties (Piecuch and Beal, 2023). For the ECCOv4-r4 period (1992–2017), we find a significant weakening trend for all the subtropical sections (Table 3) due to weakening transports between the mid-2000s and mid-2010s (Fig. 4b). We note, however, that the weakening trend identified for the subtropical sections cannot be explicitly connected to anthropogenic forcing. Pronounced multidecadal transport variability is highlighted in previous studies (e.g., Fraser and Cunningham, 2021; Rossby et al., 2020), and the 26-year ECCOv4-r4 period is too short to represent such multidecadal signals. At RAPID, the notable weakening in overturning between 2006 and 2010 is explained by changes in the upper mid-ocean transport and Ekman transport components (Fig. S2c), which have been shown to result from adjustments to wind forcing (Roberts et al., 2013; Zhao and Johns, 2014). To detect anthropogenically forced weakening at 26° N, as much as 60 years of observations could be required (Baehr et al., 2008; Lobelle et al., 2020).
Table 3Linear trends over monthly mean transport time series in observations and in ECCOv4-r4 (1992–2017). The trends are given in Sv yr−1. For the observations, the time periods over which the trends are calculated are given in Table 1. Significant trends at the 95 % confidence level are in bold font (modified Mann-Kendall trend test for autocorrelated data; Hamed and Rao, 1997). The 95 % confidence intervals for the estimated trends are shown in Fig. S6.
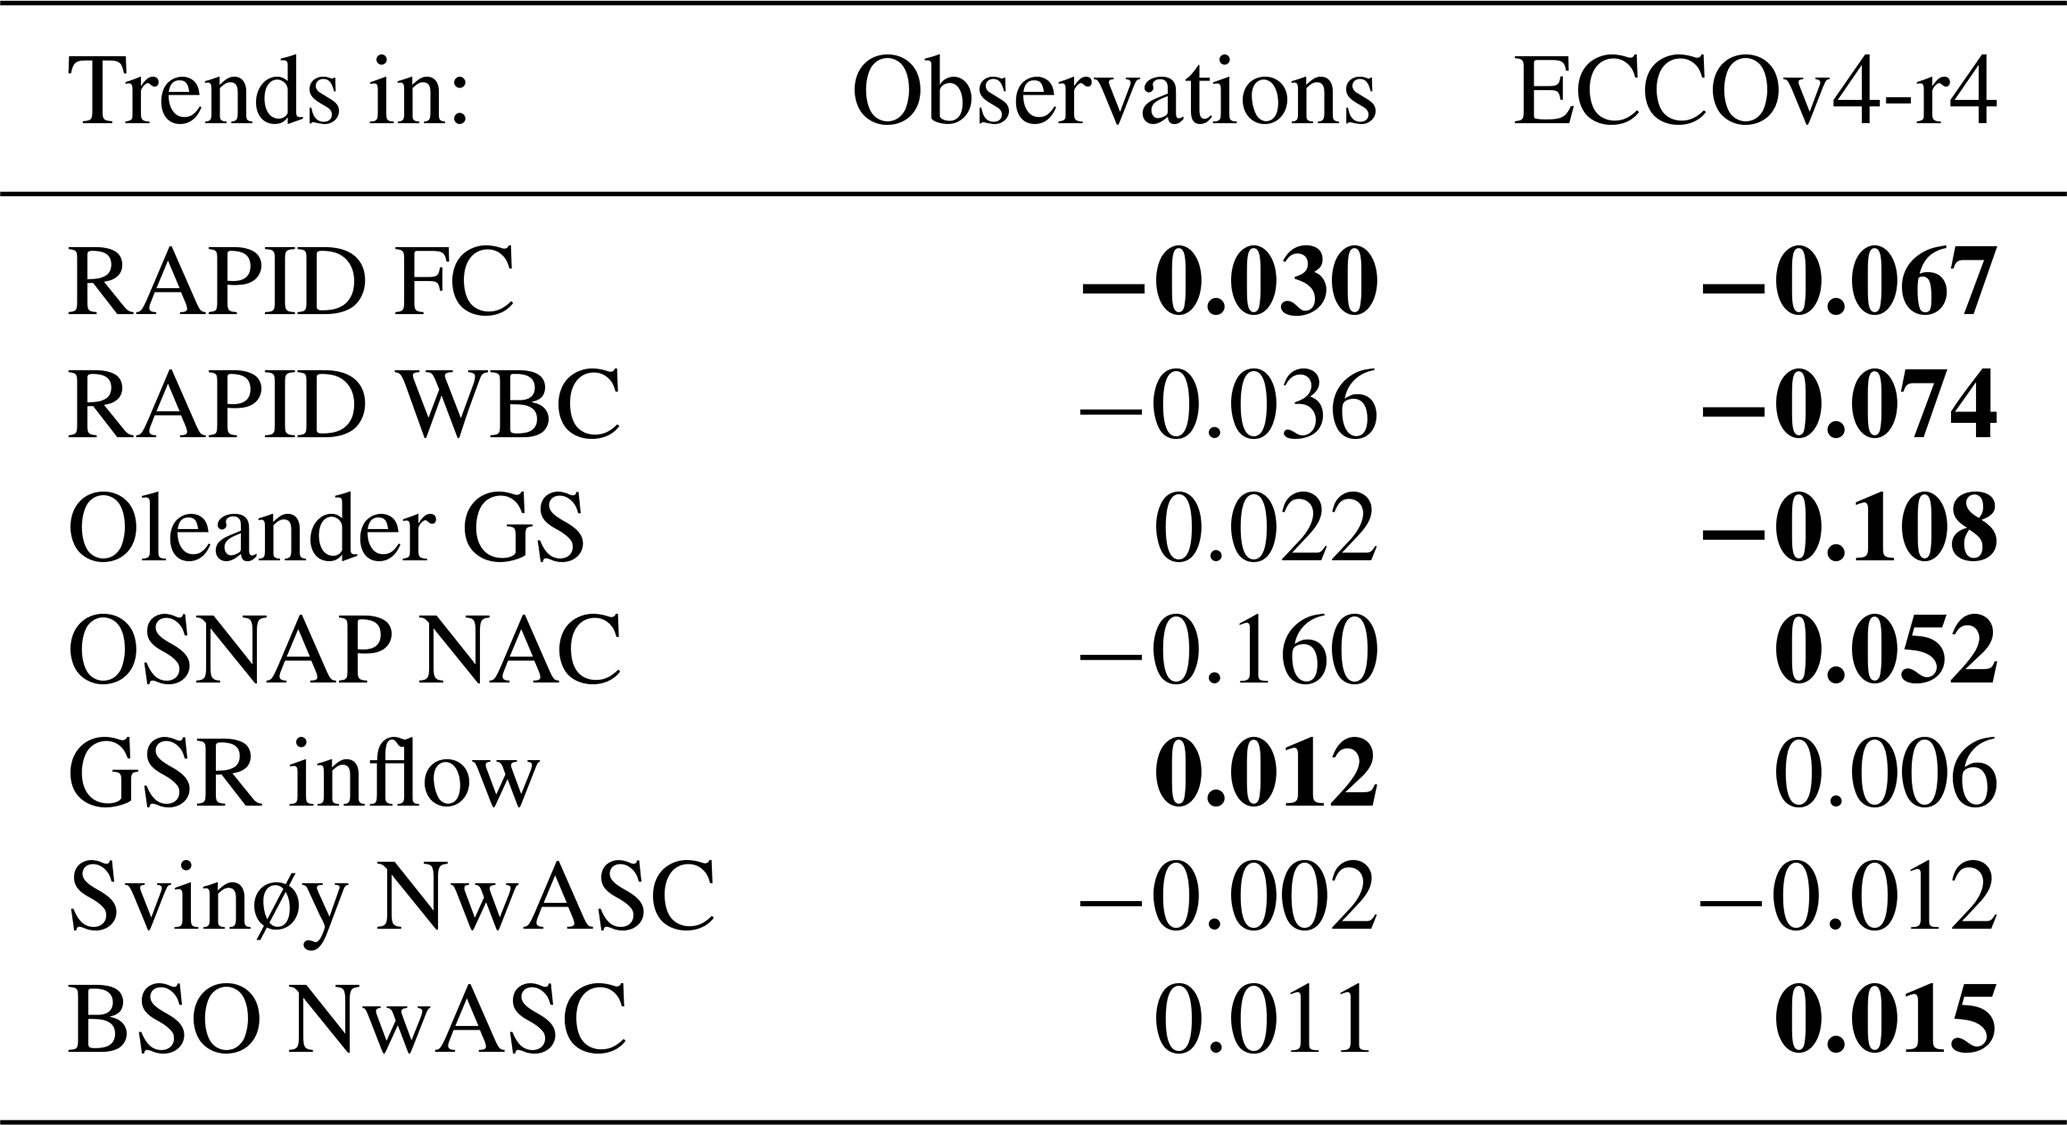
In the subpolar North Atlantic, the North Atlantic Current at OSNAP-East displays a strengthening after 2007 consistent with a strengthening subpolar gyre in that period (Koul et al., 2020). At the Greenland-Scotland Ridge and in the Nordic Seas, the circulation shows no weakening over the different observational records or for the ECCOv4-r4 period (Table 3). As pointed out in Østerhus et al. (2019), the observed overflow transports seen in Fig. 3 indicate that any AMOC slowdown during the past 2 decades does not stem from reduced overturning in the Nordic Seas and Arctic Ocean. North of the Greenland-Scotland Ridge, transports at Svinøy show no trend (Orvik, 2022, and Table 3). At the Barents Sea Opening there is a strengthening over the ECCOv4-r4 period which is not seen in the observational record (Table 3). However, trends in observed sea surface height found in Polyakov et al. (2023) suggest that there might have been an increased transport in the northernmost Barents Sea Opening inflow branch after the mid-2000s that is not fully captured by the mooring array.
Consistent with our results, previous studies have also found differing decadal trends between the subtropical, subpolar, and Nordic Seas gyres. For instance, Jackson et al. (2022) show evidence of differing decadal trends in the subtropical and subpolar AMOC over the historical record. They find a strengthening subtropical AMOC from 2001 to 2005 and a weakening from 2005 to 2014, while the subpolar AMOC likely strengthened from 1980 to the mid-1990s and then weakened until the 2010s. In future emission scenarios, climate models show the Nordic Seas gyre strengthening in the second half of the 21st century, something which enhances water mass transformation in the Nordic Seas and thus may act as a stabilizing factor for an overall weakening AMOC south of the Greenland-Scotland Ridge (Årthun et al., 2023).
3.3 Mechanisms of interannual to decadal variability
Variability in the North Atlantic and Nordic Seas is closely linked to atmospheric forcing. To identify the atmospheric circulation patterns most closely associated with interannual volume transport variability at the ocean observation sites, we regress the annual mean sea level pressure onto the annual mean volume transport time series in ECCOv4-r4 (Figs. 5, S7) and in observations (Fig. S8). Consistent with the analysis assessing meridional coherence (Table 2), we find interannual variability in the subtropics, subpolar North Atlantic, and Nordic Seas to be associated with different atmospheric circulation patterns.
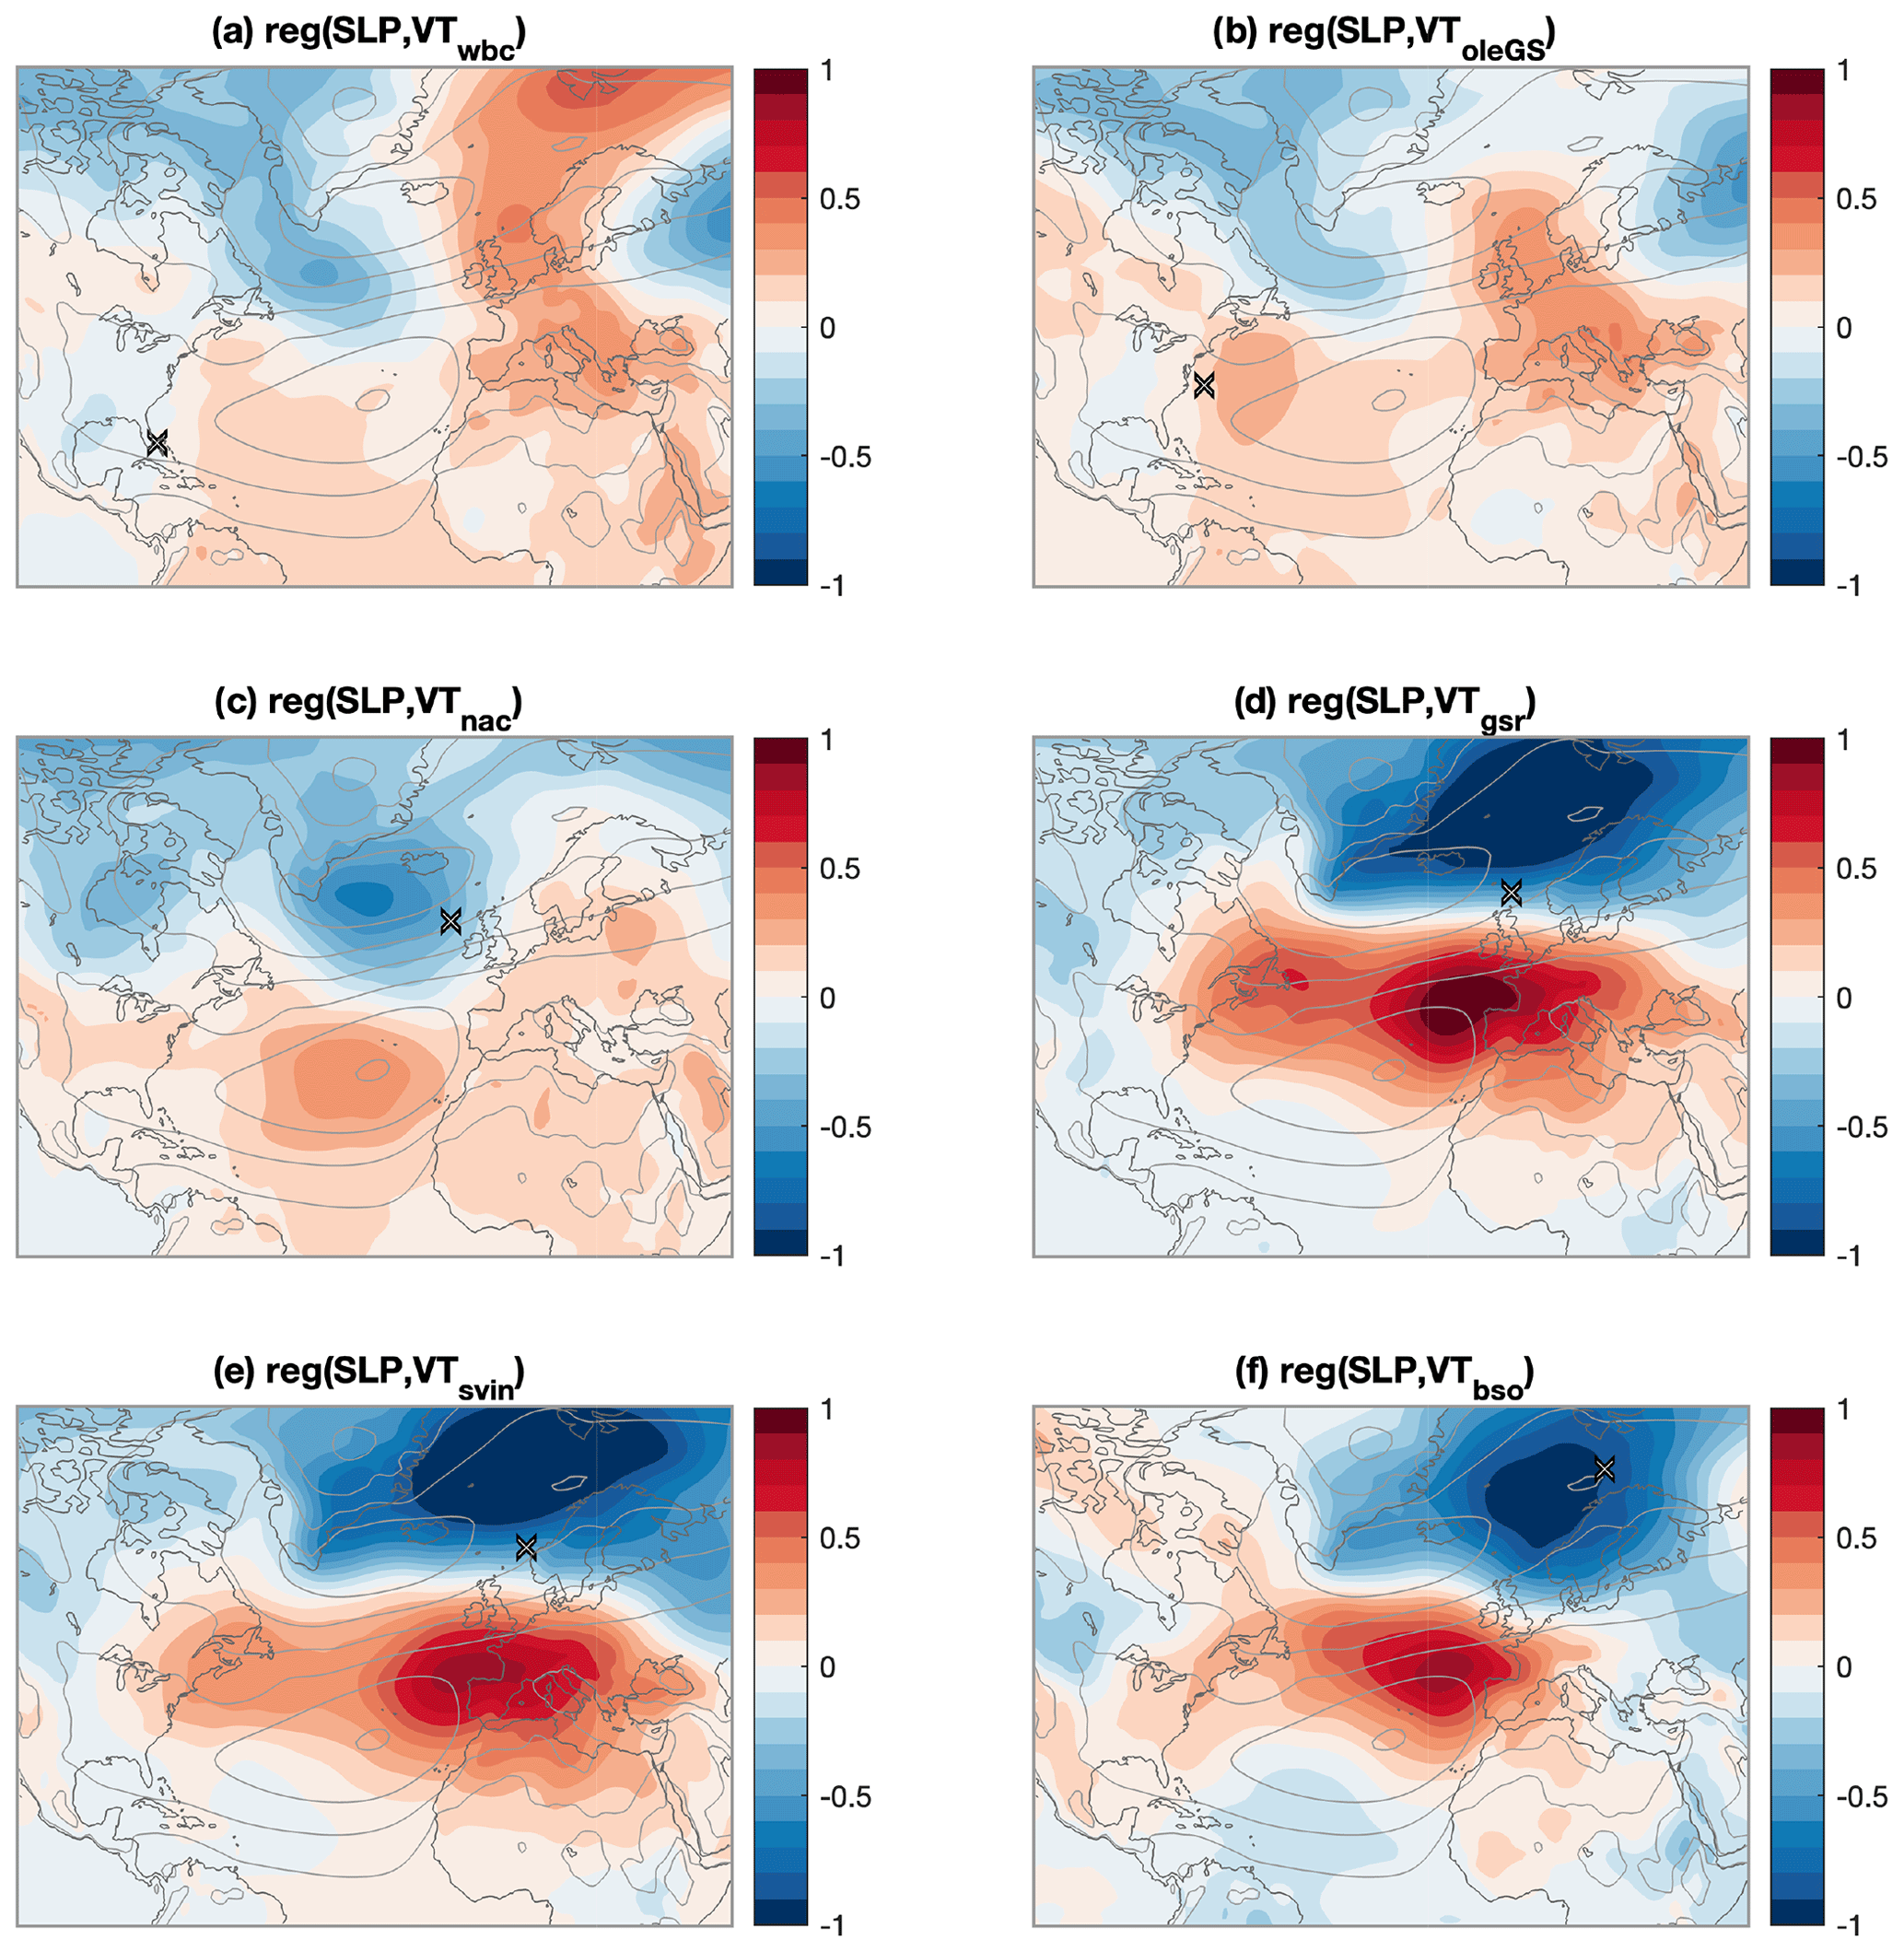
Figure 5Transport variability and large-scale atmospheric circulation patterns. Annual mean sea level pressure (SLP; hPa) regressed onto annual mean volume transport (VT; Sv) time series in ECCOv4-r4; (a) Western Boundary Current at 26.5° N (wbc), (b) Gulf Stream at the Oleander section (oleGS), (c) North Atlantic Current at OSNAP-East (nac), (d) Greenland-Scotland Ridge inflow (gsr), (e) NwASC at Svinøy (svin), and (f) Barents Sea Opening (bso). The volume transport time series have been normalized for comparable magnitudes between the panels. The unit is hPa per standard deviation of volume transport. The major features in the regression patterns discussed are significant at the 90 % confidence level (Ebisuzaki, 1997). Gray contour lines show the climatological SLP pattern (contour interval: every 3 hPa from 1007 to 1019 hPa). The crosses mark the approximate locations for the volume transport time series.
For the subtropical ocean transports, a low-pressure anomaly over the Labrador Sea and a basin-wide high-pressure anomaly over the subtropics are associated with a stronger Gulf Stream on interannual timescales (Fig. 5a–b). Previously, Baringer and Larsen (2001) found a negative correlation between the Florida Current strength and the NAO on interannual timescales, but the relationship was only seen to hold for the period 1986–1998 (Meinen et al., 2010; Sanchez-Franks et al., 2014). Rather than the NAO and associated shifts in the latitude and strength of the climatological sea level pressure pattern, Hameed et al. (2021) find a link between the longitudinal position of the Icelandic Low and Florida Current transport at zero lag time (). When perturbing the ECCOv4-r4 state estimate with the onshore wind stress anomalies associated with an eastward-shifted Icelandic Low, they get a sea level increase along the North American coast and a weakened Florida Current. The pattern seen in Fig. 5a–b associated with a strengthened Gulf Stream resembles a westward shift of the Icelandic Low and is thus consistent with the mechanism in Hameed et al. (2021), previously also shown to be important for shifts in the Gulf Stream northern boundary (Sanchez-Franks et al., 2016). However, we note that several mechanisms not addressed here are thought to contribute to interannual variability in the Florida Current, such as eddy activity east of The Bahamas (Frajka-Williams et al., 2013), excursions of the Loop Current upstream (Hirschi et al., 2019), and El Niño–Southern Oscillation (ENSO) (Dong et al., 2022).
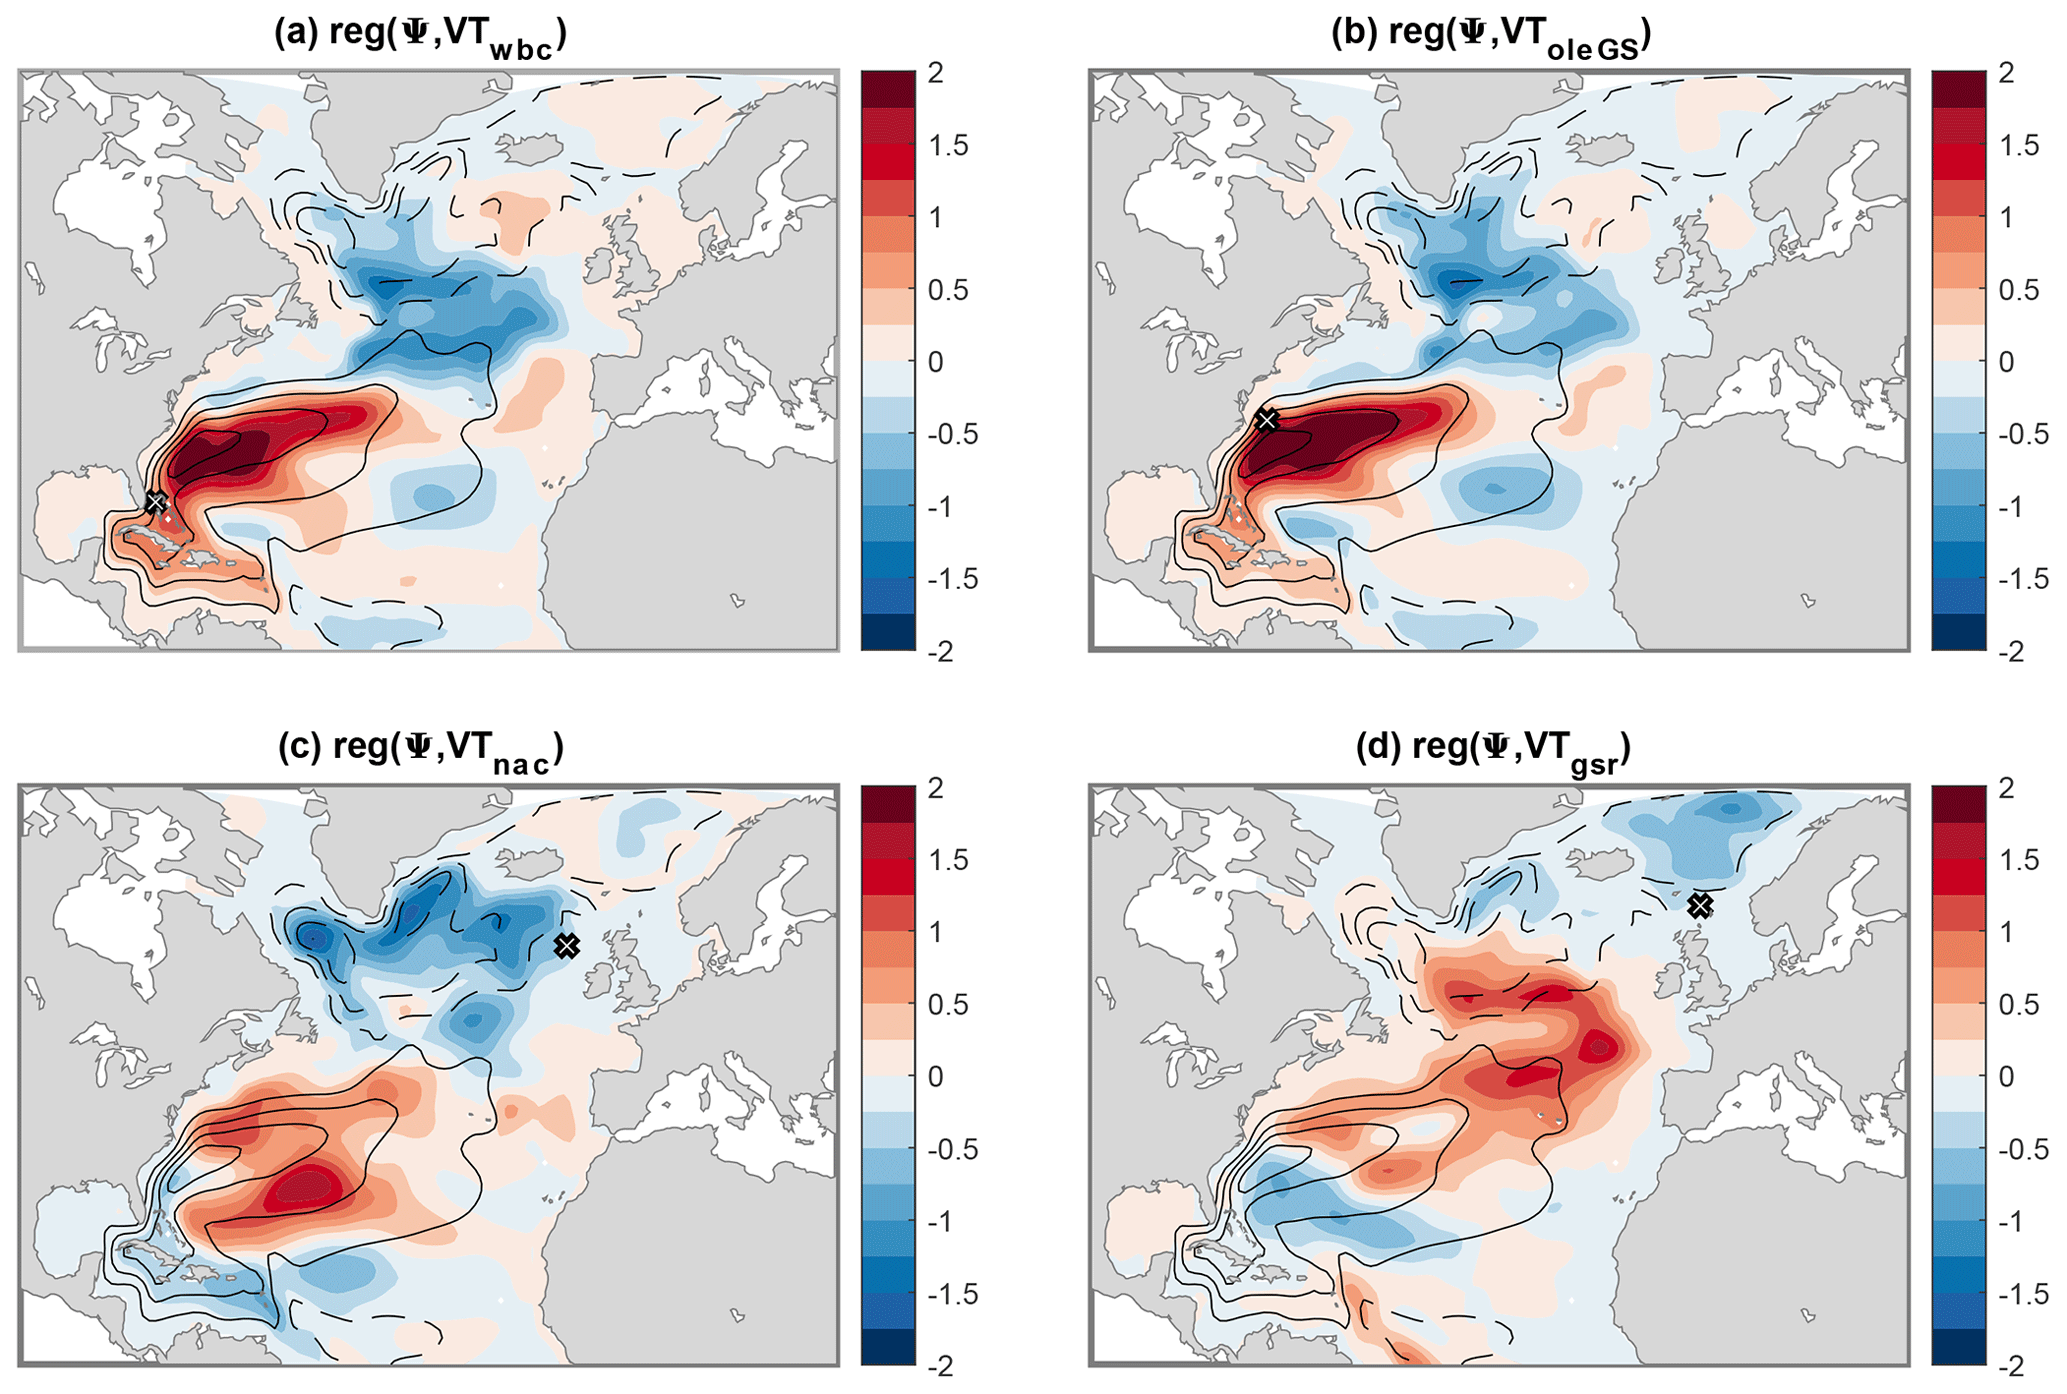
Figure 6Transport variability and large-scale oceanic circulation patterns. Annual mean barotropic streamfunction (ψ; Sv) regressed onto annual mean volume transport (VT; Sv) time series in ECCOv4-r4; (a) Western Boundary Current at 26.5° N (wbc), (b) Gulf Stream at Oleander section (oleGS), (c) North Atlantic Current at OSNAP-East (nac), and (d) Greenland-Scotland Ridge inflow (gsr). The volume transport time series have been normalized for comparable magnitudes between the panels. Unit is Sv per standard deviation of volume transport. Gray contour lines show the climatological barotropic streamfunction pattern (dashed line where ψ takes negative values). The crosses mark the approximate locations for the volume transport time series. The major features in the regression patterns discussed are significant at the 90 % confidence level (Ebisuzaki, 1997).
For the North Atlantic Current across OSNAP-East, an increased transport is associated with a strengthened climatological sea level pressure pattern resembling the NAO in a positive state (NAO+; Fig. 5c). On interannual timescales, the pattern likely relates to locally strengthened westerly winds which strengthen the subpolar gyre as seen in the associated barotropic streamfunction in Fig. 6c. In ECCOv4-r4, a strengthened North Atlantic Current across OSNAP-East thus reflects a stronger subpolar gyre but does not necessarily lead to a strengthened inflow across the Greenland-Scotland Ridge or a strengthened Nordic Seas gyre. The finding is consistent with the weak correlations between the North Atlantic Current and the downstream components in Table 2. The decadal trends in the North Atlantic Current (Fig. 4b) agree with multiple subpolar gyre indices indicating a weakening subpolar gyre from the mid-1990s to 2005, followed by a strengthening (Koul et al., 2020). The evolution fits with the accumulated historic NAO forcing seen in Fig. S9, which is consistent with persistent NAO+ conditions spinning up the subpolar gyre due to strengthened wind stress curl and elevated heat loss (Eden and Willebrand, 2001; Sarafanov, 2009).
The sea level pressure pattern associated with a strong Greenland-Scotland Ridge inflow (Fig. 5d) mainly arises from the Faroe-Shetland Channel component which dominates the net inflow variability (Fig. S2a). The pattern in Fig. 5d shows a strengthened and northeastward-shifted Icelandic Low and Azores High, which is near identical to the equivalent regressions for the Svinøy and Barents Sea Opening sections (Fig. 5e–f). The northeastward shift suggests a corresponding shift of the westerlies and the storm tracks. From previous studies, it is well established that the Faroe-Shetland Channel inflow typically increases under NAO+ conditions due to a strengthened sea surface height gradient across the channel (e.g., Chafik, 2012; Bringedal et al., 2018). Regressing ERA5 sea level pressure onto the observational Faroe-Shetland Channel volume transport shows a more canonical NAO+ anomaly consistent with previous studies (not shown). For variability at the Svinøy section, the relationship with the NAO is less straightforward and known to be more closely associated with the position of the westerlies rather than the strength (Orvik, 2022). More low-pressure systems directed into the Nordic Seas due to a northeastward-shifted storm track strengthen the southwesterly winds along the Norwegian coast, and this sets up onshore Ekman transport and piling along the coast which in turn strengthens the Norwegian Atlantic Slope Current (Skagseth and Orvik, 2002; Richter et al., 2009). The barotropic streamfunction anomaly associated with a stronger Greenland-Scotland Ridge inflow (and Svinøy and Barents Sea Opening components) is a strengthened Nordic Seas gyre (Fig. 6d). Moreover, the anticyclonic anomaly in the inter-gyre region seen in Fig. 6d can be interpreted as a more tilted North Atlantic Current (Marshall et al., 2001), which potentially means that more water crosses the Greenland-Scotland Ridge and less recirculates within the subpolar gyre.
We do find relatively straightforward relationships between regional atmospheric circulation (represented by sea level pressure) and the section volume transports. These zero-lag regressions (Fig. 5) are likely most representative of sea level pressure patterns related to ocean circulation's relative immediate barotropic response to anomalous atmospheric forcing (e.g., Eden and Willebrand, 2001). It should be noted that the ocean responds to the atmosphere on a range of timescales and also influences the atmosphere through feedback mechanisms (Marshall et al., 2001).
The barotropic streamfunction anomaly patterns (Fig. 6) indicate that strong transports at the individual sections are typically associated with a strengthened gyre structure locally, with little sign of the other two gyres strengthening simultaneously. This suggests that recirculation and branching within the three major gyres is likely a key factor in explaining the lack of coherence between the northward transport within each gyre structure. For instance, downstream of the 95 Sv in the Gulf Stream core at Oleander, substantial subtropical recirculation occurs (Mann, 1967; Meinen and Watts, 2000) as well as mixing with subpolar water masses (e.g., Brambilla et al., 2008) before the North Atlantic Current transports roughly 20 Sv across OSNAP-East. Of the 20 Sv crossing OSNAP-East, only 7–8 Sv crosses the Greenland-Scotland Ridge, meaning that roughly 50 % of the water recirculates within the subpolar gyre (Table 1). Our results thus indicate that while the subtropical gyre, subpolar gyre, and Nordic Seas gyre are connected through the northward transport of subtropical-origin water, they are disconnected by the recirculation within the gyres (Fig. 7).
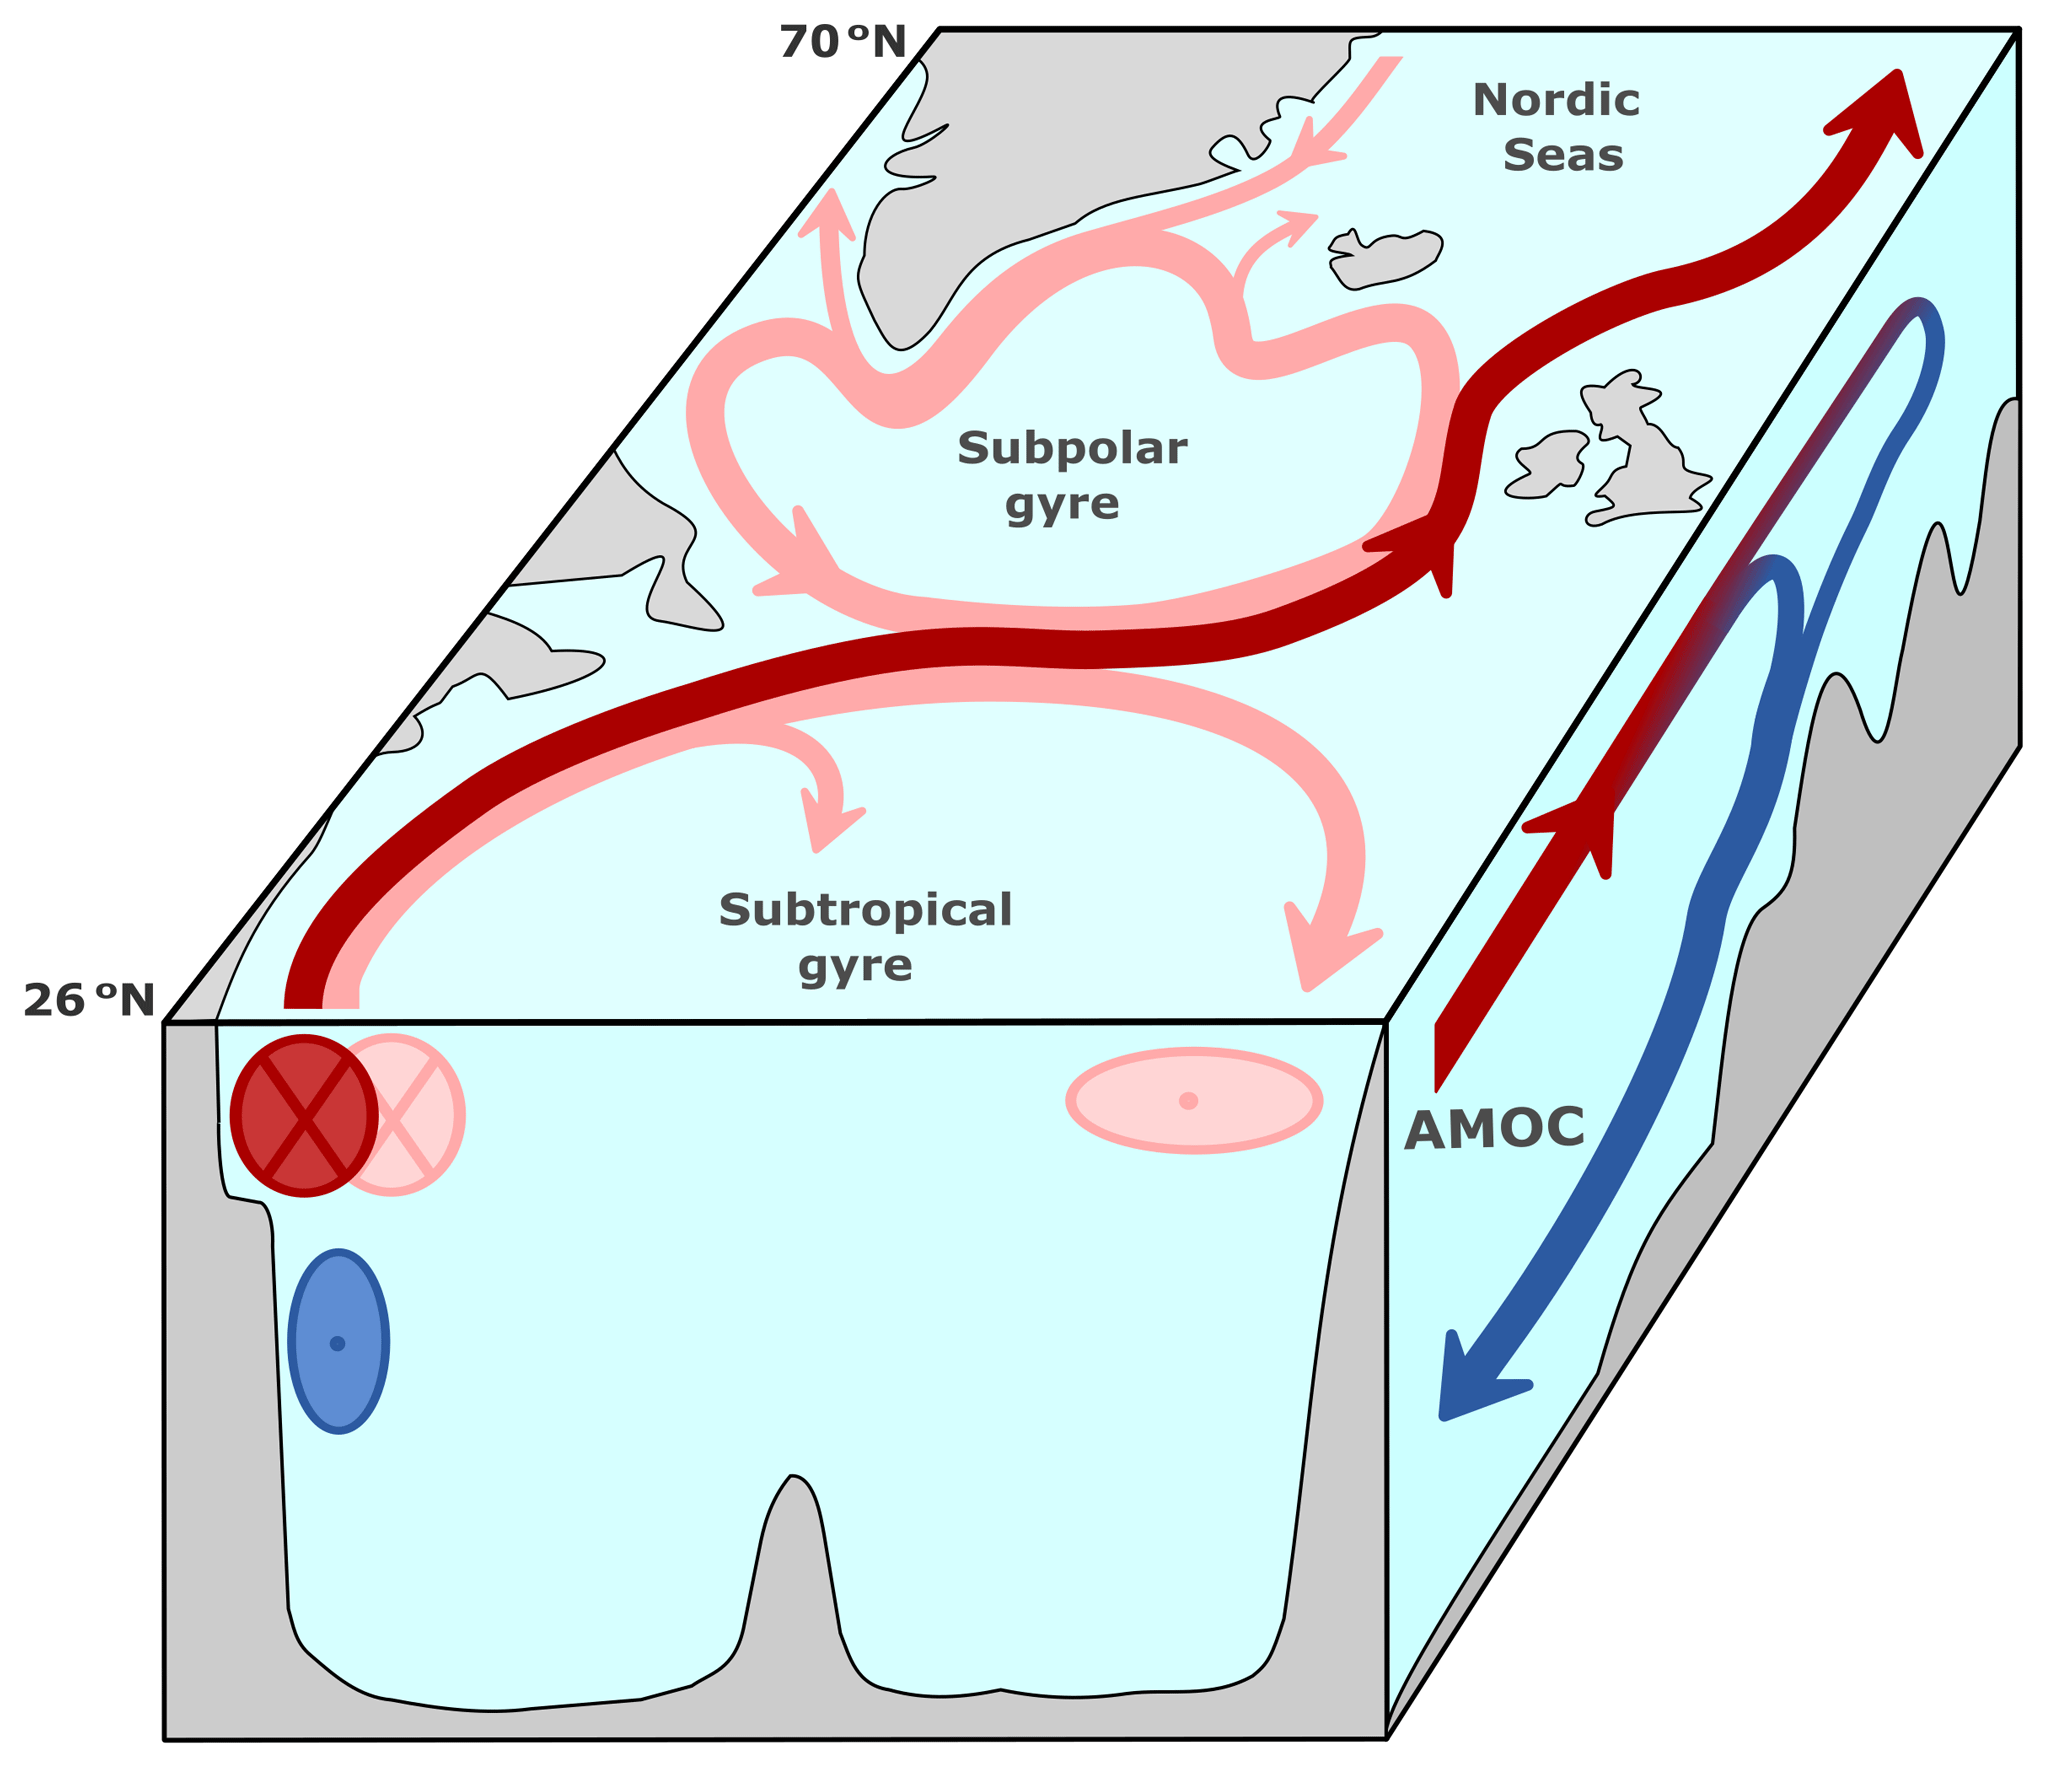
Figure 7Idealized view of the North Atlantic and Nordic Seas circulation. The Gulf Stream system is connected through the northward transport of subtropical-origin water (red color) but disconnected by recirculation within the gyre structures (pink color). Seen from a mass-balance perspective at 26° N, the Gulf Stream is shown using two circles highlighting it partly compensating for the Deep Western Boundary Current and partly being the western boundary of the wind-driven subtropical gyre. The Deep Western Boundary Current flowing south is represented by the blue circle at depth. The zonally integrated view of the circulation is shown on the side, illustrating warm upper-ocean water being gradually transformed and sinking at high latitudes as a part of the AMOC.
In this study, we have synthesized available ocean transport measurements and the ECCOv4-r4 ocean state estimate to investigate variability within the Gulf Stream system on interannual to decadal timescales. We find little coherence between the observational records at different latitudes on interannual timescales (Table 2). In the ECCOv4-r4 estimate, we find evidence of regional coherence, with subtropical variability being distinct from subpolar and Nordic Seas variability. These findings also translate to decadal timescales, where in ECCOv4-r4 we find a weakening Florida Current at 26.5° N and Gulf Stream at the Oleander section after the mid-2000s, while the Nordic Seas inflow and circulation remain stable or strengthened (Table 3, Fig. 4b).
A higher degree of coherence within the ECCOv4-r4 framework compared to the observational records can be due to a number of reasons. Firstly, the overlapping time periods between some of the observational records are short, making the threshold for significance high. Secondly, ECCOv4-r4 has a coarse model grid which will smooth high-frequency variability from, for instance, eddies. Thirdly, just as models have their biases, observational records have observation errors related to calibration, sampling, and system design (e.g., McCarthy et al., 2015), which potentially could hide a more meridionally coherent signal.
The limited coherence across the subtropical, subpolar, and Nordic Seas gyres identified here highlights the role of local oceanic response to atmospheric circulation patterns. Specifically, transport variability within the gyres is associated with variability in the position and strength of the Azores High and the Icelandic Low (Fig. 5), meaning that regional atmospheric circulation patterns are a major influence at the observation locations through strengthening or weakening the different gyres. Removing the Ekman layer transports from the analysis does not notably increase covariance between the sections on interannual timescales (Table S1), meaning that it is not simply transport anomalies in the Ekman layer that overshadow a more meridionally coherent signal. While we focus on upper-ocean transports in the Gulf Stream system, our findings agree with observed (Lozier et al., 2010; Frajka-Williams et al., 2019; Moat et al., 2020; Jackson et al., 2022) and simulated (Bingham et al., 2007; Gu et al., 2020) patterns of disconnect between the subpolar and subtropical AMOC, highlighting different overturning behaviors between the gyres (Fig. 7).
While observations and models show that ocean heat anomalies and other tracers can propagate persistently poleward through the North Atlantic Ocean, leading to potential for skillful climate prediction (e.g., Keenlyside et al., 2008; Årthun et al., 2017), our results herein indicate that volume transport anomalies do not. Therefore, the mechanism by which the gyres exchange, for instance, heat anomalies, remains unclear and is thus a challenge to address when following up on the present study.
In climate models, the Gulf Stream is projected to weaken over the 21st century as both the Deep Western Boundary Current and the subtropical gyre circulation weakens (Beadling et al., 2018; Asbjørnsen and Årthun, 2023). Being limited to interannual-decadal timescales, we are unable to determine how the observational trends over the respective measurement periods (Table 3) relate to anthropogenic forcing. We note, however, that none of the circulation branches display any signs of past or near-future collapse. The RAPID record, moreover, shows that sizable shorter-term trends such as the reduced overturning between 2006 and 2010 (Fig. S2c) can occur from oceanic adjustments to surface wind forcing (Roberts et al., 2013; Zhao and Johns, 2014; Kostov et al., 2021).
In finding little coherence between the gyre structures on interannual to decadal timescales, our results reinforce the need for caution in inferring large-scale circulation change from single observational records within the timescales that are currently resolved. Improved mechanistic understanding of the variability and continued monitoring of the circulation at a range of latitudes is therefore required to predict and detect emerging trends.
The ECCOv4-r4 ocean state estimate (ECCO Consortium et al., 2021) is available at https://doi.org/10.5281/zenodo.3765928. ERA5 reanalysis data (Hersbach et al., 2020) are available at https://doi.org/10.24381/cds.f17050d7 (Hersbach et al., 2023). Observational Barents Sea Opening volume transports are available at https://doi.org/10.21335/NMDC-1838527821 (Ingvaldsen et al., 2020). Svinøy mooring data (Orvik 2022) are available through the Norwegian Marine Data Center (http://metadata.nmdc.no/UserInterface, last access: 11 June 2024, search word “GFI mooring data – SVI”). Greenland-Scotland Ridge volume transports (Østerhus et al., 2019) are available online at http://www.oceansites.org/tma/gsr.html. The OSNAP observational data (Fu et al., 2023a) are available at https://doi.org/10.35090/gatech/70342 (Fu et al., 2023b) through the Overturning in the Subpolar North Atlantic Program. Oleander section volume fluxes (Rossby et al., 2019) are available at https://oleander.bios.asu.edu/data/oleander-fluxes/ through the Oleander Project. The RAPID-MOCHA-WBTS observational data (Moat et al., 2022) are available at https://doi.org/10.5285/e91b10af-6f0a-7fa7-e053-6c86abc05a09 through the RAPID-Meridional Overturning Circulation and Heatflux Array-Western Boundary Time Series program. The Florida Current volume transports (Meinen et al., 2010) are available on the Atlantic Oceanographic and Meteorological Laboratory web page (https://www.aoml.noaa.gov/phod/floridacurrent/) through the DOC-NOAA Climate Program Office – Ocean Observing and Monitoring Division.
The supplement related to this article is available online at: https://doi.org/10.5194/os-20-799-2024-supplement.
HA, TE, and HLJ defined the overall research problem and methodology. HA carried out the analysis and led the writing of the manuscript. JS developed the conceptual figure (Fig. 7) and contributed to Fig. 1. All coauthors discussed the analysis, refined the methodology, and contributed to the text.
The contact author has declared that none of the authors has any competing interests.
Publisher’s note: Copernicus Publications remains neutral with regard to jurisdictional claims made in the text, published maps, institutional affiliations, or any other geographical representation in this paper. While Copernicus Publications makes every effort to include appropriate place names, the final responsibility lies with the authors.
We acknowledge the teams behind the RAPID-MOCHA-WBTS projects, Oleander Project, OSNAP program, AtlantOS project, and the Norwegian Institute of Marine Research for collecting and making data freely available. We thank David Smeed and Tom Rossby for kindly sharing updated records for the Western Boundary Current at 26.5N and the Oleander section, respectively. We thank Kjell Arild Orvik and Algot Pedersen for sharing their knowledge about the Svinøy record and the most recent data. We would also like to thank the Bjerknes Centre's DYNASOR project for useful discussions on concept and analysis.
This research has been supported by the Research Council of Norway's project Nansen Legacy (grant no. 276730) and the NERC NSF SNAP DRAGON project (grant no. NE/T013494/1).
This paper was edited by Agnieszka Beszczynska-Möller and reviewed by Christopher Piecuch and one anonymous referee.
Årthun, M., Eldevik, T., Viste, E., Drange, H., Furevik, T., Johnson, H. L., and Keenlyside, N. S.: Skillful prediction of northern climate provided by the ocean, Nat. Commun., 8, 15875, https://doi.org/10.1038/ncomms15875, 2017. a
Årthun, M., Asbjørnsen, H., Chafik, L., Johnson, H. L., and Våge, K.: Future strengthening of the Nordic Seas overturning circulation, Nat. Commun., 14, 2065, https://doi.org/10.1038/s41467-023-37846-6, 2023. a
Asbjørnsen, H. and Årthun, M.: Deconstructing Future AMOC Decline at 26.5°N, Geophys. Res. Lett., 50, e2023GL103515, https://doi.org/10.1029/2023GL103515, 2023. a, b
Asbjørnsen, H., Årthun, M., Skagseth, Ø., and Eldevik, T.: Mechanisms of ocean heat anomalies in the Norwegian Sea, J. Geophys. Res.-Oceans, 124, 2908–2923, https://doi.org/10.1029/2018JC014649, 2019. a, b
Asbjørnsen, H., Johnson, H. L., and Årthun, M.: Variable Nordic Seas inflow linked to shifts in North Atlantic circulation, J. Climate, 34, 1–50, https://doi.org/10.1175/JCLI-D-20-0917.1, 2021. a
Baehr, J., Keller, K., and Marotzke, J.: Detecting potential changes in the meridional overturning circulation at 26˚N in the Atlantic, Climatic Change, 91, 11–27, https://doi.org/10.1007/s10584-006-9153-z, 2008. a, b
Baringer, M. O. and Larsen, J. C.: Sixteen years of Florida Current Transport at 27°N, Geophys. Res. Lett., 28, 3179–3182, https://doi.org/10.1029/2001GL013246, 2001. a, b
Beadling, R. L., Russell, J. L., Stouffer, R. J., and Goodman, P. J.: Evaluation of Subtropical North Atlantic Ocean Circulation in CMIP5 Models against the Observational Array at 26.5°N and Its Changes under Continued Warming, J. Climate, 31, 9697–9718, https://doi.org/10.1175/JCLI-D-17-0845.1, 2018. a
Berx, B., Hansen, B., Østerhus, S., Larsen, K. M., Sherwin, T., and Jochumsen, K.: Combining in situ measurements and altimetry to estimate volume, heat and salt transport variability through the Faroe–Shetland Channel, Ocean Sci., 9, 639–654, https://doi.org/10.5194/os-9-639-2013, 2013. a
Bingham, R. J., Hughes, C. W., Roussenov, V., and Williams, R. G.: Meridional coherence of the North Atlantic meridional overturning circulation, Geophys. Res. Lett., 34, L23606, https://doi.org/10.1029/2007GL031731, 2007. a, b, c
Brambilla, E., Talley, L. D., and Robbins, P. E.: Subpolar Mode Water in the northeastern Atlantic: 2. Origin and transformation, J. Geophys. Res., 113, C04026, https://doi.org/10.1029/2006JC004063, 2008. a
Bringedal, C., Eldevik, T., Skagseth, Ø., Spall, M. A., and Østerhus, S.: Structure and Forcing of Observed Exchanges across the Greenland-Scotland Ridge, J. Climate, 31, 9881–9901, https://doi.org/10.1175/JCLI-D-17-0889.1, 2018. a
Caesar, L., Rahmstorf, S., Robinson, A., Feulner, G., and Saba, V.: Observed fingerprint of a weakening Atlantic Ocean overturning circulation, Nature, 556, 191–196, https://doi.org/10.1038/s41586-018-0006-5, 2018. a
Caesar, L., McCarthy, G. D., Thornalley, D. J. R., Cahill, N., and Rahmstorf, S.: Current Atlantic Meridional Overturning Circulation weakest in last millennium, Nat. Geosci., 14, 118–120, https://doi.org/10.1038/s41561-021-00699-z, 2021. a
Caínzos, V., Hernández‐Guerra, A., McCarthy, G. D., McDonagh, E. L., Armas, M. C., and Pérez-Hernández, M. D.: Thirty years of GOSHIP and WOCE data: Atlantic Overturning of mass, heat and freshwater transport, Geophys. Res. Lett., 49, e2021GL096527, https://doi.org/10.1029/2021GL096527, 2022. a
Chafik, L.: The response of the circulation in the Faroe-Shetland Channel to the North Atlantic Oscillation, Tellus, 64, 18423, https://doi.org/10.3402/tellusa.v64i0.18423, 2012. a
Chelton, D. B.: Effects of sampling errors in statistical estimation, Deep-Sea Res. Pt. I, 30, 1083–1103, https://doi.org/10.1016/0198-0149(83)90062-6, 1983. a, b
Chi, L., Wolfe, C. L., and Hameed, S.: Reconsidering the Relationship Between Gulf Stream Transport and Dynamic Sea Level at U.S. East Coast, Geophys. Res. Lett., 50, e2022GL102018, https://doi.org/10.1029/2022GL102018, 2023. a
Cunningham, S. A., Kanzow, T., Rayner, D., Baringer, M. O., Johns, W. E., Marotzke, J., Longworth, H. R., Grant, E. M., J-M Hirschi, J., Beal, L. M., Meinen, C. S., and Bryden, H. L.: Temporal Variability of the Atlantic Meridional Overturning Circulation at 26.5°N, Science, 317, 935–937, https://doi.org/10.1126/science.1141304, 2007. a, b, c
Daniault, N., Mercier, H., Lherminier, P., Sarafanov, A., Falina, A., Zunino, P., Pérez, F. F., Ríos, A. F., Ferron, B., Huck, T., Thierry, V., and Gladyshev, S.: The northern North Atlantic Ocean mean circulation in the early 21st century, Prog. Oceanogr., 146, 142–158, https://doi.org/10.1016/J.POCEAN.2016.06.007, 2016. a
Desbruyères, D., Chafik, L., and Maze, G.: A shift in the ocean circulation has warmed the subpolar North Atlantic Ocean since 2016, Commun. Earth Environ., 2, 48, https://doi.org/10.1038/s43247-021-00120-y, 2021. a
Dong, S., Volkov, D. L., Goni, G., Pujiana, K., Tagklis, F., and Baringer, M.: Remote Impact of the Equatorial Pacific on Florida Current Transport, Geophys. Res. Lett., 49, e2021GL096944, https://doi.org/10.1029/2021GL096944, 2022. a
Ebisuzaki, W.: A Method to Estimate the Statistical Significance of a Correlation When the Data Are Serially Correlated, J. Climate, 10, 2147–2153, https://doi.org/10.1175/1520-0442(1997)010<2147:AMTETS>2.0.CO;2, 1997. a, b
ECCO Consortium, Fukumori, I., Wang, O., Fenty, I., Forget, G., Heimbach, P., and Ponte, R. M.: Synopsis of the ECCO Central Production Global Ocean and Sea-Ice State Estimate, Version 4 Release 4, Zenodo, https://doi.org/10.5281/zenodo.3765928, 2021. a, b
Eden, C. and Willebrand, J.: Mechanism of Interannual to Decadal Variability of the North Atlantic Circulation, J. Climate, 14, 2266–2280, https://doi.org/10.1175/1520-0442(2001)014<2266:MOITDV>2.0.CO;2, 2001. a, b, c
Evans, D. G., Toole, J., Forget, G., Zika, J. D., Naveira Garabato, A. C., Nurser, A. J. G., and Yu, L.: Recent Wind-Driven Variability in Atlantic Water Mass Distribution and Meridional Overturning Circulation, J. Phys. Oceanogr., 47, 633–647, https://doi.org/10.1175/JPO-D-16-0089.1, 2017. a
Flagg, C. N., Schwartze, G., Gottlieb, E., and Rossby, T.: Operating an Acoustic Doppler Current Profiler aboard a Container Vessel, J. Atmos. Ocean. Tech., 15, 257–271, https://doi.org/10.1175/1520-0426(1998)015<0257:OAADCP>2.0.CO;2, 1998. a
Forget, G., Campin, J.-M., Heimbach, P., Hill, C. N., Ponte, R. M., and Wunsch, C.: ECCO version 4: an integrated framework for non-linear inverse modeling and global ocean state estimation, Geosci. Model Dev., 8, 3071–3104, https://doi.org/10.5194/gmd-8-3071-2015, 2015. a
Fox, A. D., Handmann, P., Schmidt, C., Fraser, N., Rühs, S., Sanchez-Franks, A., Martin, T., Oltmanns, M., Johnson, C., Rath, W., Holliday, N. P., Biastoch, A., Cunningham, S. A., and Yashayaev, I.: Exceptional freshening and cooling in the eastern subpolar North Atlantic caused by reduced Labrador Sea surface heat loss, Ocean Sci., 18, 1507–1533, https://doi.org/10.5194/os-18-1507-2022, 2022. a
Frajka-Williams, E., Johns, W. E., Meinen, C. S., Beal, L. M., and Cunningham, S. A.: Eddy impacts on the Florida Current, Geophys. Res. Lett., 40, 349–353, https://doi.org/10.1002/grl.50115, 2013. a
Frajka-Williams, E., Ansorge, I. J., Baehr, J., Bryden, H. L., Chidichimo, M. P., Cunningham, S. A., Danabasoglu, G., Dong, S., Donohue, K. A., Elipot, S., Heimbach, P., Holliday, N. P., Hummels, R., Jackson, L. C., Karstensen, J., Lankhorst, M., Le Bras, I. A., Lozier, M. S., McDonagh, E. L., Meinen, C. S., Mercier, H., Moat, B. I., Perez, R. C., Piecuch, C. G., Rhein, M., Srokosz, M. A., Trenberth, K. E., Bacon, S., Forget, G., Goni, G., Kieke, D., Koelling, J., Lamont, T., McCarthy, G. D., Mertens, C., Send, U., Smeed, D. A., Speich, S., van den Berg, M., Volkov, D., and Wilson, C.: Atlantic Meridional Overturning Circulation: Observed Transport and Variability, Front. Mar. Sci., 6, 260, https://doi.org/10.3389/fmars.2019.00260, 2019. a
Frajka-Williams, E., Foukal, N., and Danabasoglu, G.: Should AMOC observations continue: how and why?, Philosophical Transactions of the Royal Society A, 381, https://doi.org/10.1098/RSTA.2022.0195, 2023. a
Fraser, N. J. and Cunningham, S. A.: 120 years of AMOC variability reconstructed from observations using the Bernoulli inverse, Geophys. Res. Lett., 48, e2021GL093893, https://doi.org/10.1029/2021GL093893, 2021. a, b
Fu, Y., Li, F., Karstensen, J., and Wang, C.: A stable Atlantic Meridional Overturning Circulation in a changing North Atlantic Ocean since the 1990s, Sci. Adv., 6, 7836–7863, 2020. a
Fu, Y., Lozier, M. S., Biló, T. C., Bower, A. S., Cunningham, S. A., Cyr, F., de Jong, M. F., deYoung, B., Drysdale, L., Fraser, N., Fried, N., Furey, H. H., Han, G., Handmann, P., Holliday, N. P., Holte, J., Inall, M. E., Johns, W. E., Jones, S., Karstensen, J., Li, F., Pacini, A., Pickart, R. S., Rayner, D., Straneo, F., and Yashayaev, I.: Seasonality of the Meridional Overturning Circulation in the subpolar North Atlantic, Commun. Earth Environ., 4, 181, https://doi.org/10.1038/s43247-023-00848-9, 2023a. a, b, c
Fu, Y., Lozier, M. S., Biló, T., Bower A., Cunningham, S., Cyr, F., de Jong, M., deYoung, B., Drysdale, L., Fraser, N., Fried, N., Furey, H., Han, G., Handmann, P., Holliday, N., Holte, J., Inall, M., Johns, W., Jones, S., Karstensen, J., Li, F., Pacini, A., Pickart, R., Rayner, D., Straneo, F., and Yashayaev, I.: Meridional Overturning Circulation Observed by the Overturning in the Subpolar North Atlantic Program (OSNAP) Array from August 2014 to June 2020, Georgia Tech Digital Repository [data set], https://doi.org/10.35090/gatech/70342, 2023b. a
Gu, S., Liu, Z., and Wu, L.: Time Scale Dependence of the Meridional Coherence of the Atlantic Meridional Overturning Circulation, J. Geophys. Res.-Oceans, 125, e2019JC015838, https://doi.org/10.1029/2019JC015838, 2020. a, b
Hamed, K. H. and Rao, R. A.: A modified Mann-Kendall trend test for autocorrelated data, J. Hydrol., 204, 182–196, https://doi.org/10.1016/S0022-1694(97)00125-X, 1997. a, b
Hameed, S., Wolfe, C. L. P., and Chi, L.: Icelandic Low and Azores High Migrations Impact Florida Current Transport in Winter, J. Phys. Oceanogr., 51, 3135–3147, https://doi.org/10.1175/JPO-D-20-0108.1, 2021. a, b
Han, L.: Exploring the AMOC Connectivity Between the RAPID and OSNAP Lines With a Model-Based Data Set, Geophys. Res. Lett., 50, e2023GL105225, https://doi.org/10.1029/2023GL105225, 2023. a
Hansen, B., Larsen, K. M. H., Hátún, H., Kristiansen, R., Mortensen, E., and Østerhus, S.: Transport of volume, heat, and salt towards the Arctic in the Faroe Current 1993–2013, Ocean Sci., 11, 743–757, https://doi.org/10.5194/os-11-743-2015, 2015. a
Hansen, B., Húsgarð Larsen, K. M., Hátún, H., and Østerhus, S.: A stable Faroe Bank Channel overflow 1995–2015, Ocean Sci., 12, 1205–1220, https://doi.org/10.5194/os-12-1205-2016, 2016. a
Heimbach, P., Hill, C., and Giering, R.: An efficient exact adjoint of the parallel MIT General Circulation Model, generated via automatic differentiation, Future Gener. Comp. Sy., 21, 1356–1371, https://doi.org/10.1016/J.FUTURE.2004.11.010, 2005. a
Hersbach, H., Bell, B., Berrisford, P., Hirahara, S., Horányi, A., Muñoz‐Sabater, J., Nicolas, J., Peubey, C., Radu, R., Schepers, D., Simmons, A., Soci, C., Abdalla, S., Abellan, X., Balsamo, G., Bechtold, P., Biavati, G., Bidlot, J., Bonavita, M., Chiara, G., Dahlgren, P., Dee, D., Diamantakis, M., Dragani, R., Flemming, J., Forbes, R., Fuentes, M., Geer, A., Haimberger, L., Healy, S., Hogan, R. J., Hólm, E., Janisková, M., Keeley, S., Laloyaux, P., Lopez, P., Lupu, C., Radnoti, G., Rosnay, P., Rozum, I., Vamborg, F., Villaume, S., and Thépaut, J.: The ERA5 global reanalysis, Q. J. Roy. Meteor. Soc., 146, 1999–2049, https://doi.org/10.1002/qj.3803, 2020. a, b
Hersbach, H., Bell, B., Berrisford, P., Biavati, G., Horányi, A., Muñoz Sabater, J., Nicolas, J., Peubey, C., Radu, R., Rozum, I., Schepers, D., Simmons, A., Soci, C., Dee, D., Thépaut, J.-N.: ERA5 monthly averaged data on single levels from 1940 to present, Copernicus Climate Change Service (C3S) Climate Data Store (CDS) [data set], https://doi.org/10.24381/cds.f17050d7, 2023. a
Hirschi, J. J.-M., Frajka-Williams, E., Blaker, A. T., Sinha, B., Coward, A., Hyder, P., Biastoch, A., Böning, C., Barnier, B., Penduff, T., Garcia, I., Fransner, F., and Madec, G.: Loop Current Variability as Trigger of Coherent Gulf Stream Transport Anomalies, J. Phys. Oceanogr., 49, 2115–2132, https://doi.org/10.1175/JPO-D-18-0236.1, 2019. a
Hogg, N. G.: On the transport of the Gulf Stream between Cape Hatteras and the Grand Banks, Deep-Sea Res. Pt. I, 39, 1231–1246, https://doi.org/10.1016/0198-0149(92)90066-3, 1992. a
Ingvaldsen, R. B., Loeng, H., and Asplin, L.: Variability in the Atlantic inflow to the Barents Sea based on a one-year time series from moored current meters, Cont. Shelf Res., 22, 505–519, https://doi.org/10.1016/S0278-4343(01)00070-X, 2002. a
Ingvaldsen, R. B., Asplin, L., and Loeng, H.: Velocity field of the western entrance to the Barents Sea, J. Geophys. Res.-Oceans, 109, C03021, https://doi.org/10.1029/2003JC001811, 2004. a, b, c
Ingvaldsen, R.: Mooring data from the Barents Sea Opening – Atlantic Water inflow, Norwegian Marine Data Centre [data set], https://doi.org/10.21335/NMDC-1838527821, 2020. a
Jackson, L. C., Biastoch, A., Buckley, M. W., Desbruyères, D. G., Frajka-Williams, E., Moat, B., and Robson, J.: The evolution of the North Atlantic Meridional Overturning Circulation since 1980, Nat. Rev. Earth Environ., 3, 241–254, https://doi.org/10.1038/s43017-022-00263-2, 2022. a, b, c, d
Jochumsen, K., Moritz, M., Nunes, N., Quadfasel, D., Larsen, K. M., Hansen, B., Valdimarsson, H., and Jonsson, S.: Revised transport estimates of the Denmark Strait overflow, J. Geophys. Res.-Oceans, 122, 3434–3450, https://doi.org/10.1002/2017JC012803, 2017. a
Johnson, H. L. and Marshall, D. P.: A Theory for the Surface Atlantic Response to Thermohaline Variability, J. Phys. Oceanogr., 32, 1121–1132, https://doi.org/10.1175/1520-0485(2002)032<1121:ATFTSA>2.0.CO;2, 2002. a
Jónsson, S. and Valdimarsson, H.: Water mass transport variability to the North Icelandic shelf, 1994–2010, ICES J. Mar. Sci., 69, 809–815, https://doi.org/10.1093/icesjms/fss024, 2012. a
Keenlyside, N. S., Latif, M., Jungclaus, J., Kornblueh, L., and Roeckner, E.: Advancing decadal-scale climate prediction in the North Atlantic sector, Nat. Geosci., 453, 84–88, https://doi.org/10.1038/nature06921, 2008. a
Kelson, R. L., Straub, D. N., and Dufour, C. O.: Using CMIP6 models to assess the significance of the observed trend in the Atlantic Meridional Overturning Circulation, Geophys. Res. Lett.49, 49, e2022GL100202, https://doi.org/10.1029/2022GL100202, 2022. a
Kilbourne, K. H., Wanamaker, A. D., Moffa-Sanchez, P., Reynolds, D. J., Amrhein, D. E., Butler, P. G., Gebbie, G., Goes, M., Jansen, M. F., Little, C. M., Mette, M., Moreno-Chamarro, E., Ortega, P., Otto-Bliesner, B. L., Rossby, T., Scourse, J., and Whitney, N. M.: Atlantic circulation change still uncertain, Nat. Geosci., 15, 165–167, https://doi.org/10.1038/s41561-022-00896-4, 2022. a
Kostov, Y., Johnson, H. L., Marshall, D. P., Heimbach, P., Forget, G., Holliday, N. P., Lozier, M. S., Li, F., Pillar, H. R., and Smith, T.: Distinct sources of interannual subtropical and subpolar Atlantic overturning variability, Nat. Geosci., 14, 491–495, https://doi.org/10.1038/s41561-021-00759-4, 2021. a, b, c
Koul, V., Tesdal, J.-E., Bersch, M., Hátún, H., Brune, S., Borchert, L., Haak, H., Schrum, C., and Baehr, J.: Unraveling the choice of the north Atlantic subpolar gyre index, Sci. Rep., 10, 1005, https://doi.org/10.1038/s41598-020-57790-5, 2020. a, b
Kwon, Y.-O., Alexander, M. A., Bond, N. A., Frankignoul, C., Nakamura, H., Qiu, B., and Thompson, L. A.: Role of the Gulf Stream and Kuroshio–Oyashio Systems in Large-Scale Atmosphere–Ocean Interaction: A Review, J. Climate, 23, 3249–3281, https://doi.org/10.1175/2010JCLI3343.1, 2010. a
Larsen, J. C. and Sanford, T. B.: Florida Current Volume Transports from Voltage Measurements, Science, 227, 302–304, https://doi.org/10.1126/science.227.4684.302, 1985. a
Li, F., Lozier, M. S., and Johns, W. E.: Calculating the Meridional Volume, Heat, and Freshwater Transports from an Observing System in the Subpolar North Atlantic: Observing System Simulation Experiment, J. Atmos. Ocean. Tech., 34, 1483–1500, https://doi.org/10.1175/JTECH-D-16-0247.1, 2017. a
Lique, C. and Thomas, M. D.: Latitudinal shift of the Atlantic Meridional Overturning Circulation source regions under a warming climate, Nat. Clim. Change, 8, 1013–1020, https://doi.org/10.1038/s41558-018-0316-5, 2018. a
Lobelle, D., Beaulieu, C., Livina, V., Sévellec, F., and Frajka-Williams, E.: Detectability of an AMOC Decline in Current and Projected Climate Changes, Geophys. Res. Lett., 47, e2020GL089974, https://doi.org/10.1029/2020GL089974, 2020. a
Lozier, M. S.: Deconstructing the Conveyor Belt, Science, 328, 1507–1511, https://doi.org/10.1126/science.1189250, 2010. a
Lozier, M. S.: Overturning in the North Atlantic, Annu. Rev. Mar. Sci., 4, 291–315, https://doi.org/10.1146/annurev-marine-120710-100740, 2012. a
Lozier, M. S., Roussenov, V., Reed, M. S. C., and Williams, R. G.: Opposing decadal changes for the North Atlantic meridional overturning circulation, Nat. Geosci., 3, 728–734, https://doi.org/10.1038/ngeo947, 2010. a, b, c
Lozier, S., Bacon, S., Bower, A. S., Cunningham, S. A., Femke de Jong, M., de Steur, L., deYoung, B., Fischer, J., Gary, S. F., Greenan, B. J. W., Heimbach, P., Holliday, N. P., Houpert, L., Inall, M. E., Johns, W. E., Johnson, H. L., Karstensen, J., Li, F., Lin, X., Mackay, N., Marshall, D. P., Mercier, H., Myers, P. G., Pickart, R. S., Pillar, H. R., Straneo, F., Thierry, V., Weller, R. A., Williams, R. G., Wilson, C., Yang, J., Zhao, J., and Zika, J. D.: Overturning in the Subpolar North Atlantic Program: A New International Ocean Observing System, Bulletin of the American Meteorological Society, 98, 737–752, https://doi.org/10.1175/BAMS-D-16-0057.1, 2017. a, b, c
Manabe, S. and Stouffer, R. J.: Multiple-Century Response of a Coupled Ocean-Atmosphere Model to an Increase of Atmospheric Carbon Dioxide, J. Climate, 7, 5–23, https://doi.org/10.1175/1520-0442(1994)007<0005:MCROAC>2.0.CO;2, 1994. a
Mann, C.: The termination of the Gulf Stream and the beginning of the North Atlantic Current, Deep-Sea Res., 14, 337–359, https://doi.org/10.1016/0011-7471(67)90077-0, 1967. a
Marshall, J., Johnson, H., and Goodman, J.: A Study of the Interaction of the North Atlantic Oscillation with Ocean Circulation, J. Climate, 14, 1399–1421, https://doi.org/10.1175/1520-0442(2001)014<1399:ASOTIO>2.0.CO;2, 2001. a, b, c
Marshall, D. P. and Johnson, H. L.: Propagation of Meridional Circulation Anomalies along Western and Eastern Boundaries, J. Phys. Oceanogr., 43, 2699–2717, https://doi.org/10.1175/JPO-D-13-0134.1, 2013. a
Mauritzen, C.: Production of dense overflow waters feeding the North Atlantic across the Greenland-Scotland Ridge. Part 1: Evidence for a revised circulation scheme, Deep-Sea Res. Pt. I, 43, 769–806, https://doi.org/10.1016/0967-0637(96)00037-4, 1996. a
McCarthy, G. D., Smeed, D. A., Johns, W. E., Frajka-Williams, E., Moat, B. I., Rayner, D., Baringer, M. O., Meinen, C. S., Collins, J., and Bryden, H.: Measuring the Atlantic Meridional Overturning Circulation at 26°N, Prog. Oceanogr., 130, 91–111, https://doi.org/10.1016/J.POCEAN.2014.10.006, 2015. a, b
Meinen, C. S. and Watts, D. R.: Vertical structure and transport on a transect across the North Atlantic Current near 42°N: Time series and mean, J. Geophys. Res.-Oceans, 105, 21869–21891, https://doi.org/10.1029/2000JC900097, 2000. a
Meinen, C. S., Baringer, M. O., and Garcia, R. F.: Florida Current transport variability: An analysis of annual and longer-period signals, Deep-Sea Res. Pt. I, 57, 835–846, https://doi.org/10.1016/J.DSR.2010.04.001, 2010 (data available at: https://www.aoml.noaa.gov/phod/floridacurrent/, last access: 4 June 2024). a, b, c
Meinen, C. S., Johns, W. E., Moat, B. I., Smith, R. H., Johns, E. M., Rayner, D., Frajka-Williams, E., Garcia, R. F., and Garzoli, S. L.: Structure and Variability of the Antilles Current at 26.5°N, J. Geophys. Res.-Oceans, 124, 3700–3723, https://doi.org/10.1029/2018JC014836, 2019. a
Mercier, H., Lherminier, P., Sarafanov, A., Gaillard, F., Daniault, N., Desbruyères, D., Falina, A., Ferron, B., Gourcuff, C., Huck, T., and Thierry, V.: Variability of the meridional overturning circulation at the Greenland–Portugal OVIDE section from 1993 to 2010, Prog. Oceanogr., 132, 250–261, https://doi.org/10.1016/J.POCEAN.2013.11.001, 2015. a
Mielke, C., Frajka-Williams, E., and Baehr, J.: Observed and simulated variability of the AMOC at 26°N and 41°N, Geophys. Res. Lett., 40, 1159–1164, https://doi.org/10.1002/grl.50233, 2013. a, b
Moat, B. I., Smeed, D. A., Frajka-Williams, E., Desbruyères, D. G., Beaulieu, C., Johns, W. E., Rayner, D., Sanchez-Franks, A., Baringer, M. O., Volkov, D., Jackson, L. C., and Bryden, H. L.: Pending recovery in the strength of the meridional overturning circulation at 26° N, Ocean Sci., 16, 863–874, https://doi.org/10.5194/os-16-863-2020, 2020. a, b, c, d
Moat, B. I., Frajka-Williams, E., Rayner, D., Johns, W. E., Baringer, M. O., Volkov, D. L., and Collins, J.: Atlantic meridional overturning circulation observed by the RAPID-MOCHA-WBTS array at 26N from 2004 to 2020 (v2020.2), NERC EDS British Oceanographic Data Centre NOC [data set], https://doi.org/10.5285/e91b10af-6f0a-7fa7-e053-6c86abc05a09, 2022. a
Moffa‐Sánchez, P., Moreno‐Chamarro, E., Reynolds, D. J., Ortega, P., Cunningham, L., Swingedouw, D., Amrhein, D. E., Halfar, J., Jonkers, L., Jungclaus, J. H., Perner, K., Wanamaker, A., and Yeager, S.: Variability in the Northern North Atlantic and Arctic Oceans Across the Last Two Millennia: A Review, Paleoceanogr. Paleocl. 34, 1399–1436, https://doi.org/10.1029/2018PA003508, 2019. a
Orvik, K. A.: Long‐Term Moored Current and Temperature Measurements of the Atlantic Inflow Into the Nordic Seas in the Norwegian Atlantic Current; 1995–2020, Geophys. Res. Lett., 49, e2021GL096427, https://doi.org/10.1029/2021GL096427, 2022. a, b, c, d
Orvik, K. A. and Skagseth, Ø.: Monitoring the Norwegian Atlantic slope current using a single moored current meter, Cont. Shelf Res., 23, 159–176, https://doi.org/10.1016/S0278-4343(02)00172-3, 2003a. a, b
Orvik, K. A. and Skagseth, Ø.: The impact of the wind stress curl in the North Atlantic on the Atlantic inflow to the Norwegian Sea toward the Arctic, Geophys. Res. Lett., 30, 1884, https://doi.org/10.1029/2003GL017932, 2003b. a
Østerhus, S., Woodgate, R., Valdimarsson, H., Turrell, B., de Steur, L., Quadfasel, D., Olsen, S. M., Moritz, M., Lee, C. M., Larsen, K. M. H., Jónsson, S., Johnson, C., Jochumsen, K., Hansen, B., Curry, B., Cunningham, S., and Berx, B.: Arctic Mediterranean exchanges: a consistent volume budget and trends in transports from two decades of observations, Ocean Sci., 15, 379–399, https://doi.org/10.5194/os-15-379-2019, 2019 (data available at: http://www.oceansites.org/tma/gsr.html, last access: 9 April 2024). a, b, c, d, e, f, g, h
Palter, J. B.: The Role of the Gulf Stream in European Climate, Annu. Rev. Mar. Sci., 7, 113–137, https://doi.org/10.1146/annurev-marine-010814-015656, 2015. a
Piecuch, C. G.: Likely weakening of the Florida Current during the past century revealed by sea-level observations, Nat. Commun., 11, 3973, https://doi.org/10.1038/s41467-020-17761-w, 2020. a
Piecuch, C. G. and Beal, L. M.: Robust Weakening of the Gulf Stream During the Past Four Decades Observed in the Florida Straits, Geophys. Res. Lett., 50, e2023GL105170, https://doi.org/10.1029/2023GL105170, 2023. a
Piecuch, C. G., Ponte, R. M., Little, C. M., Buckley, M. W., and Fukumori, I.: Mechanisms underlying recent decadal changes in subpolar North Atlantic Ocean heat content, J. Geophys. Res.-Oceans, 122, 7181–7197, https://doi.org/10.1002/2017JC012845, 2017. a, b
Polyakov, I. V., Ingvaldsen, R. B., Pnyushkov, A. V., Bhatt, U. S., Francis, J. A., Janout, M., Kwok, R., and Skagseth, Ø.: Fluctuating Atlantic inflows modulate Arctic atlantification, Science, 381, 972–979, https://doi.org/10.1126/science.adh5158, 2023. a
Rhein, M., Mertens, C., and Roessler, A.: Observed Transport Decline at 47°N, Western Atlantic, J. Geophys. Res.-Oceans, 124, 4875–4890, https://doi.org/10.1029/2019JC014993, 2019. a
Richter, K., Furevik, T., and Orvik, K. A.: Effect of wintertime low-pressure systems on the Atlantic inflow to the Nordic seas, J. Geophys. Res., 114, C09006, https://doi.org/10.1029/2009JC005392, 2009. a
Roberts, C. D., Waters, J., Peterson, K. A., Palmer, M. D., McCarthy, G. D., Frajka‐Williams, E., Haines, K., Lea, D. J., Martin, M. J., Storkey, D., Blockley, E. W., and Zuo, H.: Atmosphere drives recent interannual variability of the Atlantic meridional overturning circulation at 26.5°N, Geophys. Res. Lett., 40, 5164–5170, https://doi.org/10.1002/grl.50930, 2013. a, b
Roessler, A., Rhein, M., Kieke, D., and Mertens, C.: Long-term observations of North Atlantic Current transport at the gateway between western and eastern Atlantic, J. Geophys. Res.-Oceans, 120, 4003–4027, https://doi.org/10.1002/2014JC010662, 2015. a
Roquet, F. and Wunsch, C.: The Atlantic Meridional Overturning Circulation and its Hypothetical Collapse, Tellus A, 74, 393–398, https://doi.org/10.16993/tellusa.679, 2022. a
Rossby, T., Flagg, C. N., and Donohue, K.: Interannual variations in upper-ocean transport by the Gulf Stream and adjacent waters between New Jersey and Bermuda, J. Marine Res., 63, 203–226, 2005. a
Rossby, T., Flagg, C. N., Donohue, K., Sanchez-Franks, A., and Lillibridge, J.: On the long-term stability of Gulf Stream transport based on 20 years of direct measurements, Geophys. Res. Lett., 41, 114–120, https://doi.org/10.1002/2013GL058636, 2014. a, b
Rossby, T., Flagg, C., Dohan, K., Fontana, S., Curry, R., Andres, M., and Forsyth, J.: Oleander is More than a Flower: Twenty-Five Years of Oceanography Aboard a Merchant Vessel, Oceanography, 32, 126–137, https://doi.org/10.5670/oceanog.2019.319, 2019 (data available at: https://oleander.bios.asu.edu/data/oleander-fluxes/, last access: 4 June 2024). a, b, c
Rossby, T., Chafik, L., and Houpert, L.: What can Hydrography Tell Us about the strength of the Nordic Seas MOC over the last 70 to 100 years?, Geophys. Res. Lett., 47, e2020GL087456, https://doi.org/10.1029/2020GL087456, 2020. a, b
Sanchez-Franks, A., Flagg, C., and Rossby, T.: A comparison of transport and position between the Gulf Stream east of Cape Hatteras and the Florida Current, J. Marine Res., 72, 291–306, 2014. a, b
Sanchez-Franks, A., Hameed, S., and Wilson, R. E.: The Icelandic Low as a Predictor of the Gulf Stream North Wall Position, J. Phys. Oceanogr., 46, 817–826, https://doi.org/10.1175/JPO-D-14-0244.1, 2016. a
Sanders, R. N. C., Jones, D. C., Josey, S. A., Sinha, B., and Forget, G.: Causes of the 2015 North Atlantic cold anomaly in a global state estimate, Ocean Sci., 18, 953–978, https://doi.org/10.5194/os-18-953-2022, 2022. a
Sarafanov, A.: On the effect of the North Atlantic Oscillation on temperature and salinity of the subpolar North Atlantic intermediate and deep waters, ICES J. Marine Sci., 66, 1448–1454, https://doi.org/10.1093/icesjms/fsp094, 2009. a, b
Sen Gupta, A., Stellema, A., Pontes, G. M., Taschetto, A. S., Vergés, A., and Rossi, V.: Future changes to the upper ocean Western Boundary Currents across two generations of climate models, Sci. Rep., 11, 9538, https://doi.org/10.1038/s41598-021-88934-w, 2021. a, b, c
Skagseth, Ø. and Orvik, K. A.: Identifying fluctuations in the Norwegian Atlantic Slope Current by means of empirical orthogonal functions, Cont. Shelf Res., 22, 547–563, https://doi.org/10.1016/S0278-4343(01)00086-3, 2002. a
Smeed, D. A., Josey, S. A., Beaulieu, C., Johns, W. E., Moat, B. I., Frajka-Williams, E., Rayner, D., Meinen, C. S., Baringer, M. O., Bryden, H. L., and McCarthy, G. D.: The North Atlantic Ocean Is in a State of Reduced Overturning, Geophys. Res. Lett., 45, 1527–1533, https://doi.org/10.1002/2017GL076350, 2018. a, b, c
Tesdal, J. and Haine, T. W. N.: Dominant terms in the freshwater and heat budgets of the subpolar North Atlantic Ocean and Nordic Seas from 1992 to 2015, J. Geophys. Res.-Oceans, 125, e2020JC016435, https://doi.org/10.1029/2020JC016435, 2020. a
Thornalley, D. J. R., Oppo, D. W., Ortega, P., Robson, J. I., Brierley, C. M., Davis, R., Hall, I. R., Moffa-Sanchez, P., Rose, N. L., Spooner, P. T., Yashayaev, I., and Keigwin, L. D.: Anomalously weak Labrador Sea convection and Atlantic overturning during the past 150 years, Nature, 556, 227–230, https://doi.org/10.1038/s41586-018-0007-4, 2018. a
Weijer, W., Cheng, W., Garuba, O. A., Hu, A., and Nadiga, B. T.: CMIP6 Models Predict Significant 21st Century Decline of the Atlantic Meridional Overturning Circulation, Geophys. Res. Lett., 47, e2019GL086075, https://doi.org/10.1029/2019GL086075, 2020. a, b, c
Worthington, E. L., Moat, B. I., Smeed, D. A., Mecking, J. V., Marsh, R., and McCarthy, G. D.: A 30-year reconstruction of the Atlantic meridional overturning circulation shows no decline, Ocean Sci., 17, 285–299, https://doi.org/10.5194/os-17-285-2021, 2021. a
Wunsch, C. and Heimbach, P.: Two Decades of the Atlantic Meridional Overturning Circulation: Anatomy, Variations, Extremes, Prediction, and Overcoming Its Limitations, J. Climate, 26, 7167–7186, https://doi.org/10.1175/JCLI-D-12-00478.1, 2013. a
Zhang, R.: Latitudinal dependence of Atlantic meridional overturning circulation (AMOC) variations, Geophys. Res. Lett., 37, L16703, https://doi.org/10.1029/2010GL044474, 2010. a
Zhang, R., Sutton, R., Danabasoglu, G., Kwon, Y. O., Marsh, R., Yeager, S. G., Amrhein, D. E., and Little, C. M.: A Review of the Role of the Atlantic Meridional Overturning Circulation in Atlantic Multidecadal Variability and Associated Climate Impacts, Rev. Geophys., 57, 316–375, https://doi.org/10.1029/2019RG000644, 2019. a
Zhao, J. and Johns, W.: Wind-forced interannual variability of the Atlantic Meridional Overturning Circulation at 26.5°N, J. Geophys. Res.-Oceans, 119, 2403–2419, https://doi.org/10.1002/2013JC009407, 2014. a, b, c
Zou, S., Lozier, M. S., and Xu, X.: Latitudinal Structure of the Meridional Overturning Circulation Variability on Interannual to Decadal Time Scales in the North Atlantic Ocean, J. Climate, 33, 3845–3862, https://doi.org/10.1175/JCLI-D-19-0215.1, 2020. a