the Creative Commons Attribution 4.0 License.
the Creative Commons Attribution 4.0 License.
 | 28 Feb 2024
Contribution of satellite sea surface salinity to the estimation of liquid freshwater content in the Beaufort Sea
Marta Umbert
Eva De Andrés
Maria Sánchez
Carolina Gabarró
Nina Hoareau
Veronica González-Gambau
Aina García-Espriu
Estrella Olmedo
Roshin P. Raj
Jiping Xie
Rafael Catany
The hydrography of the Arctic Ocean has experienced profound changes over the last 2 decades. The sea ice extent has declined by more than 10 % per decade, and its liquid freshwater content has increased mainly due to glaciers and sea ice melting. Further, new satellite retrievals of sea surface salinity (SSS) in the Arctic might contribute to better characterizing the freshwater changes in cold regions. Ocean salinity and freshwater content are intimately related such that an increase (decrease) in one entails a decrease (increase) in the other. In this work, we evaluate the freshwater content in the Beaufort Gyre using surface salinity measurements from the satellite radiometric mission Soil Moisture and Ocean Salinity (SMOS) and TOPAZ4b reanalysis salinity at depth, estimating the freshwater content from 2011 to 2019 and validating the results with in situ measurements. The results highlight the underestimation of the freshwater content using reanalysis data in the Beaufort Sea and a clear improvement in the freshwater content estimation when adding satellite sea surface salinity measurements in the mixed layer. The improvements are significant, with up to a 70 % reduction in bias in areas near the ice melting. Our research demonstrates how remotely sensed salinity can assist us in better monitoring the changes in the Arctic freshwater content and understanding key processes related to salinity variations that cause density differences with potential to influence the global circulation system that regulates Earth's climate.
- Article
(5424 KB) - Full-text XML
- BibTeX
- EndNote


The Arctic has experienced rapid changes in the last few decades due to rising temperatures (Rantanen et al., 2022). Along with the Arctic water cycle intensification, the sea ice cover is getting younger, thinner, and more mobile (Morison et al., 2012; Moore et al., 2021). Retreating and decreasing sea ice cover, melting ice sheets and glaciers, and increasing Arctic river discharges have led to a freshening of the upper Arctic Ocean (Haine et al., 2015; Solomon et al., 2021). Changes in the Arctic hydrography directly affect conditions on the rest of the planet through feedback mechanisms and interactions with the northern hemispheric atmospheric circulation (Lenton et al., 2019). The retreating sea ice cover and an associated warmer and fresher upper ocean have a direct effect on intensifying the stratification of the water column, with the potential to destabilize the thermohaline circulation, which regulates Earth's climate (Rahmstorf, 2002).
Fresh water is defined as the amount of zero-salinity water that is contained in a volume of water relative to a reference salinity. Liquid freshwater content (FWC) is the depth integral of fresh water, expressed in length units. We chose the standard value used in the Arctic, 34.8, as the salinity reference, to follow the one used in Proshutinsky et al. (2009) as we will compare our estimations with their gridded in situ estimates. The FWC within the upper Arctic Ocean is maintained through the contributions of various significant factors. These factors include river discharge, which accounts for approximately 40 % of the FWC (Timmermans and Toole, 2023). The substantial inflow of relatively fresh Pacific waters through the Bering Strait constitutes another vital component, contributing around 30 % to the FWC. Additionally, the balance between precipitation and evaporation plays a crucial role, with a net effect of approximately 25 % on the FWC (Serreze et al., 2006; Timmermans and Marshall, 2020). These freshwater inflows play a vital role in maintaining the halocline stratification of the Arctic Ocean, which serves as a protective barrier for the Arctic sea ice cover against the influence of the warmer, deeper Atlantic waters.
At the western side of the Arctic climate system lies the Beaufort Gyre (BG), a large swirling circulation cell in the Beaufort Sea. The BG's rotation is driven by anticyclonic (clockwise) wind stress caused by a high-pressure system in the lower atmosphere. The gyre contains an enormous reservoir of fresh water from sea ice, northern rivers (mainly the Mackenzie and Yukon), and Pacific waters entering through the Bering Strait (Proshutinsky et al., 2015; Armitage et al., 2020). The shape and extension of the BG are driven by weather patterns such as Arctic Oscillation (AO) and have a marked seasonal variability. Within the BG, fresh water accumulates through Ekman convergence, ultimately making its exit from the Arctic through the Davis and Fram straits. Since 1997, high atmospheric pressure has triggered strong anticyclonic winds over the BG, which has led to an increase in the FWC by 40 % in the last 2 decades (McPhee et al., 2009; Solomon et al., 2021). The variability in freshwater fluxes from the Arctic has the potential of collapsing subpolar North Atlantic convection, resulting in rapid North Atlantic cooling (Holliday et al., 2020) that would affect global climate via the thermohaline circulation (Rahmstorf, 2002; Zhang et al., 2021; Årthun et al., 2023; Sgubin et al., 2017), as well as the ocean heat content and biogeochemical cycles (Li et al., 2009). The timing and consequences of the eventual release of the accumulated fresh water from the BG into the North Atlantic remain unclear and warrant further investigation.
Traditionally, the Arctic Ocean's FWC has been estimated using in situ hydrographic measurements. However, limited spatiotemporal sampling and the coverage of in situ measurements pose a significant challenge to monitoring the FWC. In the last few decades, satellite data such as altimetry (e.g., sea surface height from CryoSat-2) and gravimetry (e.g., bottom pressure from GRACE), along with in situ observations and model reanalysis outputs, have been used to compute FWC estimations (Morison et al., 2012; Armitage et al., 2016; Solomon et al., 2021). The difference between sea surface height anomalies derived from altimetry measurements and ocean bottom pressure anomalies obtained from GRACE primarily represents the integrated steric sea level variations across the water column. However, salinity is still considered a better indicator for estimating Arctic fresh water (Fournier et al., 2019). In the Arctic Ocean with these cold ocean temperatures, the steric, or density, component of sea level is primarily due to halosteric (salinity‐induced) changes in the salinity of the upper ocean. Thereby, changes in the FWC are predominantly governed by alterations in salinity conditions, emphasizing the significant influence of salinity-related changes on the sea level dynamics in the Arctic Ocean (Raj et al., 2020). This implies that salinity is the most natural variable for investigating the FWC as it directly describes the increases or decreases in fresh water in the ocean (Köhl and Serra, 2014; Tang et al., 2018).
Since 2010, the retrieval of Arctic sea surface salinity (SSS) from microwave radiometric measurements obtained by satellites, such as Soil Moisture and Ocean Salinity (SMOS; launched in 2009) (Reul et al., 2020), Aquarius (operational from 2011 to 2015) (Lagerloef, 2012), Soil Moisture Active Passive (SMAP; launched in 2015) (Tang et al., 2017), and the future Copernicus Imaging Microwave Radiometer (CIMR) satellite (Tang et al., 2017), has revolutionized the monitoring of the global water cycle. The surface salinity observations allow us to improve the monitoring of the sea ice decline and river discharge impact and analyze the water influx to the Arctic Ocean (Kilic et al., 2018). The SMOS satellite provides daily full coverage in polar regions with an effective spatial resolution of 50 km in the seasonally ice-free areas of the Arctic Ocean (Martínez et al., 2022). Due to low seawater temperatures of high latitudes, compared to lower latitudes, L-band brightness temperatures in polar oceans exhibit lower sensitivity to changes in salinity. Consequently, inherent uncertainties are associated with retrieving SSS in the Arctic from these satellite missions (Olmedo et al., 2018; Xie et al., 2019). However, significant advancements in retrieval algorithms have been made, leading to the development of specially tailored Arctic products (Martínez et al., 2022) that have paved the way for integrating SSS data into studies focused on the Arctic FWC (Fournier et al., 2019; Hall et al., 2021; Umbert et al., 2021; Hall et al., 2023).
In this work we evaluate the FWC in the BG, using a satellite-derived Arctic SMOS SSS product with salinity within the water column from TOPAZ4b reanalysis. By exploiting the capabilities of SMOS and merging its SSS observations with salinity from reanalysis models, we aim to enhance our understanding of the distribution and dynamics of the FWC in the Beaufort Gyre region.
2.1 Satellite data
The data utilized for conducting this analysis comprise BEC SMOS Arctic SSS level-3 product v3.1, available from January 2011 to December 2019 as described in Martínez et al. (2022). These salinity maps are generated on a daily basis, using a 9 d running mean, in an EASE 2.0 grid of 25 km. Data closer than 100 km to the coast lack information as these pixels are expected to have low quality due to land–sea contamination. The product is freely distributed from the Barcelona Expert Center website at http://bec.icm.csic.es/, last access: 1 July 2023, with the corresponding DOI number https://doi.org/10.20350/digitalCSIC/12620. Additionally, the data are also accessible on the DIGITAL.CSIC server at https://digital.csic.es/handle/10261/219679, last access: 1 July 2023.
The major advantage of this specially tailored product for the Arctic Ocean is the improvement of the effective spatial resolution that permits better monitoring of the mesoscale structures larger than 50 km. This finer spatial resolution is one of the main advantages of this product, as evidenced by the spatial–spectral analysis performed in Martínez et al. (2022). Therefore, this product is suitable for studying Arctic Ocean SSS processes and dynamics.
Daily sea ice concentration (SIC) estimates from the Sea Ice Climate Change Initiative (OSI SAF) product OSI-430-b were obtained from the EUMETSAT Ocean and Sea Ice Satellite Application Facility, Darmstadt, Germany (2019) (https://www.osi-saf.org/, last access: 1 July 2023).
2.2 Reanalysis data
The TOPAZ system, developed at the Nansen Environmental and Remote Sensing Center (NERSC) and operated by the Norwegian Meteorological Institute, is an operational coupled ice–ocean data assimilation system specifically designed for the Arctic Ocean. This system utilizes the HYCOM-CICE model with a spatial resolution of 10 km across the entire Arctic region and employs the ensemble Kalman filter (EnKF) technique with 100 dynamical members to assimilate all available ocean and sea ice observations jointly (Xie et al., 2017).
We make use of the monthly outputs from the current version of the TOPAZ system, TOPAZ4b reanalysis, spanning the years 2011–2019. Our focus is on the salinity variable, which is available at 40 vertical levels, ranging from the surface (0 m) to the bottom. The atmospheric forcing fields used in TOPAZ4b are obtained from the ECMWF (European Centre for Medium-Range Weather Forecasts). The HYCOM-CICE model is run on a daily basis, providing a 10 d forecast with an average of 10 ensemble members for the 3D physical ocean variables. Weekly data assimilation is performed to generate a 7 d analysis using an ensemble average. It is important to note that this version, TOPAZ4b, incorporates the assimilation of the same SMOS SSS product used in this study as presented by Xie et al. (2023), as well as other variables such as sea surface temperature, SIC, sea level anomaly, surface irradiance data, sea ice thickness, and in situ salinity and temperature profiles.
The output products of TOPAZ4b are interpolated onto a grid with a resolution of 12.5 km at the North Pole, equivalent to ° in mid-latitudes. The interpolation is performed on a polar stereographic projection. It has 40 hybrid vertical layers (z isopycnal) from the surface (0 m) to 4000 m depth with resolution varying from 1 m at the surface to 1500 m at the deepest level. These products serve as both near-real-time forecast and reanalysis products, contributing to the activities of the Copernicus Marine Service Arctic Monitoring and Forecasting Center (ARC MFC).
2.3 In situ data
We utilize the FWC gridded data obtained from the Beaufort Gyre Exploration Project (Proshutinsky et al., 2009) to validate the estimates that we present. They compute the FWC in the region, from 70 to 80° N and 130 to 170° W, where the water depths exceed 300 m. The data collected from CTD (conductivity–temperature–depth), XCTD (expendable conductivity–temperature–depth), and UCTD (underway conductivity–temperature–depth) profiles obtained between July and October each year are used. They offer a yearly estimate based on those in situ measurements from July to October.
The in situ FWC estimations are derived from salinity profiles and are optimally interpolated onto a 50 km2 grid, providing insights into the FWC variability within the region. These maps cover the period from 2003–2020. Additionally, uncertainties associated with each grid cell are determined using the optimal interpolation technique described in Proshutinsky et al. (2009).
2.4 Freshwater content calculation
We have computed the FWC combining SMOS SSS and in-depth ocean salinity from the TOPAZ4b reanalysis in the Beaufort Sea during the 2011–2019 period. We have computed the FWC using the following classical relation (Haine et al., 2015; Proshutinsky et al., 2019):
where S is the salinity at each grid point; Sref is the salinity reference; and z(Sref) is the depth, z, where S(z)=Sref, or the ocean bottom, is achieved.
The FWC computation used SMOS SSS measurements in the pixels where the satellite has coverage, excluding ice-covered ocean areas, from the ocean surface (the first TOPAZ4b layer) down to the mixed-layer depth (MLD). In other cases, FWC computation used TOPAZ4b salinity. Toole et al. (2010) showed that the MLD in that area is ∼ 22 m for the melting season, with a seasonal variability of ∼ 8 m based on the results from in situ CTD and ice-tethered profilers, therefore representing the MLD of the bulk salinity. As TOPAZ4b has predefined layers, we try three different TOPAZ4b layers as the depth of the mixed layer, 16, 25, and 29 m, to assess the uncertainty associated with using a constant value as the MLD throughout the year and the area. This generates an uncertainty that has an impact on the FWC estimates because the MLD has a seasonal and inter-annual variability (Toole et al., 2010).
In our analysis, we exploited the data obtained from the SMOS microwave satellite. It is important to note that the coverage of SSS data from microwave satellites is limited in the presence of sea ice (Fig. 1). During periods of sea ice melting, a larger area of the ice-free ocean becomes observable, enabling SMOS to detect SSS. These measurements provide valuable insights into the variability in the FWC of the region resulting from recent ice melting. Other processes associated with surface salinity in the Arctic region that SMOS can potentially detect are precipitation; river runoff; and circulation patterns such as currents and eddies that transport water masses with different salinity characteristics.
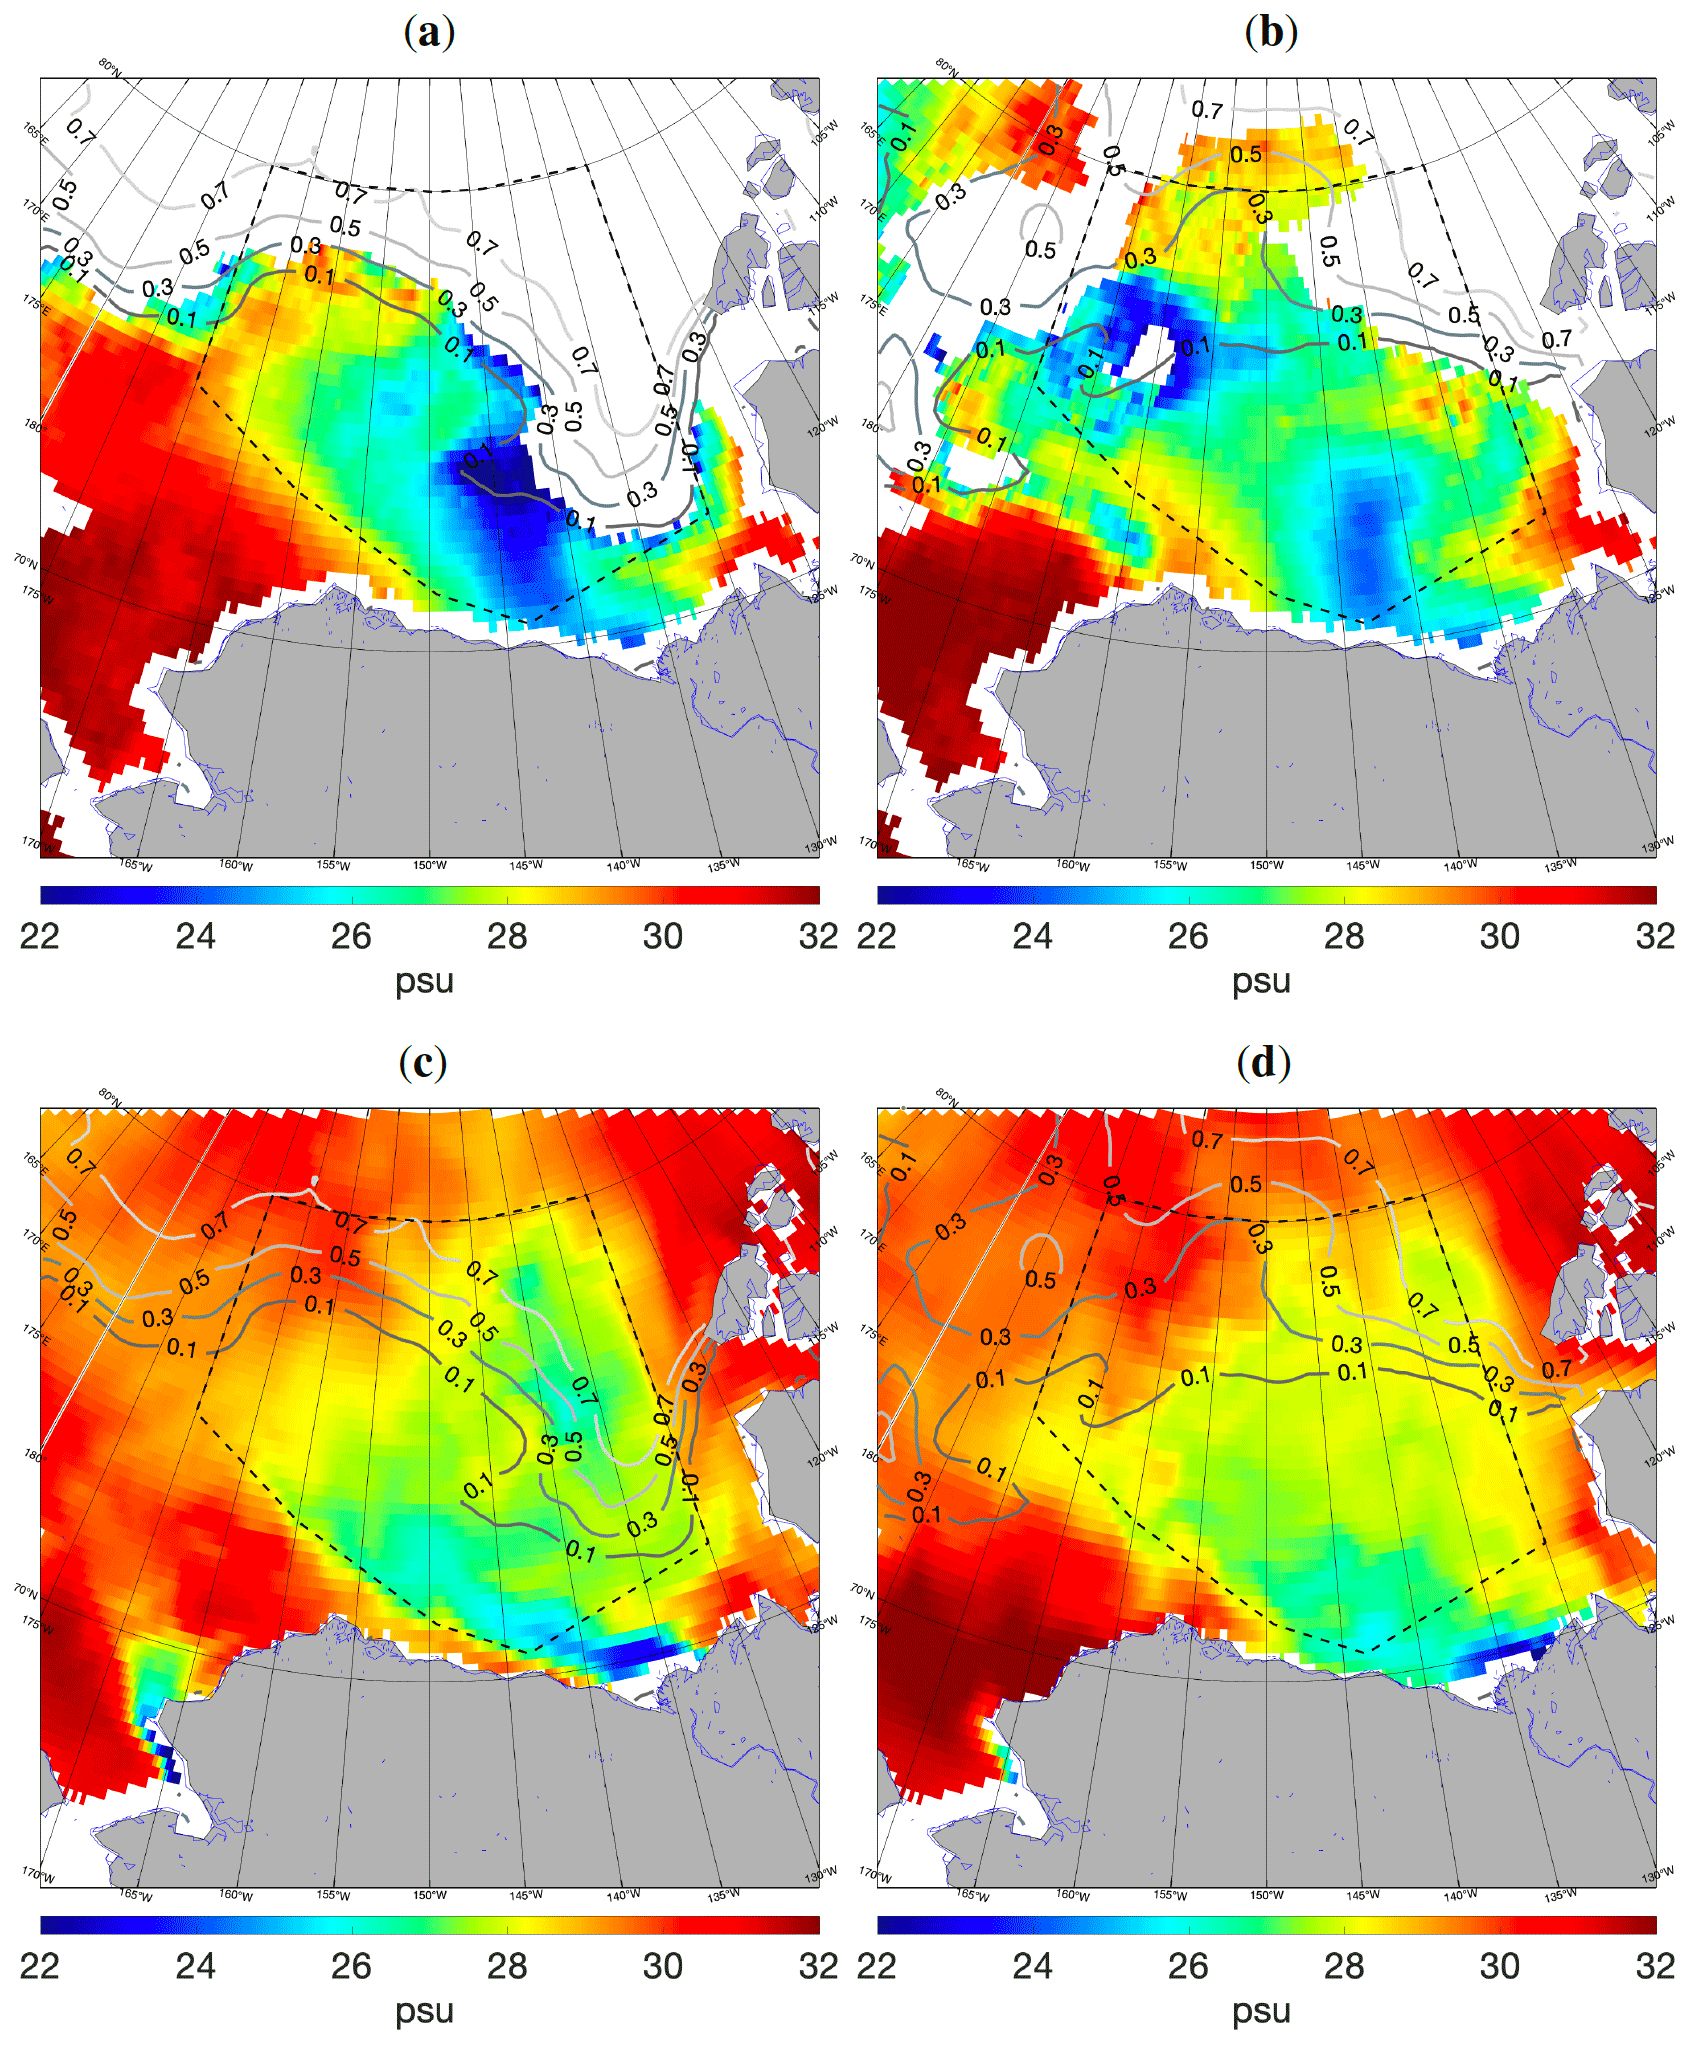
Figure 1Mean SMOS SSS for September 2011 (a) and September 2016 (b). Mean uppermost salinity level of TOPAZ4b for September 2011 (c) and September 2016 (d). The average sea ice concentration contours for September 2011 and 2016 provided by OSI SAF are overlaid. The study area of the Beaufort Gyre is in dashed black lines.
Figure 1 displays the monthly averaged surface salinity observed by SMOS during September 2011 and September 2016 (panels a and b, respectively). The surface salinity (first layer) from the TOPAZ4b reanalysis for the same period is shown in panels (c) and (d). The satellite data exhibit lower salinity values than those resolved by the reanalysis. Note that even if TOPAZ4b reanalysis assimilates SMOS SSS, the resulting surface salinity does not seem to reproduce the same SSS dynamics as seen by SMOS. The reanalysis captures low salinities in the Mackenzie River plume; however, it misses the low salinities in the center of the BG, which may have its origin in the melting of sea ice and/or may be associated with fresh waters from rivers such as the Ob, Lena, and Yenisei in the Eurasian Basin, transported into this region (Proshutinsky et al., 2009; Hall et al., 2023). As indicated by the contours of SIC overlaid in the figure, there are areas with SMOS salinity data but which are not free of ice coverage. This is because the SMOS SSS data are a monthly average of daily products generated using a 9 d running mean. Therefore, these areas represent regions where ice has recently retreated, leaving behind meltwaters. The satellite data appear to capture the freshwater input resulting from ice retreat (De Andrés et al., 2023).
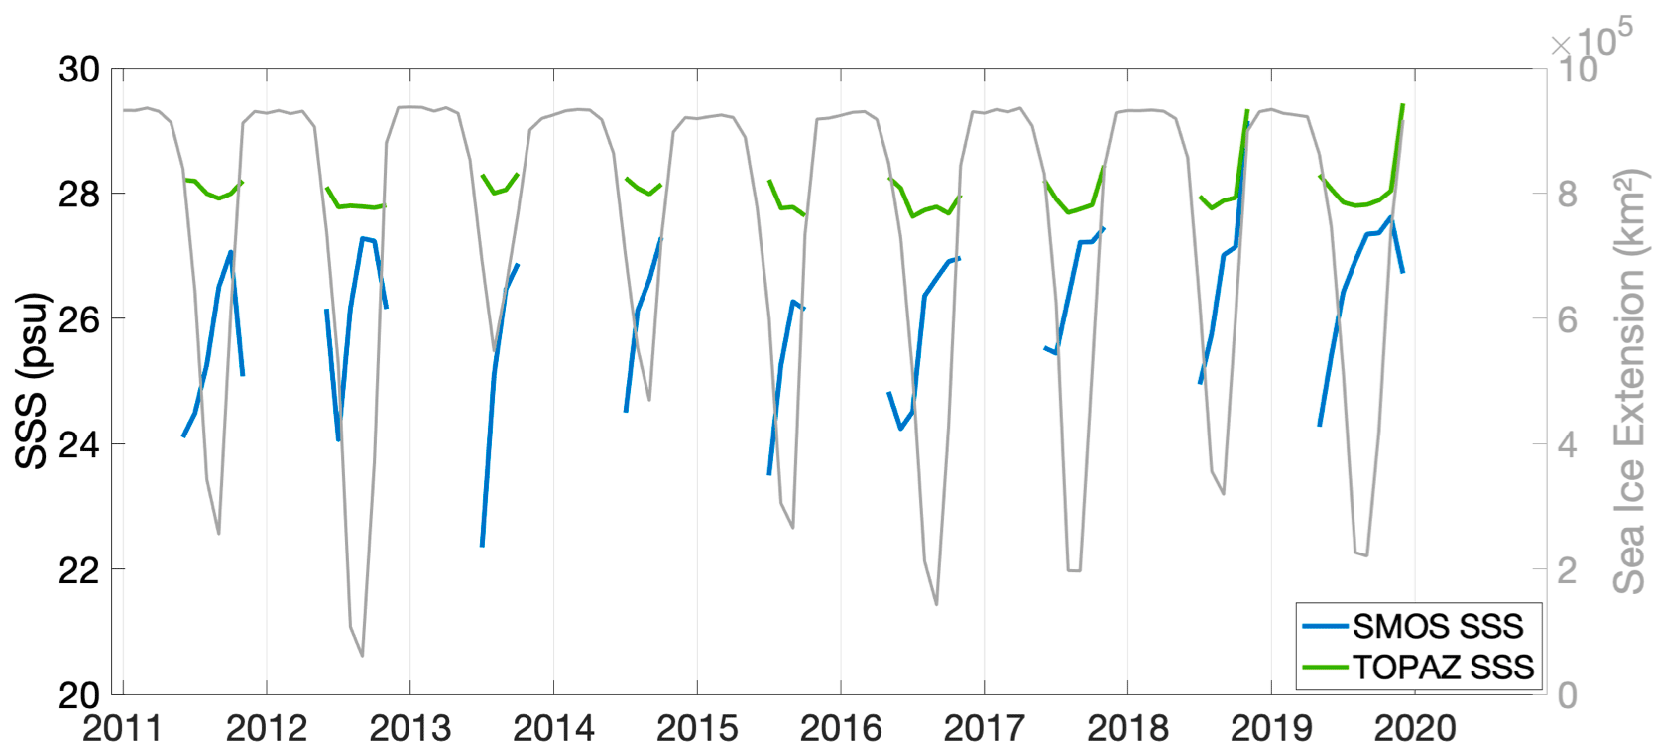
Figure 2Temporal evolution of mean SMOS SSS, TOPAZ4b SSS (in the same pixels as SMOS), and OSI SAF sea ice extension during 2011–2019 in the Beaufort Gyre.
The temporal evolution of the satellite and reanalysis surface salinity (Fig. 2) further highlights high reanalysis salinities in the region. The seasonal variability in the reanalysis salinities (green line) is very low, while SMOS SSS (blue line) captures both fresh waters from the ice melting during early summer and high salinities during the ice formation in fall. When the ice coverage decreases during the spring and summer months, satellite salinity reveals a noticeably lower salinity than TOPAZ4b (salinity values ranging from 1 to 4 less on average, depending on the period). Even if TOPAZ4b assimilates SMOS SSS information, the surface salinity in the reanalysis is still far from the satellite observations, mainly due to the excessively low weight assigned to SMOS measurements and an excessive SSS relaxation process in relation to the World Ocean Atlas (WOA18) SSS in the assimilation scheme.
3.1 Freshwater content using salinity
In the Beaufort Sea region, we observed that the SSS obtained from SMOS data tends to be fresher compared to the surface salinity provided by the TOPAZ4b reanalysis model (Fig. 2). This discrepancy in salinity motivates the necessity of incorporating SMOS SSS up to the MLD to estimate the FWC in this key region of the Arctic Ocean.
In order to use the same area as in situ measurements (Sect. 2.3), we determine the FWC (Sect. 2.4), within the BG region, defined from 70 to 80° N and 130 to 170° W, in areas where water depths exceed 300 m. To calculate the FWC by merging SMOS SSS and TOPAZ4b salinity, we combine the salinity data from the TOPAZ4b reanalysis at various depths with the SMOS SSS values for the layers above the MLD. This methodology is detailed in Sect. 2. By integrating the remotely sensed salinity, we aim to obtain a more accurate estimation of the FWC within the Arctic Ocean.
Figure 3 presents the FWC estimates in September 2011 and 2016 using only reanalysis salinity (a and d) and those by introducing SMOS SSS up to the layer of 16 m in TOPAZ4b (b and e). Similar results but with a higher FWC are found when SMOS SSS is added up to 25 or 29 m (spatial map not shown, but results are found in Table 1 and Fig. 4). Compared to the reanalysis-only data, the FWC values are higher when SMOS information is integrated into the TOPAZ4b data. Figure 3c and f present the difference in the FWC between the TOPAZ4b-only estimates and the one which incorporates the SMOS SSS information up to the upper 16 m (similar patterns with higher differences are found for 25 and 29 m, not shown). The impact of including SMOS SSS data in FWC computation is particularly pronounced in regions affected by sea ice melting (Fig. 3c and f). These regions are characterized by dynamic changes in salinity due to the mixing of ice-melt-induced fresh water with the underlying seawater. By incorporating SMOS SSS information in these areas, we expect higher values of FWC estimates, as SMOS observations reflect fresher surface waters (Figs. 1 and 2).
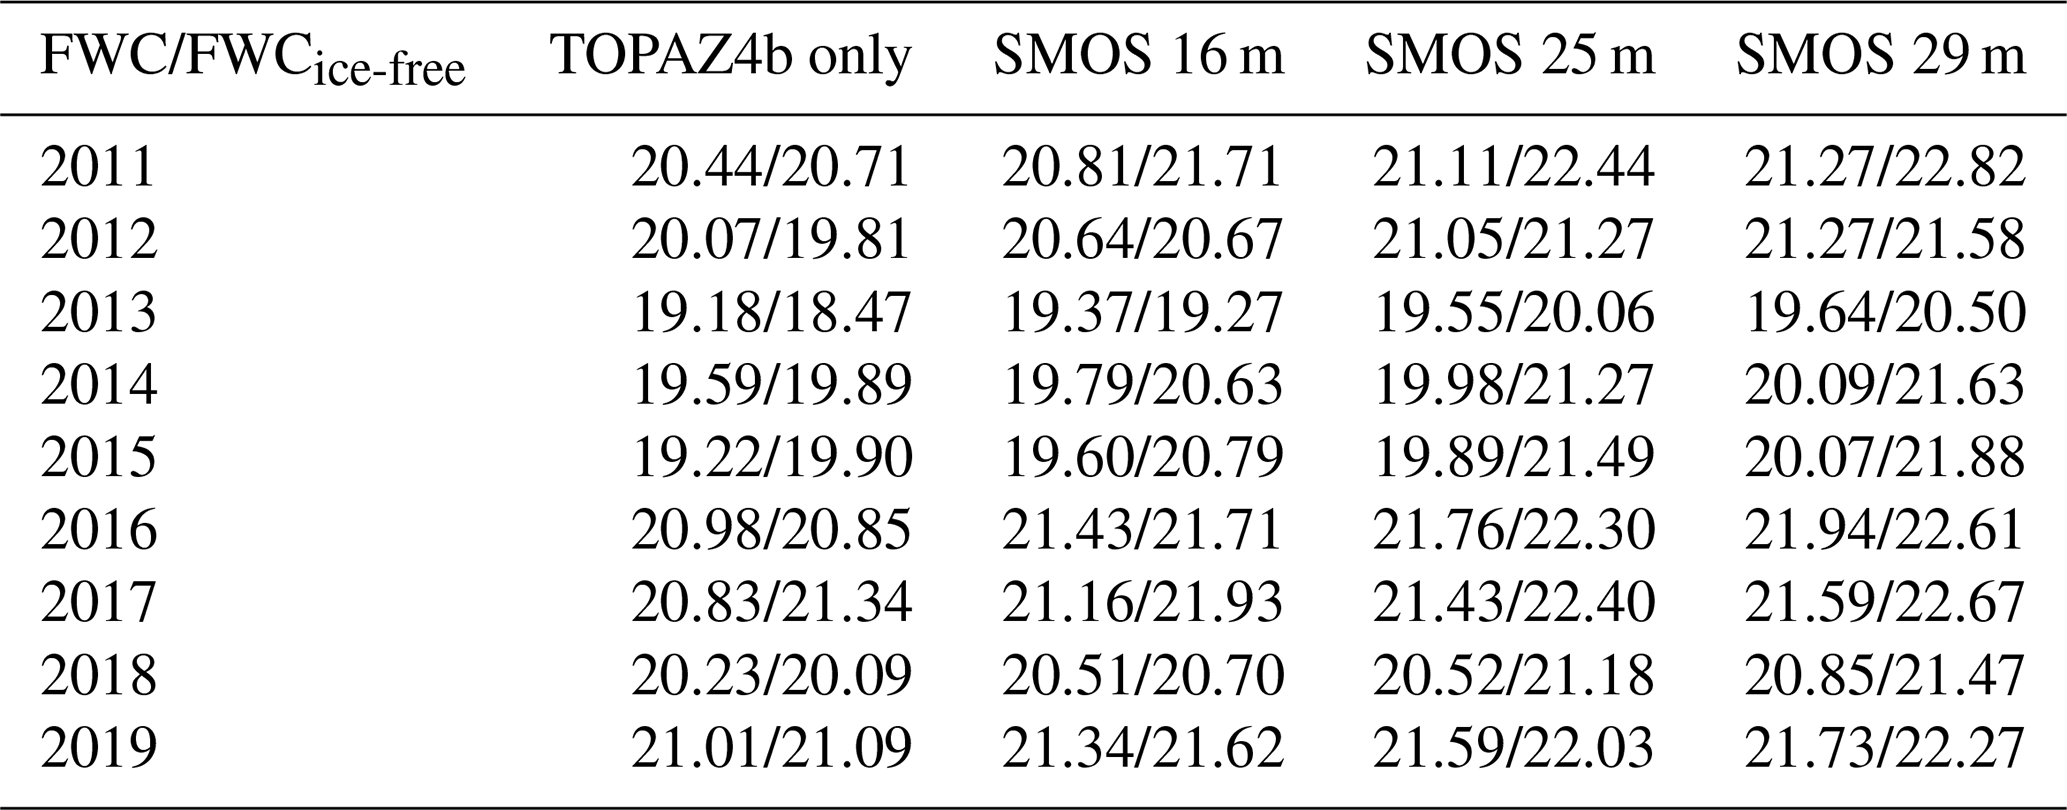
The mixed-layer depth of the region is in the range of 20 m (Toole et al., 2010), and when introducing SMOS SSS information within the mixed layer (up to different TOPAZ4b layers of 16, 25, and 29 m; see Sect. 2.4), higher FWC values are obtained (Fig. 4 and Table 1). This indicates that incorporating SMOS SSS data produces an increase in the estimation of the FWC, a mean increment on average of approximately 3 %–6 % in FWC values in the Beaufort Gyre. However, if we consider only the ice-free region (area seen by SMOS), the increase in the FWC can reach up to 6 %–10 % (Table 1). Table 1 provides evidence that during summer–fall months (July, August, September, and October), the estimated FWC in the Beaufort Gyre and that in the ice-free area are very similar.
Table 1Yearly freshwater content mean for months of July, August, September, and October; freshwater content in the ice-free region using only TOPAZ4b salinity, and adding SMOS SSS up to 16, 25, and 29 m depth for each of the years from 2011–2019. Units are meters.
In the climate model used in Rosenblum et al. (2021), the bias in surface salinity was found to be mainly attributed to unrealistically deep vertical mixing in the model, creating a surface layer that is saltier than observed. This bias can affect the accuracy of FWC estimates, leading to an underestimation compared to in situ measurements. The reason why TOPAZ4b underestimates the FWC could not only lie in the near-surface thermohaline structure, but also be affected by the use of a river climatology that underestimates discharge or is coupled with an ice model that underestimates ice thickness. Another way that can explain why reanalysis models may underestimate the FWC estimates as compared to estimates from in situ measurements is the fact that there are model biases and limitations inherent in the reanalysis due to simplifications and approximations in their numerical representations of complex Arctic Ocean processes (Heuzé et al., 2023). Reanalysis models may not fully capture or accurately parameterize all the relevant physical processes related to freshwater inputs, such as precipitation, runoff, or ice melt, which may not be adequately represented, resulting in underestimated the FWC estimates. Our results suggest that there is room for further improving the freshwater influx from sea ice in the TOPAZ4b reanalysis system, and this is expected to be corrected in the next release.
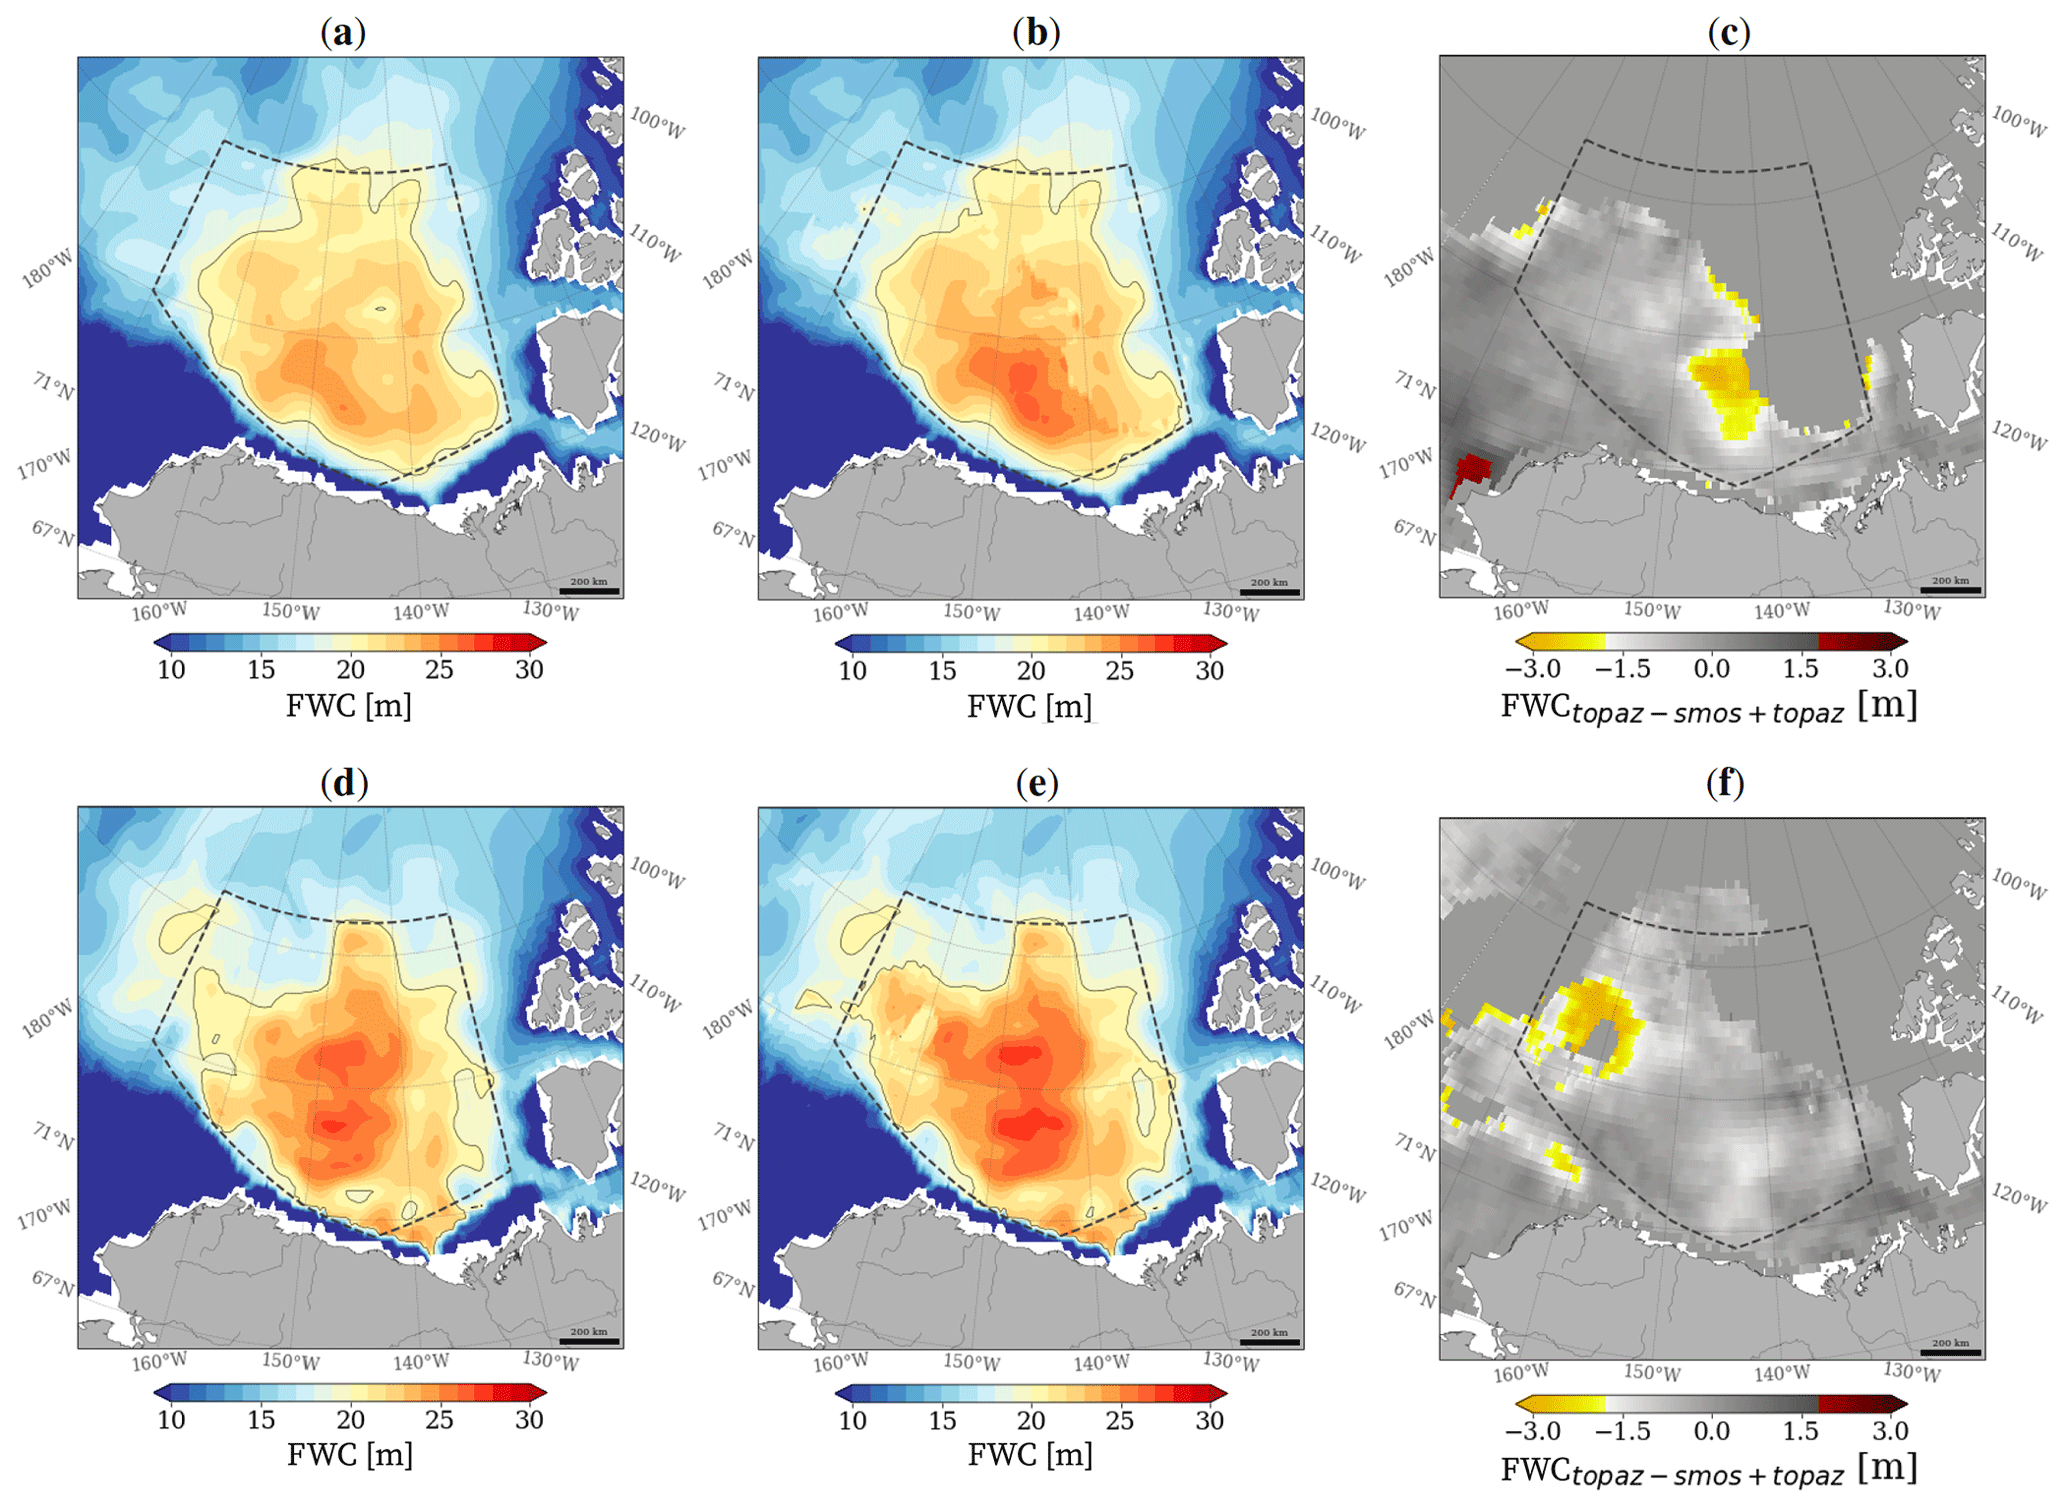
Figure 3(a, d) Mean freshwater content using only TOPAZ4b; (b, e) TOPAZ, and SMOS SSS in the first 16 m; (c, f) freshwater content difference for September 2011 (top row) and September 2016 (bottom row). The freshwater content difference is computed as the freshwater content from TOPAZ4b salinity minus the freshwater content from TOPAZ4b adding SMOS up to 16 m.
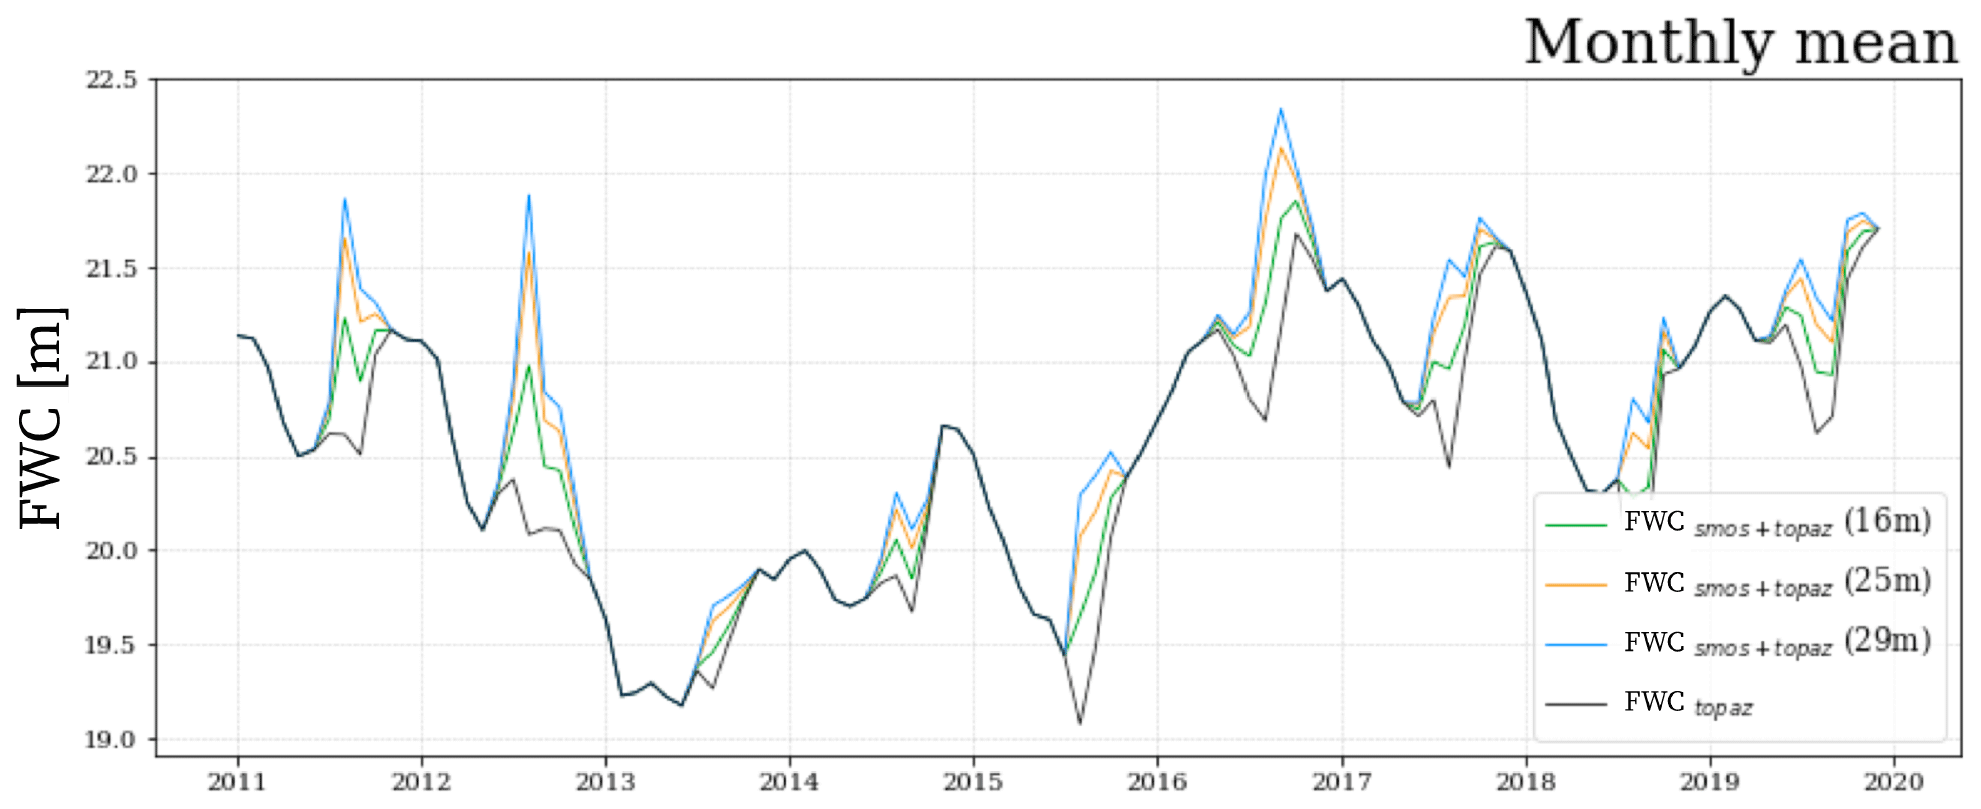
Figure 4Temporal evolution of freshwater content in the Beaufort Gyre using TOPAZ4b salinity (black line) and adding SMOS SSS up to 16 m (green line), 25 m (orange line), and 29 m (blue line).
3.2 Validation using in situ FWC estimates
In this section, we use the in situ dataset from the Beaufort Gyre Experiment Project (Sect. 2.3) to validate the FWC estimations using salinity from satellite and reanalysis. It is worth considering that FWC estimates based on in situ data also come with inherent biases, influenced by their horizontal and vertical resolution (Proshutinsky et al., 2009). The estimation of the FWC remains an ongoing research topic due to the limitations posed by the scarcity of in situ data available for producing these estimates. For comparison with these estimations, we linearly interpolate the FWC estimates using SMOS surface salinity data and column water salinity information from the TOPAZ4b reanalysis onto the same 50 km grid and time period. Figure 5 depicts the in situ FWC measurement for the year 2011 (Fig. 5a), as well as the estimation solely based on TOPAZ4b (Fig. 5b) and SMOS up to 25 m (Fig. 5c). It is evident from the figures that the FWC only with TOPAZ4b significantly underestimates the amount of the FWC with respect to the in situ data. Introducing SMOS information brings the FWC estimation closer to the in situ estimates (Fig. 5d and e), decreasing the negative bias in the pixels where SMOS information is available (Fig. 5f). It is worth noting that the estimates were better where the SMOS observations were used.
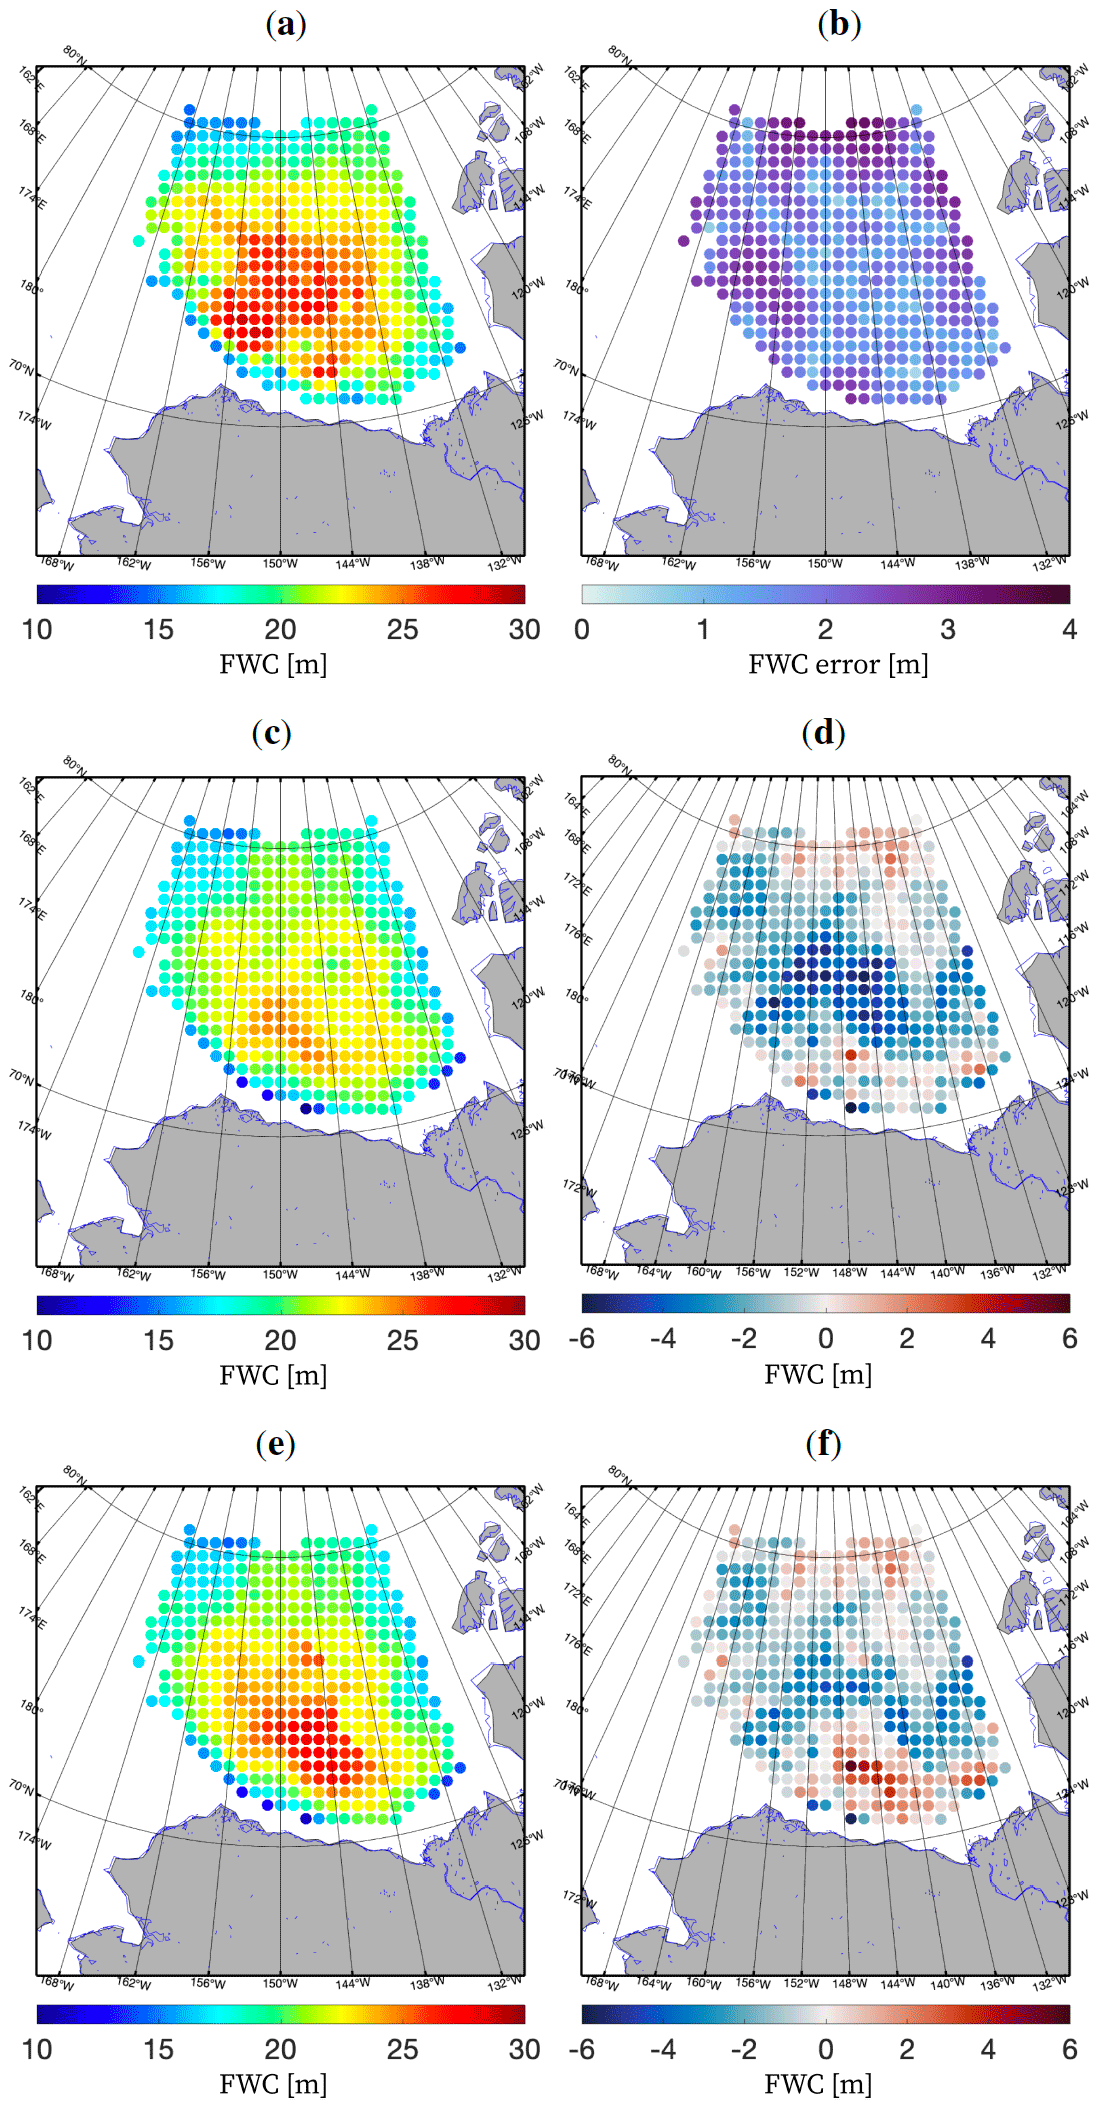
Figure 5Yearly mean for 2011 of freshwater content [meters] from (a) in situ measurements interpolated onto a 50 km grid by the Beaufort Gyre Experiment Project (Proshutinsky et al., 2009), (c) only TOPAZ4b salinity, and (e) SMOS up to 25 m and TOPAZ4b salinity. (b) The error associated with the in situ FWC estimation related to the optimal interpolation scheme (Proshutinsky et al., 2009). The difference between FWC estimations using (d) TOPAZ4b salinity and (f) SMOS up to 25 m and TOPAZ4b salinity against the in situ estimate (a).
The FWC obtained using only reanalysis salinity data underestimates the FWC from in situ measurements. This fact has already been pointed out in Hall et al. (2022) using different ocean models. The inclusion of SMOS SSS data within the MLD enhances the estimation of the FWC, leading to higher values, especially in regions affected by sea ice melting. Our findings emphasize the valuable contribution of SMOS SSS data in enhancing our comprehension of freshwater dynamics in the studied area, as well as the valuable information that satellite salinity measurements can provide in monitoring the surface freshwater flux in the region during these months.
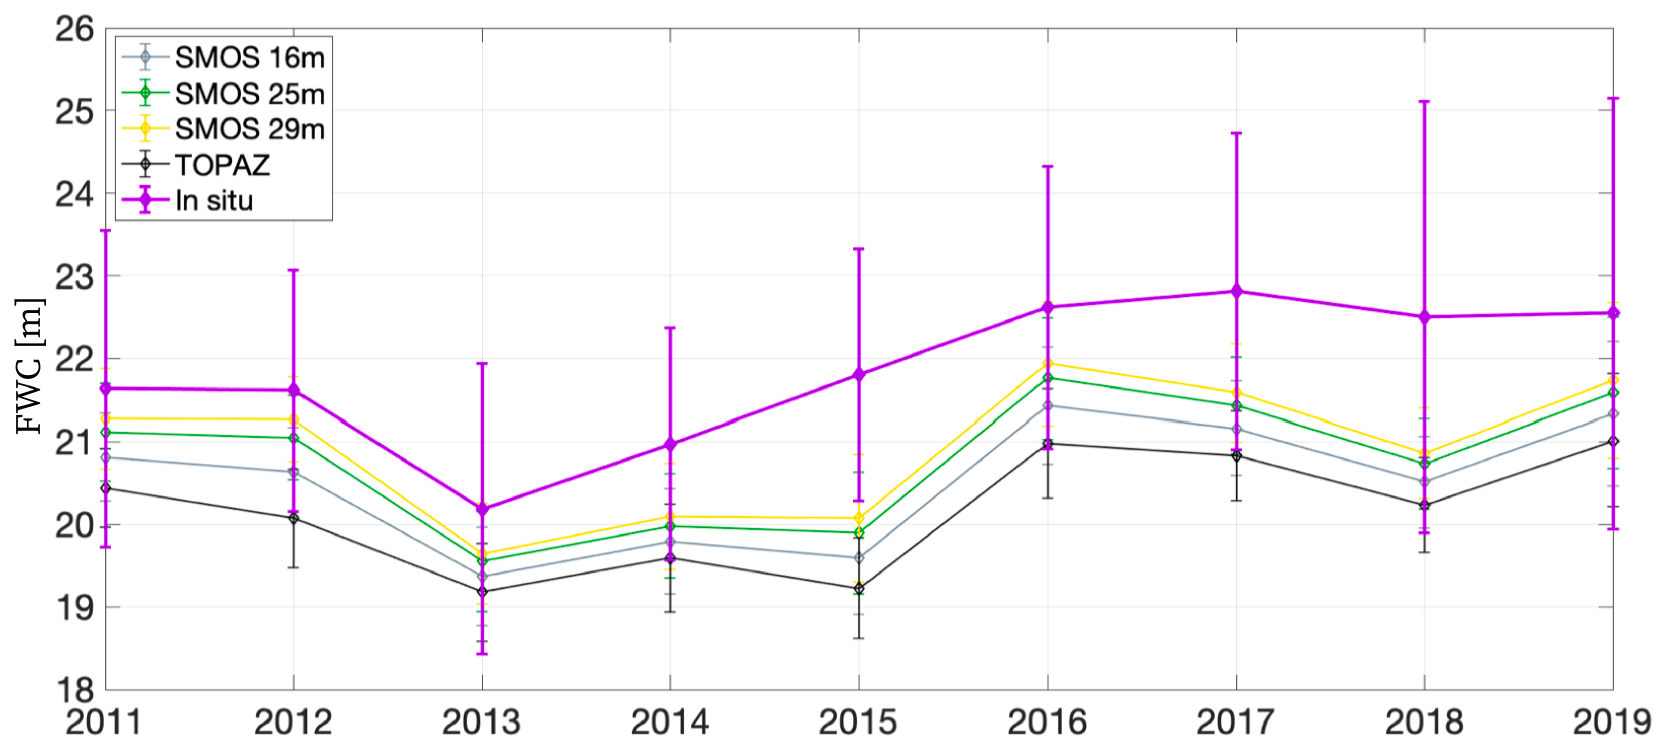
Figure 6Temporal evolution of mean freshwater content (between July and October) in the Beaufort Gyre computed using only TOPAZ4b (black); TOPAZ4b with SMOS SSS until 16 (grey), 25 (green), and 29 (yellow) m depth; and in situ data (purple).
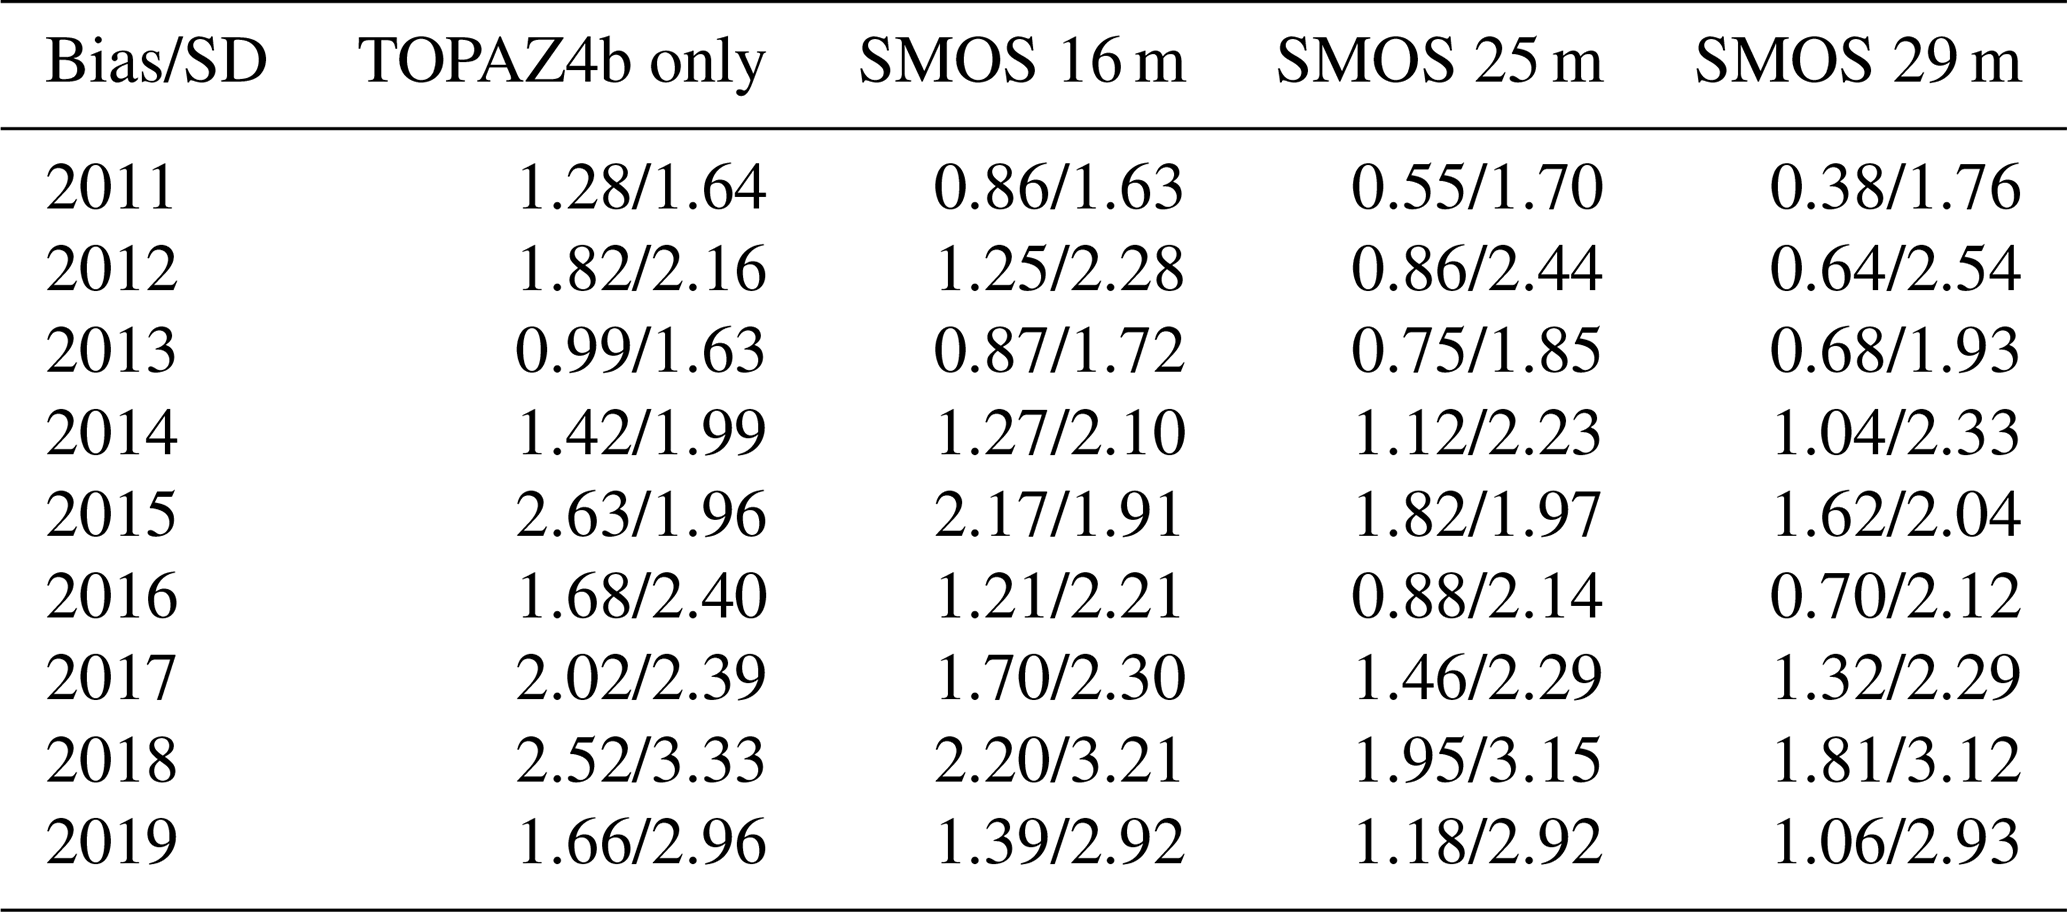
Table 2Bias and standard deviation of the yearly mean FWC using only TOPAZ4b salinity and adding SMOS SSS up to 16, 25, and 29 m depth against in situ FWC estimates for the years from 2011–2019.
When introducing SMOS SSS data, the mean annual FWC estimates (between July and October) in the Beaufort Gyre region exhibit a significant improvement compared to in situ estimates (Fig. 6). The reasons why in situ estimates may overestimate the FWC could be explained by the lack of spatiotemporal coverage of these measurements or by the fact that in situ estimates are an integrated product with associated errors. For example, the incorporation of SMOS SSS data within the upper 25 m depth leads to a noteworthy 34.8 % decrease in bias (Fig. 7). Additionally, there is a notable 14.55 % increase in slope, indicating a better alignment between the FWC from SMOS estimates and the observed values from in situ measurements (Fig. 7). Moreover, there is a non-negligible 4.08 % increase in the coefficient of determination (R2) (Fig. 7). We computed the percentage of increase (decrease) as ((new value − initial value) initial value) × 100. This indicates an enhanced level of agreement when computing the FWC values combining SMOS SSS and TOPAZ4b and those obtained from in situ measurements.
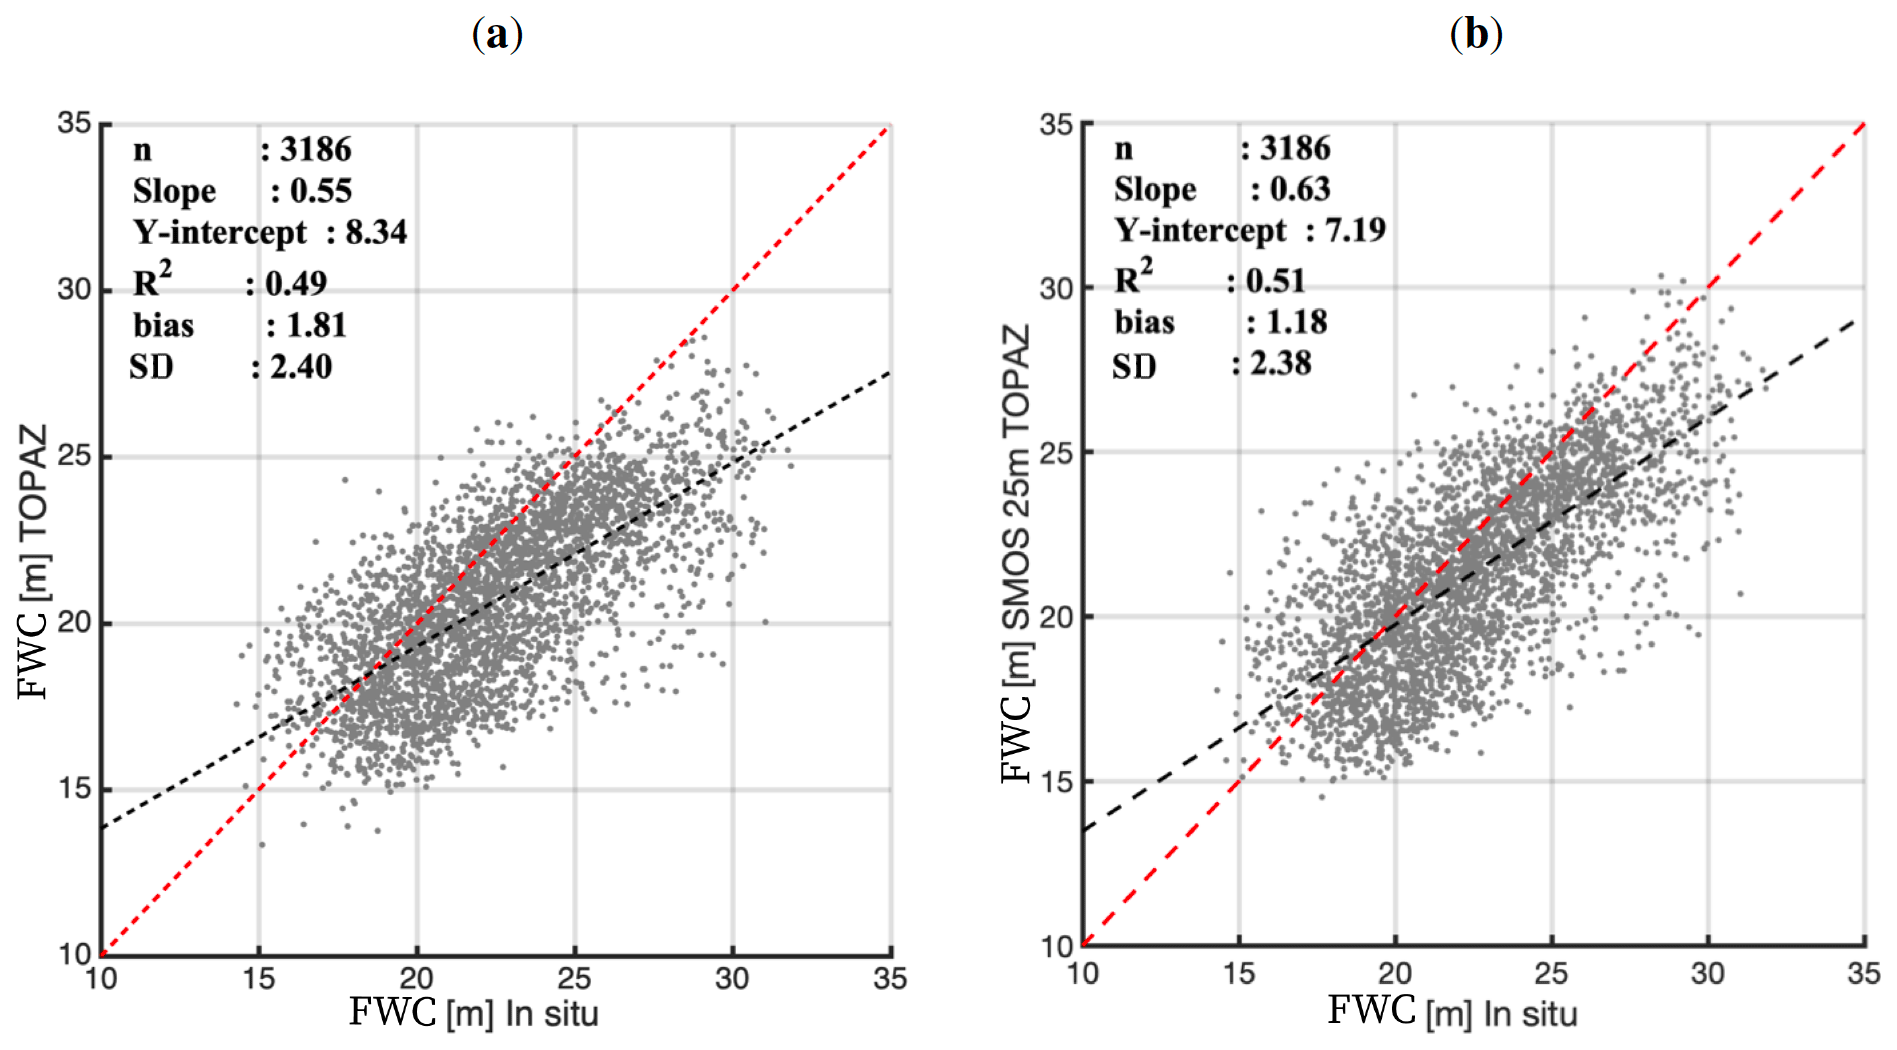
Figure 7Scatterplot of mean yearly freshwater content at each point of the Beaufort Gyre since 2011–2019 from in situ estimates against the freshwater content from (a) TOPAZ4b and (b) TOPAZ4b and SMOS data in the first 25 m depth for the same period and resolution.
Table 2 presents the validation results of FWC estimates based on the salinity from the TOPAZ4b reanalysis, either alone or by adding the surface salinity from SMOS down to the mixed-layer depth at three different values of MLD using the FWC from in situ data. It is observed that the bias decreases when SMOS data are added in the upper layers. Typically, the bias decreases by 30 % when SMOS data are added within the first 16 m of depth and between 50 % and 70 % when information is added up to 25 and 29 m depth, respectively. A potential explanation for the improvement observation when using SMOS SSS data down to the 29 m level, as opposed to the other experiments, could be associated with the impact of downwelling on freshwater accumulation in the Beaufort Gyre. Although the results show a significant improvement in terms of bias, the standard deviation does not significantly change (+ or −10 %) when SMOS data are added (Fig. 7 and Table 2). The standard deviation between model-based and in situ-based estimates has the same order of magnitude (1–3 m) as the error of in situ estimates due to the optimal interpolation scheme applied (Proshutinsky et al., 2019).
Probably the dispersion in terms of standard deviation remains stable in the three experiments, since it is determined by the difference in structures that can be resolved between interpolated in situ measurements on one hand and a reanalysis that incorporates satellite data on the other. Adding SMOS data could even lead to increased dispersions, since SMOS salinity measurements have a finer spatial resolution, allowing for the detection of in situ unrevealed structures. Additionally, SMOS provides daily and integrated temporal resolution during ice-free months, which contrasts with in situ measurements which are point measurements conducted on ice-tethered drifts or on sea ice masses that SMOS cannot measure. Overall, these findings demonstrate that incorporating SMOS SSS data within the mixed-layer depth significantly improves the accuracy of FWC estimates (Fig. 7). The reduced bias, increased slope, and improved coefficient of determination suggest a better representation of the FWC when compared to in situ estimates.
Ongoing improvements in SSS retrievals have the potential to significantly advance our understanding of freshwater changes in the Arctic. The Arctic freshwater system is complex, and understanding its dynamics is crucial for studying the impacts of climate change in the region. This work computed the FWC by combining SMOS sea surface salinity data and ocean salinity at depth from the TOPAZ4b reanalysis for the period of 2011–2019. To validate our results, we compared them to FWC estimates derived from in situ conductivity–temperature–depth measurements in the Beaufort Sea region generated by the Beaufort Gyre Experiment Project (Proshutinsky et al., 2009).
The accuracy of FWC estimates from reanalysis models is an ongoing research topic, and efforts are continuously being made to improve the models and their representations of the FWC. Despite this, when using only TOPAZ4b salinity data, the computed FWC underestimates the values obtained from in situ measurements. However, incorporating SMOS SSS data from the surface down to the mixed-layer depth results in an average increase of up to 10 % in the FWC values. This demonstrates the capability of SMOS SSS data in capturing the spatial and temporal variations in the FWC, especially in regions where sea ice melting plays a significant role in the overall freshwater balance and the importance of assimilating SSS in models.
It is important to note that the choice of the surface layer thickness, where we introduce SMOS SSS data, affects the results. We found that introducing the SMOS SSS data into the mixed-layer depth of 25–29 m provides the best agreement with in situ measurements. We need better monitoring of the depth of the mixing layer in order to more accurately estimate the true impact of assimilating SMOS data in this type of analysis. Our results suggest that more weight should be given to the SMOS SSS measurements in the assimilation into the TOPAZ4b model and those routinely integrated into Arctic oceanographic models. Overall, by combining SMOS SSS and TOPAZ4b data, along with careful consideration of the surface layer thickness, we have improved the accuracy of FWC estimates compared to using reanalysis data alone.
Finally, in agreement with previous authors (e.g., Tang et al., 2018; Fournier et al., 2020; Hall et al., 2023), this work highlights the value of SSS for studying freshwater variability in the Beaufort Sea. Ongoing improvements in SSS retrievals can significantly advance our understanding of Arctic freshwater distribution. Integrating and analyzing SSS data from various sources, including satellite remote sensing, in situ measurements, and numerical models, enables a comprehensive understanding of the Arctic freshwater system. This integrated approach could allow for the identification of patterns, trends, and anomalies in SSS, which can provide valuable insights into the drivers and impacts of freshwater changes in the Beaufort region and holds promise for future exploration in the broader Arctic within the context of climate change and global ocean dynamics.
Underlying research code can be accessed at https://github.com/martaumbert/Ocean-Science-2024 (De Andrés et al., 2024).
Underlying research data are available at https://doi.org/10.6084/m9.figshare.c.7084813.v1 (Umbert, 2024).
MU: conceptualization, investigation, methodology, formal analysis, validation, writing (original draft). EDA: investigation, methodology, formal analysis, review, editing. MS: investigation, methodology, review, editing. CG: funding acquisition, investigation, review, editing. NH: data analysis. VGG: review, editing. EO: review, editing. RPR: review, editing. JX: review, editing. RC: project management, review, editing.
The contact author has declared that none of the authors has any competing interests.
Publisher’s note: Copernicus Publications remains neutral with regard to jurisdictional claims made in the text, published maps, institutional affiliations, or any other geographical representation in this paper. While Copernicus Publications makes every effort to include appropriate place names, the final responsibility lies with the authors.
This work represents a contribution to the CSIC Interdisciplinary Thematic Platforms PTI POLARCSIC and PTI TELEDETECT and is supported by the Spanish government through the “Severo Ochoa Centre of Excellence” accreditation (CEX2019-000928-S).
This project was funded by Marie Skłodowska-Curie grant agreement no. 840374. Eva De Andrés is funded by Margarita Salas grant no. UP2021-035 under the NextGenerationEU program and supported by the MCIN/AEI project PID2020-113051RB-C31. We also received funding from the AEI with the ARCTIC-MON project (PID2021-125324OB-I00) and from the ESA Arctic+ Salinity project (AO/1-9158/18/I-BG) and Arctic+ SSS CCN (4000125590/18/I-BG). This research was supported by the European Union's Horizon 2020 research and innovation program under grant agreement no. 101003826 via the project “CRiceS – Climate Relevant interactions and feedbacks: the key role of sea ice and Snow in the polar and global climate system”.
This paper was edited by Aida Alvera-Azcárate and reviewed by two anonymous referees.
Armitage, T. W., Bacon, S., Ridout, A. L., Thomas, S. F., Aksenov, Y., and Wingham, D. J.: Arctic sea surface height variability and change from satellite radar altimetry and GRACE, 2003–2014, J. Geophys. Res.-Ocean., 121, 4303–4322, 2016. a
Armitage, T. W., Manucharyan, G. E., Petty, A. A., Kwok, R., and Thompson, A. F.: Enhanced eddy activity in the Beaufort Gyre in response to sea ice loss, Nat. Commun., 11, 1–8, 2020. a
Årthun, M., Asbjørnsen, H., Chafik, L., Johnson, H. L., and Våge, K.: Future strengthening of the Nordic Seas overturning circulation, Nat. Commun., 14, 2065, https://doi.org/10.1038/s41467-023-37846-6, 2023. a
De Andrés, E., Umbert, M., Olmedo, E., González-Gambau, V., Navarro, F. J., and Gabarró, C.: Sea Ice Meltwater in the Beaufort Gyre: A Comprehensive Analysis Using Sea Surface Salinity Data from SMOS, ESS Open Archive, https://doi.org/10.22541/au.170328007.74378424/v1, 2023. a
De Andrés, E., Sánchez, M. and Umbert, M.: Ocean-Science-2024, Github [code], https://github.com/martaumbert/Ocean-Science-2024, last access: 27 February 2024. a
EUMETSAT Ocean and Sea Ice Satellite Application Facility, Darmstadt, Germany: Global sea ice concentration interim climate data record 2016 onwards (v2.0, 2019), Norwegian and Danish Meteorological Institutes, 2019. a
Fournier, S., Lee, T., Tang, W., Steele, M., and Olmedo, E.: Evaluation and intercomparison of SMOS, Aquarius, and SMAP sea surface salinity products in the Arctic Ocean, Remote Sens., 11, 3043, https://doi.org/10.3390/rs11243043, 2019. a, b
Fournier, S., Lee, T., Wang, X., Armitage, T. W., Wang, O., Fukumori, I., and Kwok, R.: Sea surface salinity as a proxy for Arctic Ocean freshwater changes, J. Geophys. Res.-Ocean., 125, e2020JC016110, https://doi.org/10.1029/2020JC016110, 2020. a
Haine, T. W. N., Curry, B., Gerdes, R., Hansen, E., Karcher, M., Lee, C., Rudels, B., Spreen, G., de Steur, L., Stewart, K. D., and Woodgate, R.: Arctic freshwater export: Status, mechanisms, and prospects, Glob. Planet.Change, 125, 13–35, https://doi.org/10.1016/j.gloplacha.2014.11.013, 2015. a, b
Hall, S. B., Subrahmanyam, B., Nyadjro, E. S., and Samuelsen, A.: Surface freshwater fluxes in the Arctic and Subarctic Seas during contrasting years of high and low summer sea ice extent, Remote Sens., 13, 1570, https://doi.org/10.3390/rs13081570, 2021. a
Hall, S. B., Subrahmanyam, B., and Morison, J. H.: Intercomparison of salinity products in the Beaufort Gyre and Arctic Ocean, Remote Sens., 14, 71, https://doi.org/10.3390/rs14010071, 2022. a
Hall, S. B., Subrahmanyam, B., and Steele, M.: The Role of the Russian Shelf in Seasonal and Interannual Variability of Arctic Sea Surface Salinity and Freshwater Content, J. Geophys. Res.-Ocean., 128, e2022JC019247, https://doi.org/10.1029/2022JC019247, 2023. a, b, c
Heuzé, C., Zanowski, H., Karam, S., and Muilwijk, M.: The deep Arctic Ocean and Fram Strait in CMIP6 models, J. Clim., 36, 2551–2584, 2023. a
Holliday, N. P., Bersch, M., Berx, B., Chafik, L., Cunningham, S., Florindo-López, C., Hátún, H., Johns, W., Josey, S. A., Larsen, K. M. H., Mulet, S., Oltmanns, M., Reverdin, G., Rossby, T., Thierry, V., Valdimarsson, H., and Yashayaev, I.: Ocean circulation causes the largest freshening event for 120 years in eastern subpolar North Atlantic, Nat. Commun., 11, 585, https://doi.org/10.1038/s41467-020-14474-y, 2020. a
Kilic, L., Prigent, C., Aires, F., Boutin, J., Heygster, G., Tonboe, R. T., Roquet, H., Jimenez, C., and Donlon, C.: Expected performances of the Copernicus Imaging Microwave Radiometer (CIMR) for an all-weather and high spatial resolution estimation of ocean and sea ice parameters, J. Geophys. Res.-Ocean., 123, 7564–7580, 2018. a
Köhl, A. and Serra, N.: Causes of decadal changes of the freshwater content in the Arctic Ocean, J. Clim., 27, 3461–3475, 2014. a
Lagerloef, G.: Satellite mission monitors ocean surface salinity, EOS, Trans. Am. Geophys. Union, 93, 233–234, https://doi.org/10.1029/2012EO250001, 2012. a
Lenton, T. M., Rockström, J., Gaffney, O., Rahmstorf, S., Richardson, K., Steffen, W., and Schellnhuber, H. J.: Climate tipping points?too risky to bet against, Nature, 575, 592–595, 2019. a
Li, W. K., McLaughlin, F. A., Lovejoy, C., and Carmack, E. C.: Smallest algae thrive as the Arctic Ocean freshens, Science, 326, 539–539, 2009. a
Martínez, J., Gabarró, C., Turiel, A., González-Gambau, V., Umbert, M., Hoareau, N., González-Haro, C., Olmedo, E., Arias, M., Catany, R., Bertino, L., Raj, R. P., Xie, J., Sabia, R., and Fernández, D.: Improved BEC SMOS Arctic Sea Surface Salinity product v3.1, Earth Syst. Sci. Data, 14, 307–323, https://doi.org/10.5194/essd-14-307-2022, 2022. a, b, c, d
McPhee, M., Proshutinsky, A., Morison, J., Steele, M., and Alkire, M.: Rapid change in freshwater content of the Arctic Ocean, Geophys. Res. Lett., 36, https://doi.org/10.1029/2009GL037525, 2009. a
Moore, G., Howell, S., Brady, M., Xu, X., and McNeil, K.: Anomalous collapses of Nares Strait ice arches leads to enhanced export of Arctic sea ice, Nat. Commun., 12, 1, https://doi.org/10.1038/s41467-020-20314-w, 2021. a
Morison, J., Kwok, R., Peralta-Ferriz, C., Alkire, M., Rigor, I., Andersen, R., and Steele, M.: Changing arctic ocean freshwater pathways, Nature, 481, 66–70, 2012. a, b
Olmedo, E., Gabarró, C., González-Gambau, V., Martínez, J., Ballabrera-Poy, J., Turiel, A., Portabella, M., Fournier, S., and Lee, T.: Seven years of SMOS sea surface salinity at high latitudes: Variability in Arctic and Sub-Arctic regions, Remote Sens., 10, 1772, https://doi.org/10.3390/rs10111772, 2018. a
Proshutinsky, A., Krishfield, R., Timmermans, M.-L., Toole, J., Carmack, E., McLaughlin, F., Williams, W. J., Zimmermann, S., Itoh, M., and Shimada, K.: Beaufort Gyre freshwater reservoir: State and variability from observations, J. Geophys. Res.-Ocean., 114, 2008JC005104, https://doi.org/10.1029/2008JC005104, 2009. a, b, c, d, e, f, g, h
Proshutinsky, A., Dukhovskoy, D., Timmermans, M.-L., Krishfield, R., and Bamber, J. L.: Arctic circulation regimes, Philos. T. R. Soc. A, 373, 20140160, https://doi.org/10.1098/rsta.2014.0160, 2015. a
Proshutinsky, A., Krishfield, R., Toole, J. M., Timmermans, M. -L., Williams, W., Zimmermann, S., Yamamoto-Kawai, M., Armitage, T. W. K., Dukhovskoy, D., Golubeva, E., Manucharyan, G. E., Platov, G., Watanabe, E., Kikuchi, T., Nishino, S., Itoh, M., Kang, S. -H., Cho, K. -H., Tateyama, K., and Zhao, J.: Analysis of the Beaufort Gyre freshwater content in 2003–2018, J. Geophys. Res.-Ocean., 124, 9658–9689, https://doi.org/10.1029/2019JC015281, 2019. a, b
Rahmstorf, S.: Ocean circulation and climate during the past 120,000 years. Nature, 419, 207–214, https://doi.org/10.1038/nature01090, 2002. a
Rahmstorf, S.: Ocean circulation and climate during the past 120,000 years, Nature, 419, 207–214, 2002. a
Raj, R. P., Andersen, O. B., Johannessen, J. A., Gutknecht, B. D., Chatterjee, S., Rose, S. K., Bonaduce, A., Horwath, M., Ranndal, H., Richter, K., et al.: Arctic sea level budget assessment during the GRACE/Argo Time Period, Remote Sens., 12, 2837, https://doi.org/10.3390/rs12172837, 2020. a
Rantanen, M., Karpechko, A. Y., Lipponen, A., Nordling, K., Hyvärinen, O., Ruosteenoja, K., Vihma, T., and Laaksonen, A.: The Arctic has warmed nearly four times faster than the globe since 1979, Commun. Earth Environ., 3, 168, https://doi.org/10.1038/s43247-022-00498-3, 2022. a
Reul, N., Grodsky, S., Arias, M., Boutin, J., Catany, R., Chapron, B., d'Amico, F., Dinnat, E., Donlon, C., Fore, A., et al.: Sea surface salinity estimates from spaceborne L-band radiometers: An overview of the first decade of observation (2010–2019), Remote Sens. Environ., 242, 111769, https://doi.org/10.1016/j.rse.2020.111769, 2020. a
Rosenblum, E., Fajber, R., Stroeve, J., Gille, S., Tremblay, L., and Carmack, E.: Surface salinity under transitioning ice cover in the Canada Basin: Climate model biases linked to vertical distribution of fresh water, Geophys. Res. Lett., 48, e2021GL094739, https://doi.org/10.1029/2021GL094739, 2021. a
Serreze, M. C., Barrett, A. P., Slater, A. G., Woodgate, R. A., Aagaard, K., Lammers, R. B., Steele, M., Moritz, R., Meredith, M., and Lee, C. M.: The large-scale freshwater cycle of the Arctic, J. Geophys. Res.-Ocean., 111, https://doi.org/10.1029/2005JC003424, 2006. a
Sgubin, G., Swingedouw, D., Drijfhout, S., Mary, Y., and Bennabi, A.: Abrupt cooling over the North Atlantic in modern climate models, Nat. Commun., 8, 14375, https://doi.org/10.1038/ncomms14375, 2017. a
Solomon, A., Heuzé, C., Rabe, B., Bacon, S., Bertino, L., Heimbach, P., Inoue, J., Iovino, D., Mottram, R., Zhang, X., Aksenov, Y., McAdam, R., Nguyen, A., Raj, R. P., and Tang, H.: Freshwater in the Arctic Ocean 2010–2019, Ocean Sci., 17, 1081–1102, https://doi.org/10.5194/os-17-1081-2021, 2021. a, b, c
Tang, W., Fore, A., Yueh, S., Lee, T., Hayashi, A., Sanchez-Franks, A., Martinez, J., King, B., and Baranowski, D.: Validating SMAP SSS with in situ measurements, Remote Sens. Environ., 200, 326–340, 2017. a, b
Tang, W., Yueh, S., Yang, D., Fore, A., Hayashi, A., Lee, T., Fournier, S., and Holt, B.: The potential and challenges of using Soil Moisture Active Passive (SMAP) sea surface salinity to monitor Arctic Ocean freshwater changes, Remote Sens., 10, 869, https://doi.org/10.3390/rs10060869, 2018. a, b
Timmermans, M.-L. and Marshall, J.: Understanding Arctic Ocean circulation: A review of ocean dynamics in a changing climate, J. Geophys. Res.-Ocean., 125, e2018JC014378, https://doi.org/10.1029/2018JC014378, 2020. a
Timmermans, M.-L. and Toole, J. M.: The Arctic Ocean's Beaufort Gyre, Ann. Rev. Mar. Sci., 15, 223–248, 2023. a
Toole, J. M., Timmermans, M.-L., Perovich, D. K., Krishfield, R. A., Proshutinsky, A., and Richter-Menge, J. A.: Influences of the ocean surface mixed layer and thermohaline stratification on Arctic Sea ice in the central Canada Basin, J. Geophys. Res.-Ocean., 115, https://doi.org/10.1029/2009JC005660, 2010. a, b, c
Umbert, M.: Ocean Science 2024, figshare [data set], https://doi.org/10.6084/m9.figshare.c.7084813.v1, 2024. a
Umbert, M., Gabarro, C., Olmedo, E., Gonçalves-Araujo, R., Guimbard, S., and Martinez, J.: Using Remotely Sensed Sea Surface Salinity and Colored Detrital Matter to Characterize Freshened Surface Layers in the Kara and Laptev Seas during the Ice-Free Season, Remote Sens., 13, 3828, https://doi.org/10.3390/rs13193828, 2021. a
Xie, J., Bertino, L., Counillon, F., Lisæter, K. A., and Sakov, P.: Quality assessment of the TOPAZ4 reanalysis in the Arctic over the period 1991–2013, Ocean Sci., 13, 123–144, https://doi.org/10.5194/os-13-123-2017, 2017. a
Xie, J., Raj, R. P., Bertino, L., Samuelsen, A., and Wakamatsu, T.: Evaluation of Arctic Ocean surface salinities from the Soil Moisture and Ocean Salinity (SMOS) mission against a regional reanalysis and in situ data, Ocean Sci., 15, 1191–1206, https://doi.org/10.5194/os-15-1191-2019, 2019. a
Xie, J., Raj, R. P., Bertino, L., Martínez, J., Gabarró, C., and Catany, R.: Assimilation of sea surface salinities from SMOS in an Arctic coupled ocean and sea ice reanalysis, Ocean Sci., 19, 269–287, https://doi.org/10.5194/os-19-269-2023, 2023. a
Zhang, J., Weijer, W., Steele, M., Cheng, W., Verma, T., and Veneziani, M.: Labrador Sea freshening linked to Beaufort Gyre freshwater release, Nat. Commun., 12, 1–8, 2021. a