the Creative Commons Attribution 4.0 License.
the Creative Commons Attribution 4.0 License.
Monitoring the coastal–offshore water interactions in the Levantine Sea using ocean color and deep supervised learning
Georges Baaklini
Julien Brajard
Leila Issa
Gina Fifani
Laurent Mortier
Roy El Hourany
Understanding and tracking the surface circulation of the Levantine Sea present significant challenges, particularly close to the coast. This difficulty arises due to two main factors: the limited availability of in situ observations and the increasing inaccuracies in altimetry data close to the coastline. Here, we propose a new approach to monitor the interaction between offshore and coastal waters. In this approach, we develop a pattern detection model using deep learning by training the U-Net model on ocean color data to track the interactions between the coastal and offshore water in the Levantine Sea.
The results showed the presence of notable variations in the behavior of coastal currents as they progress northward beyond 33.8° E. As these coastal currents become increasingly unstable, they exhibit continuous pinching-off events that are missed by conventional observational tools. These pinching-off events, especially observed along the Lebanese coast, manifest in various patterns that evolve simultaneously. Typically, these patterns have a relatively short lifespan of a few weeks, appearing and disappearing rapidly. However, these structures can evolve into larger eddies that endure for over 4 months in some years, especially in the northern part of the Lebanese coasts. Although these structures could be observed during all the seasons, spring consistently records the lowest activity of these structures. Overall, we showed that the pinching-off events were always observed in the eastern part of the Levantine Sea. On the contrary, in the southern part, along the Egyptian coasts, the coastal flow is more stable in the southern region, where these events are less frequently observed, with more than 63 % of the total observations not exhibiting any pinching-off events. Moreover, when these events occur in the south, their spatial extent is notably limited.
This research not only sheds light on previously missed (or underestimated) coastal current dynamics in the Levantine Sea but also highlights the crucial need to increase in situ observations to advance our understanding of this region's complex oceanographic processes.
- Article
(5392 KB) - Full-text XML
- BibTeX
- EndNote
Understanding the coastal circulation is key information for a wide range of applications as it plays a crucial role in the redistribution of water properties, such as nutrients or chemicals from an anthropogenic source being channeled through rivers, as well as the transport of nutrient-rich coastal waters into the more oligotrophic open sea (Escudier et al., 2016; Levy and Martin, 2013; Taupier-Letage et al., 2003). In the Levantine Sea, the exchanges between coastal and offshore waters could be intensified by mesoscale structures that can trap, advect, and deviate the coastal flow to further distances offshore. Indeed, the Levantine Sea, characterized by a mesoscale activity that is highly dynamic and that evolves over a short timescale (Menna et al., 2012), is described as a counterclockwise flow, circulating along the continental slope and interacting with different mesoscale and submesoscale structures evolving offshore (see Fig. 1). The offshore mesoscale activity has been studied using different approaches: long-term averaged mean dynamic topography (MDT) (Amitai et al., 2010), current flow kinetic energy variability (Pujol and Larnicol, 2005; Menna et al., 2012), eddy tracking (Mkhinini et al., 2014), and neural network classification (Baaklini et al., 2022). On the other hand, the along-slope coastal circulation has been less explored, and there is still a significant gap in our understanding of the interaction between coastal currents and the dynamical features close to the shoreline. This lack of information is primarily due to the rarity of in situ observations. Moreover, previous studies have predominantly relied on satellite altimetry observations that are still error-prone near the coastal areas, where the satellite information degrades within 20–50 km from land (Cipollini et al., 2010), and, thus, a detailed description of the near-coast features can be missed or biased (Fifani et al., 2021; Baaklini, 2022).
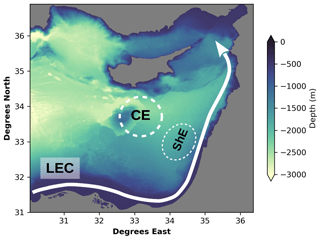
Figure 1A schematic representation of the Levantine Sea surface dynamics in the area starting with the discharge of the Nile River into the passage between the Cypriot and Syrian coasts. The so-called Libyo-Egyptian along-slope circulation (LEC) is made up of the Atlantic water (AW) that enters the Levantine Sea, flows in a cyclonic along-slope circulation, and interacts with the Shikmona Eddy (ShE), with the presence of a larger mesoscale structure, the Cyprus Eddy, located to the south of Cyprus. All of this is overlaid onto a bathymetry map.
A typical case showing the impact of altimetry inaccuracies on the precise monitoring of these dynamical features is presented in Fig. 2 (right panel). In this example, the vorticity obtained from the altimetry velocity field failed to precisely capture the shape and the position of a spatially extended eddy structure. In contrast, the ocean color image was capable of accurately delineating the eddy structures (left panel).
Indeed, high-resolution chlorophyll images can detect even small swirling and filamentary patterns of chlorophyll, hence providing more accurate monitoring of different features (eddies, jets, meanders, etc.) (Sarangi, 2012). Although the Levantine Sea is considered to be the marine equivalent of a terrestrial desert, the use of ocean color images to track the coastal–offshore interactions is still possible, mainly due to its along-slope coastal current that interacts with the discharges of the Nile River (the only main river discharging into the Levantine Sea), which causes the emergence of a hotspot of algal blooming occurring close to the Egyptian coast. Moreover, the coastal circulation carries part of the nutrient-rich water further to the east, extending from the coastal area of Egypt to Lebanon; this could evolve into the eddies and filaments frequently observed to extend seaward from the coast and to interact with larger basin-wide patterns (Barale et al., 2008).
When using an extensive dataset of high-resolution ocean images, analyzing different features poses challenges when using traditional computer vision techniques. These challenges arise from factors such as high temporal variability, limited information during periods of heavy cloud cover, and the intricate behavior of these oceanic features. Machine and deep learning technologies have provided opportunities to solve these limitations and to improve the productivity of the existing methods used to detect ocean mesoscale eddies, internal waves, sea ice, oil spills, and marine algae (Sonnewald et al., 2021; Dong et al., 2022).
In physical oceanography, the convolutional neural network (CNN), which is a deep learning technique used for image segmentation, was previously applied to predict the monthly sea surface salinity (SSS) (Zhang et al., 2023) and even the sea subsurface temperature (SSbT) (Sun et al., 2022), as well as for automated eddy detection and classification from sea surface height (SSH) maps (Lguensat et al., 2018) or infrared satellite imagery (Moschos et al., 2023) and even to identify oil spill instances in synthetic aperture radar (SAR) images (Shaban et al., 2021). The U-Net model is a type of CNN that was initially developed for the recognition of different cellular structures in biomedical images (Ronneberger et al., 2015) before being applied in several fields of oceanography such as in eddy detection (Moschos et al., 2023) or to track tracers of micro-borers in coral cores (Alaguarda et al., 2022).
In this paper, we will identify and monitor the coastally originating water using a deep learning technique (U-Net) and ocean color images to address the following questions: what is the frequency of the coastal–offshore water exchange? In which parts of the Levantine coasts would this eddy formation and pinching-off occur the most? Is there any seasonality in the coastal–offshore interactions? What factors could be influencing these events?
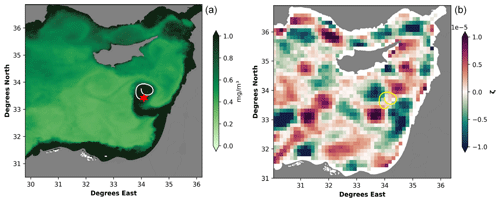
Figure 2Panel (a) represents the 8 d average chlorophyll image for the days between 21 to 28 August 2009, while panel (b) represents the relative vorticity average for the corresponding days computed from the altimetry data. Both are overlaid onto the trajectory of a drifter corresponding to these days, with the red star representing the starting location of the drifter.
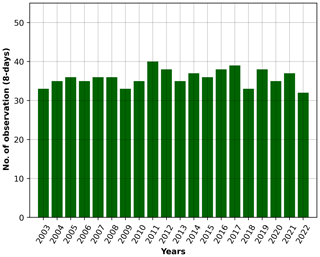
Figure 3The yearly variation of the available ocean color observations (Chl a and Rrs) in the Levantine Sea from 2003 to 2022.
The paper is structured as follows: in Sect. 2, we provide an overview of the data. Section 3 details the training of the U-Net model. From Sect. 4.1 to 4.2.1, we present our results regarding the monitoring of pinching-off events. In Sect. 5, we discuss these results before concluding with the main findings in Sect. 6.
In this section, we present the data and the methodology used to develop the pattern detection model that tracks off-shore coastally originating water.
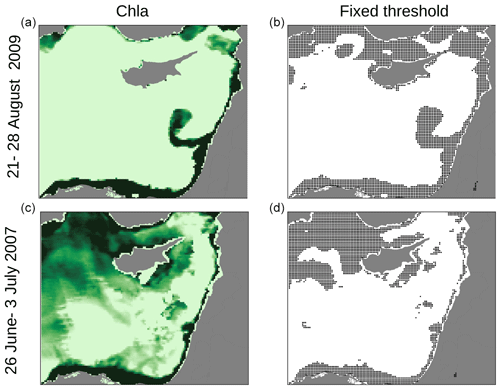
Figure 4The figures in the left panels represent the average chlorophyll images for the days between 21 to 28 August 2009 and from 26 June to 3 July 2007. The figures in the right panels show the pinched-off water predicted by a predefined threshold, represented by the dark dots for the two corresponding cases.
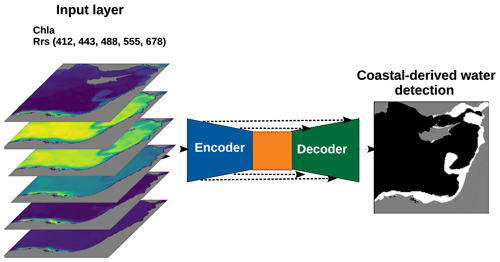
Figure 5The input layer, consisting of Chl-a (chlorophyll-a) and reflectance images (at wavelengths of 412, 443, 488, 555, and 678 nm) that will be downsampled by the encoder before restoring the dimensions to the original size of the input image by the decoder. The final output layer of the U-Net architecture produces a prediction mask, where each pixel is assigned a class label. The white pixels represent the coastally derived nutrient-rich water.
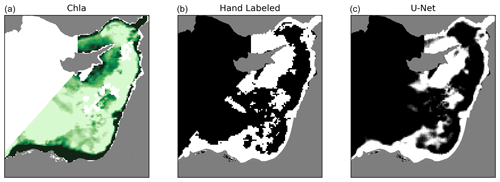
Figure 6Panel (a) shows the 8 d average Chl-a images for the days between 28 July to 4 August 2005. The manually labeled coastally originating water is presented in (b) and is compared to the result of the U-Net prediction in (c).
Chlorophyll and reflectance data
We retrieved MODIS-Aqua chlorophyll (Chl a) and remote sensing reflectance (Rrs) at five wavelengths (412, 443, 488, 555, and 678 nm) using level-3 data from GSFC-NASA, with a spatial resolution of 1 km and a temporal resolution of 8 d, spanning from 2003 to the end of 2022. The use of Rrs and Chl a to detect coastal-water advection was inspired by several studies that use these parameters to classify oceanic water masses (Mélin and Vantrepotte, 2015; Spyrakos et al., 2011; Moore et al., 2009; Botha et al., 2020; Martin Traykovski and Sosik, 2003; Jackson et al., 2017; Wei et al., 2022). Spectral classification of satellite Rrs data allows for the distinguishing and grouping of waters with bio-optical and biogeochemical features that may explain the productivity and the constituents of a given waterbody. Moreover, Rrs provides observations that are independent of the chlorophyll estimation algorithms (Cannizzaro and Carder, 2006). The impact of merging chlorophyll and reflectance data on the model's detection performance is presented in Table A1 in the Appendix.
Following the exclusion of images under heavy cloud, we retained 718 out of the total 920 weekly images per product, accounting for approximately 80 % of the dataset. The temporal distribution of this dataset is visually depicted in Fig. 3, illustrating that the number of available images varied between 30 and 40 observations per year.
Detecting and labeling offshore coastally derived water masses can be challenging. Although the pinched-off water could be visually noticed by ocean color images, using a simple statistical approach to detect it could lead to biases when applied to a larger dataset. A typical case is presented in Fig. 4, where detecting these relatively chlorophyll-rich waters was based on values exceeding the top percentile threshold of 20 %. This threshold was selected subjectively to optimize the coastally derived water detection for this case. Although this approach may yield efficient results for the first case (days between 21 to 28 August 2009; see upper panel), the selected threshold underestimated the density of the pinched-off water for the other case (days between 26 June to 3 July 2007; see lower panel). These two examples illustrate that the usage of simple statistical methods might work well for one case but may not necessarily be effective for another. Moreover, such an approach did not accurately delimitate these targeted pinching-off features in both cases. Accordingly, there is a need to develop a more systematic approach to detect pinching-off phenomena.
3.1 The U-Net architecture
To achieve our goal, we utilized a convolutional neural network (CNN), specifically the U-Net encoder–decoder architecture, known for its precise object detection and identification in image analysis tasks, employing a repetitive process involving consecutive convolutions and downsampling operations (Ronneberger et al., 2015). The final layer applied a sigmoid function (Han and Moraga, 1995) to assign probabilities to pixels, determining the categories based on the highest probability while training optimized parameters using the Adams algorithm (Kingma and Ba, 2014) and the binary cross-entropy loss function.
3.2 Input layer
The input layer of U-Net was formed by the reflectance (at wavelengths of 412, 443, 490, and 555 nm) and chlorophyll data (see Fig. 5). To specifically focus on detecting along-slope coastal water in the easternmost part of the Levantine Sea, the targeted area began at the Nile (30° E). This approach also excluded the most prominent features of the basin, such as the Ierapetra and Mersa-Matruh eddies located offshore between 26 and 29° E, thereby avoiding biases related to the presence of dominant features during the training process.
The spatial resolution of the input data was downgraded from 1 to 5 km during the training process. This downsampling was implemented to accommodate computational constraints and to ensure compatibility with the model architecture. From the total dataset, we selected a subset of 124 chlorophyll images. Each image was divided into the foreground, representing the coastally derived water (labeled 1), and the background, representing the offshore water (labeled 0), through a binary classification using the image manipulation software GIMP (see the middle panel in Fig. 6). The labeling was performed based on two criteria: the contrast in Chl-a concentrations between the offshore and coastally derived water (left panel) and the continuity with the coastal Chl-a gradient. The sharp decrease in the Chl-a gradient delimits the boundaries between the coastally derived features and the offshore water.
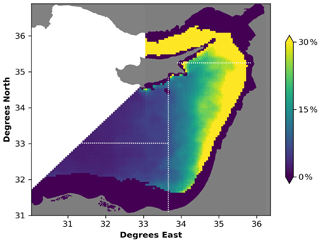
Figure 7The percentage of the coastally derived water in each pixel of the Levantine Sea averaged from the start of 2003 until the end of 2022. The vertical white lines represent imaginary lines delimiting the southern and eastern blocks.
The entirety of the 124-image dataset was split into a training set consisting of 104 images, a validation set consisting of 10 images for refining hyperparameters, and a separate test set consisting of 10 images to evaluate the final model's performance. To ensure a comprehensive evaluation of our U-Net model's performance by capturing the different environmental dynamics throughout the entire annual cycle, we selected the validation and test datasets in a way that encompasses diverse seasonal variations. To significantly expand the training set, which is crucial for the machine learning approach, we applied a data augmentation technique by rotating the image left, right, up, and down. This technique allowed us to increase the training dataset from 104 to 428 images. Such an increase had a significant impact in increasing the accuracy of the model (see Table A2).
We carefully observed the loss function of validation data throughout the training phase to prevent overfitting of the model. Additionally, the low seasonality in our data reduced the likelihood of overfitting due to the low occurrence of repeated patterns. As a result, our model was able to generalize effectively to previously unseen data.
Model training allowed us to identify coastally originating water, with its predictions being expected to produce values close to 1 for this class, indicating a high probability of coastal-water presence. A typical example of the U-Net model detection of the coastal water is presented in Fig. 6 (right panel).
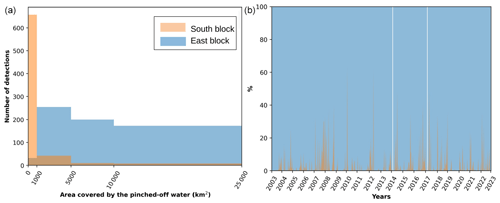
Figure 8The histogram in the left panel illustrates the surface covered by the pinched-off water in the eastern (blue) and southern (orange) blocks from 2003 to 2023. Panel (a) shows the percentage variation of each block contribution to the total pinched-off water. The vertical white lines represent days where the pinching-off events were absent in both blocks.
3.3 Model tuning
Model tuning aims to obtain the optimal model with the lowest loss during the validation. Because the dataset is imbalanced, with more offshore water compared to coastally derived water, we evaluated the model precision using different metrics such as precision, recall, and F1 score. Moreover, we estimated the percentage of the surface difference between our model predictions and the ground truth data. This percentage represents the variation between the manually labeled surface area and the predictions generated by the U-Net model. More information on the model optimization and fine-tuning scores is presented in Table A2 in the Appendix.
Furthermore, to assess the model's applicability to new images, we used the test dataset independently of both the training and tuning phases of the U-Net. It serves as a reliable reference to evaluate the model's capacity to generalize its classification performance. The model's performance scored a precision of 0.9, a recall of 0.73, and an F1 score of 0.8, with an average surface error of less than 3 % when tested on new unseen data.
The model developed in this paper demonstrated superior accuracy compared to other approaches when detecting coastal water, e.g., with regard to the 20 % top percentile threshold described earlier in this section. Indeed, applying the predefined threshold method to the test dataset increased the surface error by more than 38 % due to the overestimation problem. These results underscore the robustness of our model in accurately capturing the intended metrics, making it a more reliable tool for analysis in this domain.
In this section, we will present the results of applying the detection model to the 718 weekly data available from 2003 to 2022. We used a mask that excludes pixels where the detected water occurs more than 60 % of the time, removing the coastal quasi-permanent currents and focusing on the pinching-off water.
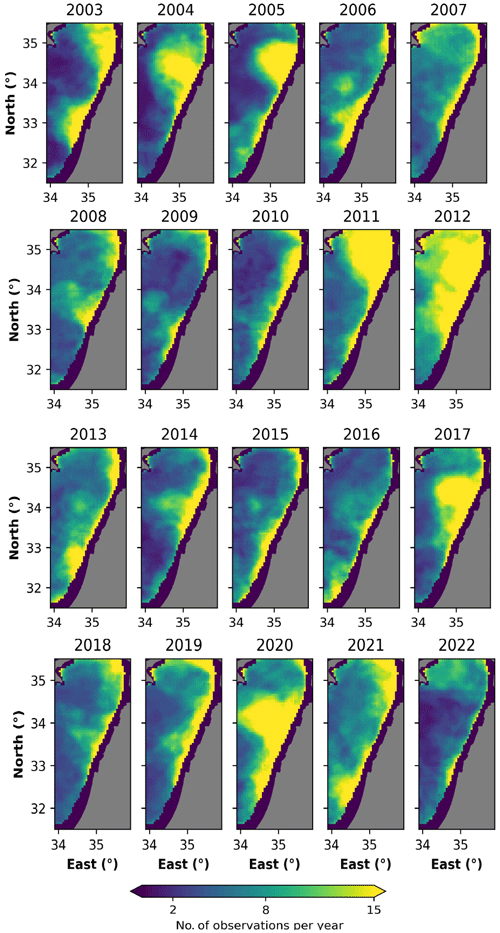
Figure 9The yearly variation of the pinched-off water in the eastern block from 2003 to 2022. The color bars indicate the number of observations (based on 8 d images) per year.
4.1 Quantification of the pinching-off amplitude
4.1.1 Region-based analysis
Figure 7 reveals the spatial distribution of pinched-off water occurrences. The along-slope coastal circulation has been removed from the analysis to isolate and highlight the deviations or pinching-off events.
The results show the existence of a clear horizontal gradient in the Levantine Sea, where the highest frequencies were observed in the easternmost part, starting from 33° E, and up to the north, where, in certain areas or pixels within this region, the pinched-off water was detected in more than 30 % of the total observations. In contrast, in the southern part of the Egyptian coasts, the frequency of the pinching-off events decreases to values that are close to zero.
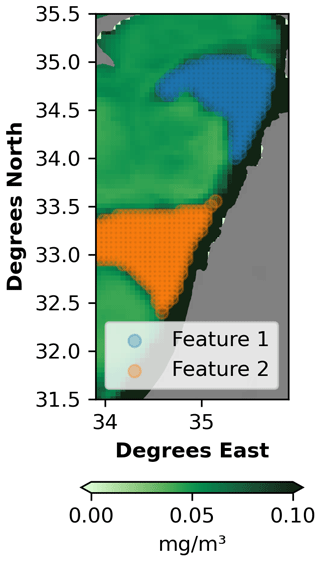
Figure 10An example of the DBSCAN clustering algorithm detecting two distinct features (features 1 and 2) overlaid onto the corresponding chlorophyll image taken from 29 August to 5 September 2003.
In order to further evaluate the occurrence of pinched-off water, we divided the basin into two blocks (separated by the dashed line in Fig. 7). The first block encompasses the region where the coastal flow mainly extends eastward from the Nile River until 33.8° E. The second block marks the region where the coastal flow shifts northward upon crossing around 33.8° E and continues until the passage between the Cypriot and the Syrian coasts. In Fig. 8, the left panel shows the variation of the surface covered by pinched-off water in each of these two blocks. The results reveal that, during almost all the studied weeks (∼600 weekly observations), the pinched-off coastal water in the southern part did not cover more than 1000 km2, meaning that these events occur in a few parts of this area and fail to evolve into larger features and so remain very limited. On the contrary, in the eastern block, the size of the pinched-off water expands significantly, with coastal water spanning over 5000 km2 in more than 400 weekly observations. Furthermore, in over 200 instances of those cases, it extends even further, covering more than 10 000 km2 of the block.
The right panel in Fig. 8, which represents the weekly percentage contribution of each block to the total pinching-off, shows similar trends. The results reveal that most of the pinched-off water occurs in the eastern part rather than in the southern part. This dominance is almost permanent but fluctuates interannually. Additionally, it is noteworthy that the southern block experiences a complete absence of pinched-off water, a phenomenon observed in 456 weeks, representing around 63 % of the total studied weeks. On the contrary, pinching-off events are consistently observed in the eastern block.
These results suggest that the coastal flow entering the Levantine Sea starts as a more stable flow while flowing eastward off the Egyptian coasts. Then instabilities increase, and the pinching-off events occur mainly when the flow deviates northward around ∼34° E and until the passage between the Syrian and Cypriot coasts. Such a difference could be related to the difference in the bathymetry between these two blocks. The Egyptian offshore bathymetry is characterized by a plain extending for several kilometers off the coasts, contrarily to the eastern block, where the plain becomes very limited and quasi-nonexistent, which could cause some increases in the vorticity that would be similar to those observed. Indeed, the coastal current is more stable over an extended seafloor as water tends to follow lines of isobaths. The narrowing of the continental shelf in the easternmost part of the basin could cause the shifting of the flow over the slope, which reduces the stabilizing effect of the seafloor and can lead to the offshore flow observed. According to Sutyrin et al. (2009), the deep flow could shift offshore when the bathymetry changes interact with the upper layer to provide an along-slope vortex drift proportional to the basic drift speed and the steepness.
It is noteworthy that, although the previous study in Baaklini et al. (2022) highlighted the presence of high vorticity in the coastal current along the Egyptian coast, our findings demonstrate that this elevated vorticity does not lead to the formation of permanent pinching-off eddy events.
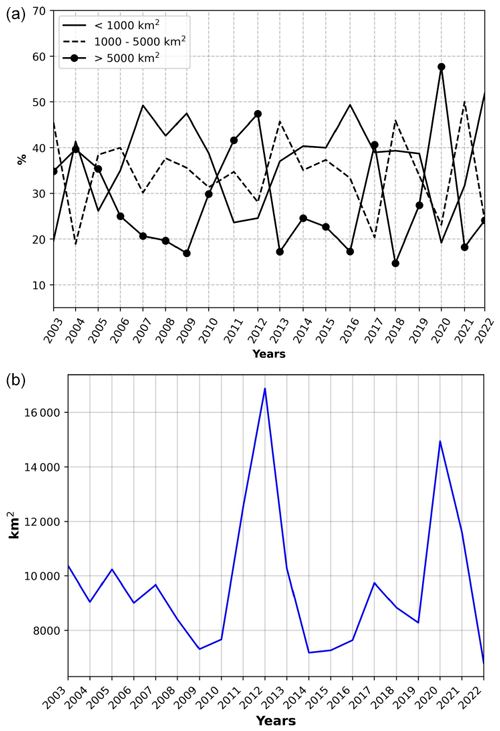
Figure 11Panel (a) presents the yearly percentages of small-scale (less than 1000 km2), mid-scale (covering 1000 to 5000 km2), and extended-scale (more than 5000 km2) features in the eastern block of the Levantine Sea from 2003 to 2022. The yearly variation of the mean surface covered by the pinched-off water (in km2) is presented in (b).
4.1.2 Yearly comparison
Previous findings have demonstrated that interactions primarily occur within the eastern block, which is in contrast to the southern region of the Levant, where the pinching-off events are notably limited and entirely absent in half of the observed instances. Consequently, our subsequent sections will be dedicated to an in-depth analysis of the coastal–offshore interactions within the eastern block.
To have a better understanding of the dynamic evolution of coastal water in this block, we present the yearly variations of the pinched-off coastal-water density in Fig. 9. Results reveal significant variations in the spatial extent of pinched-off coastal water from year to year. In certain years, the deviated water may either be limited or fail to develop into stable and enduring features, as observed in 2007, 2010, and 2022. Alternatively, it can evolve into spatially extensive structures, especially notable in 2011, 2012, 2017, and 2020. During these years, clear eddy structures were observed for more than 15 weeks, indicating their persistence for over 4 months. Overall, these pinched-off structures were primarily located in the northern part of the Lebanese coast, while, in the southern part, they are less observed; although there are years where structures evolved close to the coast, such as in 2003, 2006, 2013, and 2021, they remain spatially limited.
The results highlight the intricate and stochastic nature of the interaction between offshore and coastal waters. A year characterized by intense pinching-off events and the formation of eddy structures, such as 2017, may be preceded by and followed by years with less pronounced pinching-off occurrences. Additionally, the spatial distribution of these structures varies on short timescales. For instance, a distinct feature could be observed in the northern part of Lebanon, followed by the emergence of eddy structures in the southern region after 1 year (such as in 2005 and 2006).
While this approach enhanced our comprehension of the coastal current patterns in the eastern part of the Levantine Sea by quantifying the pinching-off events, it did not include an analysis of the evolving dynamical structures. Consequently, during years marked by frequent pinching-off, the understanding of these events remains unclear. For example, the year 2017 shows a prolonged pinching-off event that persisted for over 15 weeks along the coastline of Lebanon. This particular occurrence may be associated with either an elongated and stationary dynamical structure or a structure continuously drifting in close proximity to the coast. To surpass these limitations and better analyze the characteristics of these pinched-off structures, we applied a DBSCAN (Density-Based Spatial Clustering of Applications with Noise) clustering algorithm to the detected patterns. DBSCAN is one of the popular clustering techniques that can recognize clusters of various shapes while efficiently dealing with outliers in the data. It performs target-dependent clustering by marking points that lie within a specified radius (ε) as “neighbors” and designating core points if they have at least the minimum number of neighbors (MinPts). In contrast to other clustering methods, such as k-means clustering, DBSCAN does not require a predefined number of clusters, making it particularly advantageous for exploratory data analysis. In this paper, we used the DBSCAN clustering method because it is highly efficient in discovering clusters of varying shapes and sizes without requiring prior knowledge of the number of clusters. The results are presented in the following (Sect. 4.2).
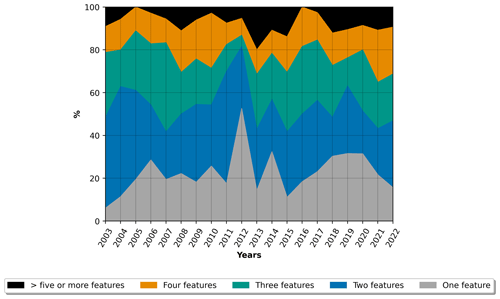
Figure 12The percentage variation in the number of coexisting features observed simultaneously in the eastern part of the Levantine Sea from 2003 to 2022.
4.2 Spatial features within pinched-off structures
The DBSCAN clustering algorithm demonstrates remarkable efficacy in grouping data points that are spatially proximate to each other, using, in our case, the distance criterion derived from the coordinates of pinched-off water. It is important to highlight that, for this approach, we intentionally excluded the along-slope coastal circulation, which is consistently present, in order to focus on the structures of the derived water only.
By employing this approach, it becomes possible to separate distinct features. As an example, in Fig. 10, after detecting the pinched-off water in the eastern block of the 8 d averaged observations between 29 August to 5 September 2003, the DBSCAN separates these waters into two distinct features characterized by their size and location: the so-called feature 1, which corresponds to an extended eddy located north of the Lebanese coasts, and feature 2, which corresponds to another structure, located more to the south. In this way, due to the size and positioning of features identified using DBSCAN, we are able to distinguish between weeks of a high density of pinched-off water due to extended dynamical structures or due to the coexistence of several smaller-scale dynamical features.
We separated these features into three groups based on their sizes: the small scale, constituting those features whose sizes are less than 1000 km2; the mid-scale, whose features range from 1000 to 5000 km2; and the extended scale, characterized by feature sizes exceeding 5000 km2. The percentage variation of the three different groups from 2003 until 2022 is presented in Fig. 11 (upper panel).
Small-scale and mid-scale features predominated in most years, especially when the pinching-off intensity was weaker (see lower panel), which could probably mean that these structures have a shorter lifetime and/or are not stationary features flowing off-shore along the Levantine slope, failing to evolve into intense and persistent mesoscale features. On the other hand, in the years with the highest persistence, the percentage of extended features increased, surpassing 40 % of the total structures, as seen in 2011, 2012, and 2020.
These results reveal a strong correlation between the size of the pinched-off features and the persistence of these events. During the year of the lowest pinching-off events (see Fig. 11, lower panel), the small-scale structure represented around 50 % of the existing features. On the contrary, the highest percentage of extended-scale features was more than 40 %, observed during years with the highest density of pinched-off water.
Figure 12 illustrates the percentage variations in the number of simultaneous features in the Levantine Sea. It reveals that coastal activity typically involves the coexistence of multiple patterns. The typical scenario involves the simultaneous evolution of two to three distinct features, although, occasionally, this number may just barely rise to as many as six evolving structures. However, single-feature dominance was also a common occurrence, and this varied from year to year, with an increase during years when extended features dominated, as seen in 2012.
Overall, these results prove that simultaneous pinching-off events occur at several points in the coastal flow, leading to numerous features evolving in the eastern block at different spatial scales. These structures are mainly limited spatially and have a short life span, except for the year of intensification. Indeed, the persistence of pinched-off coastal water in the Levantine Sea is directly related to the presence of large-scale structures.
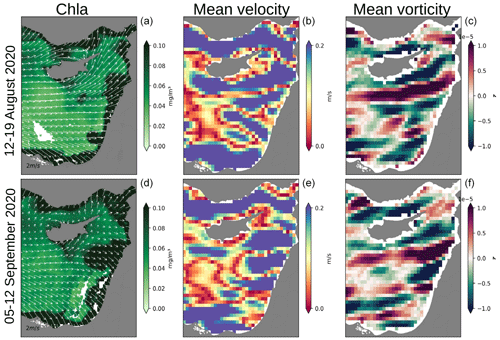
Figure 14Two chlorophyll images (12–19 August and 5–12 September 2020) (a, d) compared to the altimetry-derived average velocity field (b, e) and relative vorticity (c, f). The chlorophyll images are overlaid onto the average velocity field of the average wind speed for the corresponding days.
4.2.1 Seasonal comparison
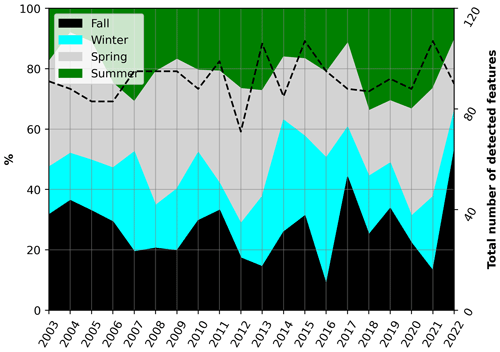
In Fig. 13, we show the annual variation in the total number of pinched-off structures (represented by the dashed lines) alongside the seasonal variations of these events.
The results indicate a general pattern of pinching-off structures evolving across various seasons, with their lowest occurrence during spring, although there are exceptions in a few years. Moreover, during the years of maximum intensity, with strong and long-lasting structures, such as in 2011 and 2012, these events were predominantly observed during the summer and fall seasons. Additionally, it is worth highlighting that the overall count of pinched-off features displays variations from year to year, with the total number of pinched-off structures fluctuating between ∼80 to ∼110 features per year.
The results of monitoring 718 8 d ocean color data in the Levantine Sea from 2003 to 2022 indicated low activity in the southern section of the coastal current (along the Egyptian coast), where pinching-off events were absent in more than half of these observations. In contrast, in the eastern part (along the Lebanese coast), there were notable increases in turbulence, leading to persistent pinching-off events. Yearly analysis of the pinching-off variations shows that they often evolve into features with relatively short lifespans, lasting only a few weeks and being constrained in terms of their spatial extent. However, in 2011, 2012, 2017, and 2020, spatially extended and stable structures could be formed, lasting more than 4 months. The seasonal analysis has revealed that the most pronounced activity of these structures occurs during the summer and fall seasons. Furthermore, while pinching-off events can be observed throughout all seasons, winter consistently records the lowest activity of these structures.
While pinching-off events are observed along various segments of the Lebanese shoreline, resulting in the concurrent development of multiple evolving features, it is noteworthy that the northern part of the Lebanese coast stands out for its more stable and long-lasting eddies. In contrast, the southern region predominantly reveals the formation of short-lived eddies.
Overall, this complex behavior can be related to variations in the bathymetry and convexity of the coastline (Atkinson et al., 1986; Lillibridge III et al., 1990; Stern and Whitehead, 1990; Ou, 1994). Specifically, a significant transition in bathymetry occurs: from a substantial abyssal plain extending several kilometers from the coast to a nearly non-existent plain in the eastern region (around approximately 33.8° E). This shift in bathymetry induces offshore displacement of the deep flow due to interactions between the changing bathymetry and the upper layer, resulting in the generation of an along-slope vortex drift that is proportional to the underlying drift speed and steepness.
In parallel, studies have shown that, in late winter and early spring, this coastal current is very weak or completely absent (Rosentraub and Brenner, 2007). However, in summer, this current is well-defined where it separates from the coast and turns westward to the open sea to form large, offshore, cyclonic eddies (Brenner, 2003). In October, this current is somewhat weaker than in summer and appears to dissipate to the north. This latter inter-seasonal variability within the coastal current might explain a part of the seasonal dependence of the pinching-off events.
These findings underscore the dynamic nature of coastal-water behavior and offer insights into the diverse range of circulation patterns observed in the Levantine Sea, which cannot be fully captured by current altimetry methods.
In this study, we explored the coastal dynamics of the Levantine Sea, particularly its interaction with the offshore water. We have developed a pattern detection model that enables the detection and monitoring of derived coastal-water deviations from the coastal flow. The model is based on the U-Net convolutional neural network (CNN) architecture, trained on 8 d high-resolution chlorophyll and reflectance data (wavelengths of 412, 443, 488, 555, and 678). This methodology offers valuable insights into the intricate dynamics between the coast and offshore regions, previously unresolved due to the lack of in situ observations and altimetry inaccuracies close to the shore, thereby advancing our comprehension of the circulation patterns governing the Levantine Sea.
The reconstruction of the averaged surface current provided by the altimetry did not enable the reproduction of the structures resulting from these coastal offshore interactions. From here, there is a need to increase the deployment of in situ observations in this area. This will provide an accurate assessment of a possible correlation between the intensity of the coastal flow and the density of pinching-off water. For instance, the results of this study second the hypothesis behind pinching-off events appearing to originate from the interaction between the inter-seasonal variability of the coastal flow and the bathymetric irregularities.
Including sea surface temperature (SST) or integrating more precise altimetric observations (such as SWOT (Surface Water and Ocean Topography) satellite) might help to better understand these dynamics. Our approach proved to be a promising solution to address the limitations associated with traditional methods of coastal-water monitoring and delimitation. Additionally, this method can be expanded to different geographical areas, thereby contributing to an objective characterization of small-scale ocean phenomena. This, in turn, will enhance our understanding of their dynamics and their role in ocean–atmosphere interactions, such as heat and carbon exchange.
The chlorophyll and reflectance data were retrieved from https://doi.org/10.5067/AQUA/MODIS/L3B/CHL/2018 (NASA Goddard Space Flight Center, Ocean Ecology Laboratory, Ocean Biology Processing Group, 2024). The bathymetric data used in the figures are GEBCO data at 400 m resolution, available at https://download.gebco.net/ (GEBCO, 2020). The drifter data were obtained from https://doi.org/10.6092/7a8499bc-c5ee-472c-b8b5-03523d1e73e9 (Menna et al., 2018). The altimeter products were retrieved from http://www.aviso.altimetry.fr/duacs/ (SSALTO/DUACS, 2022).
The study was conceptualized by GB and REH. The methodology was developed by GB, REH, and JB. Any software used was developed by GB, REH, and GF. Validation was done by GB, REH, JB, LI, GF, and LM. Formal analysis was conducted by GB and REH. The investigation was conducted by GB, REH, LI, JB, and LM. Resources were obtained by REH and LM. Data curation was done by GB, REH, and GF.
The contact author has declared that none of the authors has any competing interests.
Publisher’s note: Copernicus Publications remains neutral with regard to jurisdictional claims made in the text, published maps, institutional affiliations, or any other geographical representation in this paper. While Copernicus Publications makes every effort to include appropriate place names, the final responsibility lies with the authors.
This article is part of the special issue “Special Issue for the 54th International Liège Colloquium on Machine Learning and Data Analysis in Oceanography”. It is not associated with a conference.
Georges Baaklini gratefully acknowledges the Council for Scientific Research of Lebanon (CNRS-L) for their generous support, which has been instrumental in completing GB's PhD thesis, of which this work is a continuation. Roy El Hourany acknowledges the ANR Chaire Professeur Junior grant no. ANR-22-CPJ1-0003-01.
This work is supported by the graduate school IFSEA, which benefits from a France 2030 grant (no. ANR-21-EXES-0011) operated by the French National Research Agency.
This paper was edited by Ana Ruescas and reviewed by Jack Barth and one anonymous referee.
Alaguarda, D., Brajard, J., Coulibaly, G., Canesi, M., Douville, E., Le Cornec, F., Lelabousse, C., and Tribollet, A.: 54 years of microboring community history explored by machine learning in a massive coral from Mayotte (Indian Ocean), Front. Mar. Sci., 9, 899398, https://doi.org/10.3389/fmars.2022.899398, 2022. a
Amitai, Y., Lehahn, Y., Lazar, A., and Heifetz, E.: Surface circulation of the eastern Mediterranean Levantine basin: Insights from analyzing 14 years of satellite altimetry data, J. Geophys. Res.-Oceans, 115, C10058, https://doi.org/10.1029/2010JC006147, 2010. a
Atkinson, L. P., Brink, K. H., Davis, R. E., Jones, B. H., Paluszkiewicz, T., and Stuart, D. W.: Mesoscale hydrographic variability in the vicinity of Points Conception and Arguello during April–May 1983: the OPUS 1983 experiment, J. Geophys. Res.-Oceans, 91, 12899–12918, 1986. a
Baaklini, G.: Characterization of the Eastern Mediterranean surface dynamics: Insights from drifter assimilation and machine learning techniques, PhD thesis, Sorbonne Université, https://theses.hal.science/tel-03828273 (last access: 23 April 2024), 2022. a
Baaklini, G., El Hourany, R., Fakhri, M., Brajard, J., Issa, L., Fifani, G., and Mortier, L.: Surface circulation properties in the eastern Mediterranean emphasized using machine learning methods, Ocean Sci., 18, 1491–1505, https://doi.org/10.5194/os-18-1491-2022, 2022. a, b
Barale, V., Jaquet, J.-M., and Ndiaye, M.: Algal blooming patterns and anomalies in the Mediterranean Sea as derived from the SeaWiFS data set (1998–2003), Remote Sens. Environ., 112, 3300–3313, https://doi.org/10.1016/j.rse.2007.10.014, 2008. a
Botha, E. J., Anstee, J. M., Sagar, S., Lehmann, E., and Medeiros, T. A.: Classification of Australian waterbodies across a wide range of optical water types, Remote Sens., 12, 3018–3041, https://doi.org/10.3390/rs12183018, 2020. a
Brenner, S.: High-resolution nested model simulations of the climatological circulation in the southeastern Mediterranean Sea, Ann. Geophys., 21, 267–280, https://doi.org/10.5194/angeo-21-267-2003, 2003. a
Cannizzaro, J. P. and Carder, K. L.: Estimating chlorophyll a concentrations from remote-sensing reflectance in optically shallow waters, Remote Sens. Environ., 101, 13–24, https://doi.org/10.1016/j.rse.2005.12.002, 2006. a
Cipollini, P., Benveniste, J., Bouffard, J., Emery, W., Gommenginger, C., Griffin, D., Høyer, J., Madsen, K., Mercier, F., Miller, L., et al.: The role of altimetry in coastal observing systems, Proceedings of OceanObs, 9, 181–191, https://doi.org/10.5270/OceanObs09.cwp.16, 2010. a
Dong, C., Xu, G., Han, G., Bethel, B. J., Xie, W., and Zhou, S.: Recent developments in artificial intelligence in oceanography, Ocean-Land-Atmosphere Research, 2022 9870950, https://doi.org/10.34133/2022/9870950, 2022. a
Escudier, R., Mourre, B., Juza, M., and Tintoré, J.: Subsurface circulation and mesoscale variability in the Algerian subbasin from altimeter-derived eddy trajectories: ALGERIAN EDDIES PROPAGATION, J. Geophys. Res.-Oceans, 121, 6310–6322, https://doi.org/10.1002/2016JC011760, 2016. a
Fifani, G., Baudena, A., Fakhri, M., Baaklini, G., Faugère, Y., Morrow, R., Mortier, L., and d'Ovidio, F.: Drifting Speed of Lagrangian Fronts and Oil Spill Dispersal at the Ocean Surface, Remote Sens., 13, 4499, https://doi.org/10.3390/rs13224499, 2021. a
GEBCO: GEBCO 2020 Grid, version 2020.0, https://www.gebco.net (last access: 11 July 2024), 2020. a
Han, J. and Moraga, C.: The influence of the sigmoid function parameters on the speed of backpropagation learning, in: International workshop on artificial neural networks, 195–201, Springer, https://link.springer.com/content/pdf/10.1007/3-540-59497-3_175.pdf (last access: 11 July 2024), 1995. a
Jackson, T., Sathyendranath, S., and Mélin, F.: An improved optical classification scheme for the Ocean Colour Essential Climate Variable and its applications, Remote Sens. Environ., 203, 152–161, https://doi.org/10.1016/j.rse.2017.03.036, 2017. a
Kingma, D. P. and Ba, J.: Adam: A method for stochastic optimization, arXiv [preprint], https://doi.org/10.48550/arXiv.1412.6980, 22 December 2014. a
Levy, M. and Martin, A. P.: The influence of mesoscale and submesoscale heterogeneity on ocean biogeochemical reactions: INFLUENCE OF HETEROGENEITY, Global Biogeochem. Cy., 27, 1139–1150, https://doi.org/10.1002/2012GB004518, 2013. a
Lguensat, R., Sun, M., Fablet, R., Tandeo, P., Mason, E., and Chen, G.: EddyNet: A deep neural network for pixel-wise classification of oceanic eddies, in: IGARSS 2018-2018 IEEE International Geoscience and Remote Sensing Symposium, Valencia, 22–27 July 2018, 1764–1767, https://doi.org/10.1109/IGARSS.2018.8518411, 2018. a
Lillibridge III, J., Hitchcock, G., Rossby, T., Lessard, E., Mork, M., and Golmen, L.: Entrainment and mixing of shelf/slope waters in the near-surface Gulf Stream, J. Geophys. Res.-Oceans, 95, 13065–13087, https://doi.org/10.1029/JC095iC08p13065, 1990. a
Martin Traykovski, L. V. and Sosik, H. M.: Feature-based classification of optical water types in the Northwest Atlantic based on satellite ocean color data, J. Geophys. Res.-Oceans, 108, 3150–3167, https://doi.org/10.1029/2001JC001172, 2003. a
Mélin, F. and Vantrepotte, V.: How optically diverse is the coastal ocean?, Remote Sens. Environ., 160, 235–251, https://doi.org/10.1016/j.rse.2015.01.023, 2015. a
Menna, M., Poulain, P.-M., Zodiatis, G., and Gertman, I.: On the surface circulation of the Levantine sub-basin derived from Lagrangian drifters and satellite altimetry data, Deep-Sea Res. Pt. I, 65, 46–58, https://doi.org/10.1016/j.dsr.2012.02.008, 2012. a, b
Menna, M., Gerin, R., Bussani, A., and Poulain, P.-M.: Satellite-tracked surface drifting buoy (drifter) observations of currents and sea surface temperature in the Mediterranean Sea (1986–2016), nodc.ogs.it [data set], https://doi.org/10.6092/7A8499BC-C5EE-472C-B8B5-03523D1E73E9, 2018. a
Mkhinini, N., Coimbra, A. L. S., Stegner, A., Arsouze, T., Taupier-Letage, I., and Béranger, K.: Long-lived mesoscale eddies in the eastern Mediterranean Sea: Analysis of 20 years of AVISO geostrophic velocities, J. Geophys. Res.-Oceans, 119, 8603–8626, https://doi.org/10.1002/2014JC010176, 2014. a
Moore, T. S., Campbell, J. W., and Dowell, M. D.: A class-based approach to characterizing and mapping the uncertainty of the MODIS ocean chlorophyll product, Remote Sens. Environ., 113, 2424–2430, https://doi.org/10.1016/j.rse.2009.07.016, 2009. a
Moschos, E., Kugusheva, A., Coste, P., and Stegner, A.: Computer Vision for Ocean Eddy Detection in Infrared Imagery, in: Proceedings of the IEEE/CVF Winter Conference on Applications of Computer Vision, Hawaii, 3–7 January 2023, 6395–6404, https://doi.org/10.1109/WACV56688.2023.00633, 2023. a, b
NASA Goddard Space Flight Center, Ocean Ecology Laboratory, Ocean Biology Processing Group: Moderate-resolution Imaging Spectroradiometer (MODIS) Aqua Chlorophyll Data, 2018 Reprocessing, oceancolor.gsfc.nasa.gov [data set], https://doi.org/10.5067/AQUA/MODIS/L3B/CHL/2018, 2024. a
Ou, H. W.: Flow near a continental boundary driven by an oceanic jet, J. Phys. Oceanogr., 24, 966–978, https://doi.org/10.1175/1520-0485(1994)024<0966:FNACBD>2.0.CO;2, 1994. a
Pujol, M.-I. and Larnicol, G.: Mediterranean sea eddy kinetic energy variability from 11 years of altimetric data, J. Mar. Syst., 58, 121–142, https://doi.org/10.1016/j.jmarsys.2005.07.005, 2005. a
Ronneberger, O., Fischer, P., and Brox, T.: U-net: Convolutional networks for biomedical image segmentation, in: Medical Image Computing and Computer-Assisted Intervention–MICCAI 2015: 18th International Conference, Munich, Germany, 5–9 October 2015, Proceedings, Part III 18, 234–241, arXiv [preprint], https://doi.org/10.48550/arXiv.1505.04597, 18 May 2015. a, b
Rosentraub, Z. and Brenner, S.: Circulation over the southeastern continental shelf and slope of the Mediterranean Sea: Direct current measurements, winds, and numerical model simulations, J. Geophys. Res.-Oceans, 112, C11001, https://doi.org/10.1029/2006JC003775, 2007. a
Sarangi, R.: Observation of Oceanic Eddy in the Northeastern Arabian Sea Using Multisensor Remote Sensing Data, Int. J. Oceanogr., 531982, https://doi.org/10.1155/2012/531982, 2012. a
Shaban, M., Salim, R., Abu Khalifeh, H., Khelifi, A., Shalaby, A., El-Mashad, S., Mahmoud, A., Ghazal, M., and El-Baz, A.: A deep-learning framework for the detection of oil spills from SAR data, Sensors, 21, 2351, https://doi.org/10.3390/s21072351, 2021. a
Sonnewald, M., Lguensat, R., Jones, D. C., Dueben, P. D., Brajard, J., and Balaji, V.: Bridging observations, theory and numerical simulation of the ocean using machine learning, Environ. Res. Lett., 16, 073008, https://doi.org/10.1088/1748-9326/ac0eb0, 2021. a
Spyrakos, E., Vilas, L. G., Palenzuela, J. M. T., and Barton, E. D.: Remote sensing chlorophyll a of optically complex waters (rias Baixas, NW Spain): Application of a regionally specific chlorophyll a algorithm for MERIS full resolution data during an upwelling cycle, Remote Sens. Environ., 115, 2471–2485, https://doi.org/10.1016/j.rse.2011.05.008, 2011. a
SSALTO/DUACS: Processed by SSALTO/DUACS and Distributed by AVISO+, https://www.aviso.altimetry.fr (last access: 11 July 2024), 2022. a
Stern, M. E. and Whitehead, J.: Separation of a boundary jet in a rotating fluid, J. Fluid Mech., 217, 41–69, https://doi.org/10.1017/S0022112090000623, 1990. a
Sun, N., Zhou, Z., Li, Q., and Zhou, X.: Spatiotemporal Prediction of Monthly Sea Subsurface Temperature Fields Using a 3D U-Net-Based Model, Remote Sens., 14, 4890, https://doi.org/10.3390/rs14194890, 2022. a
Sutyrin, G., Stegner, A., Taupier-Letage, I., and Teinturier, S.: Amplification of a surface-intensified eddy drift along a steep shelf in the Eastern Mediterranean Sea, J. Phys. Oceanogr., 39, 1729–1741, https://doi.org/10.1175/2009JPO4106.1, 2009. a
Taupier-Letage, I., Puillat, I., Raimbault, P., and Millot, C.: Biological response to mesoscale eddies in the Algerian Basin, J. Geophys. Res., 108, 3245–3267, https://doi.org/10.1029/1999JC000117, 2003. a
Wei, J., Wang, M., Mikelsons, K., Jiang, L., Kratzer, S., Lee, Z., Moore, T., Sosik, H. M., and Van der Zande, D.: Global satellite water classification data products over oceanic, coastal, and inland waters, Remote Sens. Environ., 282, 113233, https://doi.org/10.1016/j.rse.2022.113233, 2022. a
Zhang, X., Zhao, N., and Han, Z.: A Modified U-Net Model for Predicting the Sea Surface Salinity over the Western Pacific Ocean, Remote Sens., 15, 1684, https://doi.org/10.3390/rs15061684, 2023. a


