the Creative Commons Attribution 4.0 License.
the Creative Commons Attribution 4.0 License.
 | 02 Feb 2024
Water properties and bottom water patterns in hadal trench environments
Charitha Pattiaratchi
Alan Jamieson
We examine baseline water properties and bottom water patterns in hadal trench environments across the Southern Ocean, Indian Ocean, and western Pacific. Significant differences are identified in the South Fiji Basin and surrounding the Philippine Sea, primarily due to the movement of cold Lower Circumpolar Deep Water along topographic features, highlighting the importance of a trench's geospatial position. We present the first hydrographic profiles in the Java Trench, warranting further research. Salinity increases with increasing depth for profiles over 10 000 dbar, with potential causes including instrumentation error, internal mixing, and saline pore water expulsion. These hadopelagic variations are crucial for assessing climate change impacts, especially regarding Antarctic Bottom Water. The study underscores the importance of incorporating these adiabatic conditions to gain insights into ecological biodiversity, alongside the indispensable baseline conditions presented, which are crucial for future oceanographic research across multiple disciplines.
- Article
(5418 KB) - Full-text XML
-
Supplement
(3650 KB) - BibTeX
- EndNote


The oceanic hadal zone, regions where water depths are greater than 6000 m, is located mainly in subduction trenches, fracture zones, and a few deep basins (Jamieson and Stewart, 2021). These remote regions are arguably the most understudied habitat in the marine environment (Webb et al., 2010). The most conspicuous geomorphological features of the hadal zone are the large subduction trenches in the Atlantic, Southern, and Indian oceans and, particularly, the Pacific Ocean (Jamieson, 2015). These trenches are characterized by extreme pressures, cold temperatures, no light penetration, frequent subduction earthquakes, and geothermal heating of 0.05 ∘C within waters of the same salinity (Jamieson et al., 2010; Taira et al., 2005; Oguri et al., 2013; Joyce et al., 1986). Of these 27 trenches, most exceed 8000 m in depth, with 4 exceeding 10 000 m (Bongiovanni et al., 2021). The volume of water with depth greater that 6000 m is approximately 0.21 % of the total ocean; however, it is 45 % of the ocean's total depth range (Jamieson, 2015).
Sampling and exploration of the hadal benthic habitats have, in recent years, seen a renaissance (Jamieson, 2018), with biological data sets being obtained for multiple taxonomic groups from multiple depths over multiple trenches (Jamieson et al., 2021; Jamieson and Stewart, 2021; Swan et al., 2021; Weston and Jamieson, 2022). As these studies develop from simple species discovery and observations of presence or absence, other abiotic factors are required to explain larger-scale ecological patterns in vertical distribution and biogeography (Nunoura et al., 2016; Glud et al., 2013). For example, hadal benthic fauna are supported by the deposition of nutritious organic material from the surface ocean into the trench sediments (Ichino et al., 2015), increasing microbial activity and carbon accumulation through mass-wasting events or internal waves (Oguri et al., 2022; Turnewitsch et al., 2014; van Haren, 2020b). In addition, understanding these habitats' geomorphological structuring is valuable for explaining species' relationships with substrate (Stewart and Jamieson, 2018; Jamieson et al., 2022). While single-point temperature and salinity measurements were made in multiple trenches in the 1950s and 1960s (Belyaev, 1989), full-ocean-depth hydrographic profiles of conductivity (for salinity), temperature, and depth (CTD) are rarely reported, excluding those surrounding the Izu–Bonin–Mariana arc system, making inter-trench variation therein seldom accounted for in observations (Stewart and Jamieson, 2018; Jamieson and Fujii, 2011).
The extrapolation of hydrographic conditions to a trench system's broader physical oceanographic context has been notably underrepresented in research. However, regional studies have provided insight into these depths but with some bias towards the Challenger Deep in the Mariana Trench (Greenaway et al., 2021; Mantyla and Reid, 1978; Taira et al., 2005; van Haren et al., 2017, 2021; Taira et al., 2004) and neighbouring trenches (Kawagucci et al., 2018; Taira, 2006). Long-term temperature sensor deployments have shown the impact of internal tidal waves and turbulent spurs due to warm waters pushed from above the trench on the movement of the water below 6000 m. These examples of turbulent mixing, not accounting for horizontal advection, can potentially decrease stratification to a degree comparable to that of geothermal heating (convective turbulence) (van Haren, 2023). Considering this, turbulence can be 10 times higher in the upper hadopelagic (6500–8500 m) compared to the bottom of the hadopelagic (10 300–10 850 m) (Huang et al., 2018). Additionally, local cyclonic circulation over trenches has been identified over the Philippine Trench (Zhai and Gu, 2020; Tian et al., 2021) and the Mariana Trench (Huang et al., 2018), with both circulation patterns informed by bottom water circulation.
In the broader context of the global overturning circulation, trenches may serve as conduits for the transport of dense bottom water masses. Temperature and salinity gradients drive the overturning circulation, which transports cool, dense water, formed around Antarctica (Antarctic Bottom Water; AABW) in the Weddell Sea, the Ross Sea, and Adélie Land (Zhang and Delworth, 2016; Talley, 2013a; Gordon, 1986b; Rintoul, 1985), as well as North Atlantic Deep Water (NADW) (formed from dense overflows in the Nordic seas), lower Labrador Sea Water, and recirculating AABW, to fill the ocean basins (Gordon, 1986a; Dickson and Brown, 1994; Orsi et al., 1999). The cool water eventually rises and is heated, flowing poleward to replace denser water, creating a global cell of circulation (Stommel and Arons, 1959). Diapycnal exchanges also play an important role in modifying pathways and ventilation timescales (Cimoli et al., 2023). However, the full implication of these findings and how they play into the variation in trench conditions are yet to be understood on an inter-basin scale.
The Southern Ocean plays a significant role in the deep overturning circulation in AABW formation and its influence on NADW production and cell closure (Rahmstorf and England, 1997; Goodman, 1998; Sloyan and Rintoul, 2001). This lower limb of the overturning circulation fills the abyssal basins of the Atlantic, Indian, and Pacific oceans (Orsi et al., 1999, 1993; Mantyla and Reid, 1995). AABW upwells locally as it moves northward, making it the primary volumetric source of deep water in the Pacific and Indian oceans, with no high-salinity water source to the north (Talley, 2011). These patterns of sinking and spreading through the world's oceans have been captured in observations (Wust, 1933) and are considered a key component of climate regulation (Naveira Garabato et al., 2017; Schmitz, 1995).
In the Pacific Ocean, Lower Circumpolar Deep Water (LCDW) mostly comprises of AABW and remnant NADW from the Southern Ocean (Johnson, 2008; Orsi et al., 1999). LCDW flows northward on the western side of the southwest Pacific Basin, the Tonga–Kermadec Ridge (TKR), and reaches the Samoan Passage near the northern end of the Tonga Trench (Roemmich et al., 1996; Taft et al., 1991). The TKR prevents abyssal water from entering the South Fiji Basin; therefore bottom waters are formed by the densest parts of the Upper Circumpolar Deep Water (UCDW) entering the New Hebrides Basin via the entrance to the southern Solomon Sea basin (Germineaud et al., 2021; Kawabe and Fujio, 2010).
Just north of the Samoan Passage, the LCDW bifurcates into a western and eastern branch, driven by the complex topography in the region (Kawabe et al., 2003). The western branch flows north-westward, arriving in the East Mariana Basin where it separates into the East Caroline Basin to the south and north and is transported to the Izu–Ogasawara Trench followed by the Japan Trench (Fujio et al., 2000; Fujio, 2005; Siedler et al., 2004). A portion of the LCDW reaches the south of the Mariana Trench, the Yap–Mariana Junction from the northward flow (Kawabe and Fujio, 2010), where it flows into the northern and southern Yap Trench and partially into the Philippine Basin (Liu, 2022; Liu et al., 2020; Zhai and Gu, 2020). The Yap Ridge then blocks the circulation of water, causing it to enter the West Caroline Basin, where it can enter the Palau Trench (Zhai and Gu, 2020; Liu, 2022). Modelling suggests that the bottom layers of the Philippine Basin form an anticyclonic gyre in the south and two cyclonic gyres in the northeast and northwest, followed by possible cyclonic circulation over the Philippine Trench (Zhai and Gu, 2020).
AABW dominates bottom waters in the Indian Ocean as it enters through two pathways and is observed as far north as 12∘ N in the Bay of Bengal (Chinni et al., 2019; Singh et al., 2012). Firstly, it enters through the Enderby Basin, forming in the Weddell Sea (Orsi et al., 1999). Secondly, it enters through the Australian–Antarctic Basin, where the bottom water was originally formed from Adélie Land and the Ross Sea (Rintoul, 1985; Mantyla and Reid, 1995). Elevated dissipation rates from tidal mixing and current fluctuations in the Indian Ocean contribute to a higher ventilation rate of deep and bottom waters in the Indian Ocean compared to the Pacific and Atlantic oceans (Fine et al., 2008). The deep waters of the Indian Ocean, similar to the deep waters of the Pacific Ocean, are sourced primarily from upwelled bottom waters, which are then heated and, through diapycnal transformation, returned to the sea surface and subsequently cooled and recycled back into AABW in the Southern Ocean (Talley, 2013a).
In this paper, we explore 12 hadal trenches using full-ocean-depth CTD profiles derived from free-fall landers to unravel the complexities of the trenches and the interplay between the hadopelagic and global circulation patterns of bottom waters. The World Ocean Circulation Experiment (WOCE) measured vertical sections along each hydrographic line covering the globe in the late 1980s and early 1990s, with some repeat sections now part of the Global Ocean Ship-Based Hydrographic Investigations Program (GO-SHIP) (Koltermann et al., 2011; Orsi and Whitworth, 2004; Talley, 2007, 2013b; Sloyan et al., 2019). Measurements were restricted to 6000 m, although global transport estimates were substantial for climate studies (Ganachaud, 2003; Ganachaud and Wunsch, 2000). We aim to gain insights into hadal trench connections with the abyssal waters above by analysing the opportunistic full-ocean-depth CTD data sets and repeat GO-SHIP global observations. Through this analysis, we describe physical oceanographic conditions within the hadal trenches of the Southern Ocean, Indian Ocean, and Pacific Ocean, spanning 7 of the 10 hadal provinces (Watling et al., 2013). Furthermore, we link changes in water properties in the western Pacific Ocean to AABW and LCDW source waters to enhance our understanding of the physical oceanographic conditions which shape ecosystem survival in these unique environments.
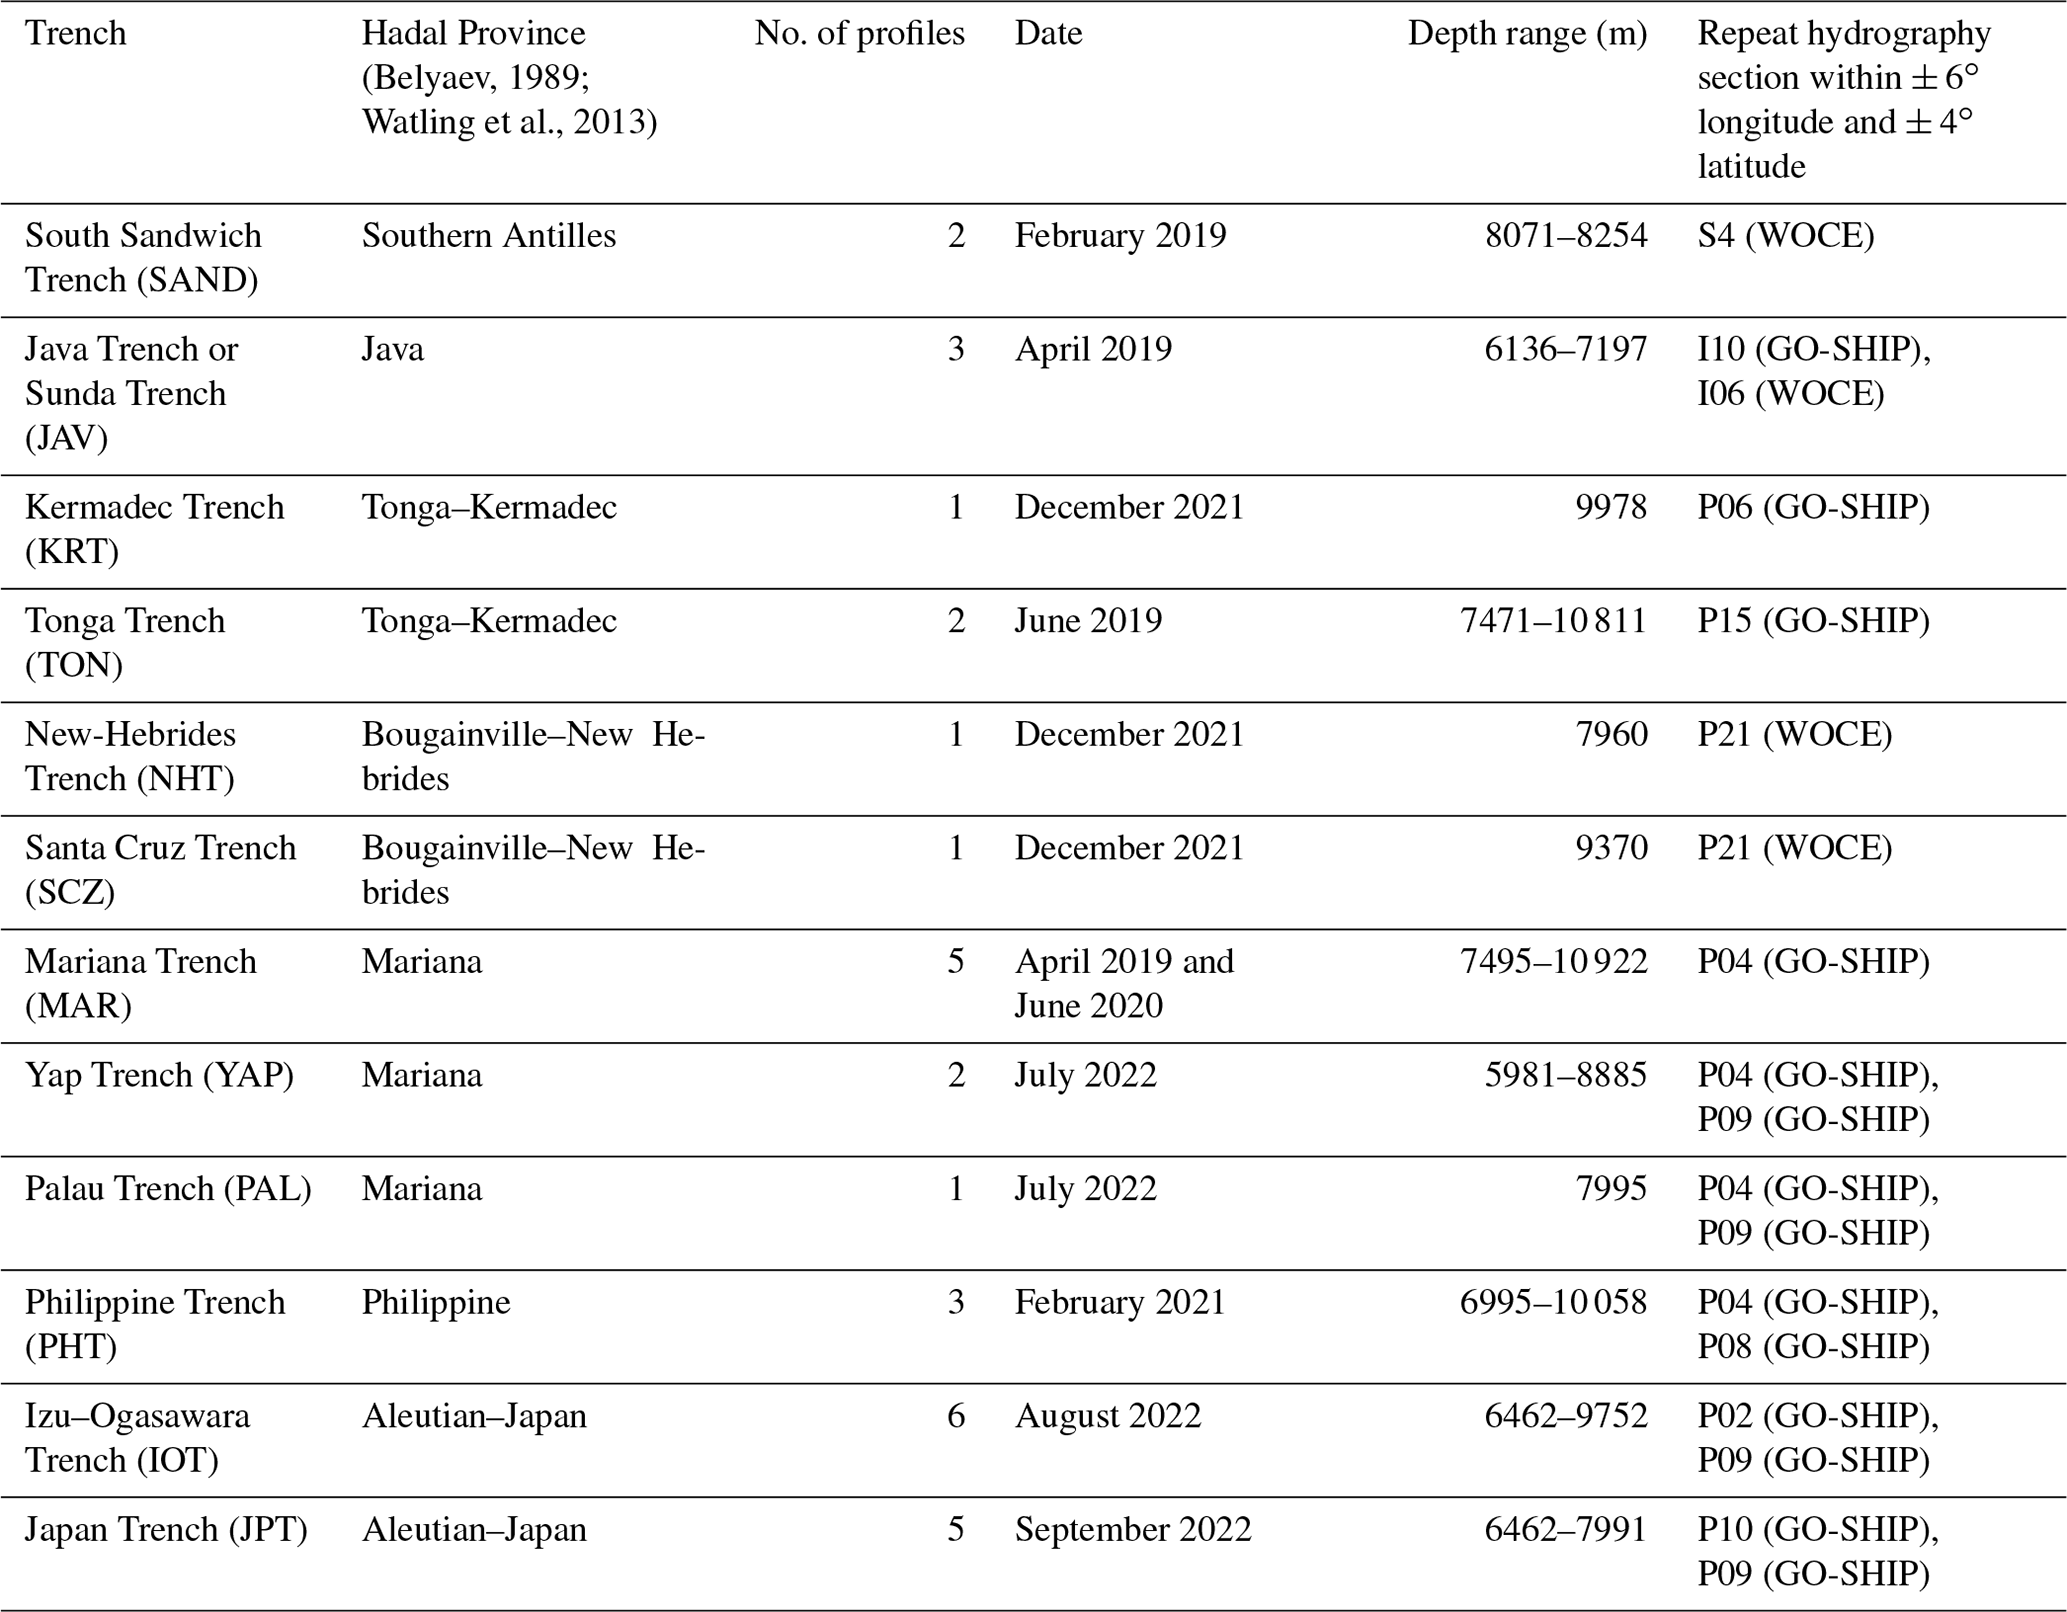
We define the hadal water properties and bottom conditions of 12 of the world's hadal trenches, spanning 3 oceans and 7 hadal biogeographic provinces (Belyaev, 1989; Watling et al., 2013) (Table 1). Full-ocean-depth landers mounted with CTDs were deployed between 2018 and 2022. The deployment locations, relevant features, and nearby repeat hydrography sections (both the World Ocean Circulation Experiment and the Global Ocean Ship-Based Hydrographic Investigations Program) (WOCE and GO-SHIP) used throughout the paper are indicated in Fig. 1 and Table 1 (Orsi and Whitworth, 2004; Talley, 2007, 2013b; Sloyan et al., 2019). The location of the features mentioned, other than the trenches, are in Fig. S1. Quality control and analysis are detailed in the following section, producing 32 CTD profiles in total (Fig. 1; Tables 1, S1).
Table 1Summary of the hadal lander deployments from RV Pressure Drop used in this study. Specific deployment details are in Table S1.
2.1 Study sites
In the Southern Ocean, deployments were made in the South Sandwich Trench (SAND) (∼ 55∘ S, 23∘ W) to 8266 m. SAND falls within the southern Antilles hadal province (Watling et al., 2013). Bottom circulation in the region is promoted by the Weddell Gyre exporting of newly formed dense Weddell Sea Bottom Water or Antarctic Bottom Water (AABW) northward through the Scotia Sea and along the South Sandwich Trench through the steep slopes, inducing strong downwelling (Zhang and Delworth, 2016).
The deepest point of the Indian Ocean is the Java Trench (JAV), where deployments were made to 7178 m (11∘ S, 115∘ E). Bottom water (modified AABW and LCDW) reaches the Java Trench from the West Australian Basin to the south (Mantyla and Reid, 1995; Sloyan, 2006; Arvapalli et al., 2022).
The Kermadec Trench connects at the southern end of the Tonga Trench within the same convergence system in the central south Pacific, separated only by the subducting Osborn Seamount (Jamieson et al., 2020). Deployments were made in the Tonga Trench (∼ 23∘ S, 174∘ W) to a maximum depth of 10 823 m and 9986 m and in the Kermadec Trench (∼ 32∘ S, 177∘ E). Bottom circulation in the region is dominated by the major AABW/LCDW pathway into the Pacific, which enters from the south along the Tonga–Kermadec Ridge and flows north (Warren, 1981; Kawabe, 1993; Taft et al., 1991; Purkey et al., 2019). Surrounding the Solomon Sea lies the Bougainville–New Hebrides hadal province, where deployments were made to 7770 m in the New Hebrides Trench (23∘ S, 172∘ E) and 9125 m in the Santa Cruz Trench (11∘ S, 163∘ E). Bottom water masses in these trenches, which have entered the Solomon Sea from the north, are akin to Upper Circumpolar Deep Water (UCDW) (Germineaud et al., 2021).
In the central northwest Pacific Ocean, deployments were completed to a maximum of 10 925 m in the Mariana Trench (MAR) (∼ 11∘ N, 142∘ E), 8885 m in the Yap Trench (YAP) (∼ 9∘ N, 138∘ E), 8000 m in the Palau Trench (PAL) (∼ 8∘ N, 135∘ E), and 10 007 m in the Philippine Trench (PHI) (∼ 10∘ N, 126∘ E). Further north, there were deployments to 9767 m in the Izu–Ogasawara Trench (IOT) (29∘ N, 142∘ E) and 8004 m in the Japan Trench (JPT) (36∘ N, 143∘ E). These deployments span three hadal provinces (Table 1). Bottom water circulation in this region is driven by AABW/LCDW, which enters the east of the Mariana Basin in the North Pacific (Kawabe et al., 2003; Siedler et al., 2004). The westward component propagates through MAR, flowing through the westernmost end and over the YAP and PAL trenches (Kawabe and Fujio, 2010). The northern branch flows through the Wake Island Passage and along the Izu–Ogasawara Ridge, filling IOT and JPT (Tian et al., 2021). The Philippine hadal province has a unique location west of the Philippine Basin, not immediately near the primary bottom water circulation of the Pacific Ocean (Kawabe and Fujio, 2010). Deep bottom circulation along the trench consists of southward and northward currents on the western and eastern slopes of the trench, respectively (Zhai and Gu, 2020), which is not unlike other local cyclonic circulation observed in other trenches (Huang et al., 2018). This deep-water mass is likely well-transformed AABW/LCDW that fills the Philippine Sea from the north (Wang et al., 2017; Kawabe and Fujio, 2010; Tian et al., 2021).
2.2 Data collection
The hydrographic CTD profiles were collected as part of the Five Deeps expedition and the follow-on Ring of Fire expedition (2019–2022), on the RV Pressure Drop. To support the diving operations of the full-ocean-depth submersible DSSV Limiting Factor and collect scientific data (e.g. Jamieson et al., 2021b), three hadal landers were used in unison (known as Skaff, Flere, and Closp). The landers were equipped with CTD probes (SBE 49 FastCAT, SeaBird Electronics, Bellevue, US) that, during both the descent and the ascent, recorded conductivity, temperature, and pressure at 10 s intervals. The CTDs measured conductivity, temperature, and pressure at ± 0.0003 S m−1, ± 0.002 ∘C, and ± 0.1 % of the full-scale range, respectively (Sea-Bird Scientific, 2020).
The landers were released from the ship and descended until reaching the seafloor, where they performed autonomous filming operations for several hours before their ascent was initiated by jettisoning ballast weights via acoustic command. The landers descended at an average speed of 0.6 m s−1, and the design did not require any corrections for ship motions in CTD casts.
2.3 Data processing
The CTD data were processed using the standard procedures incorporated within the SBE Data Processing software (Sea-Bird Scientific, 2018). Automated processing, including aligning the temperature and conductivity data in time relative to the pressure and cell thermal mass corrections, occurred within the sensor (Sea-Bird Scientific, 2020). Wild Edit flagged data 2 standard deviations away from the mean. This was followed by applying a median filter to remove spikes. These methods were completed as recommended by SeaBird. Profiles were discarded if Wild Edit bad flags were greater than 20 % of the profile or if other lander-related situations that influenced the data and made the profile unusable occurred. Post-cruise calibrations were carried out, as recommended by Sea-Bird, and post-corrections were made using offset correction coefficients. Absolute Salinity (SA; g kg−1), Conservative Temperature (Θ), and potential density referenced to 6000 dbar (σ6) were calculated using the Gibbs-SeaWater (GSW) software, which defines the thermodynamic properties of seawater based on a Gibbs function formulation as recommended by IOC (IOC et al., 2010). Then, the downcast profiles were averaged to 10 dbar bins, with the first 50 dbar of the water column removed due to lander effects and a Gaussian filter applied.
A conservative approach was taken with the data due to limited profiles and possible limitations, including the drift of conductivity measurements in SBE CTDs (van Haren et al., 2017; Gouretski et al., 2022). Therefore, if there was a GO-SHIP station deeper than 4500 dbar, taken within ± 4 years of the lander deployment and lying within ± 4∘ latitude and ± 6∘ longitude of its location, a salinity offset from the closest station was applied to the CTD data. Using the stable portion of the water column at the highest pressure, SA was adjusted after conversion from the Practical Salinity in the GO-SHIP data at the same Θ and pressure (Supplement 3). In total, 32 CTD profiles were used (Fig. 1).
2.4 Data analysis
We derive the comparative mean water conditions together with Θ–SA plots and apply a source water type analysis. Through these mechanisms we address the heterogeneity of trenches. The downcast profiles were used to eliminate the potential heating effects generated by illumination devices on the landers. Only profiles measuring to over 6000 dbar were considered in this study. Despite our focus being on the hadopelagic (> 6000 dbar), measurements within abyssal waters between 4000 and 6000 dbar are included in the figures and used in conjunction with repeat hydrographic sections for baseline, temporal, and spatial comparisons (Fig. 1, Table 1). All WOCE and continued GO-SHIP lines within ± 4∘ latitude and ± 6∘ longitude of the deployment locations were plotted alongside our deployments after being downloaded from the CLIVAR and Carbon Hydrographic Data Office (CCHDO; https://cchdo.ucsd.edu/, last access: 30 June 2023). Θ–SA plots, derived initially by Helland-Hansan (1916), were then plotted along isopycnals referenced to 6000 dbar (Pond and Pickard, 1983). This reference pressure was adopted given the depths of the profiles (> 6000 dbar), therefore more accurately reflecting the thermodynamic properties of deep-water masses.
The mean in situ temperature, T, Θ, and SA at 7000 m were calculated in each trench for comparison since the Java Trench is the shallowest included within this study at 7192 m (Bongiovanni et al., 2021). A Θ–SA plot of bottom conditions in the trenches was also generated for comparative purposes.
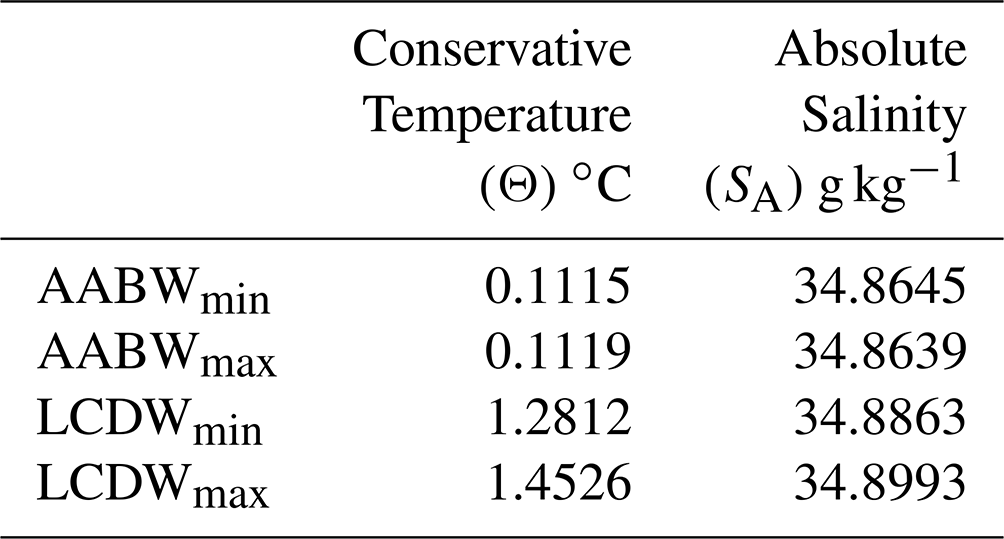
We apply an end-member mixing analysis to the profiles along the western Pacific, likely containing Antarctic Bottom Water (AABW) and Lower Circumpolar Deep Water (LCDW), to understand the broad spatial differences. Restrictions on using basic optimum multiparameter analysis (OMP) at a basin scale meant that mixing, including biogeochemical processes, cannot be ignored (Karstensen and Tomczak, 1998; Leffanue and Tomczak, 2004), and in our instance, we were limited to the conservative parameters of temperature and salinity. Weightings from 1–1, 5–1, and 10–1 for Θ–SA were tested; however the difference in the resulting fractions was < 0.0001, and hence we omitted using weightings and considered 1–1. Additionally, we did not include a non-negativity constraint as our results contained no non-negative values. With these considerations in mind, the analysis can be formulated as a simple end-member mixing in Θ–SA space. Trenches included were KRT, TON, MAR, YAP, PAL, PHI, IOT, and JPT. The source water types of AABW and LCDW were defined along neutral density isopycnals, ![]() n>28.2 and 28.0
n>28.2 and 28.0 ![]() n<28.2 kg m−3, respectively (Table 2), at 60∘ S along the World Ocean Circulation Experiment P15 line (Fig. 1) (Tamsitt et al., 2018; Abernathey et al., 2016; Solodoch et al., 2022).
n<28.2 kg m−3, respectively (Table 2), at 60∘ S along the World Ocean Circulation Experiment P15 line (Fig. 1) (Tamsitt et al., 2018; Abernathey et al., 2016; Solodoch et al., 2022).
Table 2Source water type values calculated from WOCE section P15.
We categorize the observations of Conservative Temperature (ΘObs) and Absolute Salinity (SObs) as being a mixture of two source water masses, AABW and LCDW. To estimate the fractional contributions of these two source waters (xAABW and xLCDW, both between 0 and 1), we seek a solution to the following equations, inspired by classical OMP analysis (Tomczak, 1999; Tomczak and Large, 1989).
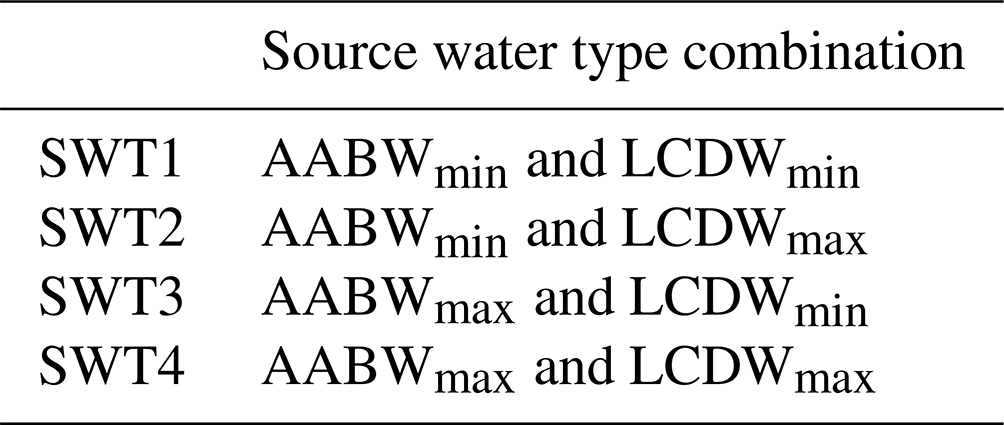
We solve for xAABW and xLCDW for each observation by performing matrix left division in MATLAB. As the fractions were constrained to a total of 1, only the AABW fraction is reported in the results. To account for uncertainty in the source water properties, the procedure was repeated for four combinations of maximum and minimum bounds of AABW and LCDW Θ and SA (Table 3).
Table 3Source water type combinations used to get the range uncertainty in the calculated source water type values defined in Table 2.
The full-ocean-depth CTD profiles were limited to those over 6000 dbar and included in situ temperature (T), Practical Salinity (SP), and pressure (P). From these, Conservative Temperature (Θ) and Absolute Salinity (SA) from the 12 hadal trenches were analysed to describe the conditions in the trenches within the trench sill and bottom conditions. Interpretation of Θ–SA plots for each study region, including associated WOCE and GO-SHIP data over 4500 dbar, were plotted, and additional source water type analysis was completed for the northwest Pacific. The Θ and SA profiles over pressure are provided in the supplementary information (Figs. S4 to S11).
3.1 Water properties
In the southernmost trench, the South Sandwich Trench (SAND), the hadal water mass characteristics were similar between the two deployments despite being 2∘ of latitude apart (Fig. 1). From 6000 dbar to the seafloor, Θ decreased at a rate of −0.0145 ∘C per 1000 dbar, while SA had negligible vertical variation with dSA dp−1 at g kg−1 per 1000 dbar (Fig. 2). The GO-SHIP (Sect. S4) decreased monotonically in Θ and SA over depth, reaching a cooler bottom temperature of −0.76 ∘C.
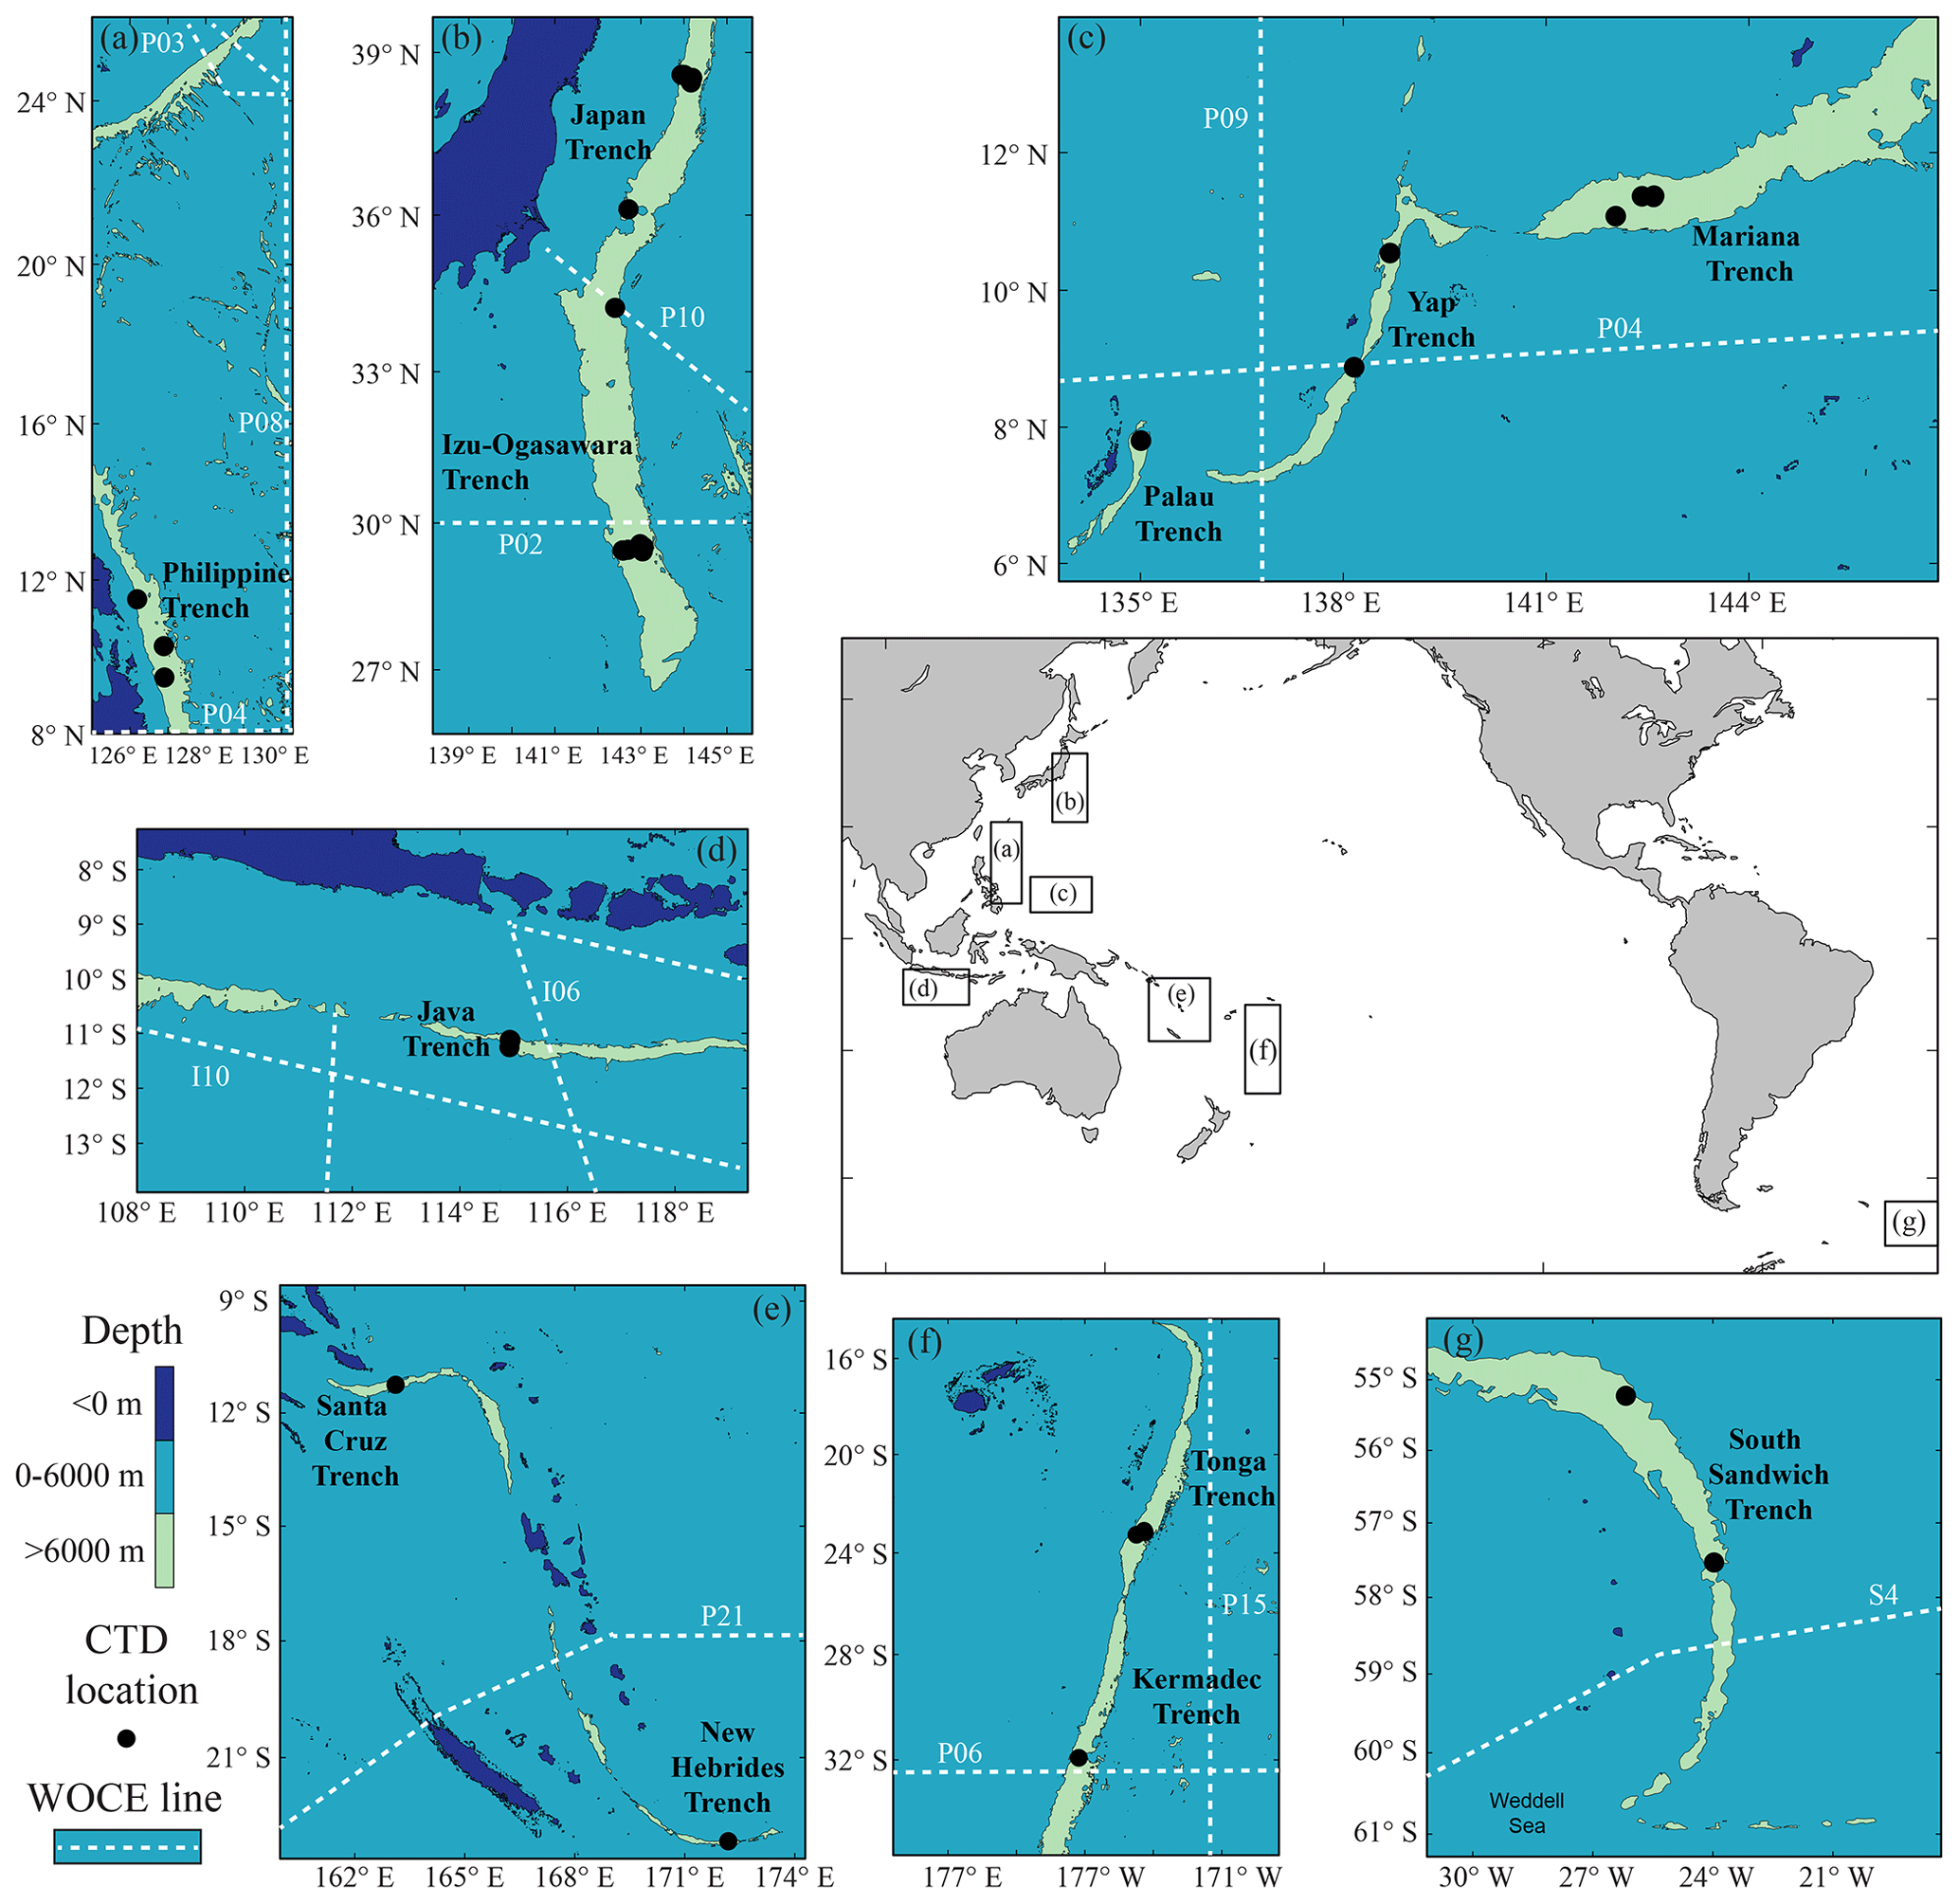
Figure 1Geographic locations of the hadal trenches used in this study, including CTD deployment locations marked in black. (a) The Philippine Trench; (b) the Japan Trench and Izu–Ogasawara Trench; (c) the Palau Trench, Yap Trench, and Mariana Trench; (d) the Java Trench; (e) the Santa Cruz Trench and New Hebrides Trench; (f) the Tonga Trench and Kermadec Trench; and (g) the South Sandwich Trench. Individual deployment details are provided in Table S1. Bathymetric details and features are provided in Table S1. Ocean elevation data were sourced from the GEBCO Compilation Group (2021) and were reproduced using m_map in MATLAB (Pawlowicz, 2020).
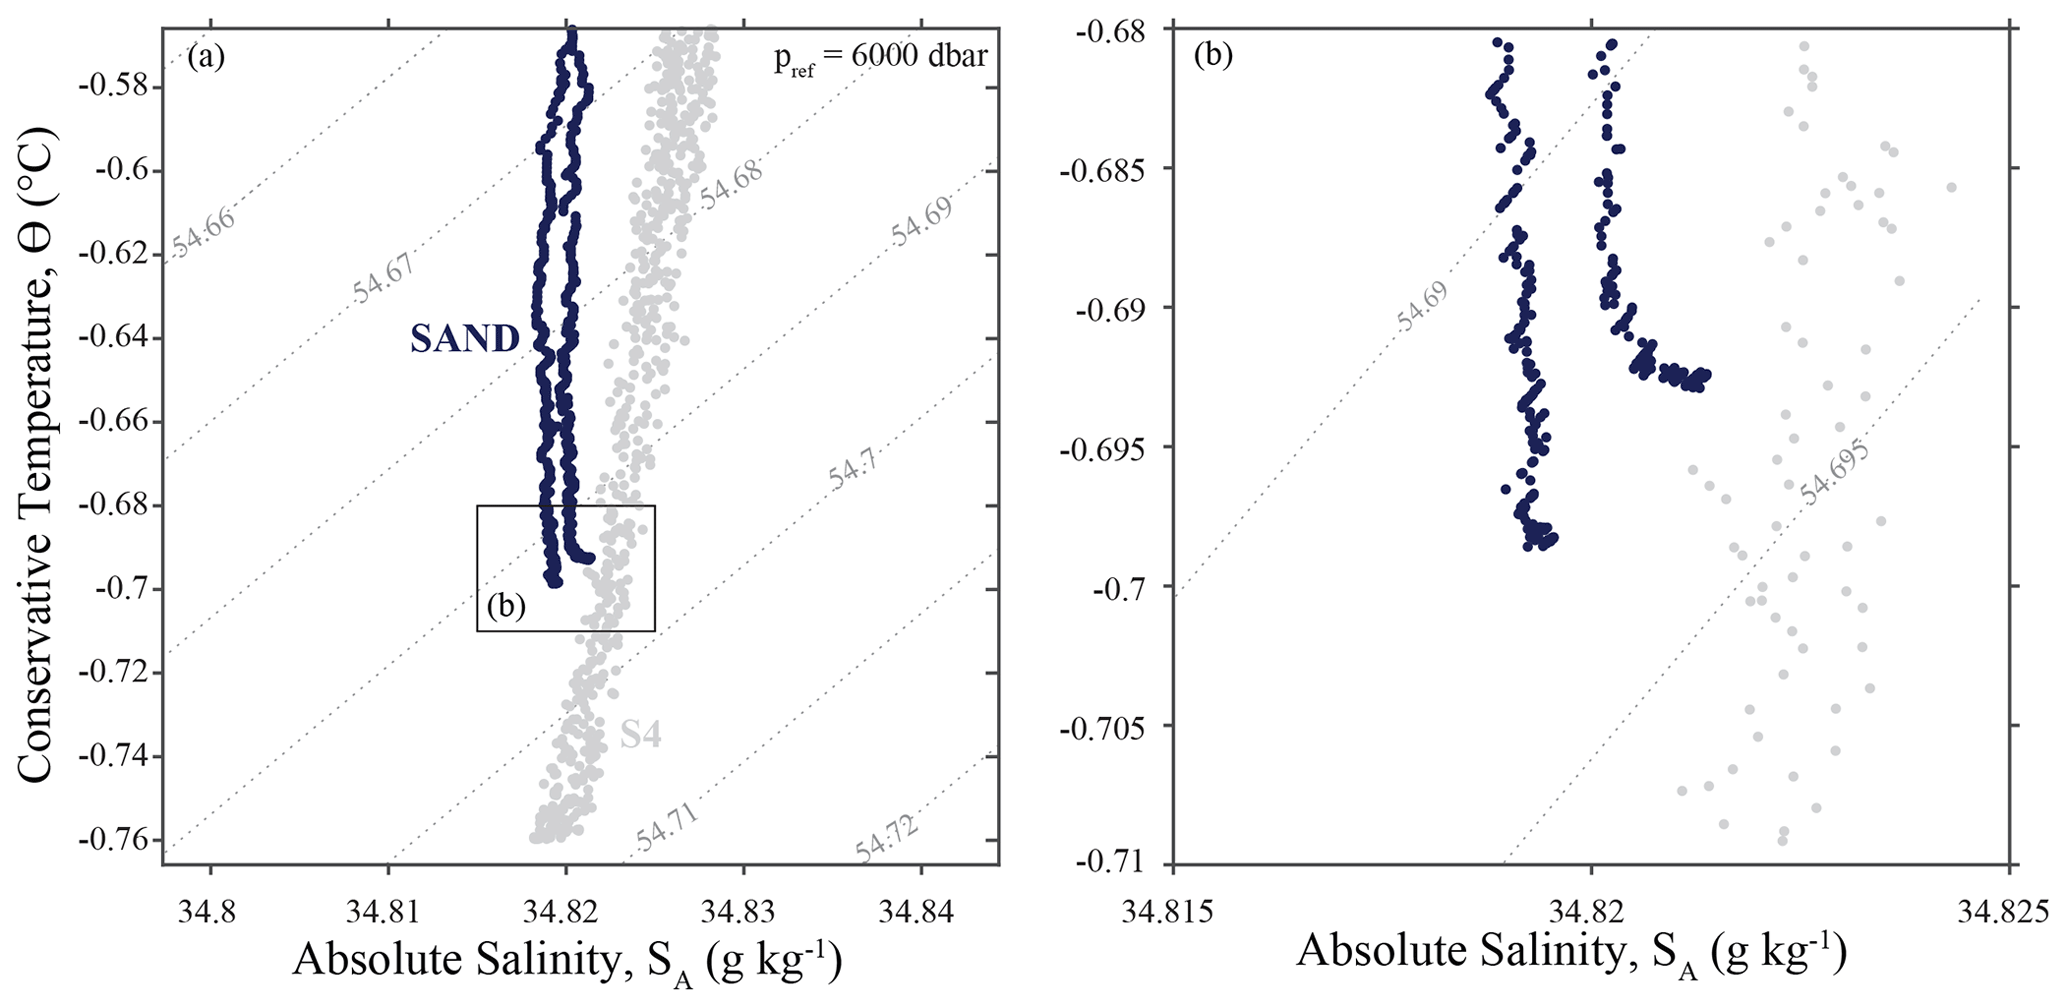
Figure 2Θ–SA plots for the South Sandwich Trench (SAND) (a) over 4000 dbar (b) bottom waters. The rectangle in (a) shows the extent of (b). The isopycnals (contour lines) show the potential density referenced to 6000 dbar. The grey data points are WOCE (Sect. S4).
In the Java Trench, otherwise known as the Sunda Trench, the average dΘ dp−1 was −0.009 ∘C per 1000 dbar, and dSA dp−1 was 0.0014 g kg−1 per 1000 dbar between 6000 dbar and the seafloor (7360 dbar) (Fig. 3). There is a more rapid increase toward the seafloor, also evident in section I06.
The profiles near TON and KRT decrease monotonically in Θ at a rate of −0.0095 ∘C per 1000 dbar and 0.0015 g kg−1 per 1000 dbar from 6000 dbar to the seafloor. The profile from KRT is consistent with P06 stations nearby; however, there is an increase in SA of 0.002 g kg−1 in the bottom 1000 dbar of the trench (Fig. 4b). Two of the profiles from TON indicate a similar increase in SA at the bottom 1000 dbar of 0.015 g kg−1. The remaining profile increases slightly in SA (0.001 g kg−1), following P15 more closely; however, it reaches only 6800 dbar (Fig. 4a). The abyssal depths of WOCE sections P06 and P15 passing near TON and KRT have been discussed extensively in the literature (Katsumata and Fukasawa, 2011; Macdonald et al., 2009).
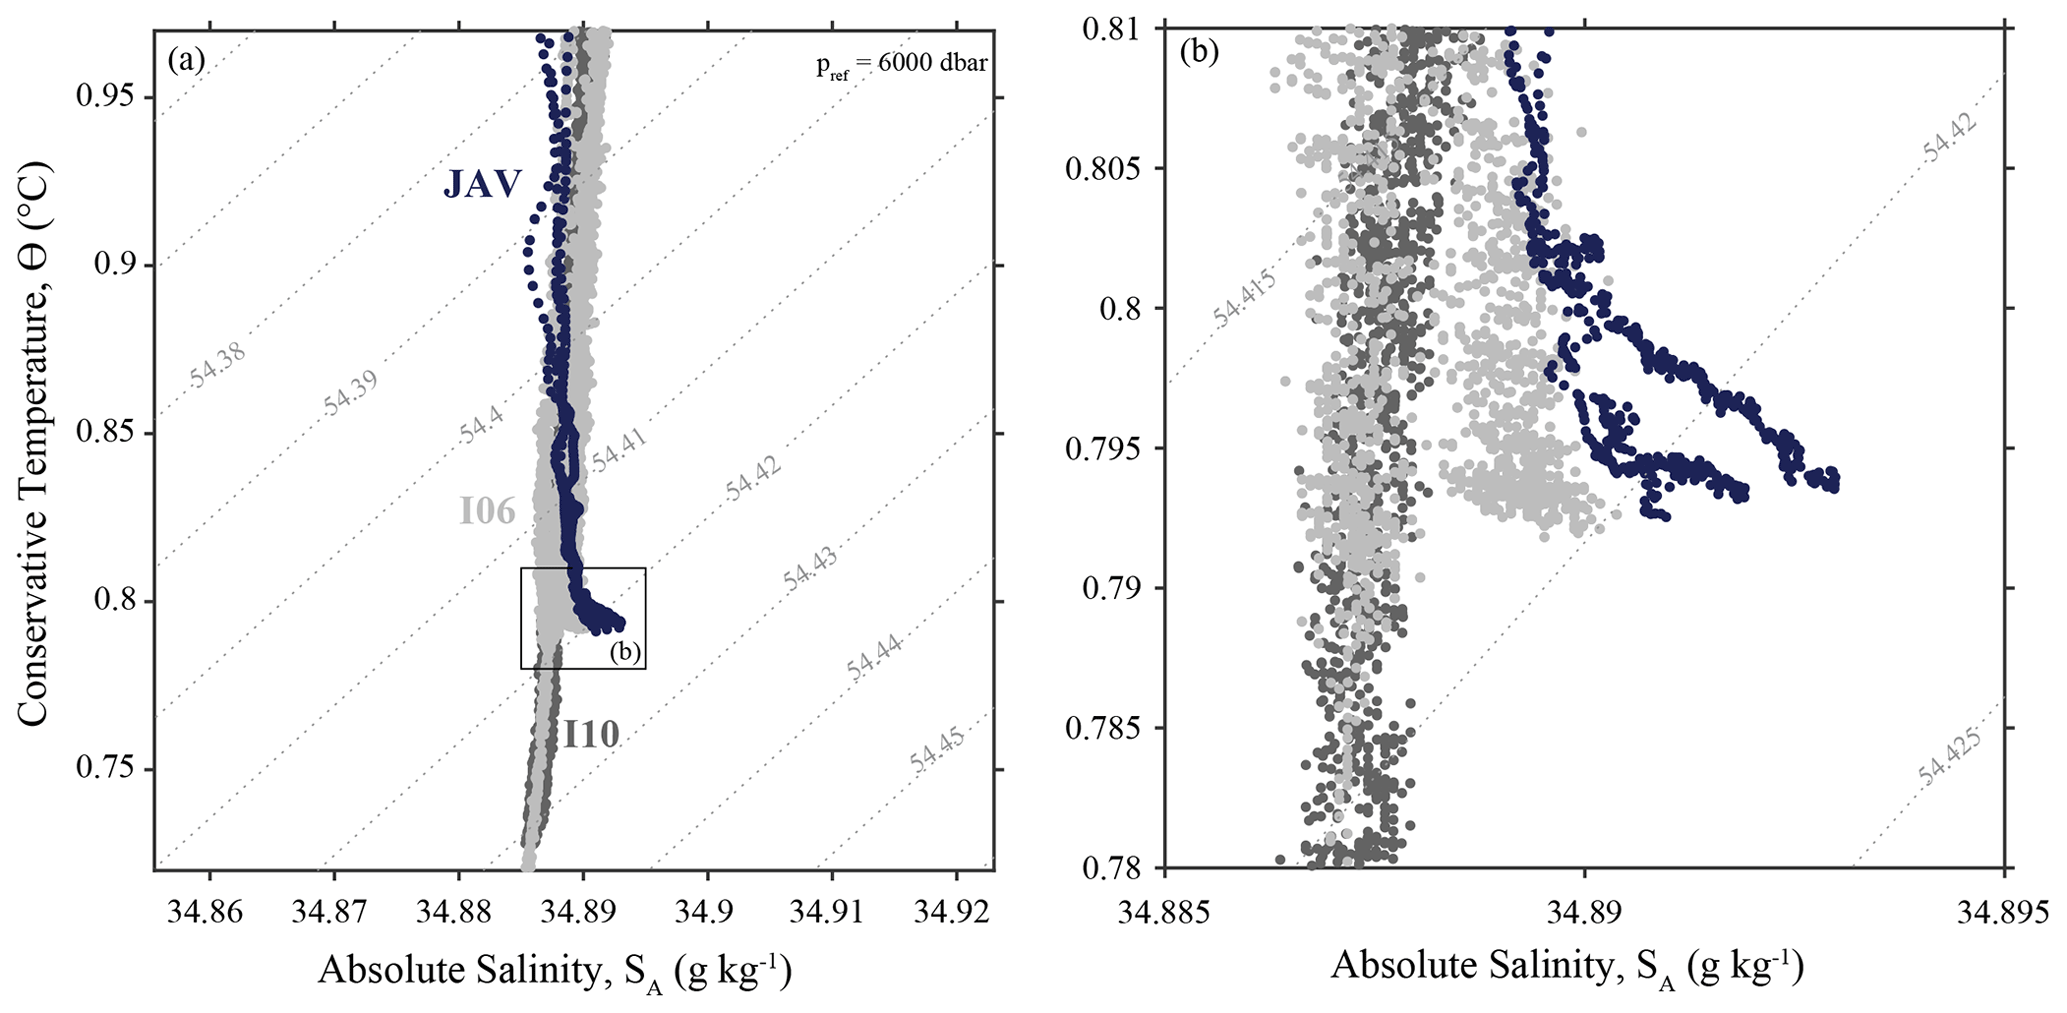
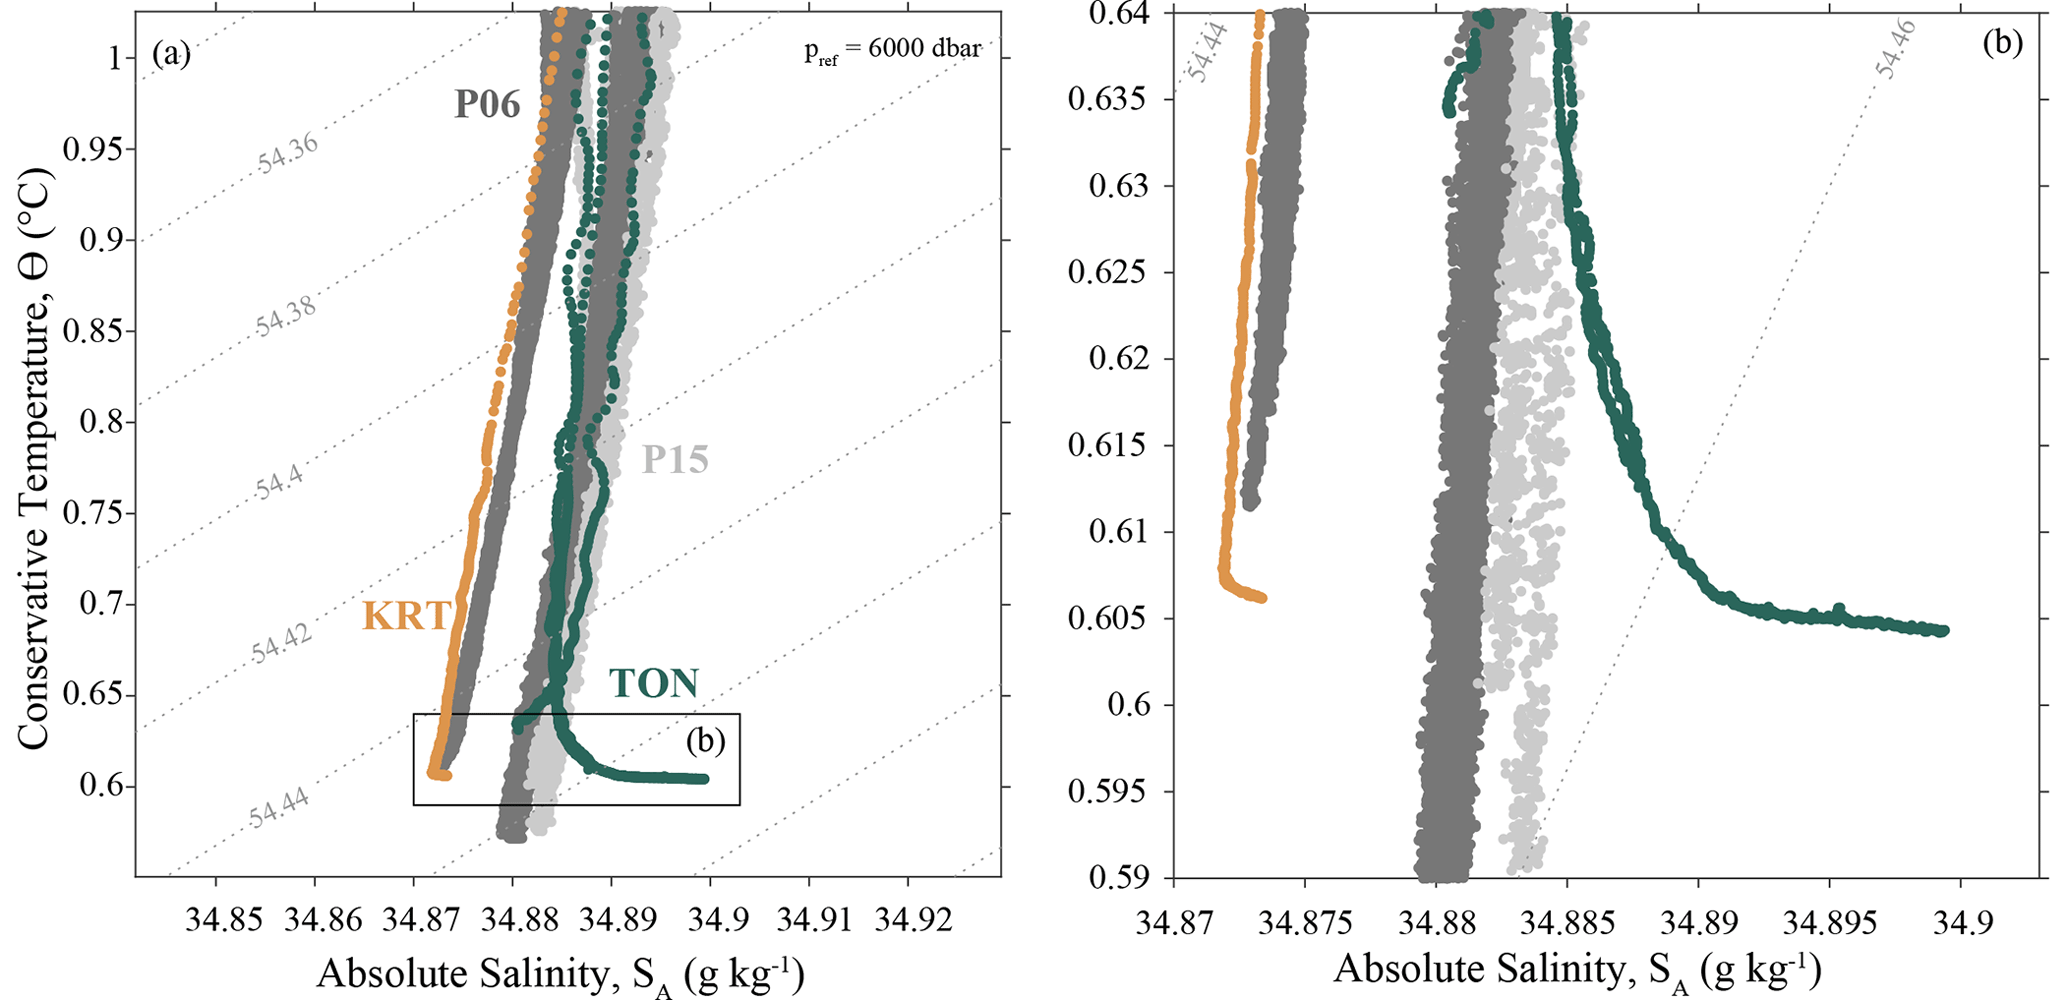
Figure 4As in Fig. 2 but for the Kermadec Trench (KRT) and Tonga Trench (TON). The grey is WOCE sections P06 and P15.
In the New Hebrides Trench (NHT), dΘ dp−1 was ∘C per 1000 dbar and dSA dp−1 was g kg−1 per 1000 dbar between 6000 and the seafloor (7940 dbar). The rate of change was marginally different in the Santa Cruz Trench (SCZ). DΘ dp−1 was ∘C per 1000 dbar, and dSA dp−1 was g kg−1 per 1000 dbar between 6000 and the seafloor (9350 dbar) (Fig. 5).
In the Palau Trench (PAL), dΘ dp−1 was −0.003 ∘C per 1000 dbar, and dSA dp−1 was g kg−1 per 1000 dbar between 6000 and the seafloor (8190 dbar) (Fig. 6a). In the Yap Trench (YAP) the average rate of change in Θ was −0.015 ∘C per 1000 dbar, and dSA dp−1 was −0.001 g kg−1 per 1000 dbar between 6000 and the seafloor (8190 dbar). The two YAP profiles diverge in SA at 5200 dbar, with the deeper and more northern profile increasing in SA at a greater rate into the trench (Fig. 6). In the Mariana Trench (MAR), dΘ dp−1 is −0.002 ∘C per 1000 dbar between 6000 dbar and the seafloor (∼ 11240 dbar). The rate of change of SA is 0.0011 g kg−1 per 1000 dbar; however, the rate doubled for over 8500 dbar at 0.0024 g kg−1 per 1000 dbar for the four profiles exceeding 10500 dbar (Fig. 6b).
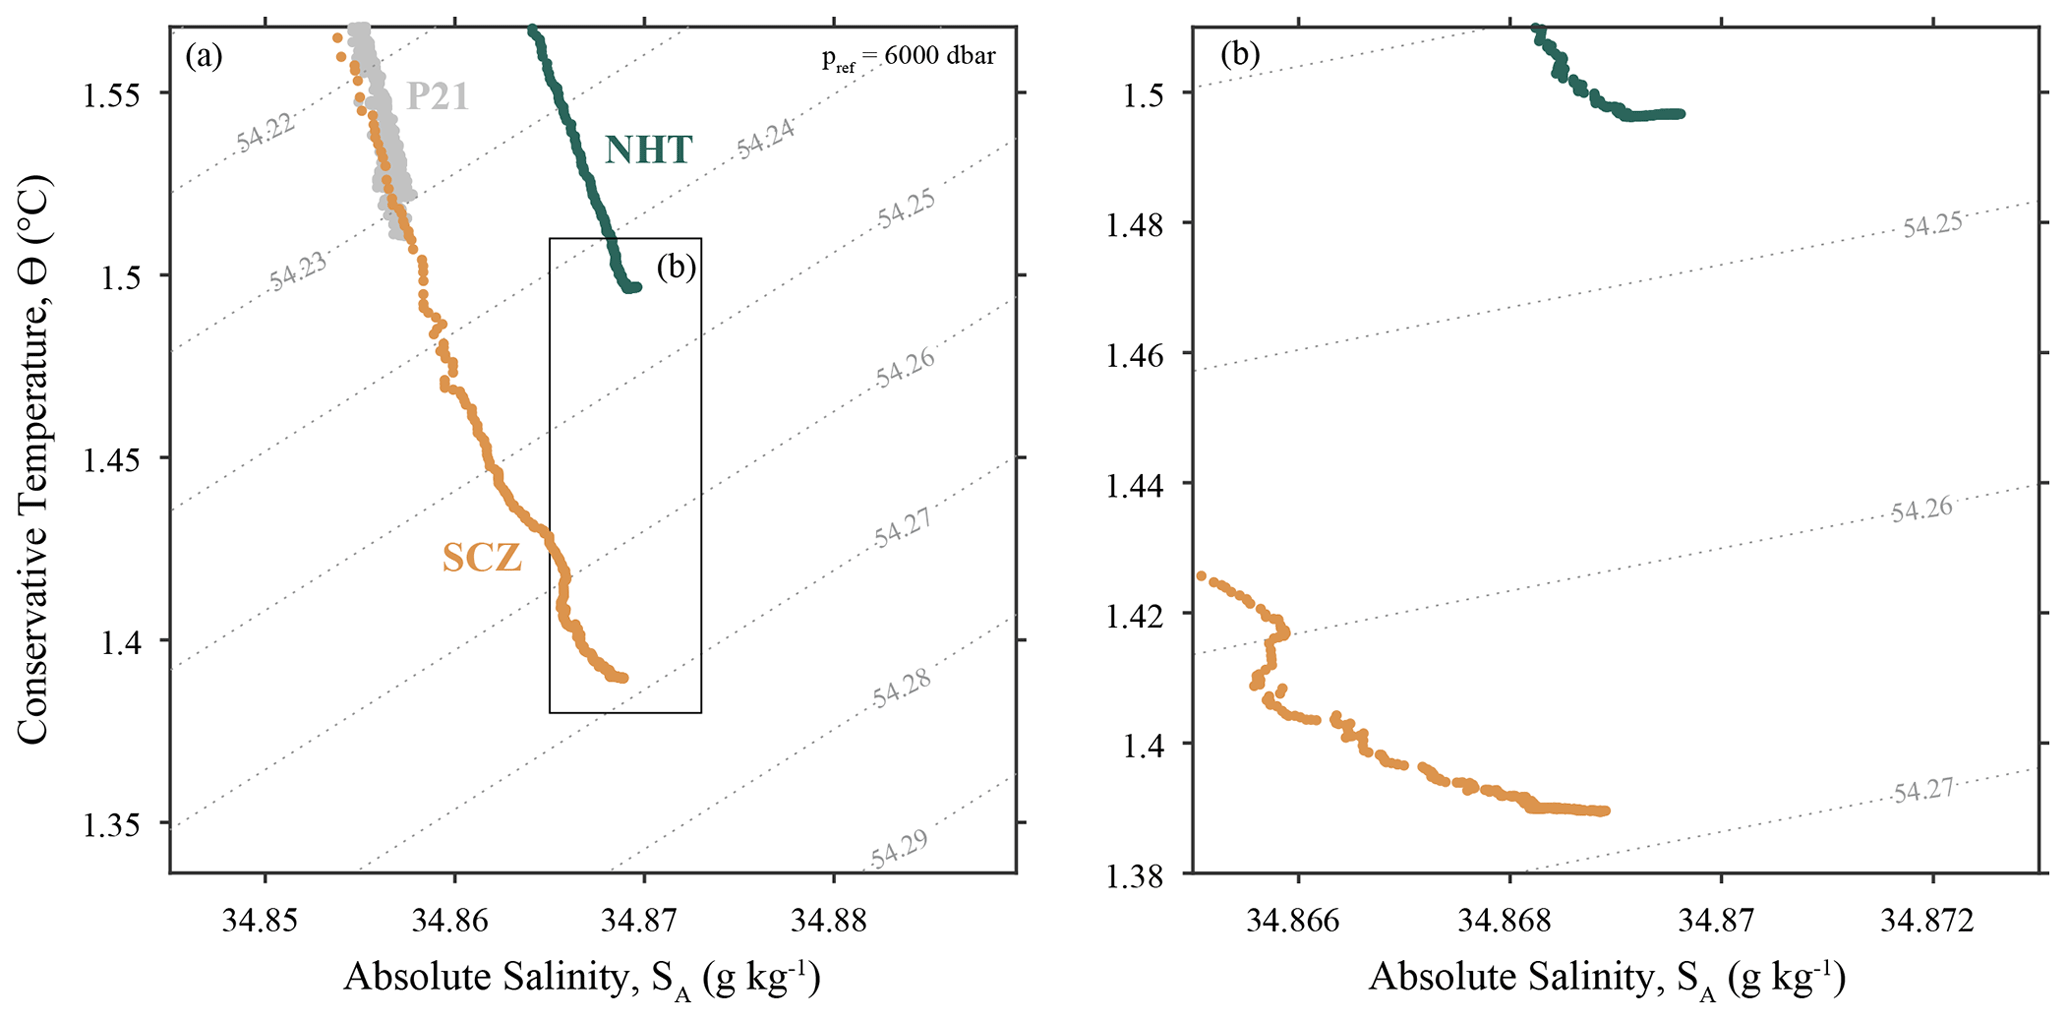
Figure 5As in Fig. 2 but for the Santa Cruz Trench (SCZ) and New Hebrides Trench (NHT). The grey is WOCE section P21.
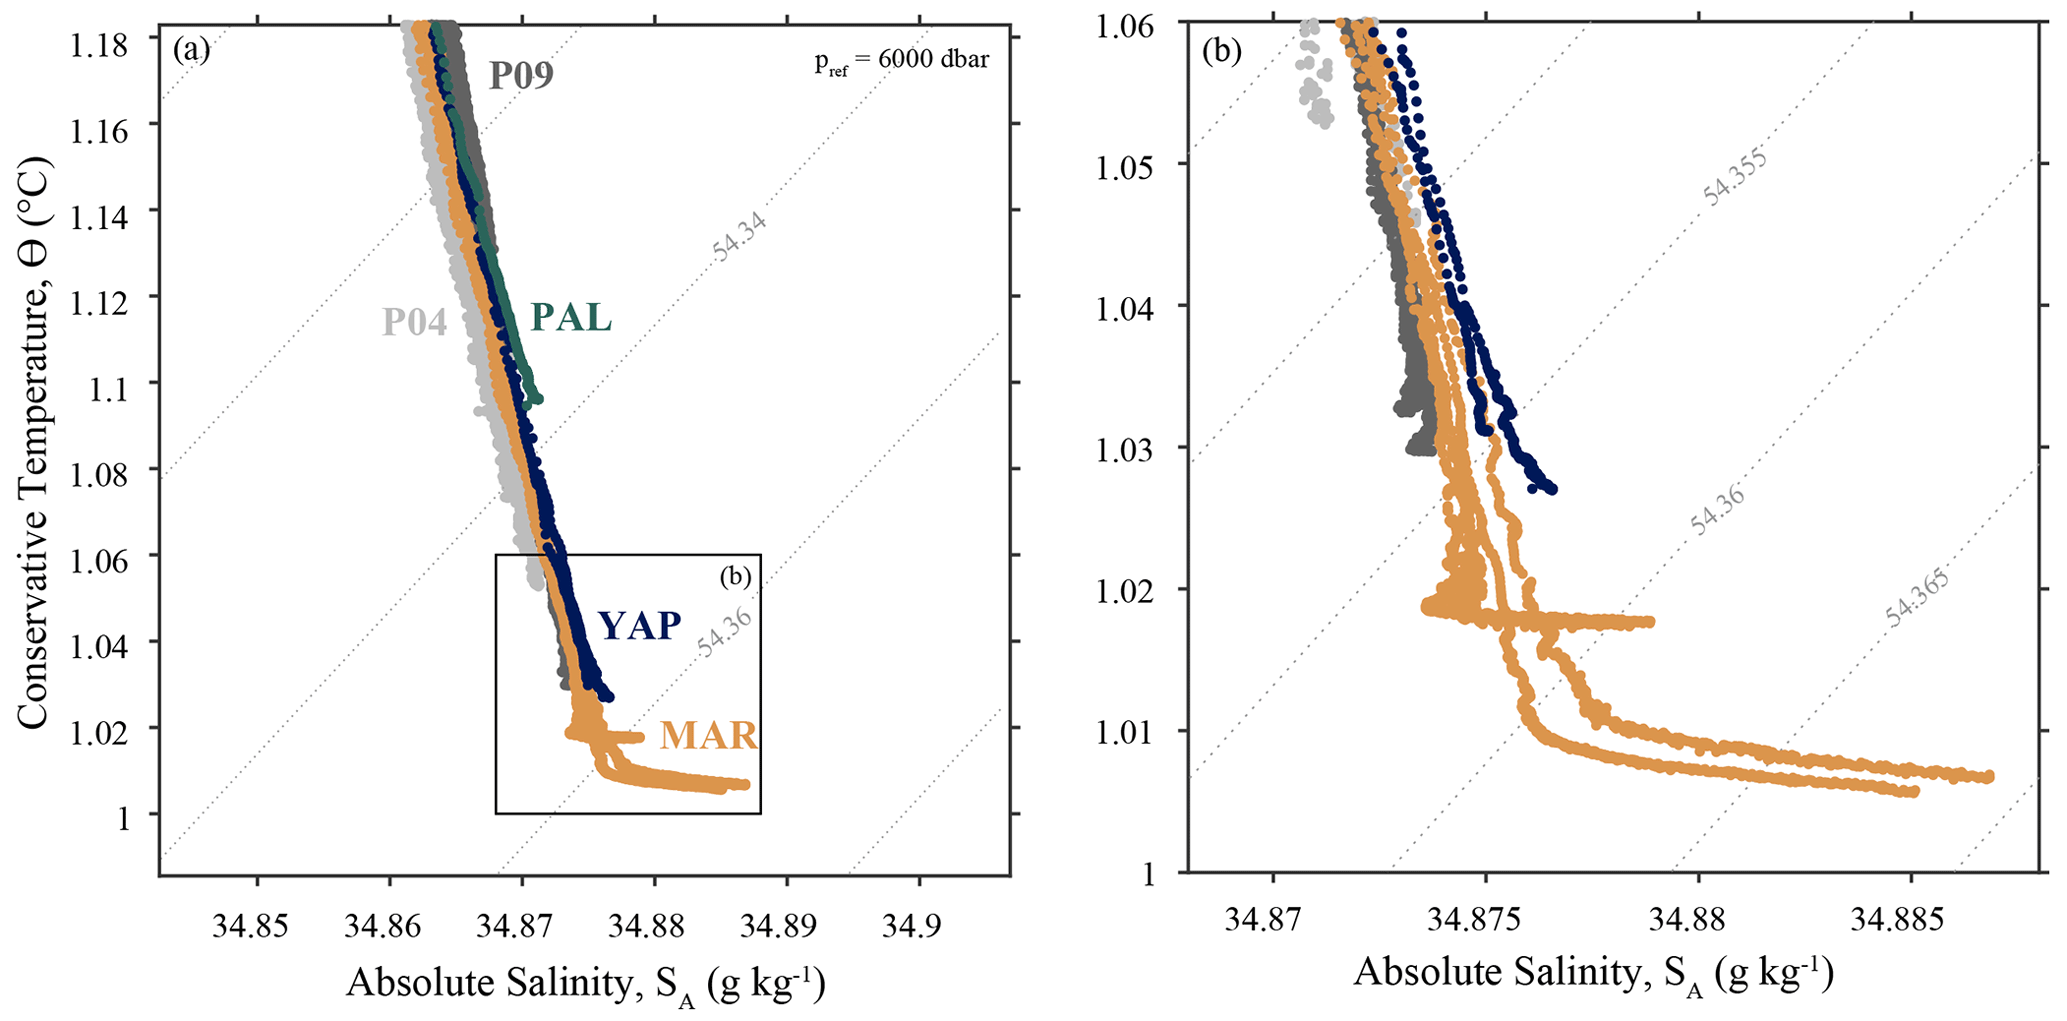
Figure 6As in Fig. 2 but for the Mariana Trench (MAR), Palau Trench (PAL), and Yap Trench (YAP). The grey is WOCE sections P04 and P09.
For the profiles in the Izu–Ogasawara Trench, dΘ dp−1 was −0.004 ∘C per 1000 dbar, and dSA dp−1 was g kg−1 per 1000 dbar between 6000 and the seafloor (maximum of 10 010 dbar) (Fig. 7a). The rate of increase in SA over 8500 dbar tripled for the deepest profile to g kg−1. In the Japan Trench (JPT), dΘ dp−1 was −0.0047 ∘C per 1000 dbar, and dSA dp−1 was g kg−1 per 1000 dbar between 6000 and the seafloor (maximum of 8170 dbar) (Fig. 7a).
In the Philippine Trench (PHI), dΘ dp−1 was −0.003 ∘C per 1000 dbar, and dSA dp−1 was g kg−1 per 1000 dbar between 6000 and the seafloor (maximum of 10 340 dbar) (Fig. 8a). The rate of increase in SA over 8500 dbar increased sixfold to 0.0011 g kg−1 per 1000 dbar for the deepest profile (Fig. 8b).
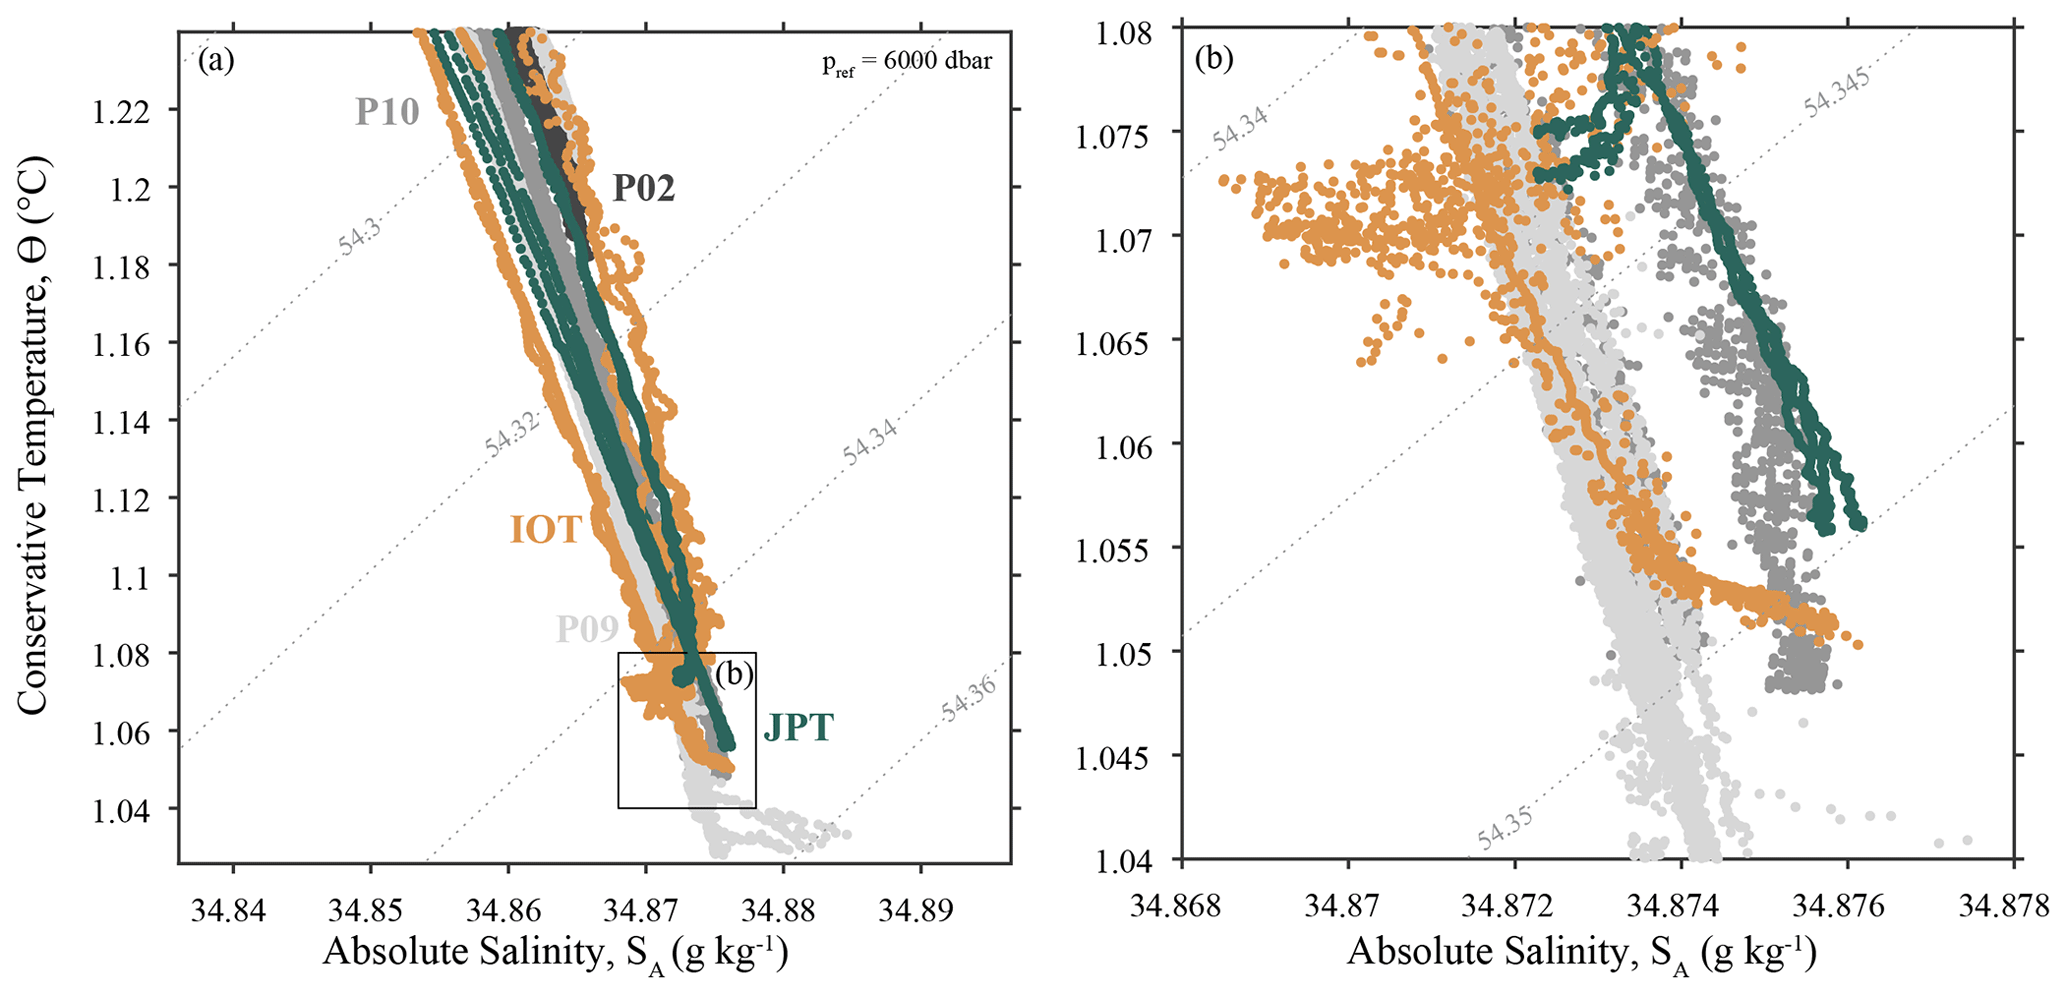
Figure 7As in Fig. 2 but for the Japan Trench (JPT) and Izu–Ogasawara Trench (IOT). The grey is WOCE sections P09 and P10. NB The fresh tail increases in GO-SHIP P10 are statically unstable but within the ± 0.002 instrument uncertainty. The same applies to shallow JPT profiles but not to shallower IOT profiles. These IOT profiles were excluded from further analysis.
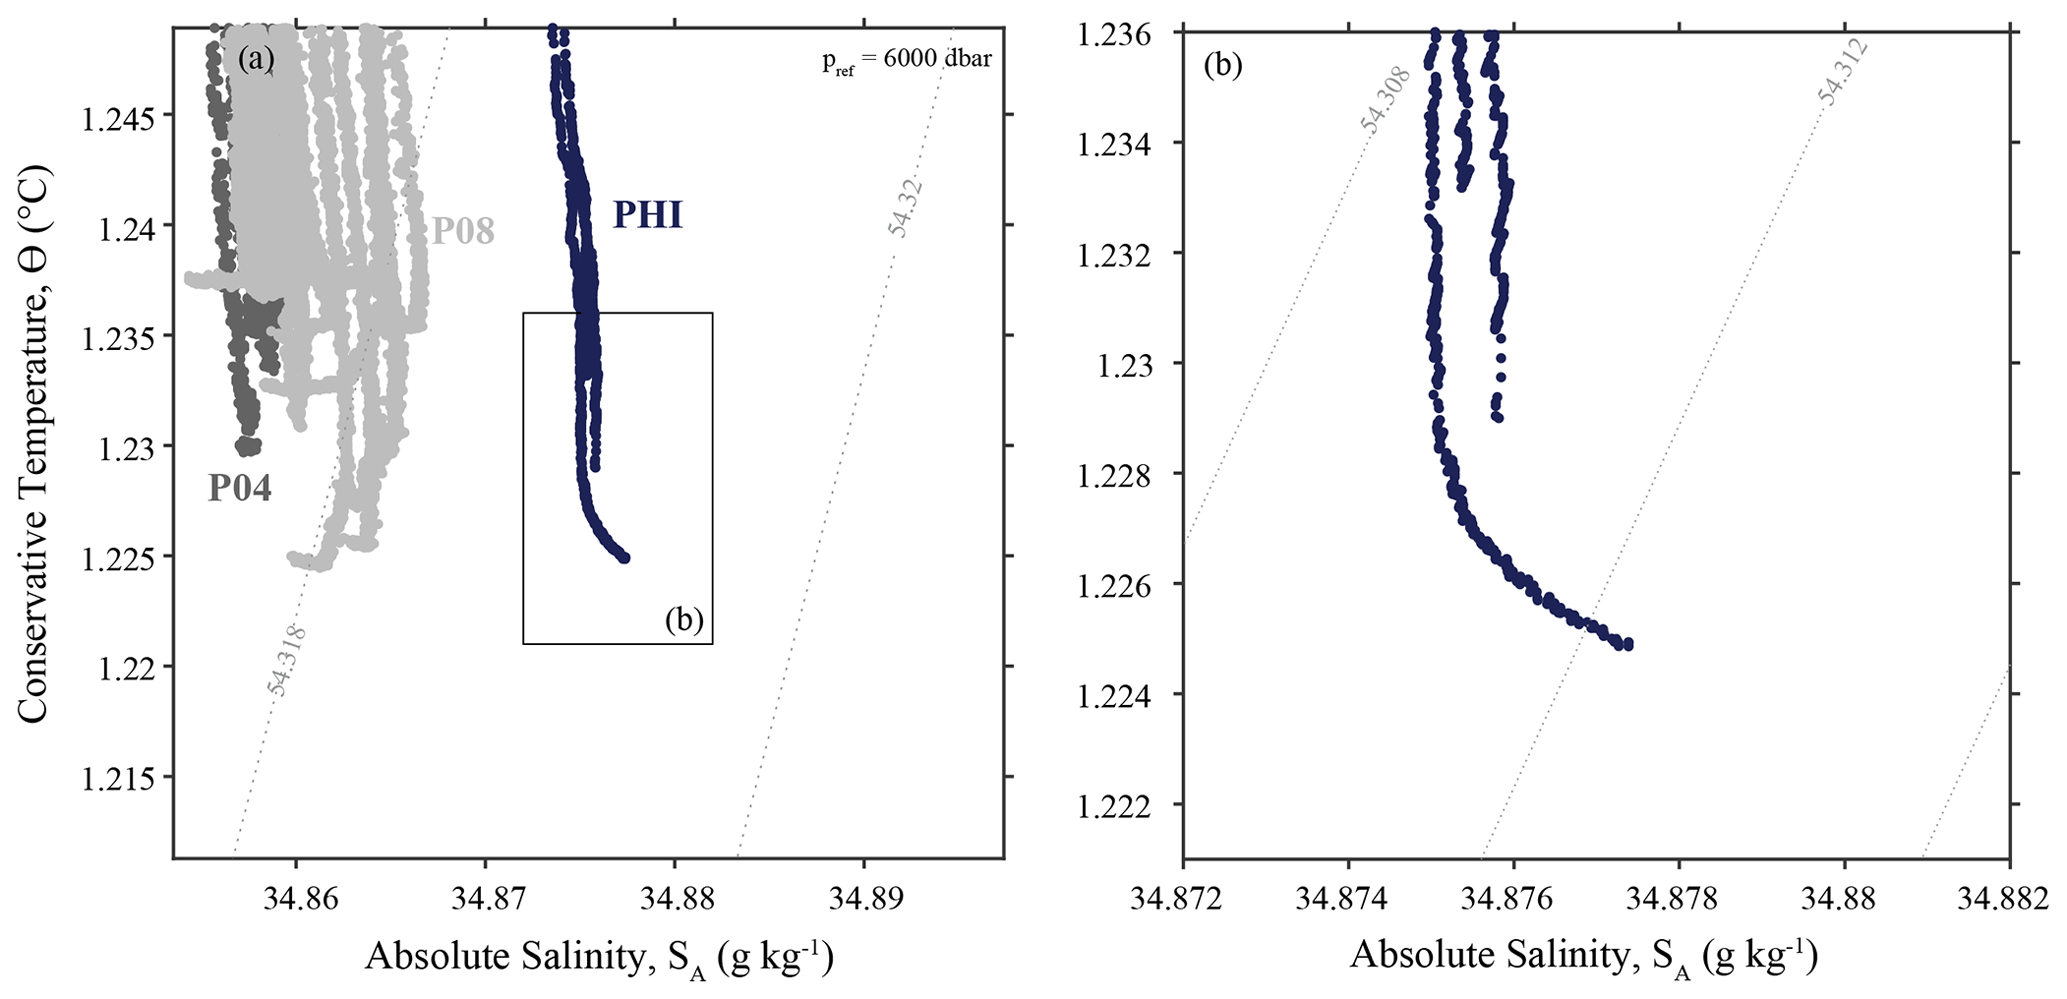
Figure 8As in Fig. 2 but for the Philippine Trench. The grey is WOCE section P08 and GO-SHIP P04. NB The fresh tail increase in P08 is statically unstable.
3.2 Bottom conditions
The South Sandwich Trench (SAND) is unique in its location in the Southern Ocean and proximity to bottom water formation compared to the other trenches. It is the coolest (Θ=0.69 ∘C, in situ temperature T=0.03 ∘C) and freshest (SA=34.82 g kg−1) of the trenches observed (Figs. 9 and 10). The Java Trench (JAV) is the only observation within the Indian Ocean and is the most saline of the 12 trenches at 7000 dbar (SA=34.89 g kg−1) (Fig. 9c). The trenches become warmer from the south to the north along the western Pacific (Fig. 9a and c). This excludes NHT and SCZ within the Bougainville–New Hebrides hadal province, which exhibited warmer and fresher water properties than TON–KRT to the east and MAR–YAP–PAL to the north. Within the northwest Pacific, the Philippine Trench (PHI) is the warmest of the trenches surrounding the Philippine Basin in terms of bottom temperature (Θ=1.24 ∘C) (Fig. 10). The average bottom conditions of the trenches within the same hadal province are within the same Θ–SA space, with the Mariana and Aleutian–Japan hadal provinces overlapping (Fig. 10). These results suggest an association between the bottom conditions in trenches within the same hadal province and their location along the bottom limb of the overturning circulation.
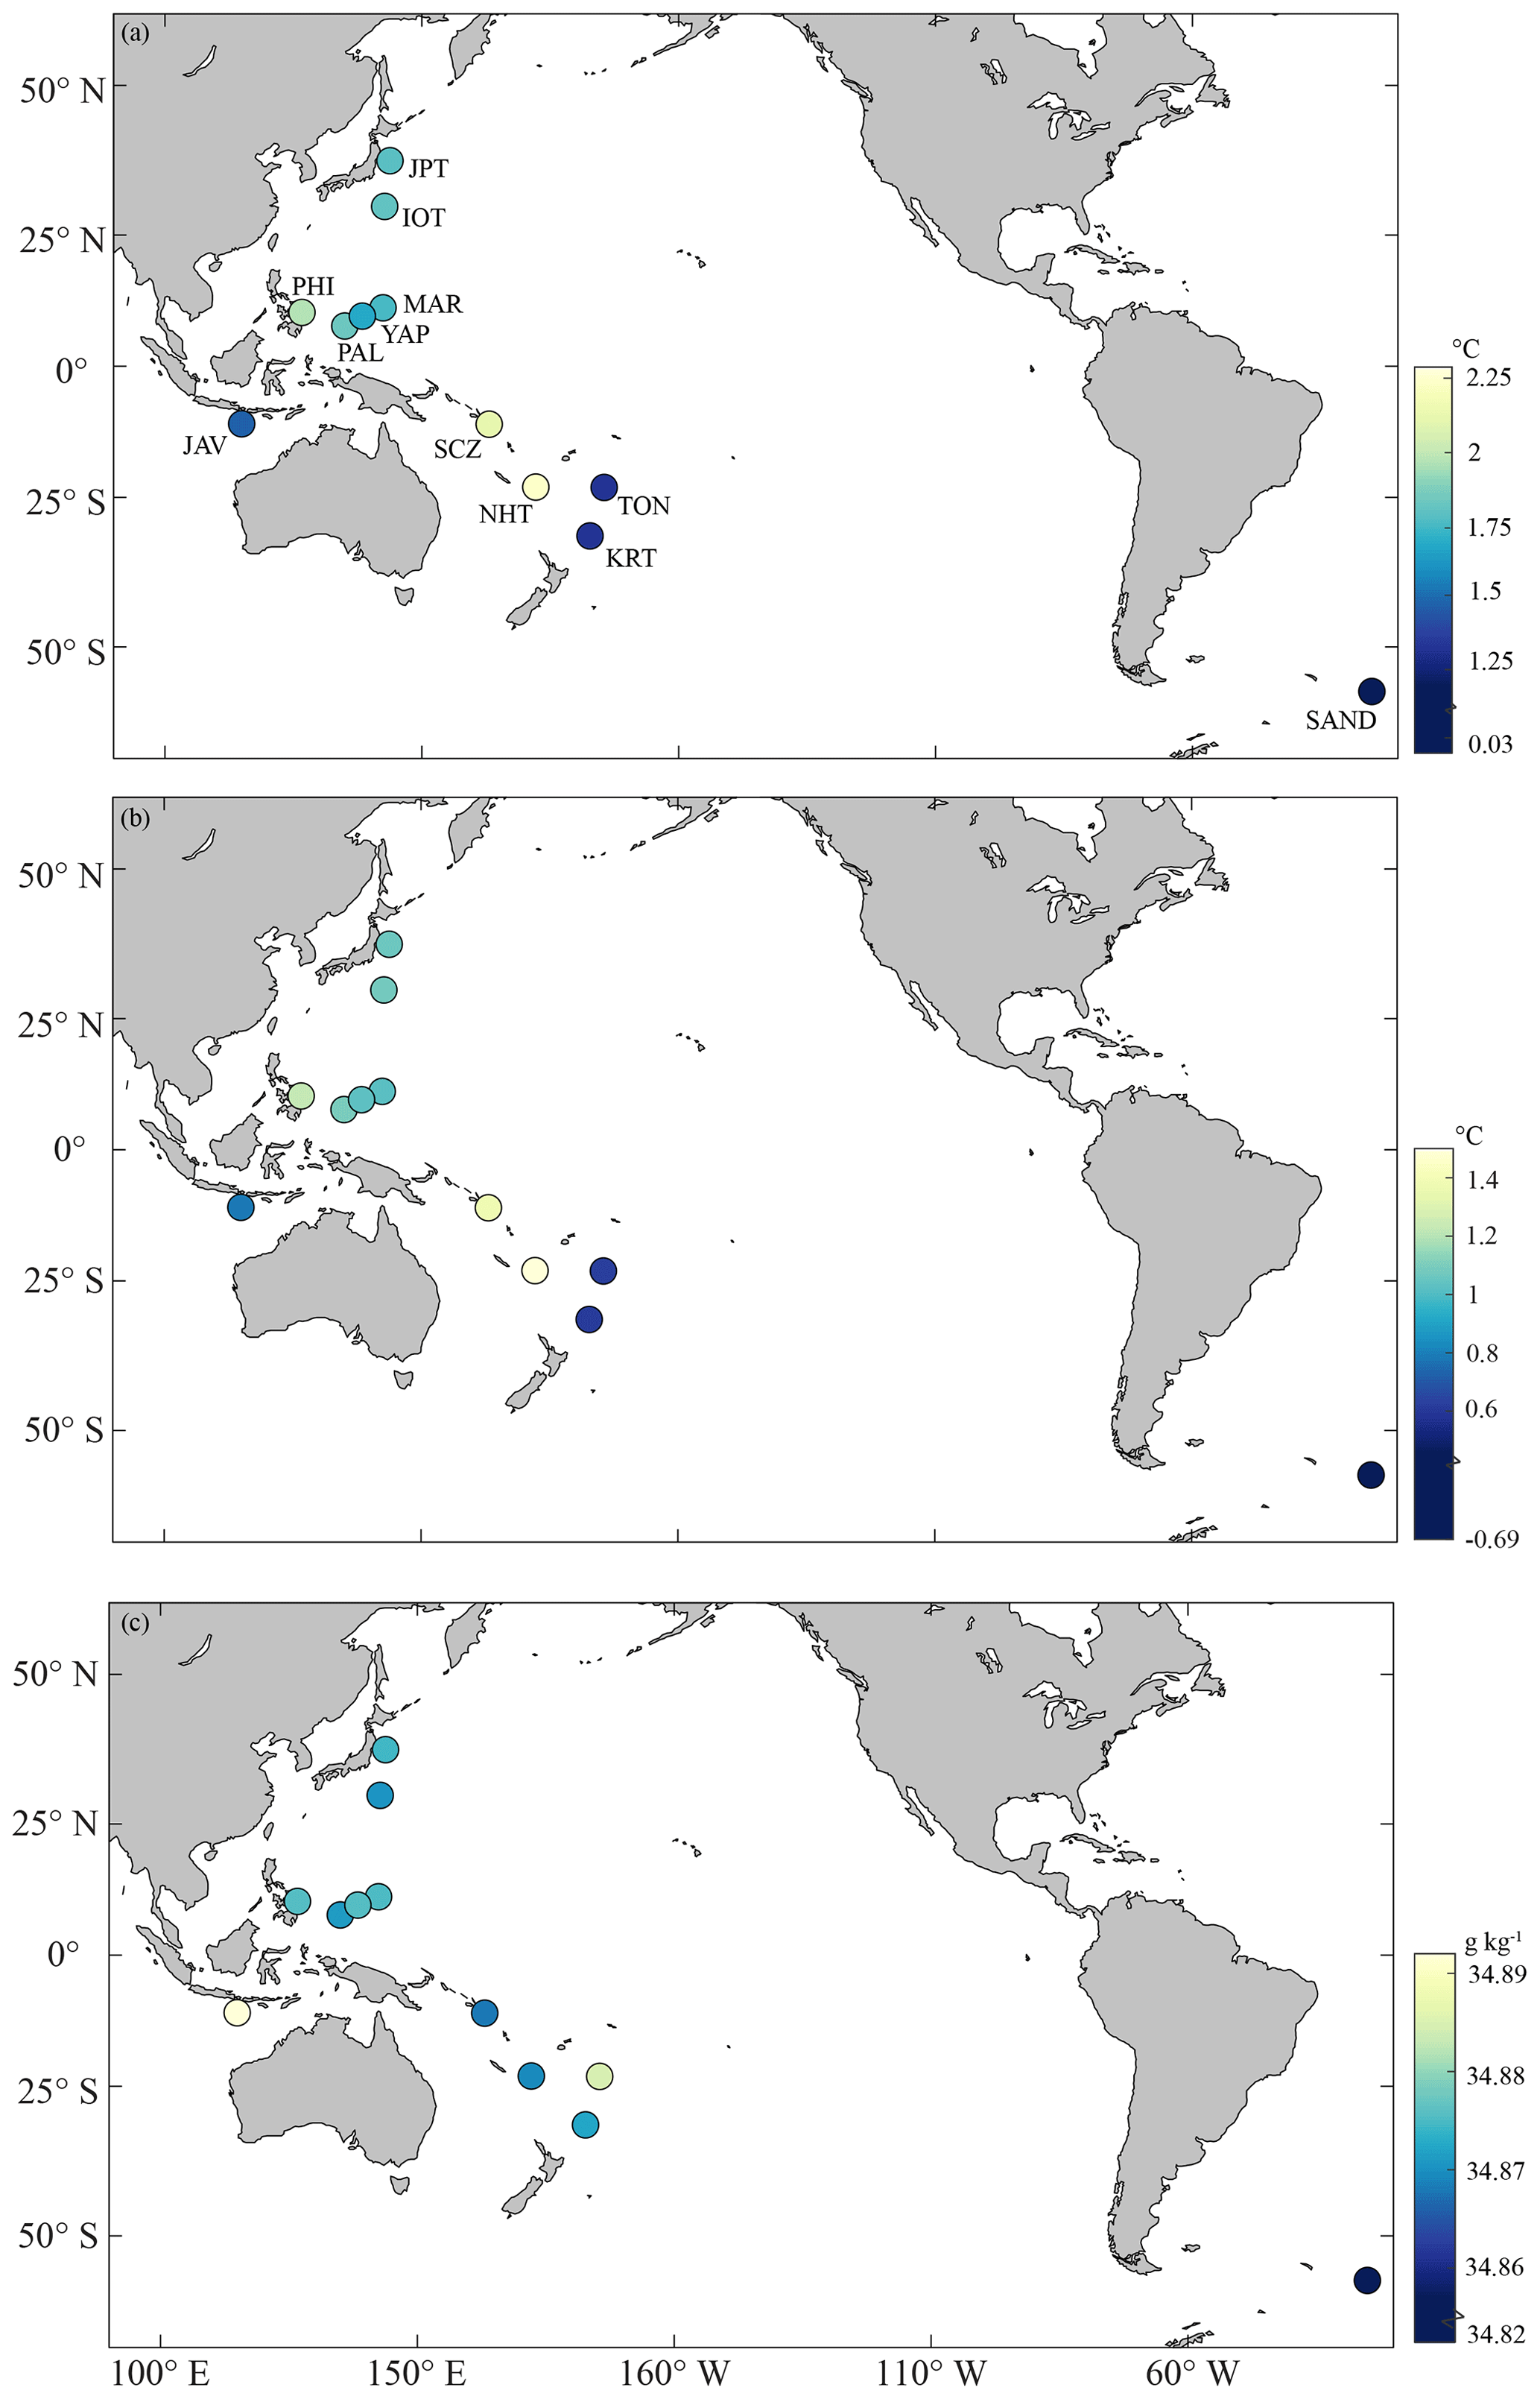
Figure 9Conditions in each trench at 7000 m depth of (a) in situ temperature (∘C), (b) Conservative Temperature (∘C), and (c) Absolute Salinity (g kg−1). JPT, Japan Trench; IOT, Izu–Ogasawara Trench; PHI, Philippine Trench; PAL, Palau Trench; YAP, Yap Trench; MAR, Mariana Trench; SCZ, Santa Cruz Trench; NHT, New Hebrides Trench; KRT, Kermadec Trench; TON, Tonga Trench; JAV, Java Trench; SAND, South Sandwich Trench.
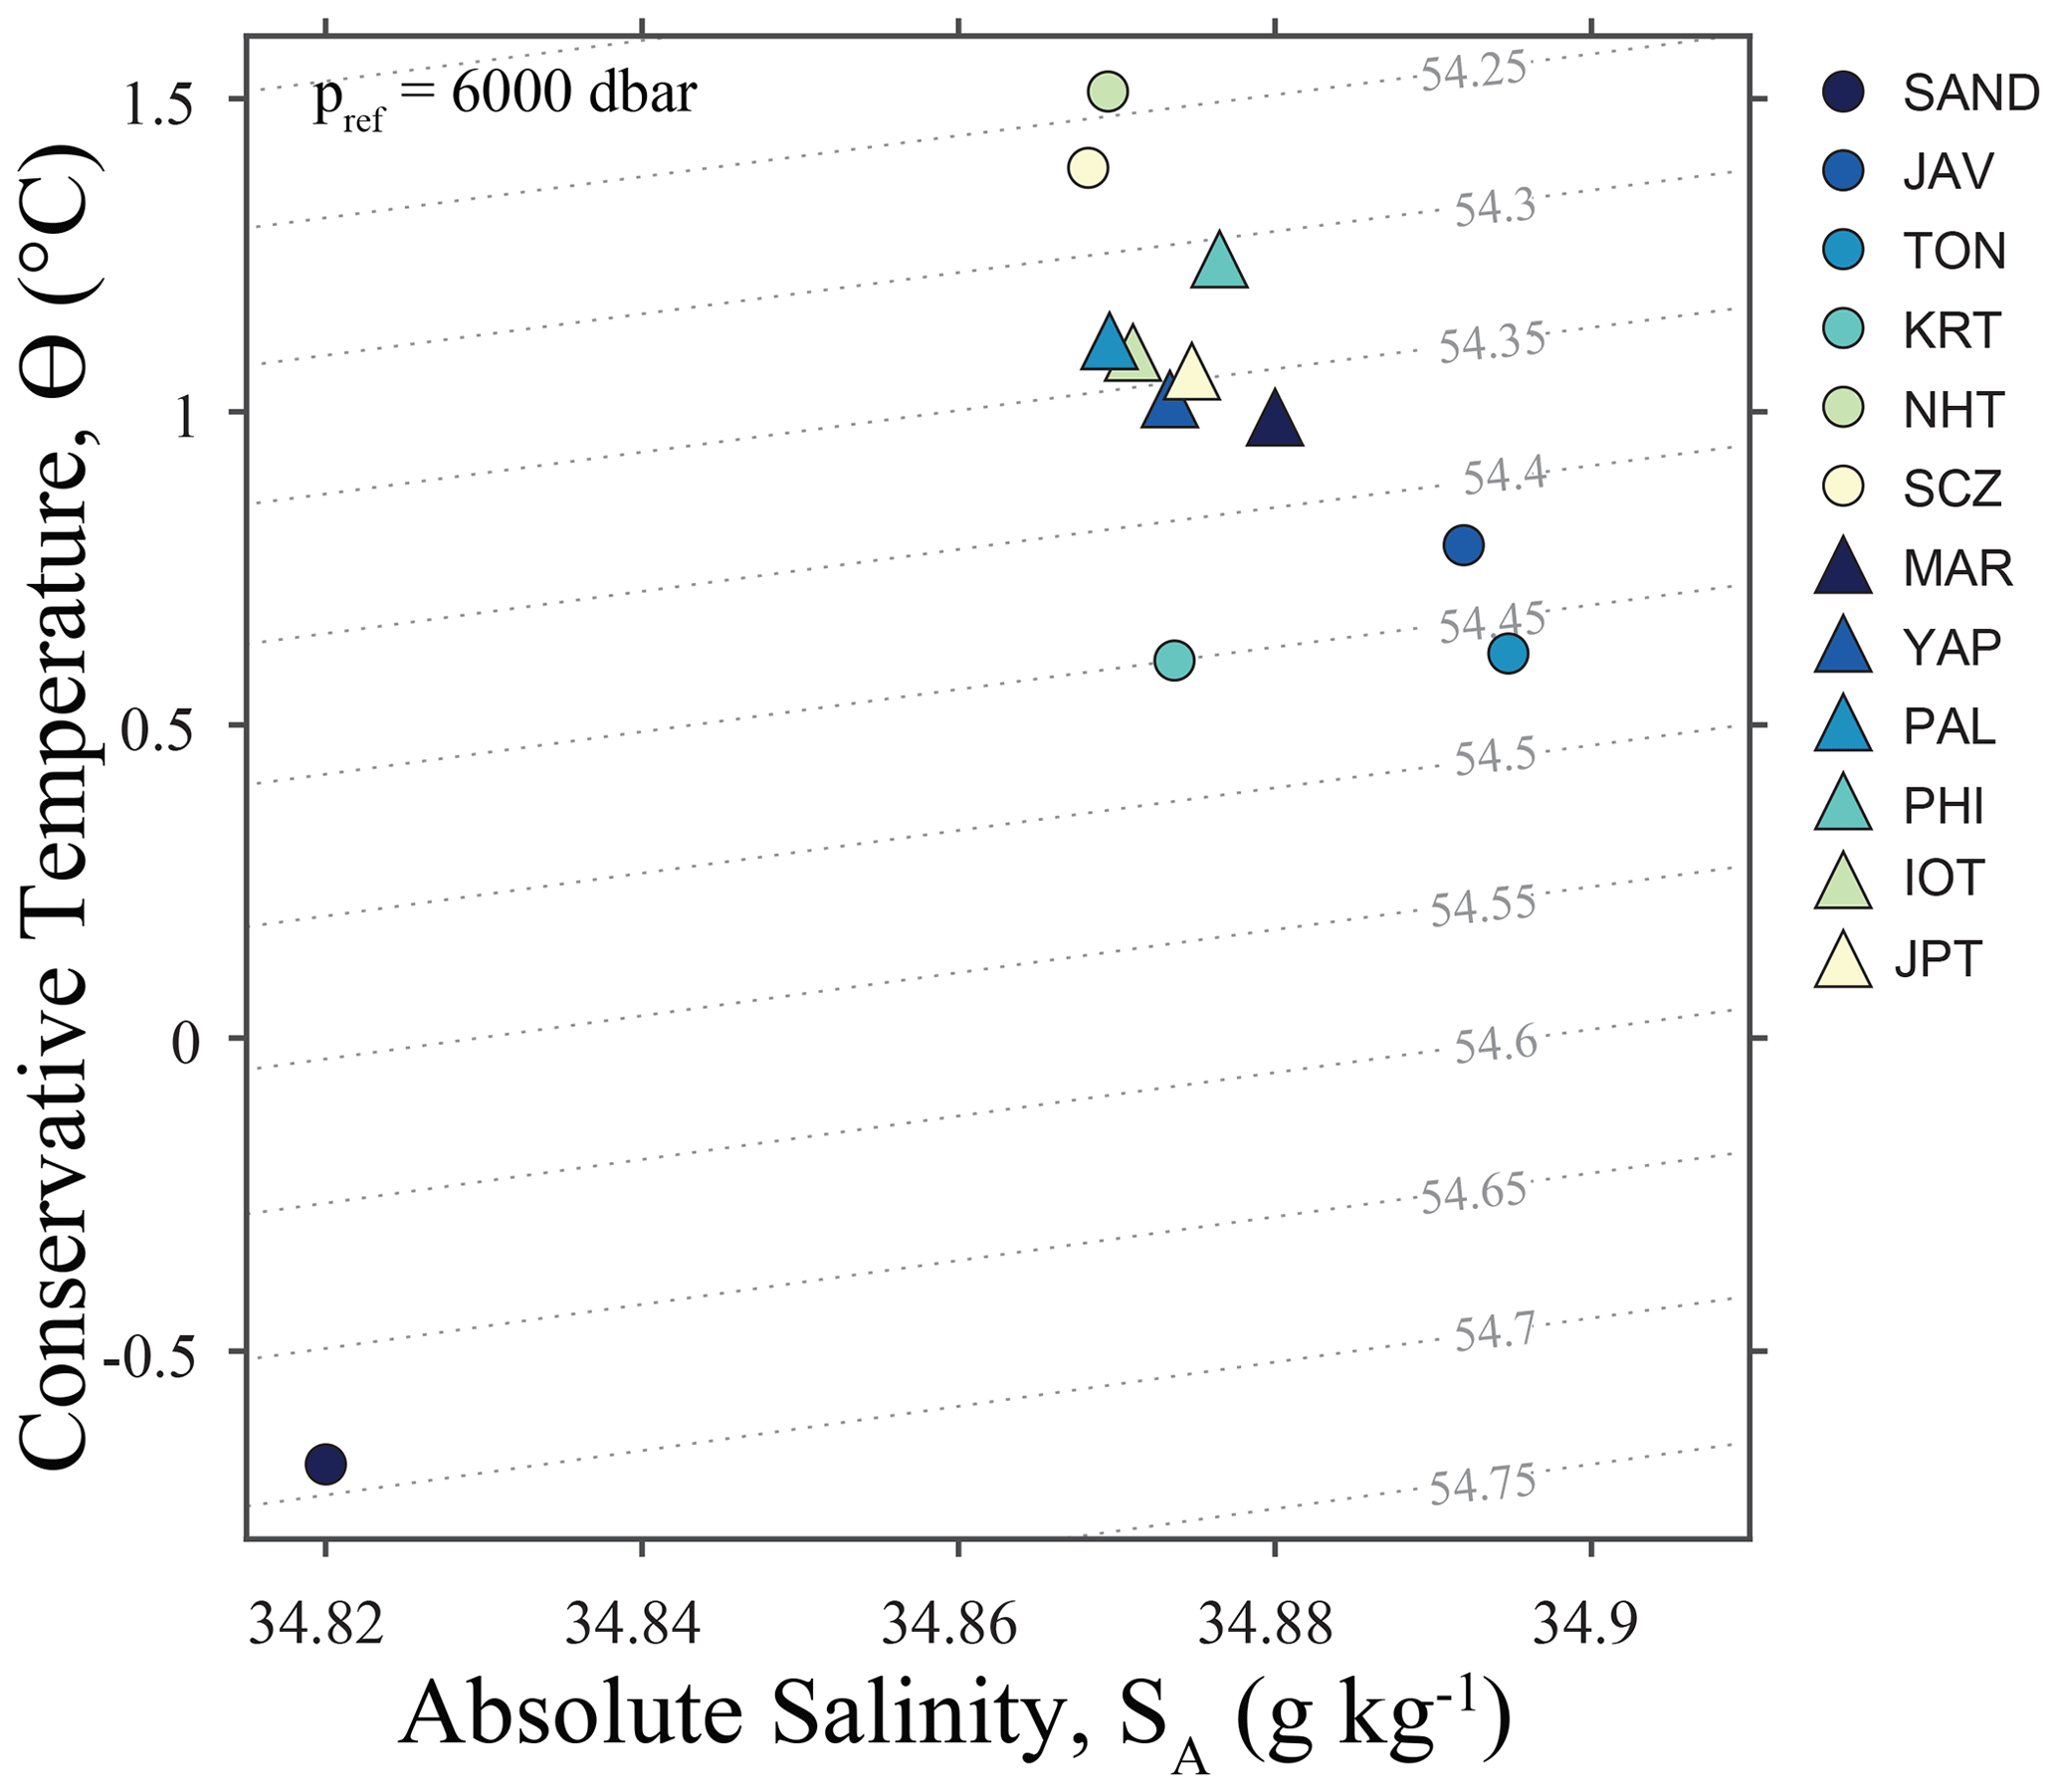
Figure 10Average bottom conditions in Θ–SA for each trench. The isopycnals (contour lines) show the potential density referenced to 6000 dbar. See Fig. 9 for the location abbreviations and Table 1 for the bottom depth.
3.3 Source water type analysis
Preliminary results indicated vertical variation in the water mass fractions over the abyssal waters (4000–6000 m) and negligible vertical variation in the hadopelagic. Within abyssal waters, the KRT, the southernmost trench of the Pacific, exhibits the greatest proportion of AABW over depth (∼ 0.49) (Fig. 11a). The proportion is lower at 4000 m for TON (∼ 0.47) (Fig. 11b); however, it has a comparable proportion of AABW to KRT throughout the hadopelagic (0.58) (Fig. 12). MAR and YAP showed a similar proportion of AABW in abyssal waters (∼ 0.19); however, MAR had a higher proportion of AABW in the hadopelagic (∼ 0.22). The conditions in PAL provided a similar output of AABW proportions to IOT and JPT in both depth ranges. The proportion of AABW in the abyssal waters (∼ 0.03) and the hadopelagic (0.05) were the lowest for PHI. There was a greater range uncertainty due to the source water types (Table 2) in the Northern Hemisphere than in the Southern Hemisphere. The range uncertainty is the highest for PHI in the abyssal waters (Fig. 11f) and the hadopelagic (Fig. 12). The more considerable variation in LCDW source water types, compared to AABW (Table 2), had a greater impact on the range uncertainty overall in the Northern Hemisphere compared to the Southern Hemisphere. Generally, the proportion of AABW decreases as the distance from the source latitude (60∘ S) increases, apart from PHI, which exhibits conditions more similar to those of LCDW.
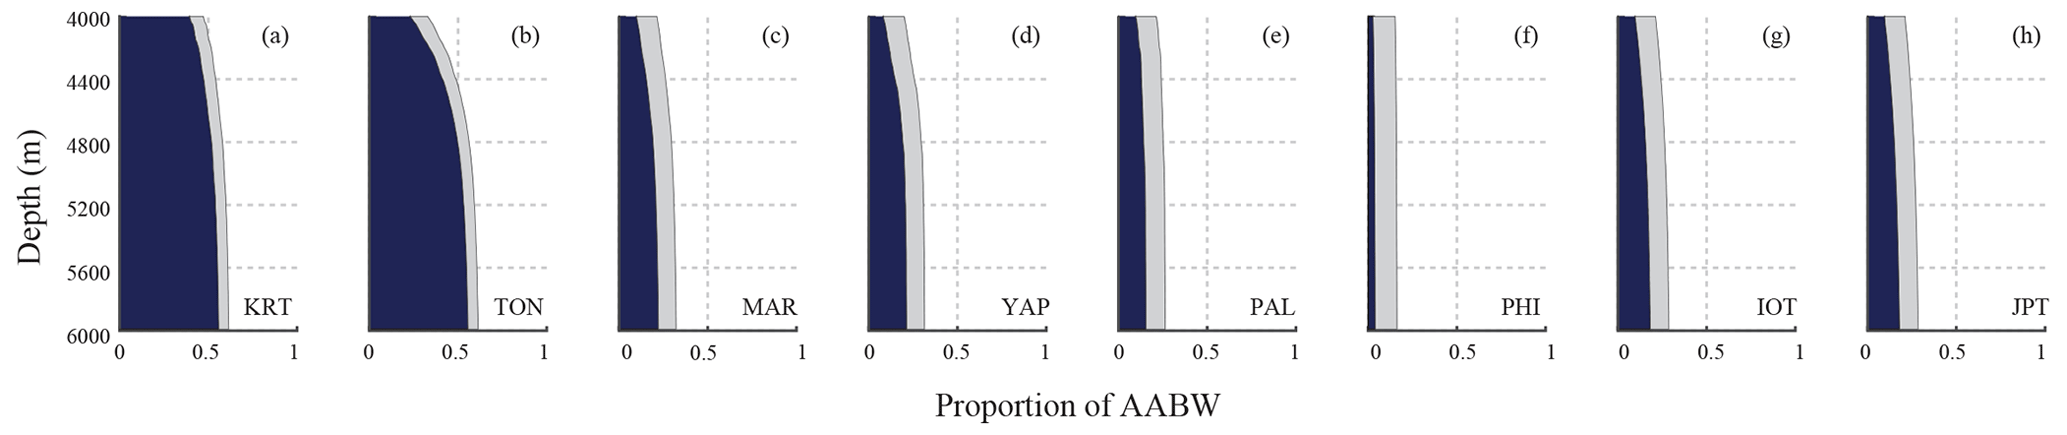
Figure 11Proportion of Antarctic Bottom Water (AABW) in the abyssal waters above (a) KRT, (b) TON, (c) MAR, (d) YAP, (e) PAL, (f) PHI, (g) IOT, and (h) JPT in the blue-shaded profile. The proportion of LCDW is 1 minus the proportion shown. The grey area represents the range uncertainty between possible source water type combinations of AABW and LCDW in the SWT analysis. The standard error of the mean was less than 10−4 in all instances.
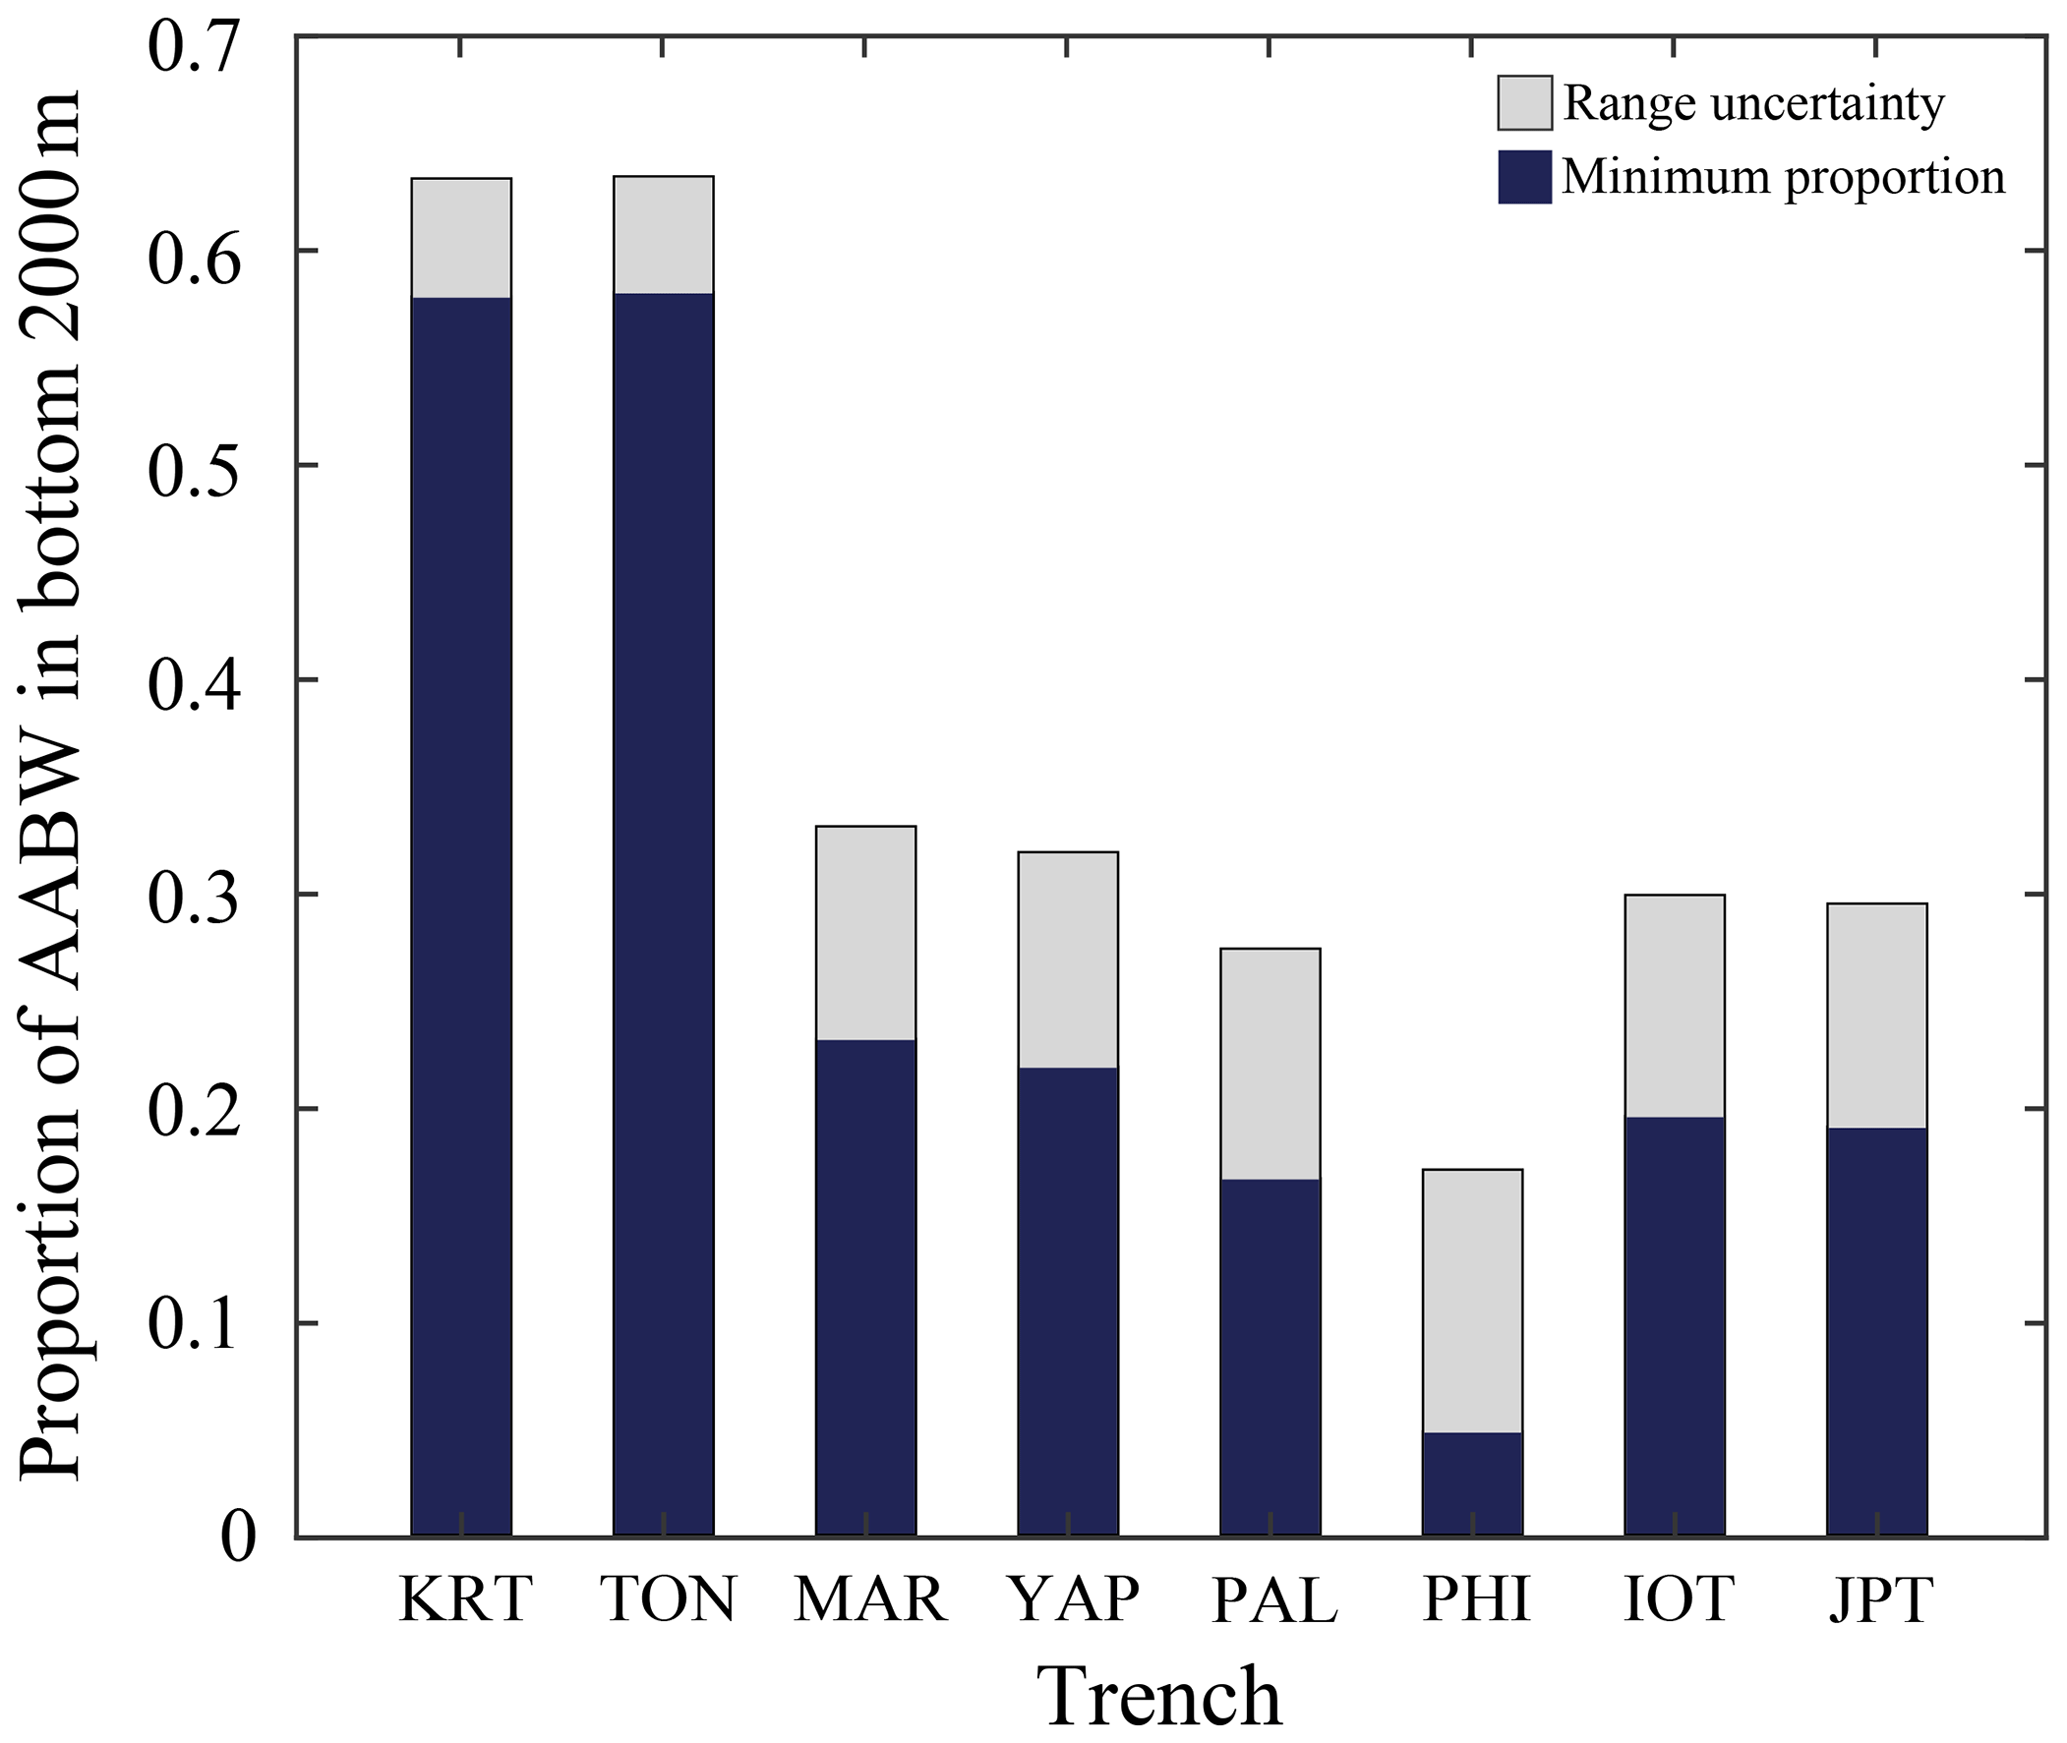
Figure 12Proportion of AABW in the bottom 2000 m of trenches in the western Pacific. The proportion of LCDW is the remainder of the proportion to equal 1. The range uncertainty is the mean range between possible source water type combinations of AABW and LCDW in the SWT analysis (Table 2). The standard error of the mean was less than 10−4 in all instances.
The variations in trench conditions were consistent within their hadal provinces and with current knowledge surrounding bottom water circulation out of the Southern Ocean (Gordon et al., 2020; Naveira Garabato et al., 2002; Talley, 2013a), in the Indian Ocean (Wijffels et al., 2002; Wang et al., 2012; Mantyla and Reid, 1995), and throughout the western Pacific (Liu, 2022; Germineaud et al., 2021; Tian et al., 2021; Zhai and Gu, 2020).
At 7000 m, the temperature is relatively consistent within the hadal provinces. Consistent differences are seen in T and Θ (Fig. 9a and b). These differences occur between either side of the South Fiji Basin, with TON and KRT being ∼ 1 ∘C cooler than NHT, SCB, and SCZ at 6000 m. Surrounding the Philippine Sea, PHI on the eastern side is ∼ 0.2 ∘C warmer than MAR, YAP, and PAL to the southeast and IOT and JPT to the northeast. These two differences in the south and northeast Pacific are likely due to the moving of cold Antarctic Bottom Water (AABW)/Lower Circumpolar Deep Water (LCDW) northward at hadal depths along the Tonga–Kermadec Ridge and north-eastward to reach the Mariana–Yap Junction (Kawabe and Fujio, 2010). The LCDW does not penetrate into the south Philippine Basin due to the Central Basin Fault (Tian et al., 2021), which may explain these differences and the SWT analysis results. The same applies to NHT and SCZ, which are less ventilated by the LCDW (Germineaud et al., 2021).
Our observations revealed fine-scale variations in the hydrographic profiles that require further exploration. The Java Trench, which we believe is the first full-depth hydrographic profile, displays a Θ–SA profile shape similar to that of Bayhaqi et al. (2018) and Atmadipoera et al. (2009). There is a split in the Θ–SA shape at 0.8 ∘C (Fig. 3b), likely due to the opposing movement of bottom water on either side of the trench sills, with the northernmost profile displaying a slightly higher salinity (Zhai and Gu, 2020; Johnson, 1998). A similar diversion appears in the Yap Trench (Fig. 6b), with the deeper, saltier profiler nearer to the Yap–Mariana Junction, possibly due to local water isolation at hadal or bottom water depths, as suggested by Liu et al. (2022). Although the CTD profiles for IOT are more variable than neighbouring JPT profiles, they meet our quality-control criteria. The IOT profiles display an increase in SA over a constant Θ of 1.06 ∘C, like the profiles from section P09. The IOT's location within the primary flow path of AABW/LCDW and UCDW may contribute to increased mixing (Zhou et al., 2022; Taira, 2006). Conversely, our observations at PHI show a discrepancy in SA compared to the WOCE deployments (Fig. 8a), which could be due to conductivity measurement inconsistencies or possible sensor drift (van Haren et al., 2021; van Haren, 2022; Gouretski et al., 2022). Further supporting this is the fact that moored profiles from Wang et al. (2017), 4∘ south of our observation, show a lower average SA. Given these complexities, additional measurements within these trenches are necessary.
The warmer waters of PHI and the resulting lowest fraction of AABW in the hadopelagic (0.05± 0.01) compared to nearby trenches are consistent with the observed circulation within the Philippine Basin (Tian et al., 2021; Zhai and Gu, 2020; Wang et al., 2017). The bottom water enters through the Yap–Mariana Junction, spilling into the Philippine Sea, flowing northward and westward, but is blocked to the south by the Central Basin Fault (Tian et al., 2021). Aside from PHI, the proportion of AABW within a trench decreases with increasing distance from the Southern Ocean (Fig. 12). Overall, the proportion of AABW within trenches along the western Pacific is consistent with bottom water circulation in the Pacific (Kawabe et al., 2003; Kawabe, 1993). However, our water mass analysis results are limited by the constraints placed on the water mass seawater properties used in the analysis. A robust understanding of circulation deeper than 6000 m is rare and biased towards MAR (van Haren et al., 2017; Jiang et al., 2021), while circulations of abyssal waters above the trenches in the Pacific are well described (Liu, 2022; Taft et al., 1991; Kawabe, 1993; Zilberman et al., 2020). Recent studies on PHI have described a cyclonic motion over the southern portion of the trench (Tian et al., 2021; Zhai and Gu, 2020; Wang et al., 2017), originally detailed by Johnson (1998), also present over other trenches (Mitsuzawa and Holloway, 1998; Warren and Brechner Owens, 1985; Huang et al., 2018; Nagano et al., 2013; Ma et al., 2021). Given the difficulties of deploying moored current profilers to hadal depths, where future deployments are limited to CTDs, deployments should be along transects in a meridional or zonal direction to allow for calculations of geostrophic velocities within and above the trench sills. Furthermore, deploying sensors with higher-frequency measurements than those included here is needed to uncover details on turbulent mixing processes, geothermal heating considerations, and internal wave characteristics within weakly stratified trenches (van Haren, 2020a, 2023; Joyce et al., 1986).
From around 9000 dbar, increases in SA of approximately 0.003 g kg−1 per 1000 dbar were observed in the KRT, TON, MAR, and PHI trenches, giving “salty tails”. This was despite applying a linear pressure correction to the conductivity data during processing. Similar findings were noted by van Haren et al. (2021) and Taira (2005) in the Mariana Trench. Following discussions with the CTD instrument manufacturer, SeaBird Electronics, we decided against implementing the corrections suggested by van Haren et al. (2021) for an SBE 911 CTD (SeaBird, personal communication, 2022). The decision was because corrected salinity data still exhibited an increase when the correction was applied, and the conductivity correction is specific to the instrument. Van Haren et al. (2021) proposed that this increase could signify dense modified AABW mixing with higher-salinity LCDW in the trenches over long timescales. This observation is particularly relevant within KRT and TON, which serve as a conduit between LCDW and cold AABW from the south to the north of the Pacific (Reid, 1997; Zilberman et al., 2020). It is likely that the salty tails are due to sensor-dependent interaction between the glass conductivity cells and their protective jacket in the instrument (Kobayashi et al., 2021), which is taken into consideration when correcting for conductivity cell compressibility; however, it could be different for each instrument. This would explain the differences between the varying rates of SA increase. Potential real causes include small-scale influences from diapycnal mixing and internal tides (van Haren, 2020a) or saline pore water being expelled from deep-sea sediments due to intense pressures (Oguri et al., 2022; Glud et al., 2013; Turnewitsch et al., 2014), which could result in the salty tails. Without water samples from the trench sill to the trench floor, we cannot confidently confirm or deny the reality of the salty tails. Additionally, GO-SHIP data are limited to 6000 dbar. Nevertheless, in our circumstance, the largest increase in SA is 0.015 g kg−1 over the bottom 1000 m of TON compared to the smallest difference in AABW and LCDW SA of 0.0218 g kg−1 (Table 1). Therefore, this slight SA increase does not significantly affect the water mass proportion over hadal depths in these trenches.
The observed latitude-dependent pattern is key to understanding climate change scenarios, especially alterations in AABW ranging from export rate to warming (Zhou et al., 2023; Jacobs et al., 2022; Bai et al., 2022; Boeira Dias et al., 2023). Warming has been predominant in the Indian Ocean, with contrasting freshening in the eastern region and increased salinity in the western region (Choi and Nam, 2022; Thomas et al., 2020). Similar trends of warming and freshening are well documented in the Pacific (Purkey et al., 2019; Johnson et al., 2019; Lele et al., 2021) and the Atlantic (Campos et al., 2021; Liu and Tanhua, 2021). Compared to the 1990 WOCE S4, the South Sandwich Trench profiles are fresher and warmer, a predictable discrepancy considering the time difference (Gordon et al., 2020; Zhang and Delworth, 2016). We intentionally did not address temporal changes in the WOCE/GO-SHIP sections, given their comprehensive coverage elsewhere (Hautala and Finucane, 2022; Wijffels et al., 2002; Naveira Garabato et al., 2014; Wijffels et al., 1998; Talley, 2013a). While single observations from some trenches provide a preliminary perspective, they should be interpreted cautiously when drawing long-term warming or freshening trends, even in the overlying abyssal waters (Schmidt et al., 2023). Increased physical data from hadal depths, specifically regions other than the Mariana Trench, are required to thoroughly understand long-term temporal and spatial differences.
Bottom water masses, originating in the high latitudes, ventilate approximately 75 % of the ocean below 1500 m through global overturning circulation (Robinson and Stommel, 1959; Stommel and Arons, 1959; Khatiwala et al., 2012). A trench's conditions over hadal depths are significantly dictated by its geospatial position along the large deep circulation path, introducing complexity and spatial heterogeneity (Kawabe and Fujio, 2010; Kawabe, 1993). Considering these factors, our results are consistent with the current body of knowledge surrounding hadal trenches and add to our understanding. Additionally, trench environments exhibit significant spatial heterogeneity of species, encompassing macrofauna such as amphipods to microscopic life forms, including single-celled organisms and bacteria (Weston et al., 2022; Schauberger et al., 2021; Jing et al., 2018). Intensifying our observational focus and understanding of the physical conditions in the hadopelagic can offer deeper insights into ecological interconnections, diversity, and the driving forces behind such biodiversity. This knowledge is particularly critical considering the vertical transport of organic material into these trenches' sills, a process fundamental to life sustenance (Ichino et al., 2015; Glud et al., 2013). Thus, despite potential enhancements, the baseline environmental conditions elucidated in the current study serve as an indispensable foundation for future research across ecological, biological, and physical oceanographic fields (Levin et al., 2019).
This study reinforces the importance of understanding hadal trench conditions and their heterogeneity due to their geospatial positions along deep circulation paths. Distinct geographical trends were identified, with the South Sandwich Trench and Java Trench exemplifying diverse profiles due to their respective locations. Vertical variations in water mass fractions were observed across trenches, with the southernmost Pacific trench, the Kermadec Trench, holding the most substantial Antarctic Bottom Water proportion. Warmer waters in the Philippine Trench indicated reduced Antarctic Bottom Water presence, consistent with its remote location on the westernmost side of the Philippine Sea. A consistent salinity increase at depths across several trenches was noted, possibly due to deep-sea sediment processes or water mass mixing. Latitude-dependent patterns are crucial for understanding potential climate change scenarios and suggest consistent warming and freshening trends in the Indian, Pacific, and Atlantic oceans. The study provides valuable baseline conditions for future ecological, biological, and physical oceanographic exploration and underscores the need for high-frequency sensor deployment and expanded trench coverage.
The data sets used in this study are available upon request.
The supplement related to this article is available online at: https://doi.org/10.5194/os-20-123-2024-supplement.
JK completed the data processing, performed data analysis, and prepared the paper. JK and JZ designed the data analysis. AJ collected the data. CP provided data presentation suggestions.
The contact author has declared that none of the authors has any competing interests.
Publisher’s note: Copernicus Publications remains neutral with regard to jurisdictional claims made in the text, published maps, institutional affiliations, or any other geographical representation in this paper. While Copernicus Publications makes every effort to include appropriate place names, the final responsibility lies with the authors.
We thank the captain, crew, and company of the DSSV Pressure Drop during the Five Deeps and Ring of Fire expeditions. We also thank Victor Vescovo (Caladan Oceanic LLC, US), Cassie Bongiovanni (Caladan Oceanic LLC, US), Patrick Lahey, Shane Eigler, Tim Macdonald (Triton Submarines LLC, US), and Rob McCallum (EYOS Expeditions, UK). We would also like to acknowledge Devin Harrison for the map in the Supplement that was made for this publication.
This paper was edited by Ilker Fer and reviewed by two anonymous referees.
Abernathey, R. P., Cerovecki, I., Holland, P. R., Newsom, E., Mazloff, M., and Talley, L. D.: Water-mass transformation by sea ice in the upper branch of the Southern Ocean overturning, Nat. Geosci., 9, 596–601, https://doi.org/10.1038/ngeo2749, 2016.
Arvapalli., S. R., Bajish, C. C., and Kurian P, J.: Hydrographic observations in the rift valley of Southwest Indian Ridge from 63∘ E–69∘ E, Dynam. Atmos. Oceans, 97, 101284, https://doi.org/10.1016/j.dynatmoce.2022.101284, 2022.
Atmadipoera, A., Molcard, R., Madec, G., Wijffels, S. E., Sprintall, J., Koch-Larrouy, A., Jaya, I., and Supangat, A.: Characteristics and variability of the Indonesian throughflow water at the outflow straits, Deep-Sea Res. Pt. I., 56, 1942–1954, https://doi.org/10.1016/j.dsr.2009.06.004, 2009.
Bai, Y., Zhao, L., Xiao, J., and Lin, S.: Contraction and warming of Antarctic Bottom Water in the Amundsen Sea, Acta Oceanol. Sin., 41, 68–79, https://doi.org/10.1007/s13131-021-1829-8, 2022.
Bayhaqi, A., Iskandar, I., Surinati, D., Budiman, A. S., Wardhana, A. K., Dirhamsyah, Yuan, D., and Lestari, D. O.: Water mass characteristic in the outflow region of the Indonesian throughflow during and post 2016 negative Indian ocean dipole event, IOP Conf. Ser. Earth Environ. Sci., 149, 012053, https://doi.org/10.1088/1755-1315/149/1/012053, 2018.
Beliaev, G. M.: Deep Sea Ocean Trenches and Their Fauna, Nauka Publishing House, Moscow, 255 pp., ISBN 5-02-005276-0, 1989.
Boeira Dias, F., Rintoul, S. R., Richter, O., Galton-Fenzi, B. K., Zika, J. D., Pellichero, V., and Uotila, P.: Sensitivity of simulated water mass transformation on the Antarctic shelf to tides, topography and model resolution, Front. Mar. Sci., 10, 1027704, https://doi.org/10.3389/fmars.2023.1027704, 2023.
Bongiovanni, C., Stewart, H. A., and Jamieson, A. J.: High-resolution multibeam sonar bathymetry of the deepest place in each ocean, Geosci. Data J., 9, 108–123, https://doi.org/10.1002/gdj3.122, 2021.
Campos, E. J. D., van Caspel, M. C., Zenk, W., Morozov, E. G., Frey, D. I., Piola, A. R., Meinen, C. S., Sato, O. T., Perez, R. C., and Dong, S.: Warming Trend in Antarctic Bottom Water in the Vema Channel in the South Atlantic, Geophys. Res. Lett., 48, e2021GL094709, https://doi.org/10.1029/2021GL094709, 2021.
Chinni, V., Singh, S., Bhushan, R., Rengarajan, R., and Sarma, V.: Spatial variability in dissolved iron concentrations in the marginal and open waters of the Indian Ocean, Mar. Chem., 208, 11–28, https://doi.org/10.1016/j.marchem.2018.11.007, 2019.
Choi, Y. and Nam, S.: East–west contrasting changes in Southern Indian Ocean Antarctic Bottom Water salinity over three decades, Sci. Rep., 12, 12175, https://doi.org/10.1038/s41598-022-16331-y, 2022.
Cimoli, L., Mashayek, A., Johnson, H. L., Marshall, D. P., Naveira Garabato, A. C., Whalen, C. B., Vic, C., de Lavergne, C., Alford, M. H., MacKinnon, J. A., and Talley, L. D.: Significance of Diapycnal Mixing Within the Atlantic Meridional Overturning Circulation, AGU Adv., 4, e2022AV000800, https://doi.org/10.1029/2022AV000800, 2023.
Dickson, R. R. and Brown, J.: The production of North Atlantic Deep Water: sources, rates, and pathways, J. Geophys. Res., 99, 12319–12341, https://doi.org/10.1029/94jc00530, 1994.
Fine, R. A., Smethie, W. M., Bullister, J. L., Rhein, M., Min, D.-H., Warner, M. J., Poisson, A., and Weiss, R. F.: Decadal ventilation and mixing of Indian Ocean waters, Deep-Sea Res. Pt. I, 55, 20–37, https://doi.org/10.1016/j.dsr.2007.10.002, 2008.
Fujio, S.: Deep current measurements at 38∘ N east of Japan, J. Geophys. Res., 110, C02010, https://doi.org/10.1029/2004JC002288, 2005.
Fujio, S., Yanagimoto, D., and Taira, K.: Deep current structure above the Izu-Ogasawara Trench, J. Geophys. Res., 105, 6377–6386, 2000.
Ganachaud, A.: Large-scale mass transports, water mass formation, and diffusivities estimated from World Ocean Circulation Experiment (WOCE) hydrographic data, J. Geophys. Res., 108, 3213, https://doi.org/10.1029/2002JC001565, 2003.
Ganachaud, A. and Wunsch, C.: Improved estimates of global ocean circulation, heat transport and mixing from hydrographic data, Nature, 408, 453–457, 2000.
Germineaud, C., Cravatte, S., Sprintall, J., Alberty, M., Grenier, M., and Ganachaud, A.: Deep pacific circulation: New insights on pathways through the Solomon Sea, Deep-Sea Res. Pt. I, 171, 103510, https://doi.org/10.1016/j.dsr.2021.103510, 2021.
Glud, R. N., Wenzhöfer, F., Middelboe, M., Oguri, K., Turnewitsch, R., Canfield, D. E., and Kitazato, H.: High rates of microbial carbon turnover in sediments in the deepest oceanic trench on Earth, Nat. Geosci., 6, 284–288, https://doi.org/10.1038/ngeo1773, 2013.
Goodman, P. J.: The Role of North Atlantic Deep Water Formation in an OGCM's Ventilation and Thermohaline Circulation, J. Phys. Oceanogr., 28, 1759–1785, https://doi.org/10.1175/1520-0485(1998)028<1759:TRONAD>2.0.CO;2, 1998.
Gordon, A. L.: Interocean exchange of thermocline water, J. Geophys. Res.-Ocean., 91, 5037–5046, https://doi.org/10.1029/JC091iC04p05037, 1986a.
Gordon, A. L.: Is there a global scale ocean circulation?, Eos Trans. Am. Geophys. Union, 67, 109–110, https://doi.org/10.1029/EO067i009p00109, 1986b.
Gordon, A. L., Huber, B. A., and Abrahamsen, E. P.: Interannual Variability of the Outflow of Weddell Sea Bottom Water, Geophys. Res. Lett., 47, e2020GL087014, https://doi.org/10.1029/2020GL087014, 2020.
Gouretski, V., Cheng, L., and Boyer, T.: On the Consistency of the Bottle and CTD Profile Data, J. Atmos. Ocean. Technol., 39, 1869–1887, https://doi.org/10.1175/JTECH-D-22-0004.1, 2022.
Greenaway, S. F., Sullivan, K. D., Umfress, H., Beittel, A. B., and Wagner, K. D.: Revised depth of the Challenger Deep from submersible transects; including a general method for precise, pressure-derived depths in the ocean, Deep-Sea Res. Pt. I, 178, 103644, https://doi.org/10.1016/j.dsr.2021.103644, 2021.
van Haren, H.: Challenger Deep internal wave turbulence events, Deep-Sea Res. Pt. I, 165, 103400, https://doi.org/10.1016/j.dsr.2020.103400, 2020a.
van Haren, H.: Slow persistent mixing in the abyss, Ocean Dynam., 70, 339–352, 2020b.
van Haren, H.: Thermistor string corrections in data from very weakly stratified deep-ocean waters, Deep-Sea Res. Pt. I, 189, 103870, https://doi.org/10.1016/j.dsr.2022.103870, 2022.
van Haren, H.: How and what turbulent are deep Mariana Trench waters?, Dynam. Atmos. Oceans, 103, 101372, https://doi.org/10.1016/j.dynatmoce.2023.101372, 2023.
van Haren, H., Berndt, C., and Klaucke, I.: Ocean mixing in deep-sea trenches: New insights from the Challenger Deep, Mariana Trench, Deep-Sea Res. Pt. I, 129, 1–9, https://doi.org/10.1016/j.dsr.2017.09.003, 2017.
van Haren, H., Uchida, H., and Yanagimoto, D.: Further correcting pressure effects on SBE911 CTD-conductivity data from hadal depths, J. Oceanogr., 77, 137–144, https://doi.org/10.1007/s10872-020-00565-3, 2021.
Hautala, S. L. and Finucane, G.: Persistence of the Large-Scale Interior Deep Ocean Circulation in Global Repeat Hydrographic Sections, Geophys. Res. Lett., 49, e2021GL097264, https://doi.org/10.1029/2021GL097264, 2022.
Helland-Hansen, B.: Nogen hydrografiske metoder, Naturforsker Möte Kristiania, Forh. Skand. Naturf. Mote, 16, 357–359, 1916.
Huang, C., Xie, Q., Wang, D., Shu, Y., Xu, H., Xiao, J., Zu, T., Long, T., and Zhang, T.: Seasonal variability of water characteristics in the Challenger Deep observed by four cruises, Sci. Rep., 8, 11791, https://doi.org/10.1038/s41598-018-30176-4, 2018.
Ichino, M. C., Clark, M. R., Drazen, J. C., Jamieson, A. J., Jones, D. O. B., Martin, A. P., Rowden, A. A., Shank, T. M., Yancey, P. H., and Ruhl, H. A.: The distribution of benthic biomass in hadal trenches: A modelling approach to investigate the effect of vertical and lateral organic matter transport to the seafloor, Deep-Sea Res. Pt. I, 100, 21–33, https://doi.org/10.1016/j.dsr.2015.01.010, 2015.
IOC, SCOR and IAPSO: The international thermodynamic equation of seawater – 2010: Calculation and use of thermodynamic properties, Intergovernmental Oceanographic Commission, Manuals and Guides No. 56, UNESCO (English), 196 pp., 2010.
Jacobs, S. S., Giulivi, C. F., and Dutrieux, P.: Persistent Ross Sea Freshening From Imbalance West Antarctic Ice Shelf Melting, J. Geophys. Res.-Ocean., 127, e2021JC017808, https://doi.org/10.1029/2021JC017808, 2022.
Jamieson, A. and Linley, T.: Hydrozoans, scyphozoans, larvaceans and ctenophores observed in situ at hadal depths, J. Plank. Res., 43, 20–32, https://doi.org/10.1093/plankt/fbaa062, 2021.
Jamieson, A. J.: The Hadal Zone; Life in the Deepest Oceans, Cambridge University Press, ISBN: 9781107016743, 2015.
Jamieson, A. J.: A contemporary perspective on hadal science, Deep-Sea Res. Pt. II, 155, 4–10, https://doi.org/10.1016/j.dsr2.2018.01.005, 2018.
Jamieson, A. J. and Fujii, T.: Trench Connection, Biol. Lett., 7, 641–643, https://doi.org/10.1098/rsbl.2011.0231, 2011.
Jamieson, A. J. and Stewart, H. A.: Hadal zones of the Northwest Pacific Ocean, Prog. Oceanogr., 190, 102477, https://doi.org/10.1016/j.pocean.2020.102477, 2021.
Jamieson, A. J., Fujii, T., Mayor, D. J., Solan, M., and Priede, I. G.: Hadal trenches: the ecology of the deepest places on Earth, Trends Ecol. Evol., 25, 190–197, https://doi.org/10.1016/j.tree.2009.09.009, 2010.
Jamieson, A. J., Stewart, H. A., Rowden, A. A., and Clark, M. R.: Geomorphology and benthic habitats of the Kermadec Trench, Southwest Pacific Ocean, in: Seafloor Geomorphology as Benthic Habitat, Elsevier, 949–966, https://doi.org/10.1016/B978-0-12-814960-7.00059-2, 2020.
Jamieson, A. J., Linley, T. D., Eigler, S., and Macdonald, T.: A global assessment of fishes at lower abyssal and upper hadal depths (5000 to 8000 m), Deep-Sea Res. Pt. I, 178, 103642, https://doi.org/10.1016/j.dsr.2021.103642, 2021a.
Jamieson, A. J., Stewart, H. A., Weston, J., and Bongiovanni, C.: Hadal fauna of the South Sandwich Trench, Southern Ocean: Baited camera survey from the Five Deeps Expedition., Deep-Sea Res. Pt. II, 194, 104987, https://doi.org/10.1016/j.dsr2.2021.104987, 2021b.
Jamieson, A. J., Bond, T., and Vescovo, V.: No recovery of a large-scale anthropogenic sediment disturbance on the Pacific seafloor after 77 years at 6460 m depth, Mar. Pollut. Bull., 175, 113374–113374, https://doi.org/10.1016/j.marpolbul.2022.113374, 2022.
Jiang, H., Xu, H., Vetter, P. A., Xie, Q., Yu, J., Shang, X., and Yu, L.: Ocean Circulation in the Challenger Deep Derived From Super-Deep Underwater Glider Observation, Geophys. Res. Lett., 48, e2021GL093169, https://doi.org/10.1029/2021GL093169, 2021.
Johnson, G. C.: Deep water properties, velocities, and dynamics over ocean trenches, J. Mar. Res., 56, 329–347, https://doi.org/10.1357/002224098321822339, 1998.
Johnson, G. C.: Quantifying Antarctic Bottom Water and North Atlantic Deep Water volumes, J. Geophys. Res.-Ocean., 113, 1–13, https://doi.org/10.1029/2007JC004477, 2008.
Johnson, G. C., Purkey, S. G., Zilberman, N. V., and Roemmich, D.: Deep Argo quantifies bottom water warming rates in the Southwest Pacific Basin, Geophys. Res. Lett., 46, 2662–2669, 2019.
Joyce, T. M., Warren, B. A., and Talley, L. D.: The geothermal heating of the abyssal subarctic Pacific Ocean, Deep-Sea Res. Pt. I, 33, 1003–1015, https://doi.org/10.1016/0198-0149(86)90026-9, 1986.
Karstensen, J. and Tomczak, M.: Age determination of mixed water masses using CFC and oxygen data, J. Geophys. Res.-Ocean., 103, 18599–18609, https://doi.org/10.1029/98JC00889, 1998.
Katsumata, K. and Fukasawa, M.: Changes in meridional fluxes and water properties in the Southern Hemisphere subtropical oceans between 1992/1995 and 2003/2004, Prog. Oceanogr., 89, 61–91, https://doi.org/10.1016/j.pocean.2010.12.008, 2011.
Kawabe, M.: Deep Water Properties and Circulation in the Western North Pacific, in: Deep Ocean Circulation, Physical and Chemical Aspects, edited by: Teramoto, T., Elsevier, Amsterdam, 17–37, https://doi.org/10.1016/S0422-9894(08)71315-1, 1993.
Kawabe, M. and Fujio, S.: Pacific ocean Circulation Based on Observation, J. Oceanogr., 66, 389–403, https://doi.org/10.1007/s10872-010-0034-8, 2010.
Kawabe, M., Fujio, S., and Yanagimoto, D.: Deep-water circulation at low latitudes in the western North Pacific, Deep-Sea Res. Pt. I, 50, 631–656, https://doi.org/10.1016/S0967-0637(03)00040-2, 2003.
Kawagucci, S., Makabe, A., Kodama, T., Matsui, Y., Yoshikawa, C., Ono, E., Wakita, M., Nunoura, T., Uchida, H., and Yokokawa, T.: Hadal water biogeochemistry over the Izu-Ogasawara Trench observed with a full-depth CTD-CMS, Ocean Sci., 14, 575–588, https://doi.org/10.5194/os-14-575-2018, 2018.
Khatiwala, S., Primeau, F., and Holzer, M.: Ventilation of the deep ocean constrained with tracer observations and implications for radiocarbon estimates of ideal mean age, Earth Planet. Sc. Lett., 325/326, 116–125, https://doi.org/10.1016/j.epsl.2012.01.038, 2012.
Kobayashi, T., Sato, K., and King, B. A.: Observed features of salinity bias with negative pressure dependency for measurements by SBE 41 CP and SBE 61 CTD sensors on deep profiling floats, Prog. Oceanogr., 198, 102686, https://doi.org/10.1016/j.pocean.2021.102686, 2021.
Koltermann, K. P., Gouretski, V., and Jancke, K.: Hydrographic Atlas of the World Ocean Circulation Experiment (WOCE), Volume 3: Atlantic Ocean, edited by: Sparrow, M., Chapman, P., and Gould, J., International WOCE Project Office, Southampton, UK, ISBN 090417557X, 2011
Leffanue, H. and Tomczak, M.: Using OMP analysis to observe temporal variability in water mass distribution, J. Mar. Syst., 48, 3–14, https://doi.org/10.1016/j.jmarsys.2003.07.004, 2004.
Lele, R., Purkey, S. G., Nash, J. D., Mackinnon, J. A., Thurnherr, A. M., Whalen, C. B., Mecking, S., Voet, G., and Talley, L. D.: Abyssal Heat Budget in the Southwest Pacific Basin, J. Phys. Oceanogr., 51, 3317–3333, https://doi.org/10.1175/JPO-D-21-0045.1, 2021.
Liu, M. and Tanhua, T.: Water masses in the Atlantic Ocean: characteristics and distributions, Ocean Sci., 17, 463–486, https://doi.org/10.5194/os-17-463-2021, 2021.
Liu, X.: Flow Pathways of Abyssal Water in the Yap Trench and Adjacent Channels and Basins, Front. Mar. Sci., 9, 16, https://doi.org/10.3389/fmars.2022.910941, 2022.
Liu, X., Liu, Y., Cao, W., and Sun, C.: Water characteristics of abyssal and hadal zones in the southern Yap Trench observed with the submersible Jiaolong, J. Oceanol. Limnol., 38, 593–605, https://doi.org/10.1007/s00343-019-8368-6, 2020.
Ma, K., Chen, Z.-H., Li, Z.-R., Song, Z.-J., Yuan, Z.-W., Wu, B., Jiao, Q., and Wang, Z.-M.: Study on 10 000-m Hydrological Observations in the Mariana Trench, Oceanol. Limnol. Sin., 52, 1075–1087, https://doi.org/10.11693/hyhz20201100320, 2021.
Macdonald, A., Mecking, S., Robbins, P., Toole, J., Johnson, G., Talley, L., Cook, M., and Wijffels, S. E.: The WOCE-era 3-D Pacific Ocean circulation and heat budget, Prog. Oceanogr., 82, 281–325, https://doi.org/10.1016/J.POCEAN.2009.08.002, 2009.
Mantyla, A. W. and Reid, J. L.: Measurements of water characteristics at depths greater than 10 km in the Marianas Trench, Deep-Sea Res., 25, 169–173, https://doi.org/10.1016/0146-6291(78)90004-8, 1978.
Mantyla, A. W. and Reid, J. L.: On the origins of deep and bottom waters of the Indian Ocean, J. Geophys. Res.-Ocean., 100, 2417–2439, 1995.
Mitsuzawa, K. and Holloway, G.: Characteristics of deep currents along trenches in the northwest Pacific, J. Geophys. Res.-Ocean., 103, 13085–13092, 1998.
Nagano, A., Ichikawa, K., Ichikawa, H., Yoshikawa, Y., and Murakami, K.: Large ageostrophic currents in the abyssal layer southeast of Kyushu, Japan, by direct measurement of LADCP, J. Oceanogr., 69, 259–268, https://doi.org/10.1007/s10872-013-0170-z, 2013.
Naveira Garabato, A. C., McDonagh, E. L., Stevens, D. P., Heywood, K. J., and Sanders, R. J.: On the export of Antarctic Bottom Water from the Weddell Sea, Deep-Sea Res. Pt. II, 49, 4715–4742, https://doi.org/10.1016/S0967-0645(02)00156-X, 2002.
Naveira Garabato, A. C., Williams, A. P., and Bacon, S.: The three-dimensional overturning circulation of the Southern Ocean during the WOCE era, Prog. Oceanogr., 120, 41–78, https://doi.org/10.1016/j.pocean.2013.07.018, 2014.
Naveira Garabato, A. C., MacGilchrist, G. A., Brown, P. J., Evans, D. G., Meijers, A. J., and Zika, J. D.: High-latitude ocean ventilation and its role in Earth's climate transitions, Philos. T. R. Soc., 375, 20160324, https://doi.org/10.1098/rsta.2016.0324, 2017.
Nunoura, T., Hirai, M., Yoshida-Takashima, Y., Nishizawa, M., Kawagucci, S., Yokokawa, T., Miyazaki, J., Koide, O., Makita, H., Takaki, Y., Sunamura, M., and Takai, K.: Distribution and niche separation of planktonic microbial communities in the water columns from the surface to the hadal waters of the Japan Trench under the Eutrophic Ocean, Front. Microbiol., 7, 1–12, https://doi.org/10.3389/fmicb.2016.01261, 2016.
Oguri, K., Kawamura, K., Sakaguchi, A., Toyofuku, T., Kasaya, T., Murayama, M., Fujikura, K., Glud, R. N., and Kitazato, H.: Hadal disturbance in the Japan Trench induced by the 2011 Tohoku-Oki earthquake, Sci. Rep., 3, 1915, https://doi.org/10.1038/srep01915, 2013.
Oguri, K., Masqué, P., Zabel, M., Stewart, H. A., MacKinnon, G., Rowden, A. A., Berg, P., Wenzhöfer, F., and Glud, R. N.: Sediment Accumulation and Carbon Burial in Four Hadal Trench Systems, J. Geophys. Res.-Biogeo., 127, e2022JG006814, https://doi.org/10.1029/2022JG006814, 2022.
Orsi, A. H. and Whitworth, T.: Hydrographic Atlas of the World Ocean Circulation Experiment (WOCE), Volume 1: Southern Ocean, edited by: Sparrow, M., Chapman, P., and Gould, J., International WOCE Project Office, Southampton, U.K., ISBN 0-904175-49-9, 2004.
Orsi, A. H., Nowlin, W. D., and Whitworth, T.: On the circulation and stratification of the Weddell Gyre, Deep-Sea Res. Pt. I, 40, 169–203, https://doi.org/10.1016/0967-0637(93)90060-G, 1993.
Orsi, A. H., Johnson, G. C., and Bullister, J. L.: Circulation, mixing, and production of Antarctic Bottom Water, Prog. Oceanogr., 43, 55–109, https://doi.org/10.1016/S0079-6611(99)00004-X, 1999.
Pond, S. and Pickard, G. L.: Introductory dynamical oceanography, Gulf Professional Publishing, Elsevier, ISBN: 978-0-08-057054-9, https://doi.org/10.1016/C2009-0-24288-7, 1983.
Purkey, S. G., Johnson, G. C., Talley, L. D., Sloyan, B. M., Wijffels, S. E., Smethie, W., Mecking, S., and Katsumata, K.: Unabated Bottom Water Warming and Freshening in the South Pacific Ocean, J. Geophys. Res.-Ocean., 124, 1778–1794, https://doi.org/10.1029/2018JC014775, 2019.
Rahmstorf, S. and England, M. H.: Influence of Southern Hemisphere Winds on North Atlantic Deep Water Flow, J. Phys. Oceanogr., 27, 2040–2054, https://doi.org/10.1175/1520-0485(1997)027<2040:IOSHWO>2.0.CO;2, 1997.
Reid, J. L.: On the total geostrophic circulation of the pacific ocean: Flow patterns, tracers, and transports, Prog. Oceanogr., 39, 263–352, https://doi.org/10.1016/S0079-6611(97)00012-8, 1997.
Rintoul, S. R.: On the Origin and Influence of Adélie Land Bottom Water, in: Ocean, Ice, and Atmosphere: Interactions at the Antarctic Continental Margin, American Geophysical Union (AGU), 151–171, https://doi.org/10.1029/AR075p0151, 1985.
Robinson, A. and Stommel, H.: The oceanic thermocline and the associated thermohaline circulation 1, Tellus A, 11, 295–308, 1959.
Roemmich, D., Hautala, S., and Rudnick, D.: Northward abyssal transport through the Samoan passage and adjacent regions, 101, 14039–14055, https://doi.org/10.1029/96JC00797, 1996.
Schmidt, C., Morrison, A. K., and England, M. H.: Wind– and sea-ice–driven interannual variability of Antarctic Bottom Water formation, J. Geophys. Res.-Ocean., 128, e2023JC019774, https://doi.org/10.1029/2023JC019774, 2023.
Schmitz, W.: On the interbasin-scale thermohaline circulation, Rev. Geophys., 33, 151–173, 1995.
Sea-Bird Scientific: SBE Data Processing, SBE Data Processing, Sea-bird Scientific, 2017, https://www.seabird.com/software (last access: 5 November 2022), 2018.
Sea-Bird Scientific: SBE 49 FastCAT CTD Sensor User Manual, Bellevue, Washington, USA, https://www.seabird.com/asset-get.download.jsa?id=54627862506 (last access: 10 January 2023), 2020.
Siedler, G., Holfort, J., Zenk, W., Müller, T. J., and Csernok, T.: Deep-water flow in the Mariana and Caroline Basins, J. Phys. Oceanogr., 34, 566–581, https://doi.org/10.1175/2511.1, 2004.
Singh, S. P., Singh, S. K., Goswami, V., Bhushan, R., and Rai, V. K.: Spatial distribution of dissolved neodymium and εNd in the Bay of Bengal: Role of particulate matter and mixing of water masses, Geochim. Cosmochim. Ac., 94, 38–56, https://doi.org/10.1016/j.gca.2012.07.017, 2012.
Sloyan, B. M.: Antarctic bottom and lower circumpolar deep water circulation in the eastern Indian Ocean, J. Geophys. Res.-Ocean., 111, C02006, https://doi.org/10.1029/2005JC003011, 2006.
Sloyan, B. M. and Rintoul, S. R.: The Southern Ocean Limb of the Global Deep Overturning Circulation, J. Phys. Oceanogr., 31, 143–173, https://doi.org/10.1175/1520-0485(2001)031<0143:TSOLOT>2.0.CO;2, 2001.
Sloyan, B. M., Wanninkhof, R., Kramp, M., Johnson, G. C., Talley, L. D., Tanhua, T., McDonagh, E., Cusack, C., O'Rourke, E., McGovern, E., Katsumata, K., Diggs, S., Hummon, J., Ishii, M., Azetsu-Scott, K., Boss, E., Ansorge, I., Perez, F. F., Mercier, H., Williams, M. J. M., Anderson, L., Lee, J. H., Murata, A., Kouketsu, S., Jeansson, E., Hoppema, M., and Campos, E.: The Global Ocean Ship-Based Hydrographic Investigations Program (GO-SHIP): A Platform for Integrated Multidisciplinary Ocean Science, Front. Mar. Sci., 6, 445, https://doi.org/10.3389/fmars.2019.00445, 2019.
Solodoch, A., Stewart, A. L., Hogg, A. McC., Morrison, A. K., Kiss, A. E., Thompson, A. F., Purkey, S. G., and Cimoli, L.: How Does Antarctic Bottom Water Cross the Southern Ocean?, Geophys. Res. Lett., 49, e2021GL097211, https://doi.org/10.1029/2021GL097211, 2022.
Stewart, H. A. and Jamieson, A. J.: Habitat heterogeneity of hadal trenches: Considerations and implications for future studies, Prog. Oceanogr., 161, 47–65, https://doi.org/10.1016/j.pocean.2018.01.007, 2018.
Stommel, H. and Arons, A. B.: On the abyssal circulation of the world ocean-I. Stationary planetary flow patterns on a sphere, Deep-Sea Res., 5, 80–82, 1959.
Swan, J. A., Jamieson, A. J., Linley, T. D., and Yancey, P. H.: Worldwide distribution and depth limits of decapod crustaceans (Penaeoidea, Oplophoroidea) across the abyssal-hadal transition zone of eleven subduction trenches and five additional deep-sea features, J. Crustac. Biol., 41, ruaa102, https://doi.org/10.1093/jcbiol/ruaa102, 2021.
Taft, B. A., Hayes, S. P., Fruederich, G. E., and Codispoti, A.: Flow of Abyssal Water into the Samoa Passage, Deep-Sea Res., 38, 103–128, 1991.
Taira, K.: Super-deep CTD Measurements in the Izu-Ogasawara Trench and a Comparison of Geostrophic Shears with Direct Measurements, J. Oceanogr., 62, 753–758, 2006.
Taira, K., Kitagawa, S., Yamashiro, T., and Yanagimoto, D.: Deep and Bottom Currents in the Challenger Deep, Mariana Trench, Measured with Super-Deep Current Meters, J. Oceanogr., 60, 919–926, 2004.
Taira, K., Yanagimoto, D., and Kitagawa, S.: Deep CTD Casts in the Challenger Deep, Mariana Trench, J. Oceanogr., 61, 447–454, 2005.
Talley, L. D.: Hydrographic Atlas of the World Ocean Circulation Experiment (WOCE), Vol. 2, Pacific Ocean, WOCE International Project Office Southampton, edited by: Sparrow, M., Chapman, P., and Gould, J., Southampton, UK, ISBN 0-904175-54-5, 2007.
Talley, L. D.: Descriptive physical oceangraphy: an introduction, Academic Press, ISBN: 978-0-7506-4552-2, 2011.
Talley, L. D.: Closure of the global overturning circulation through the Indian, Pacific, and southern oceans, Oceanography, 26, 80–97, https://doi.org/10.5670/oceanog.2013.07, 2013a.
Talley, L. D.: Hydrographic Atlas of the World Ocean Circulation Experiment (WOCE), Vol. 4, Indian Ocean, eScholarship, University of California, edited by: Sparrow, M., Chapman, P., and Gould, J., International WOCE Project Office, Southampton, UK, ISBN 0904175588, 2013b.
Tamsitt, V., Abernathey, R. P., Mazloff, M. R., Wang, J., and Talley, L. D.: Transformation of Deep Water Masses Along Lagrangian Upwelling Pathways in the Southern Ocean, J. Geophys. Res.-Ocean., 123, 1994–2017, https://doi.org/10.1002/2017JC013409, 2018.
Thomas, G., Purkey, S. G., Roemmich, D., Foppert, A., and Rintoul, S. R.: Spatial Variability of Antarctic Bottom Water in the Australian Antarctic Basin From 2018–2020 Captured by Deep Argo, Geophys. Res. Lett., 47, e2020GL089467, https://doi.org/10.1029/2020GL089467, 2020.
Tian, Z., Zhou, C., Xiao, X., Wang, T., Qu, T., Yang, Q., Zhao, W., and Tian, J.: Water-Mass Properties and Circulation in the Deep and Abyssal Philippine Sea, J. Geophys. Res.-Ocean., 126, e2020JC016994, https://doi.org/10.1029/2020JC016994, 2021.
Tomczak, M.: Some historical, theoretical and applied aspects of quantitative water mass analysis, J. Mar. Res., 57, 275–303, https://doi.org/10.1357/002224099321618227, 1999.
Tomczak, M. and Large, D. G.: Optimum multiparameter analysis of mixing in the thermocline of the eastern Indian Ocean, J. Geophys. Res.-Ocean., 94, 16141–16149, 1989.
Turnewitsch, R., Falahat, S., Stehlikova, J., Oguri, K., Glud, R. N., Middelboe, M., Kitazato, H., Wenzhöfer, F., Ando, K., Fujio, S., and Yanagimoto, D.: Recent sediment dynamics in hadal trenches: Evidence for the influence of higher-frequency (tidal, near-inertial) fluid dynamics, Deep-Sea Res. Pt. I, 90, 125–138, https://doi.org/10.1016/j.dsr.2014.05.005, 2014.
Wang, F., Zhang, L., Hu, D., Wang, Q., Zhai, F., and Hu, S.: The vertical structure and variability of the western boundary currents east of the Philippines: case study from in situ observations from December 2010 to August 2014, J. Oceanogr., 73, 743–758, https://doi.org/10.1007/s10872-017-0429-x, 2017.
Wang, W., Köhl, A., and Stammer, D.: The deep meridional overturning circulation in the Indian Ocean inferred from the GECCO synthesis, Dynam. Atmos. Oceans, 58, 44–61, https://doi.org/10.1016/j.dynatmoce.2012.08.001, 2012.
Warren, B. A.: Deep circulation of the world ocean, in: Evolution of physical oceanography, edited by: Warren, B. A. and Wunsch, C., Massachusetts Institude of Technology, Boston, 6–40, ISBN: 978-0262231046, 1981.
Warren, B. A. and Brechner Owens, W.: Some preliminary results concerning deep Northern-Boundary currents in the North Pacific, Prog. Oceanogr., 14, 537–551, https://doi.org/10.1016/0079-6611(85)90027-8, 1985.
Watling, L., Guinotte, J., Clark, M. R., and Smith, C. R.: A proposed biogeography of the deep ocean floor, Prog. Oceanogr., 111, 91–112, https://doi.org/10.1016/j.pocean.2012.11.003, 2013.
Webb, T. J., Vanden Berghe, E., and O'Dor, R.: Biodiversity's big wet secret: The global distribution of marine biological records reveals chronic under-exploration of the deep pelagic ocean, PLoS ONE, 5, e10223, https://doi.org/10.1371/journal.pone.0010223, 2010.
Weston, J. J. and Jamieson, A. J.: The Multi-Ocean Distribution of the Hadal Amphipod, Hirondellea dubia (Crustacea, Amphipoda), Front. Mar. Sci., 9, 824640, https://doi.org/10.3389/fmars.2022.824640, 2022.
Wijffels, S. E., Hall, M. M., Joyce, T., Torres, D. J., Hacker, P., and Firing, E.: Multiple deep gyres of the western North Pacific: A WOCE section along 149∘ E, J. Geophys. Res.-Ocean., 103, 12985–13009, https://doi.org/10.1029/98JC01016, 1998.
Wijffels, S. E., Sprintall, J., Fieux, M., and Bray, N.: The JADE and WOCE I10/IR6 throughflow sections in the southeast Indian Ocean, Part 1: Water mass distribution and variability, Deep-Sea Res. Pt. II, 49, 1341–1362, 2002.
Wust, G.: Thermometric Measurement of Depth, Int. Hydrogr. Rev., 10, 28–49, 1933.
Zhai, F. and Gu, Y.: Abyssal Circulation in the Philippine Sea, J. Ocean Univ. China, 19, 249–262, https://doi.org/10.1007/s11802-020-4241-7, 2020.
Zhang, L. and Delworth, T.: Impact of the Antarctic bottom water formation on the Weddell Gyre and its northward propagation characteristics in GFDL CM2.1 model, J. Geophys. Res.-Ocean., 121, 5825–5846, https://doi.org/10.1002/2016JC011790, 2016.
Zhou, C., Xu, H., Xiao, X., Zhao, W., Yang, J., Yang, Q., Jiang, H., Xie, Q., Long, T., Wang, T., Huang, X., Zhang, Z., Guan, S., and Tian, J.: Intense Abyssal Flow Through the Yap-Mariana Junction in the Western North Pacific, Geophys. Res. Lett., 49, e2021GL096530, https://doi.org/10.1029/2021GL096530, 2022.
Zhou, S., Meijers, A. J. S., Meredith, M. P., Abrahamsen, E. P., Holland, P. R., Silvano, A., Sallée, J.-B., and Østerhus, S.: Slowdown of Antarctic Bottom Water export driven by climatic wind and sea-ice changes, Nat. Clim. Change, 1–9, 701–709, https://doi.org/10.1038/s41558-023-01695-4, 2023.
Zilberman, N., Roemmich, D., and Gilson, J.: Deep-ocean circulation in the Southwest Pacific Ocean interior: Estimates of the mean flow and variability using Deep Argo data, Geophys. Res. Lett., 47, e2020GL088342, https://doi.org/10.1029/2020GL088342, 2020.