the Creative Commons Attribution 4.0 License.
the Creative Commons Attribution 4.0 License.
 | 30 Mar 2023
Surface circulation in the Gulf of Thailand from remotely sensed observations: seasonal and interannual timescales
Arachaporn Anutaliya
The Gulf of Thailand (GoT), a shallow semi-enclosed basin located in the western equatorial Pacific, undergoes much wind variabilities on both seasonal and interannual timescales that produce complex surface circulation. The local Ekman pumping modifies sea level in the northern GoT, while remote wind forcing influences sea level variability at the GoT western boundary, potentially through the coastal trapped Kelvin waves. The importance of the Ekman current on ageostrophic current is also important; the stronger influence of the Ekman current is found toward the southern part of the GoT. The GoT circulation reverses its direction seasonally following the monsoon wind reversal which is well-captured by the most dominant complex empirical orthogonal function explaining 28 % of the total circulation variance. During the monsoon transition, a strong meridional current along the western boundary that connects to the flow at the GoT southeastern entrance is observed. This implies high exchange between the GoT and the South China Sea and thus modification of the GoT water. On the interannual timescale, the GoT circulation is directly impacted by both the El Niño–Southern Oscillation (ENSO) and the Indian Ocean Dipole (IOD). Interestingly, the two climate modes have different spatial influences on the GoT circulation. The IOD dominates the interannual current along the GoT western boundary and the southern boundary of the observing domain (8∘ N), while the ENSO correlates with that in the interior. The results highlight the complex circulation pattern as being contributed by different dynamics over each region of the GoT.
- Article
(12279 KB) - Full-text XML
- BibTeX
- EndNote


The Gulf of Thailand (GoT), located at 8–14∘ N, 99–105∘ E (Fig. 1), is a shallow semi-enclosed basin with an average depth of 40 m that is largely influenced by winds on both seasonal and interannual timescales. On a seasonal timescale, the Asian monsoon winds prevail producing the wet season over southeast Asia from approximately May to August (southwest monsoon) and the dry season from November to February (northeast monsoon). Although the GoT circulation is also heavily dependent on inflows from the South China Sea (SCS), e.g., along the eastern coast of Malaysia located to the south of ∼ 6.7∘ N and around the southern coast of Vietnam, these currents are mainly driven by the monsoon winds (e.g., Wyrtki, 1961; Akhir, 2012). The extreme seasonal wind and precipitation conditions influence the circulation pattern, physical seawater properties (e.g., salinity, density, hence the thermohaline circulation; Yanagi and Takao, 1998; Yanagi et al., 2001; Buranapratheprat et al., 2002, 2008) and nutrient loadings from rivers (e.g., nitrate, phosphate and ammonia; Suvapepun, 1991; Sriwoon et al., 2008). Also, the location of the GoT, which is to the west of the SCS in the equatorial western Pacific Ocean, provides a unique opportunity to observe the influence of both large-scale climate modes in the Pacific Ocean (El Niño–Southern Oscillation: ENSO) and the Indian Ocean (Indian Ocean Dipole: IOD; Saji et al., 1999) on the interannual circulation.
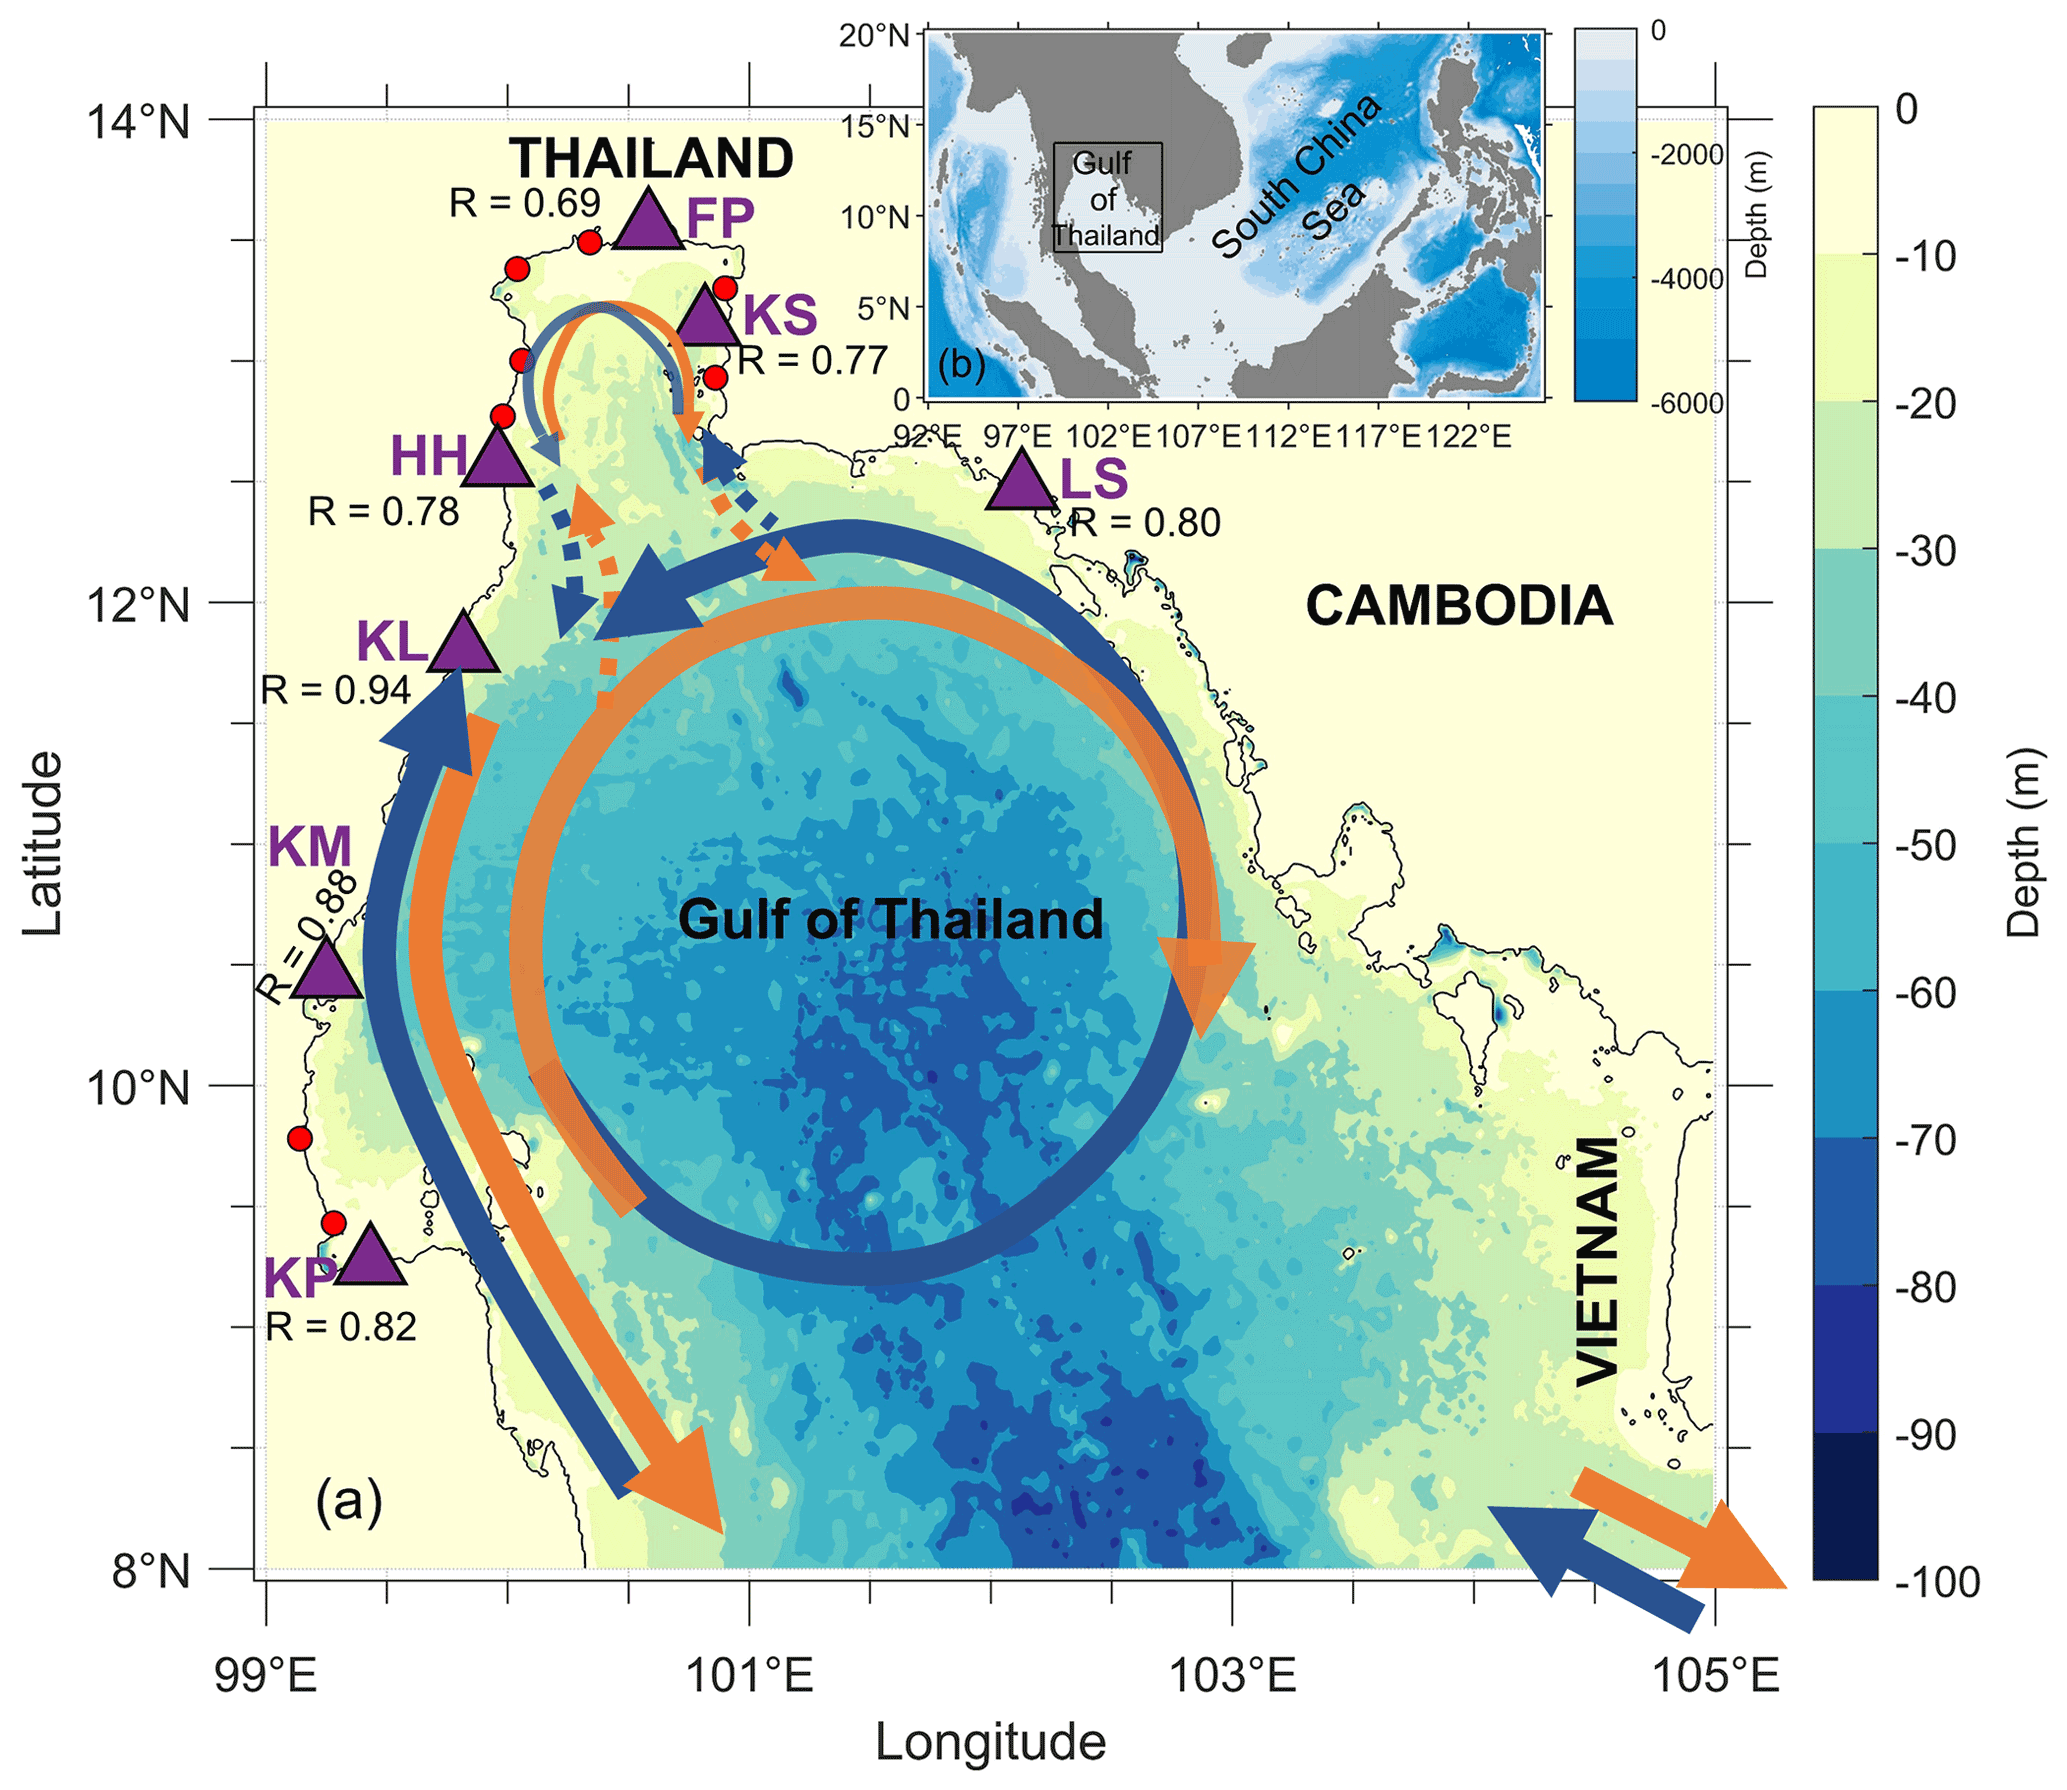
Figure 1Map of the Gulf of Thailand (GoT). (a) Schematic of the surface current to the south of ∼ 12.5∘ N suggested by this study (thick line) and that to the north of ∼ 12.5∘ N derived from previous studies (e.g., Yanagi et al., 2001; Buranapratheprat et al., 2006, 2008; Saramul and Ezer, 2014, thin line) during the southwest monsoon (orange) and the northeast monsoon (blue). Dashed line denotes suggested circulation between the uGoT and the rest of the GoT. Triangles indicate the locations of tide gauges at KP (Ko Prap), KM (Ko Mattaphon), KL (Ko Lak), HH (Hua Hin), FP (Fort Phrachula Chomklao), KS (Ko Sichang) and LS (Laem Sing) with values of correlation coefficients between measurements from the tide gauges and satellite altimetry. (b) Shows the location of the GoT. Color contours in (a) and (b) represent bathymetry and the black contour in (a) represents the zero-depth level.
Previous observational and numerical studies show that circulation in the Gulf of Thailand varies seasonally (e.g., Yanagi et al., 2001; Buranapratheprat et al., 2008; Saramul, 2017; Buranapratheprat et al., 2002; Aschariyaphotha et al., 2008; Saramul and Ezer, 2014). A series of six hydrographic cruises over October 2003–July 2005 in the upper GoT (uGoT; north of 12.5∘ N) suggests an overall cyclonic circulation during the northeast monsoon (Buranapratheprat et al., 2008) in agreement with numerical studies that account for tidal forcing, bottom friction and river runoffs (Buranapratheprat et al., 2002; Saramul and Ezer, 2014). The numerical studies also suggest the dominance of contrasting anticyclonic circulation in the uGoT during the southwest monsoon. Still, both numerical simulations are forced by spatially uniform reanalysis wind products which likely do not represent the actual wind field over the region (Yanagi and Takao, 1998). A study based on numerical simulation forced by spatially varying wind (Buranapratheprat et al., 2006) emphasizes the importance of both zonal and meridional wind gradients on the circulation over the uGoT. For example, the development of an anticyclonic circulation to the north of 13∘ N during the southwest monsoon, observed by Buranapratheprat et al. (2002) and Saramul and Ezer (2014), is highly dependent on the intensity of wind in the south or east of the uGoT. Results from hydrographic surveys in May 2004 and July 2005 do not show a clear dominant circulation pattern during this period (Buranapratheprat et al., 2008). Fine-spatial-resolution coastal radar of the monthly mean surface current during both the southwest (June 2015) and northeast monsoon (February 2015) reveals a complex circulation pattern in the uGoT, although the circulations during the two seasons are not distinctly different (Saramul, 2017). The circulation based on the coastal radar suggests an overall cyclonic circulation in the northern part of the uGoT (north of 12.8–12.9∘ N) and an anticyclonic circulation in the southern part (south of 12.8–12.9∘ N) during both monsoon seasons.
South of 12.5∘ N, various observational and numerical studies were conducted (Wyrtki, 1961; Yanagi and Takao, 1998; Aschariyaphotha et al., 2008; Sojisuporn et al., 2010); however, the findings are not quite consistent due to the different studied periods and spatial resolutions being considered. During the southwest monsoon, altimetry-based observation over the 1995–2001 period (Sojisuporn et al., 2010) shows that the geostrophic circulation intensifies at the rim of the GoT with a strong southward current within 1∘ of the GoT western boundary and westward current to the south of the uGoT yielding a cyclonic circulation. At the southeastern entrance, satellite altimetry indicates an outflow into the SCS (Sojisuporn et al., 2010). Numerical simulation assimilating measurements from the Naga expedition in 1959–1960 (Yanagi and Takao, 1998) shows similar results, except for the presence of strong northwestward flow in the mid-basin which yields a cyclonic circulation to its west and an anticyclonic circulation to its east. In contrast, findings from Princeton Ocean Model (Aschariyaphotha et al., 2008) indicate a strong southeastward flow in the mid-basin and the dominance of an anticyclonic circulation over the GoT with an outflow at the southeastern entrance during the southwest monsoon. Note that the study by Aschariyaphotha et al. (2008) allows inflow and outflow from the lateral boundaries, while that by Yanagi and Takao (1998) does not, which could contribute to the discrepancy. Still, the circulation pattern found by Aschariyaphotha et al. (2008) resembles the GoT surface velocity surveyed during the Naga expedition (Wyrtki, 1961).
During the northeast monsoon, the altimetric observations and numerical simulations suggest the dominance of an anticyclonic circulation at the rim of the GoT and an inflow at the southeastern entrance (Yanagi and Takao, 1998; Aschariyaphotha et al., 2008; Sojisuporn et al., 2010). Circulation in the GoT interior is quite complex and findings from the studies do not necessarily agree. The Naga expedition, however, shows that cyclonic circulation prevails during the northeast monsoon (Wyrtki, 1961). Still, an inflow is present at the southeastern entrance in agreement with the observational and numerical studies. The inflow is found to reach the bottom at the GoT western boundary during the spring monsoon transition as a hydrographic survey shows the presence of cold and saline water originating in the SCS in the region (Yanagi et al., 2001).
Although previous studies have recognized the role of monsoon winds in the seasonal variability of the GoT circulation (e.g., Yanagi and Takao, 1998; Aschariyaphotha et al., 2008), the associated dynamics are not well understood. Therefore, this study aims to examine the seasonal variability of surface circulation in the GoT and the associated dynamics by investigating the influence of geostrophic current and wind-driven Ekman current using remotely sensed observations. The mechanisms that set up the geostrophic flow will also be discussed. In addition, interannual variability of the GoT circulation will be examined to understand the effect of ENSO and the IOD on the circulation pattern.
To examine the circulation pattern in the GoT, the gridded Ocean Surface Currents Analyses Real-time product (OSCAR; Bonjean and Lagerloef, 2002) between 8∘ and 14∘ N, 99 and 105∘ E is considered (Fig. 1). The product is calculated based on satellite sea surface height, wind and water temperature from both remotely sensed and in situ measurements, e.g., drifters and moored and shipboard measurements. The resulting current is an average in the upper 30 m of the water column. Therefore, the OSCAR current represents the total current (sum of the geostrophic and ageostrophic currents) over the GoT. The gridded OSCAR product has a resolution of ∘ (36–37 km in the GoT) with a temporal resolution of 5 d available from 1992 to 2020. To validate the OSCAR velocity over the GoT, the monthly average velocity maps in February 2015 and June 2015 are compared to tide-removed surface currents from the high-frequency radar system shown in Saramul (2017). Generally, OSCAR velocity exhibits a similar circulation pattern to the coastal-radar velocity, particularly in February 2015. Still, a much more complex circulation is observed in the coastal-radar velocity due to its much finer spatial resolution. The difference between OSCAR velocity and high-frequency coastal-radar velocity is the largest in the uGoT; as the region is quite small and shallow (Fig. 1), the spatial resolution provided by the OSCAR products might not be sufficient to resolve the circulation there.
The gridded all-satellite merged absolute dynamic topography (ADT; η) product provided by EU Copernicus Marine Service Information is used to calculate geostrophic current (ug denotes zonal velocity and vg denotes meridional velocity) in the GoT and the associated mechanisms:
and
where g represents the gravitational acceleration, f is the Coriolis parameter, y is distance in the meridional direction and x is distance in the zonal direction. The product is interpolated daily on a ∘ grid (27–28 km in the GoT) available over the 1993–2020 period (Ducet et al., 2000). As the satellite altimetry used here is in the coastal region (Fig. 1), sea surface level data from seven tide gauge stations in the GoT (Fort Phrachula Chomklao (FP), Ko Lak (KL), Ko Mattaphon (KM), Hua Hin (HH), Ko Prap (KP), Laem Sing (LS) and Ko Sichang (KS) (Holgate et al., 2013; PSMSL, 2019)) are used to validate the satellite-derived ADT. The comparisons show a strong correlation between the fluctuation of satellite ADT and the tide gauge sea level over the 2014–2019 period with correlation coefficients ranging from 0.69 to 0.94 (Fig. 1). In addition, the ADT shows a distinct seasonal cycle consistent with water level measurements from tide gauges (Trisirisatayawong et al., 2011). The weaker correlation found at FP is largely due to land subsidence caused by the high volume of groundwater extraction; the land subsidence introduces a rise in the tide gauge sea level (Adebisi et al., 2021; Jaroenongard et al., 2021). Still, the lower correlation could also be contributed by the tide gauge's location, which is ∼ 20 km inland from the available gridded satellite ADT, or the error that the ADT might have at that location.
To examine the effect of a wind-driven Ekman current on the GoT circulation, the gridded surface vector winds from Version 3 Cross-Calibrated Multi-Platform (CCMPv3) obtained from Remote Sensing Systems are used. The CCMPv3 wind product, available from July 1987 to December 2019, has a resolution of ∘ with a temporal resolution of 6 h (Mears et al., 2022). The Ekman current (ue and ve) at each depth (z) is calculated following Alberty et al. (2019):
where τ is wind stress and d is thickness of the surface Ekman layer defined as , with A being a function of wind speed (; ). In addition, wind stress curl () is also calculated.
The weekly sea surface temperature averaged over the Niño 3.4 box (hereafter referred to as Niño3.4) provided by the National Oceanic and Atmospheric Administration (NOAA) is used to indicate ENSO conditions (Trenberth, 1997). To assess the IOD conditions, the Dipole Mode Index (DMI) is used. The weekly DMI calculated from sea surface temperature in the tropical Indian Ocean is calculated and provided by the NOAA/Earth System Research Laboratory (Saji et al., 1999; Black et al., 2003).
3.1 Complex empirical orthogonal function
To determine the dominant pattern and the associated temporal variation in the surface current in the GoT, the complex empirical orthogonal function (CEOF) is utilized. The CEOF is similar to the empirical orthogonal function (EOF) which is suitable for the analysis of a dataset with both spatial and temporal variation (e.g., Weare et al., 1976; North et al., 1982). The EOF technique decomposes the data matrix that has its mean removed (X) into orthogonal EOF modes (U) that display spatial patterns. Each mode corresponds to a time series known as the principal component (PC) that demonstrates the temporal variation in that EOF mode; the PC identifies when and how intense each EOF pattern occurs. The collection of the PCs forms an orthogonal matrix (V). The matrix decomposition is done as follows:
where the superscript “T” denotes the transposition of a matrix. S contains the magnitude of a linear transformation; it designates the intensity of each EOF mode. The fractions of variance explained by EOF modes are different, and variance of the ith mode is calculated as ; the first EOF mode shows the most dominant pattern and the subsequent modes account for a smaller fraction of the variance by the mathematical construction. When the technique is applied to vector quantities, e.g., velocity, the CEOF is often adopted, where each vector is transformed into a complex number (e.g., Kundu and Allen, 1976; Klinck, 1985). In this study, the velocity vector with the time mean removed (u) is decomposed as
where u is the zonal velocity, v is the meridional velocity and i is . Applying the same EOF technique (Eq. 5) to the complex number, the resultant PC is complex where its magnitude represents the temporal fluctuation of the corresponding CEOF. The phase, calculated as the arctan of the imaginary part divided by the real part, represents the direction that the CEOF mode has to rotate (positive clockwise).
3.2 Complex correlation
To understand the relationship between two vector time series, e.g., the surface velocity at two different locations, a complex correlation analysis (Kundu, 1976) can be applied to time series of complex numbers (u(t)) constructed as shown in Eq. (6). The complex correlation coefficient (R) is computed as
where * denotes complex conjugate. The resultant R is a complex number where its magnitude describes how the magnitude of the two time series covary. The phase of R, computed as the arctan of the imaginary component divided by the real component, describes the angle between the two vector time series in order to achieve the highest correlation.
The mean and variance of OSCAR surface velocity are calculated over the 2014–2019 period (Fig. 2). Strong mean flow is observed near the northern and western boundaries of the GoT and at the southeastern entrance. The mean current is northward along the western boundary to the south of 12∘ N and southwestward at the southeastern entrance. The mean circulation in the GoT interior consists of a few weak eddies. The mean circulation pattern from OSCAR products generally agrees with the satellite-derived geostrophic current (color contour in Fig. 2a), except in the uGoT where OSCAR products are present at only six locations. Also, as the uGoT is shallow and enclosed by land on the western, northern and eastern sides (Fig. 1), OSCAR products over the region could contain a substantial error. Thus, discussion regarding OSCAR velocity over the uGoT will be omitted. Large variance of the surface circulation is found along the western boundary of the GoT, approximately between 9.5 and 11.5∘ N, with most of the variance associated with meridional velocity (Fig. 2b). Variance of the ADT is also high along the western boundary indicating the influence of geostrophic flow (Eq. 1 and 2), particularly between 9 and 10.5∘ N. At the southeastern entrance, high variance is observed in both OSCAR velocity and ADT with the highest-velocity variance observed in the southeastern part of the observing domain and the highest ADT variance observed a bit farther north, at ∼ 9∘ N.
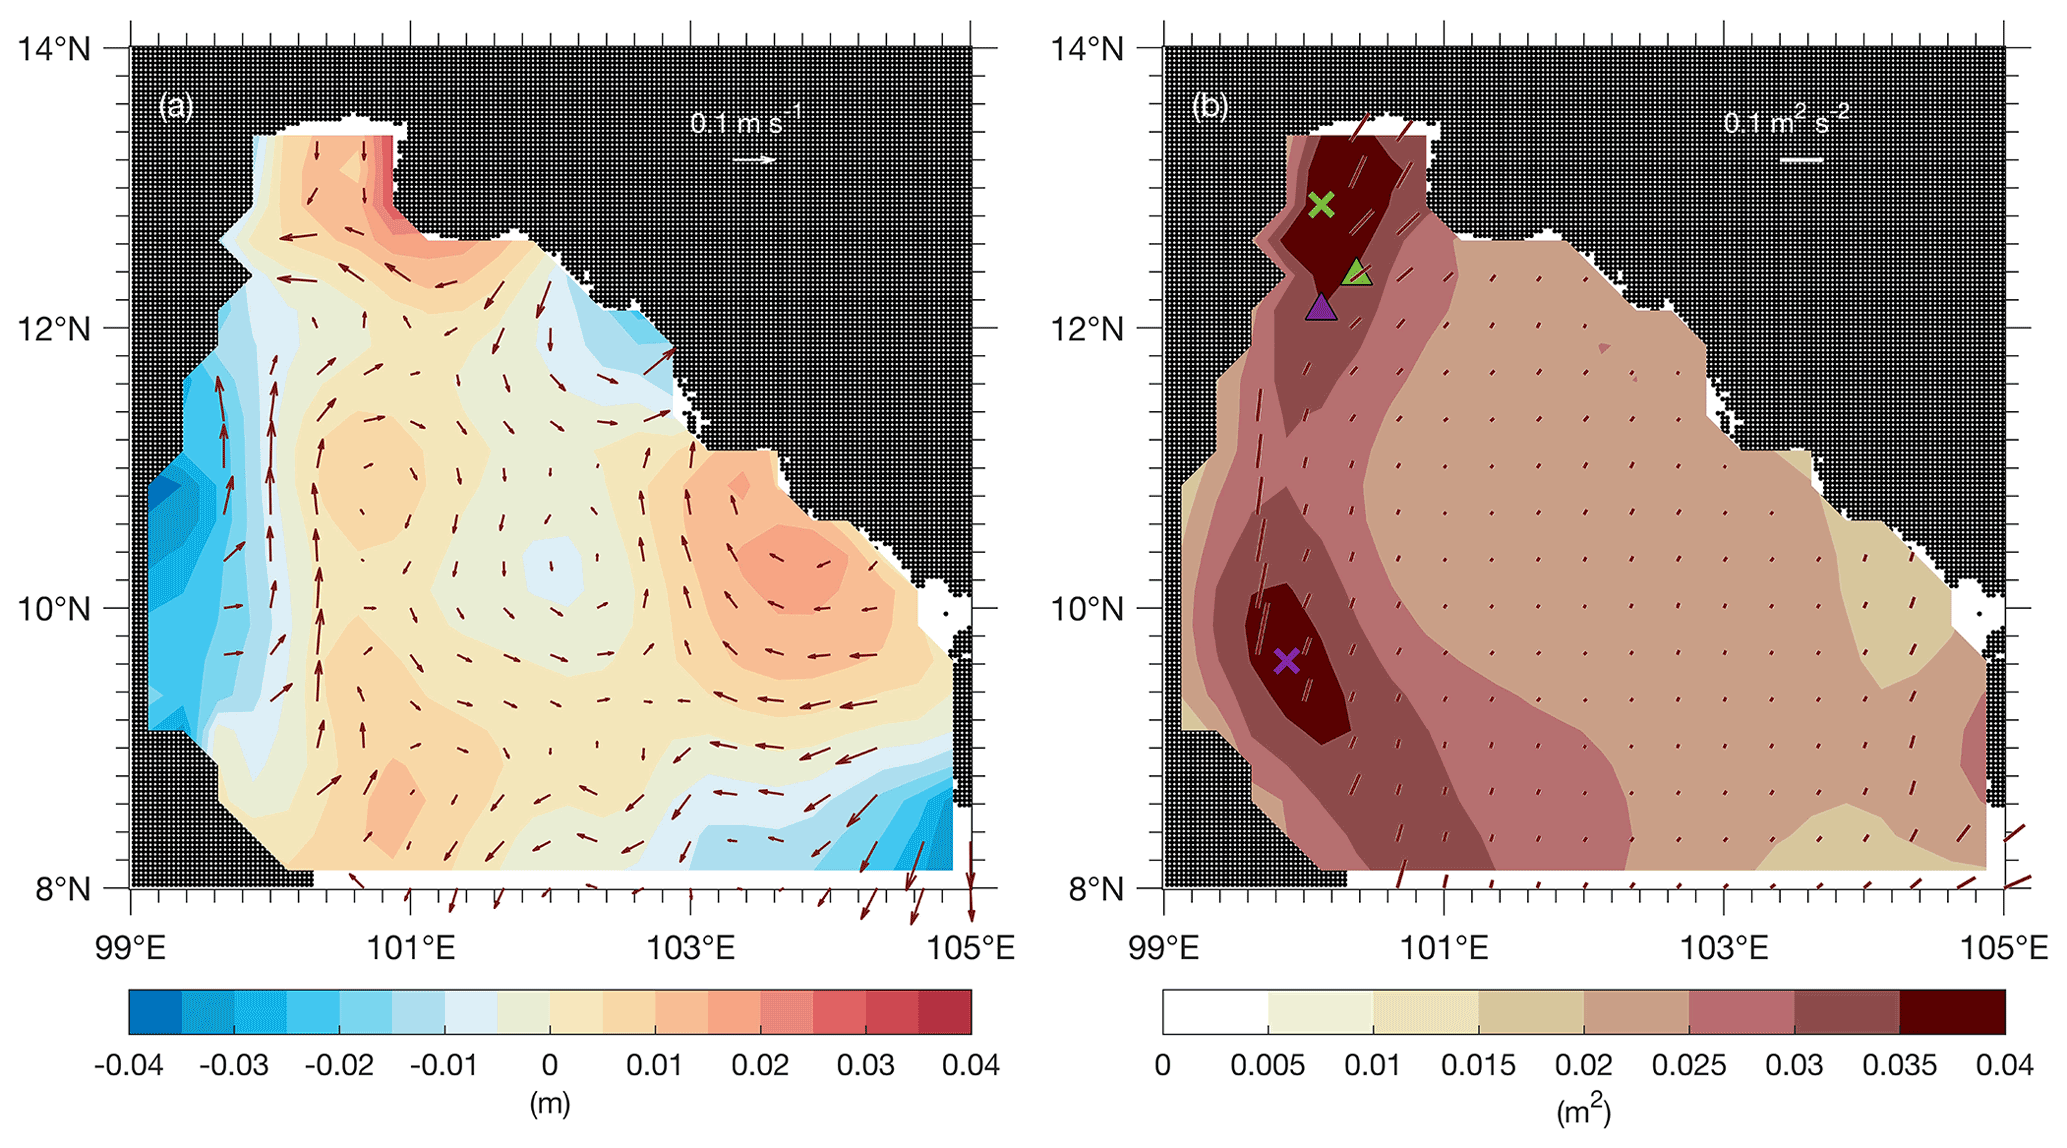
Figure 2The 2014–2019 (a) mean and (b) variance of the OSCAR current (maroon arrows and lines, respectively) and ADT (color contour) over the GoT. The zonal (meridional) component of the maroon lines in (b) indicates variance of the zonal (meridional) OSCAR current. Crosses in (b) mark locations with high ADT variance in the uGoT (green) and at the GoT western boundary (purple); the triangles with respective colors mark the locations of wind stress curls that correlate the best with the ADT shown in Fig. 7.
To understand the variability of the GoT circulation, the mean surface velocity (quivers in Fig. 2a) is removed from the OSCAR current to calculate the complex empirical orthogonal function (CEOF; see the Methodology section). The first few CEOF modes explain 28 %, 14 %, 10 % and 7.4 % of the surface current variance, respectively. This study only selects the first two modes to represent the dominating GoT circulation patterns (Fig. 3). The first CEOF mode describes a strong southward flow along the western boundary and a strong southeastward flow at the southeastern entrance during the southwest monsoon and fall monsoon transition (Fig. 3a–c). In the GoT interior, an anticyclonic circulation centered at ∼ 10.5∘ N, 101.5∘ E is present during these seasons. During the northeast monsoon and spring monsoon transition, the circulation reverses its direction. The circulation pattern is weaker during the monsoon transition compared to that during the monsoon seasons, and it is often weak or absent at the end of the spring monsoon transition and/or beginning of the southwest monsoon and at the end of the fall monsoon transition and/or beginning of the northeast monsoon (Fig. 3b). The second CEOF mode highlights strong flow along the western boundary of the GoT with the strongest flow in the northern part and weaker flow toward the central and lower GoT resembling the pattern of the circulation variance (Figs. 2b, 3d). Circulation in the GoT interior and along the eastern boundary is generally weak, except at the southeastern entrance. Although the phase does not exhibit a distinct pattern (Fig. 3f), the negative phase indicating southward flow is found during the southwest monsoon and into the fall monsoon transition (July–October) of 2016–2019 which could be associated with river runoffs (Aschariyaphotha and Wongwises, 2012). Southward flow is observed along the western boundary with the strongest current in the northern part of the GoT and a weak southwestward flow is present at the southeastern entrance. In addition, a positive phase is found during the spring monsoon transition over the observing period except in 2016; this indicates northward flow along the western boundary and northeastward flow at the southeastern entrance which could be associated with the SCS inflow (Yanagi et al., 2001; Aschariyaphotha et al., 2008).
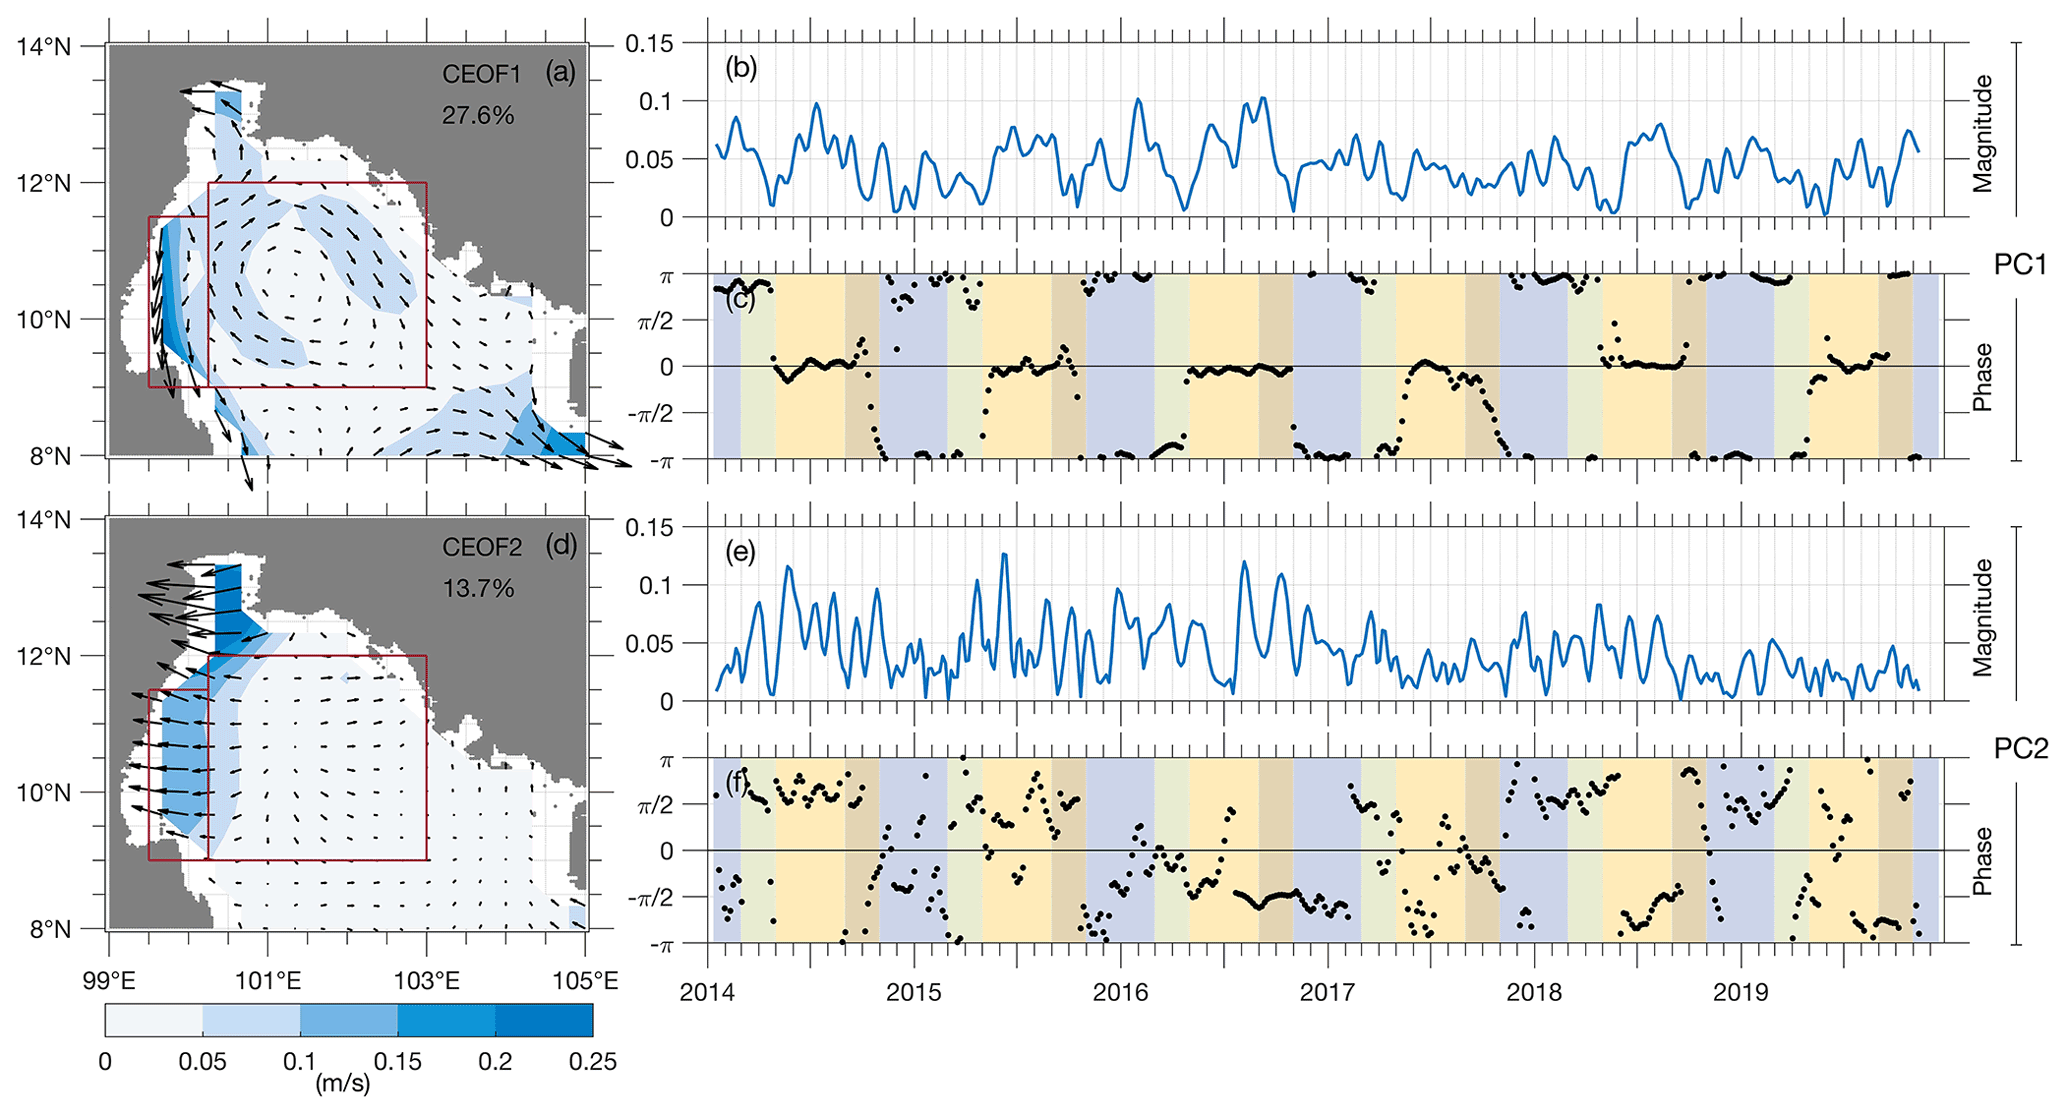
Figure 3The (a) first and (d) second dominant complex empirical orthogonal function (CEOF) modes of the OSCAR current with (b, e) the corresponding magnitudes and (c, f) phases of the principal components (PCs). Percentage of the current variance explained by each mode is shown in the upper right corner of (a) and (d). Maroon boxes in (a) and (d) designate the western boundary region (9.0–11.5∘ N, 99.5–100.2∘ E) and the GoT interior region (9.0–12.0∘ N, 100.2–103.0∘ E). Background shading in (c) and (f) denotes different seasons: northeast monsoon (blue), spring monsoon transition (green), southwest monsoon (yellow) and fall monsoon transition (brown).
4.1 Seasonal circulation in the Gulf of Thailand
4.1.1 Overall description
As suggested by the dominating circulation pattern calculated based on the CEOF, more than one-quarter of the variance in the GoT current can be simply explained by an annually reversing circulation that follows the monsoon seasons (Fig. 3a–c). Thus, the monthly mean current over the 2014–2019 period is calculated; the monthly current reveals a circulation pattern generally consistent with that shown by CEOF1 (Fig. 4a, c, e, g), particularly in June (representing the southwest monsoon) and December (representing the northeast monsoon). The pattern describes the circulation with a strong current in three main regions, which are the western boundary of the GoT, the interior of the GoT and the southeastern entrance of the GoT. In the interior of the GoT, an anticyclonic circulation is present (centered at ∼ 10.5∘ N, 101.5∘ E) during the southwest monsoon (Fig. 4c, d). A strong southward current is observed along the western boundary and a strong southeastward current is observed at the southeastern entrance suggesting an outflow into the SCS at the surface. The circulation pattern generally reverses its direction during the northeast monsoon, consistent with a previous surface current observation (Saramul, 2017). The monthly mean surface current hints at the connection between the currents along the western boundary and that at the southeastern entrance (Fig. 4a, c, e, g). Thus, a complex correlation (Eq. 7) between the current along the western boundary and that over the GoT is calculated to understand the dynamics associated with the strong western boundary current particularly whether it is related to the current at the southeastern entrance. On timescales longer than 30 d, currents along the southern boundary of the domain (south of 8.5∘ N) give a higher correlation to the western boundary current (9.0–11.5∘ N, 99.5–100.2∘ E) compared to the rest of the GoT (Fig. 5); the correlation is higher than 0.25 with the highest value of 0.57 at the entrance. The correlation between the western boundary current and that along the southern boundary of the domain is significant with 95 % confidence as determined by a non-parametric method (Sprent and Smeeton, 2007) where correlation coefficients are computed repeatedly (5000 times) using both of the time series that are randomly rearranged. The significant correlation strongly suggests a connection between the GoT western boundary current and the GoT inflow and/or outflow at the southeastern entrance through a passage to the south of ∼ 8.5∘ N.
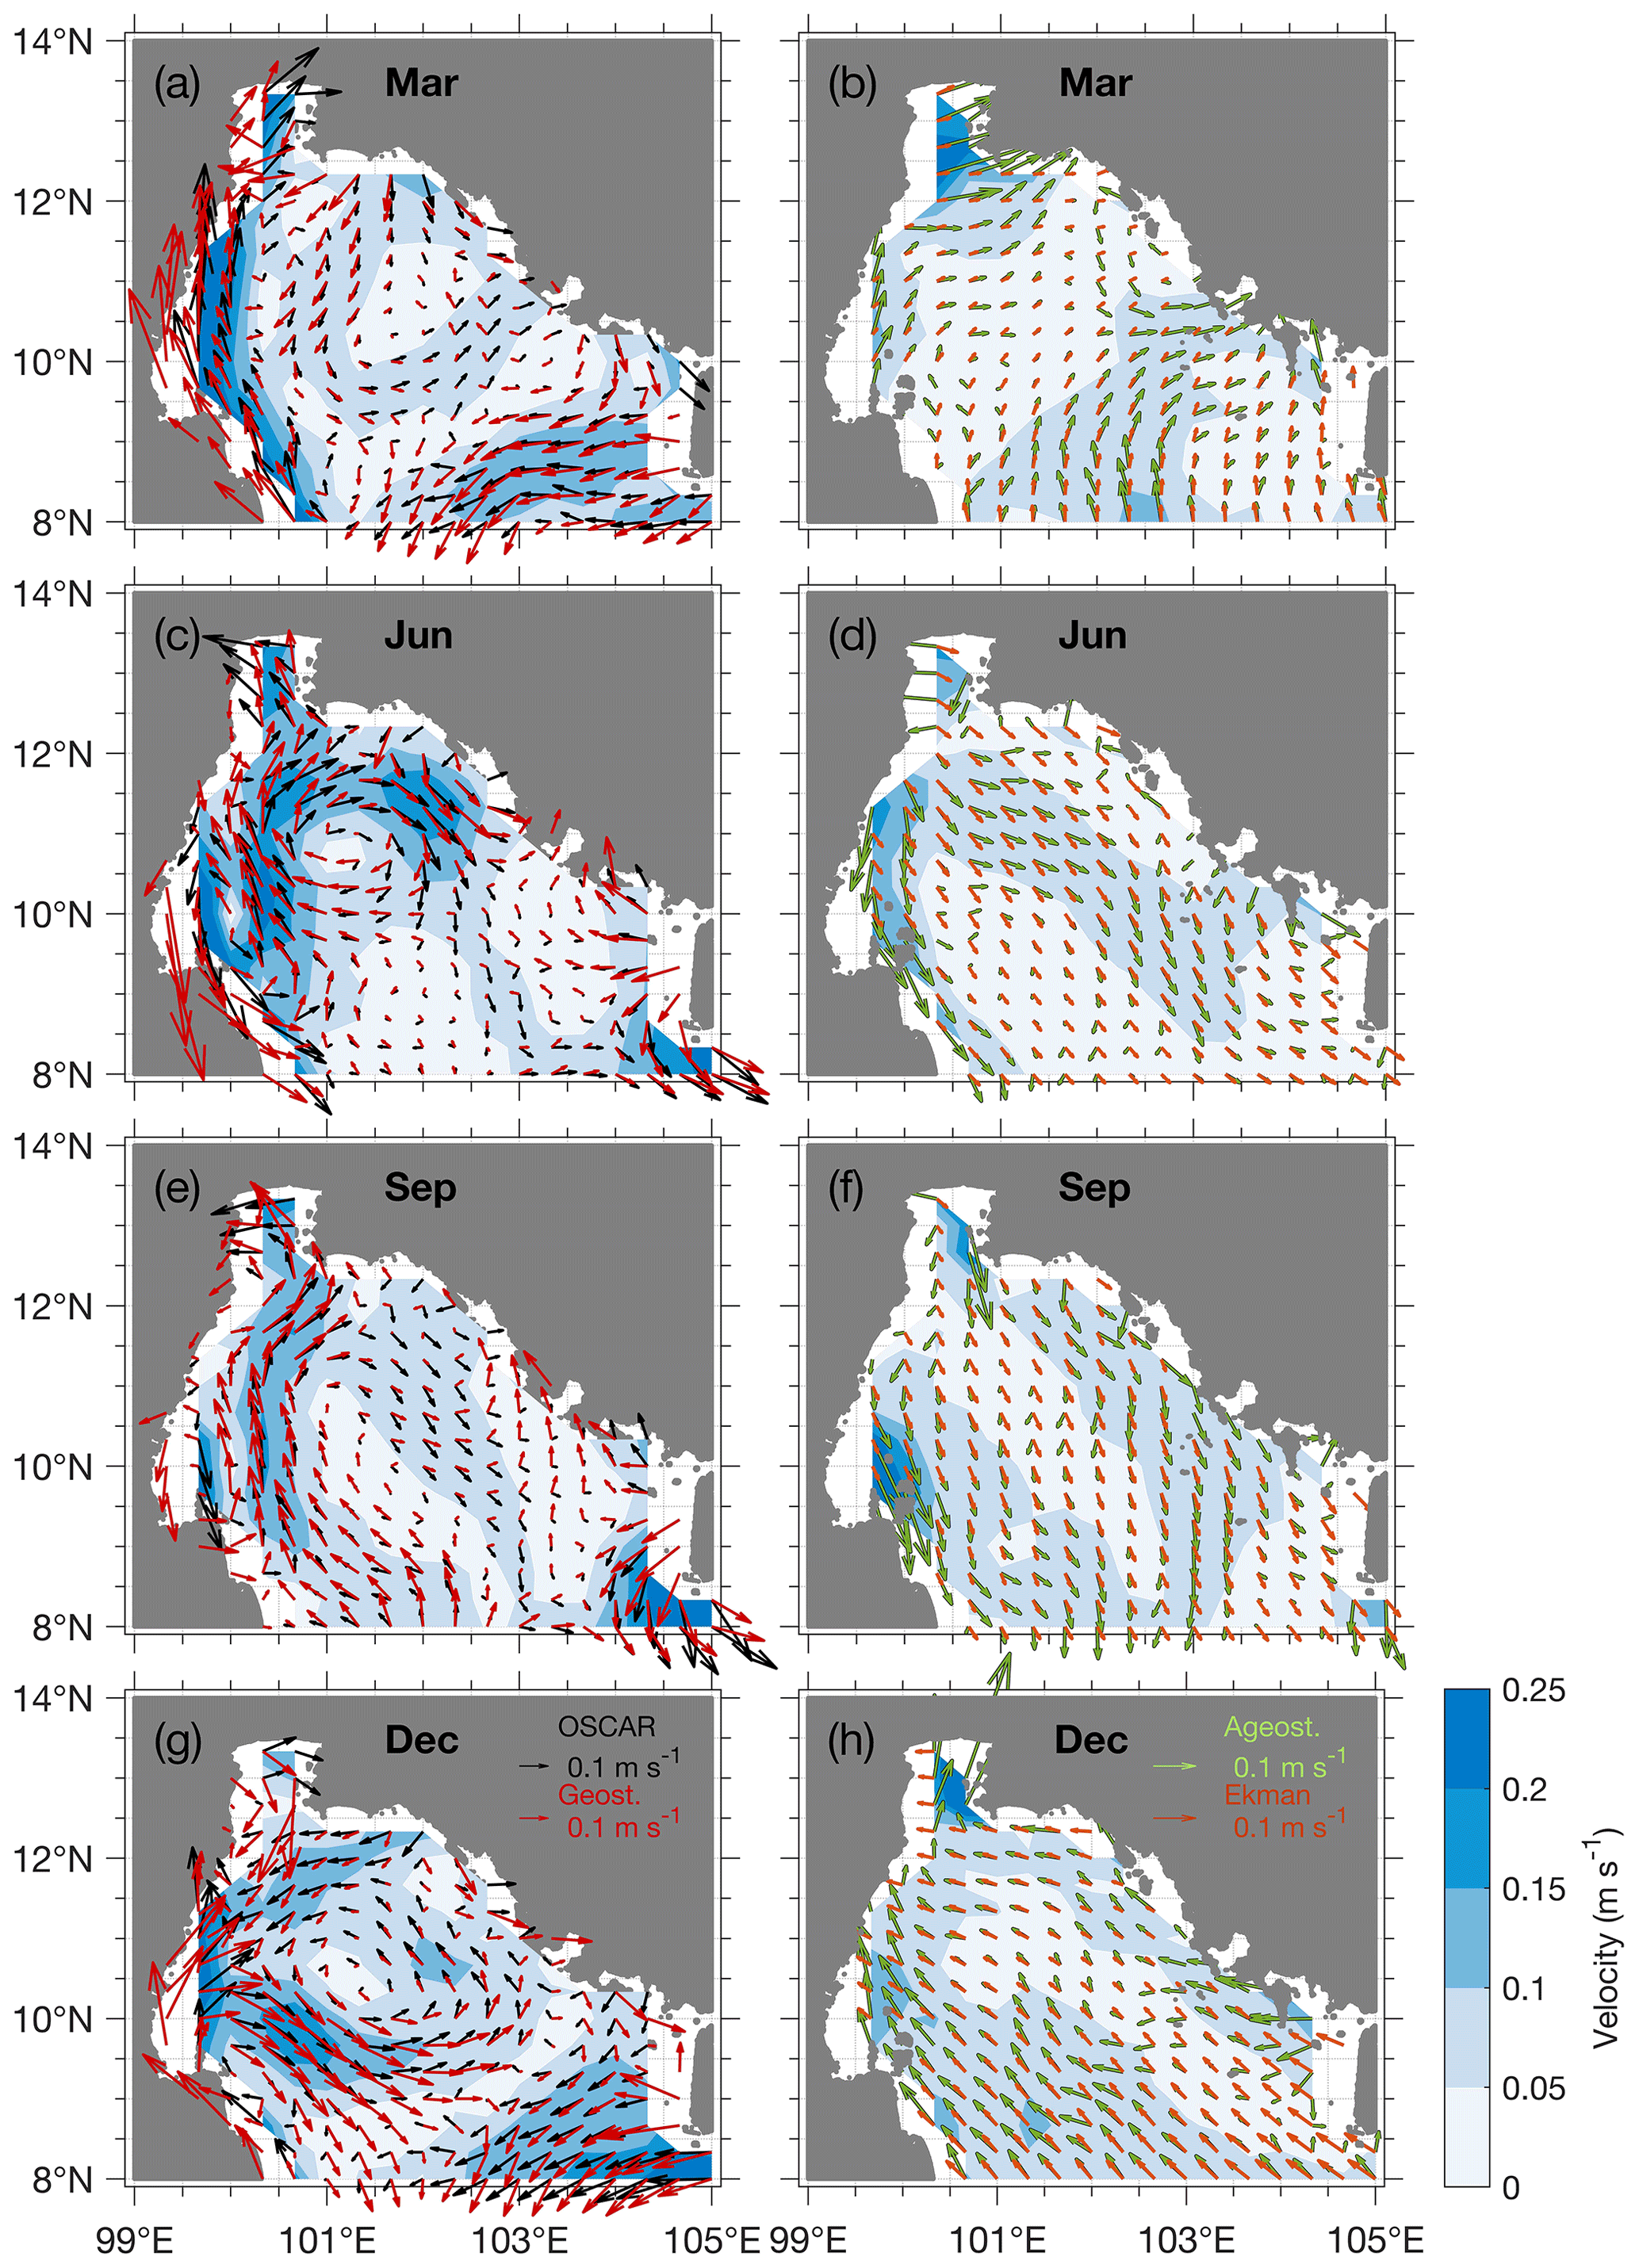
Figure 4The 2014–2019 monthly mean current over the GoT from the OSCAR product (black quiver; left column) and altimetry-based geostrophic current (red quiver; left column) for (a) January, (c) June, (e) September and (g) December; color contour indicates magnitude of the OSCAR current. The monthly mean ageostrophic current (green; right column) and wind-driven Ekman current (brown; right column) for (b) January, (d) June, (f) September and (h) December; color contour indicates magnitude of ageostrophic current. The color scale is presented on the lower right corner, and the scale for the current is shown in (g) and (h).
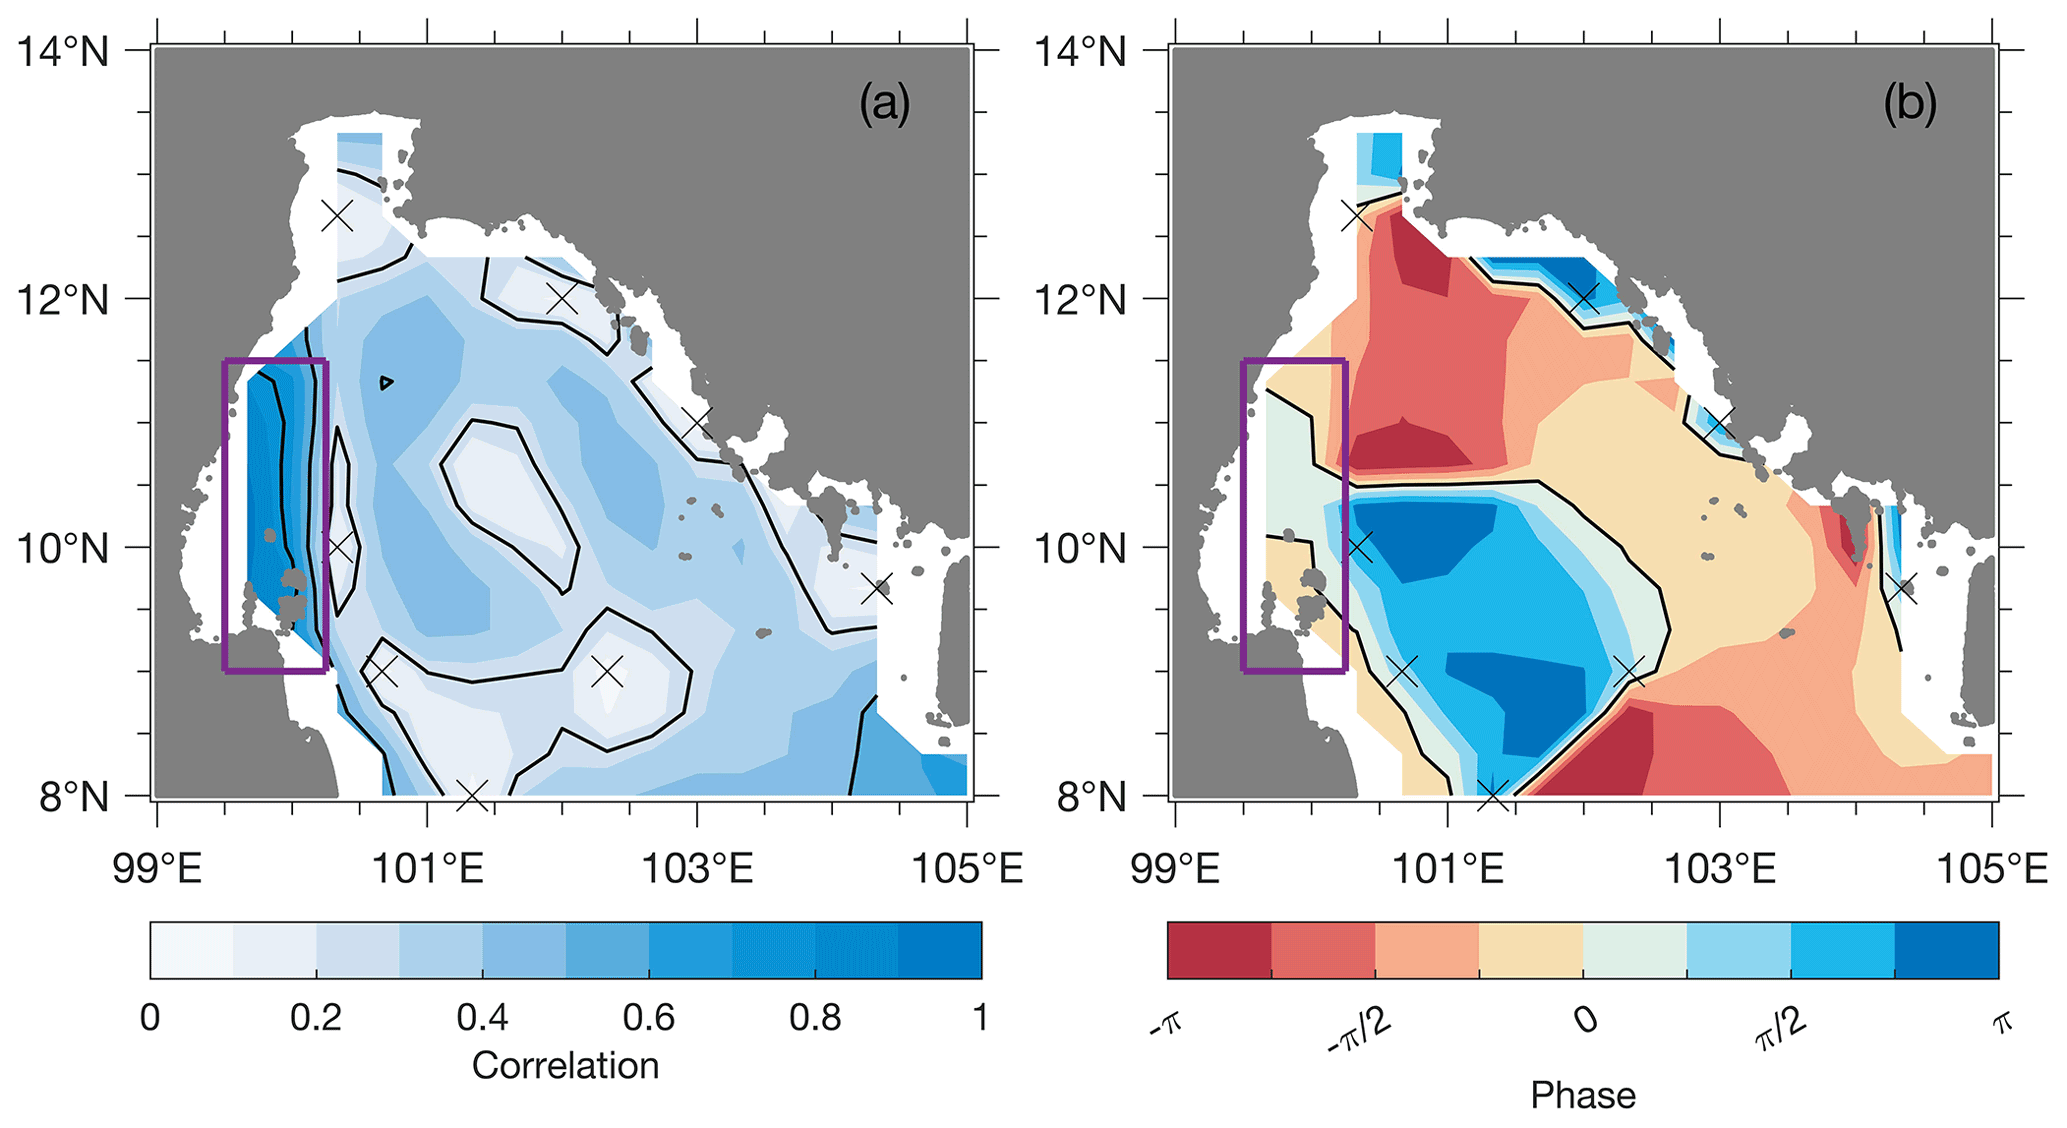
Figure 5(a) Complex correlation between the OSCAR current along the western boundary (purple box) and the OSCAR current over the entire GoT and (b) the corresponding phase. Black contour in (a) is plotted every 0.25 and that in (b) is plotted at zero and ±π. Crosses indicate the regions where the correlation is not significant with 95 % confidence.
During the spring monsoon transition (represented by March), the current resembles that during the northeast monsoon; a westward flow at the southeastern entrance is observed. The cyclonic circulation in the GoT interior is still present but weak. However, the northward flow along the western boundary is stronger and wider compared to that during the northeast monsoon; the northward current extends more than 80 km offshore to ∼ 100∘ E (Fig. 4a, d). Similarly, the GoT circulation in September, representing the fall monsoon transition, resembles that during the southwest monsoon despite the weak anticyclonic circulation in the interior. The circulation pattern during the monsoon transitions shows the dominant circulation pattern captured by both CEOF1 and CEOF2 (Fig. 3) reflecting the influence of monsoon winds and of the current connecting to the SCS (Fig. 5).
4.1.2 Geostrophic and ageostrophic component
Satellite altimetry is used to estimate geostrophic components of the surface circulation over the GoT. Although the altimetry may include short-period contributions during the satellite overpass, geostrophic velocity calculated from the altimetry is found to be reasonably close to the observation (Yu et al., 1995). In the Mediterranean Sea, the altimetry-derived geostrophic velocity is generally smaller than the drifter observations (Poulain et al., 2012); the error increases with the geostrophic velocity with an error of 7 %–17 % at a velocity of 1.5 m s−1 (Kubryakov and Stanichny, 2013).
The satellite ADT is linearly interpolated onto the ∘ OSCAR grid (Fig. 4). The magnitude of the geostrophic current is generally comparable to that of the total current, although their directions are not perfectly aligned. Large geostrophic velocity is observed along the western boundary of the GoT and at the southeastern entrance. The geostrophic velocity is weak in the GoT interior. The root-mean-square (rms) difference between the total and the geostrophic current (i.e., the estimated ageostrophic current) ranges from 0.04 to 0.11 m s−1 with the largest difference observed along the western boundary of the GoT; however, the rms difference is reasonably proportional to the speed of the total current there. A complex correlation between the total and the geostrophic current is calculated to determine the correlation and phase relationship between the two velocity fields (Fig. 6a, b; Eq. 7). Over the entire basin, the rms correlation coefficient is 0.70 (Fig. 6a). The correlation between the total and geostrophic current is higher along the southern boundary of the observing domain at 8∘ N. Along the northeastern boundary, the geostrophic current only explains a small fraction of the total current variance (14 %–34 %). The rms correlation coefficient over the interior is 0.71 and that over the western boundary region is 0.67. The strong correlation indicates the dominance of geostrophic circulation over the GoT. The phase relationship shows the direction that the geostrophic current has to rotate to align with the direction of the total current, where positive denotes counterclockwise rotation. A negative phase relationship is found roughly between 10.5 and 12∘ N, while a positive relationship is found to the south of 10.5∘ N (Fig. 6b). With the presence of anticyclonic circulation centered at 10.5–11∘ N during the southwest monsoon and fall monsoon transition, the phase relationship requires a southeastward ageostrophic flow. In contrast, the phase relationship implies a northwestward ageostrophic current during the northeast monsoon and spring monsoon transition when cyclonic circulation dominates the GoT interior. As the prevailing monsoon wind is southwesterly during the southwest monsoon and northeasterly during the northeast monsoon, the resulting wind-driven Ekman current aligns with the direction of the ageostrophic flow in the respective seasons. Therefore, the Ekman current is calculated from the CCMPv3 wind (Eqs. 3 and 4) to compare with the ageostrophic current.

Figure 6(a) Complex correlation map between the OSCAR current and altimetry-derived geostrophic current and (b) the phase. (c) Complex correlation map between the ageostrophic current and the Ekman current and (d) the phase. Boxes in (a) and (c) designate the western boundary region (9.0–11.5∘ N, 99.5–100.2∘ E) and the Gulf of Thailand interior region (9.0–12.0∘ N, 100.2–103.0∘ E).
The wind-driven Ekman current averaged in the upper 30 m of the water column (or to the seafloor where the water column is shallower than 30 m) has a distinct seasonal cycle, being the strongest during the northeast monsoon and the weakest during the spring monsoon transitions (Fig. 4b, d, f, h). During the northeast monsoon, the speed of the Ekman current exceeds 0.06 m s−1 almost everywhere except between 10–12∘ N along the eastern coast. The weak Ekman current is likely due to the presence of the Cardamom Mountains between 10–13∘ N on the coast of Thailand and Cambodia, which block the northeasterlies (Li et al., 2014). The strongest current is at the southeastern entrance transporting water into the GoT with a speed of 0.1 m s−1 (Fig. 4h). The Ekman current at the southeastern entrance still transports water into the GoT during the spring monsoon transition, although the speed decreases due to the weakening of the monsoon wind (Fig. 4b). During the southwest monsoon and fall monsoon transition, the Ekman current is quite uniform over the entire GoT; the flow is southeastward, producing an outflow into the SCS (Fig. 4d, f). The magnitude of the Ekman current is similar to the ageostrophic current in the GoT interior and the southeastern entrance but smaller along the boundaries.
Complex correlation between the ageostrophic component and the wind-driven Ekman current is calculated to examine the contribution of the wind-driven current on the ageostrophic circulation (Fig. 6c). A stronger correlation is found over the southern part of the domain, with the largest correlation coefficient of 0.54 reflecting that up to 29 % of the ageostrophic circulation is wind-driven. Over the western boundary region, the correlation coefficient between the wind-driven current and the ageostrophic current is 0.40. A similar value of correlation coefficient is observed over the interior of the GoT (R=0.41). The phase relationship indicates the direction that the Ekman current has to rotate to align with the direction of the ageostrophic current; it is small overall with most values between and (Fig. 6d). When the ageostrophic current is entirely driven by wind stress, the phase relationship is zero. Thus, the non-zero phase relationships hint at the importance of forcings other than wind stress on the ageostrophic current, e.g., counterflow produced by the bottom friction (the bottom Ekman layer). The negative phase is only found in a narrow band along the northwestern boundary suggesting the direction of the wind-driven current that is to the left of ageostrophic flow. The negative phase is clearly evident in June, September and December, while a positive phase is observed during the spring monsoon transition (March) (Fig. 4b, d, f, h).
Although the spatial resolution of the OSCAR products is too coarse to capture the complex circulation over such a small and shallow basin as the uGoT, previous studies have described the general circulation (Yanagi et al., 2001; Buranapratheprat et al., 2006, 2008; Saramul and Ezer, 2014), and thus speculation on the interaction between the uGoT and the rest of the GoT is discussed below. During the southwest monsoon, a southward flow is present along the western boundary to the south of ∼ 12.5∘ N (Fig. 4c) and the uGoT circulation is anticyclonic; thus, the flow along the GoT western boundary is likely not continuous into the uGoT. Instead, the northward flow along the western boundary of the uGoT is likely supplied by the western flank of the anticyclonic circulation in the GoT interior transporting high-salinity (Buranapratheprat et al., 2002) and low-nutrient (Buranapratheprat et al., 2009) water into the uGoT (Fig. 1a). The southward current along the uGoT eastern boundary is confluent with the eastward and/or northeastward flow to the southeast of the uGoT. During the northeast monsoon, a cyclonic circulation is present over the uGoT. The southward flow along the uGoT western boundary potentially continues southward joining the western flank of the cyclonic circulation in the GoT interior (Figs. 1a, 4g). Along the uGoT eastern boundary, the northward current is supplied by water from lower latitudes with relatively high salinity and low nutrients (Buranapratheprat et al., 2002, 2009). The water mass is likely derived from the westward and/or northwestward flow between 11 and 12∘ N that bifurcates to have one flank that travels northward along the uGoT eastern boundary and another that continues westward serving as the northern flank of the GoT interior cyclonic eddy. As studies on circulation patterns during the monsoon transition are still quite scarce, speculation regarding the circulation between the uGoT and the rest of the GoT is omitted.
4.1.3 The role of wind stress curl in sea surface height
The impact of the wind stress curl on sea surface height is examined through linear regression using daily measurements at the original spatial resolution of ∘. Both the basin-averaged wind stress curl and ADT have distinct seasonal cycles. High (low) ADT is observed during the northeast (southwest) monsoon over the entire basin, while the wind stress curl exhibits the opposite pattern (Fig. 7a). In addition, the intraseasonal signals of the basin-averaged ADT covary quite well with the basin-averaged wind stress curl. The anticorrelation yields a significant negative correlation of −0.84 indicating the dominance of wind stress curl on the ADT through local Ekman pumping; positive (negative) wind stress curl induces upward (downward) flow in the water column and depresses (raises) the ADT. In addition, the correlation suggests no time lag between the wind curl and the ADT, reflecting the instantaneous adjustment of the ADT as being forced by the local wind stress curl. As Zhou et al. (2012) suggest a delayed response of the ADT to wind stress curl over the SCS (decaying timescale of ∼ 40 d), the result demonstrates that a different wind-associated dynamic underlies the GoT compared to the rest of the SCS.

Figure 7Comparison between sea surface height anomaly (black) and wind stress curl (colors): (a) both sea surface height anomaly and wind stress curl (orange) averaged over the entire GoT, (b) sea surface height anomaly at the GoT western boundary shown as purple cross in Fig. 2b and wind stress curl (purple) to the south of the uGoT shown as purple triangle in Fig. 2b, and (c) both sea surface height anomaly and wind stress curl (green) to the south of the uGoT shown as green cross and triangle in Fig. 2b. Correlation coefficient between each comparison is shown in the upper right corner of each subplot. Note the reversed y axis for wind stress curl.
As most of the energy of the GoT circulation is located along the western boundary of the GoT (Figs. 2, 3, 4), the influence of wind stress curl on current variability at 9.6∘ N, 99.9∘ E, representing high ADT variance to the south of the uGoT (purple cross in Fig. 2b), and at 12.9∘ N, 100.1∘ E, representing high variance along the western GoT (green cross in Fig. 2b), is further investigated. Since an effect of winds on the ocean circulation is not necessarily local nor applied over a large scale (e.g., Meyers, 1996; Giddings and MacCready, 2017), the relationship between ADT at the selected locations and wind stress curl over the entire GoT is examined to identify the location of wind stress curl that influences the ADT. The ADT with high variance to the south of the uGoT correlates well with the nearby wind stress curl with a correlation coefficient of −0.80. The high correlation suggests a local response of ADT and thus the geostrophic current to the wind stress curl, although much of the correlation is attributed to the dominant seasonal cycle observed in both variables (Figs. 2b, 7c). However, high-variance ADT at the western boundary is correlated with wind stress curl ∼ 280 km to its north (Figs. 2b, 7b). Wind stress curl to the south of the uGoT (12.1∘ N, 100.1∘ E) explains 80 % of the ADT variance in the central part of the GoT western boundary (9.6∘ N, 99.9∘ E) as it also captures the intraseasonal fluctuation of the ADT. The mechanism associated with the high correlation between ADT at the western boundary and remote wind stress curl is still unclear and beyond the scope of this study. Still, the result suggests the importance of coastal trapped Kelvin waves which travel equatorward along the western boundary of the basin (Wang and Mooers, 1976). Coastal trapped Kelvin waves are also commonly found in regions with shallow and complex bathymetry, e.g., the Indonesian Archipelago (Sprintall et al., 2000; Delman et al., 2018), the SCS and the East China Sea (Wang et al., 2003; Yin et al., 2014; Liu et al., 2011). In the GoT interior, wind stress curl does not exhibit a seasonal cycle, and thus, the local wind stress curl does not locally influence the ADT there.
4.1.4 Interaction with the South China Sea
Since the GoT connects to the SCS, variability of the SCS circulation would provide a better understanding of the GoT circulation and the origin of water masses transported into the basin. In the southern part of the SCS, the circulation is highly influenced by the monsoon winds (e.g., Hu et al., 2000; Gan et al., 2006). During the northeast monsoon when the inflow from the SCS to the GoT is observed (Fig. 4g), a strong southwestward flow is present off the eastern coast of Vietnam; the current partly turns northwestward transporting water into the GoT (Hu et al., 2000; Gan et al., 2006; Liu et al., 2008). Thus, the GoT is largely replenished by water from the northern SCS which is highly influenced by the Kuroshio intrusion (Chao et al., 1996; Jilan, 2004; Wang et al., 2006; Centurioni et al., 2009). As the Kuroshio intrusion path can be quite variable, the northern SCS circulation varies depending on the intrusion path (Hu et al., 2000; Caruso et al., 2006; Nan et al., 2015). The variable SCS circulation potentially contributes to the variability of the GoT circulation, particularly at the entrance. During the southwest monsoon, a northeastward flow is present to the south of the GoT and the current off the Vietnam coast reverses to flow northwestward (Hu et al., 2000; Gan et al., 2006; Liu et al., 2008). The observed GoT outflows during the southwest monsoon and fall monsoon transition likely joining the northeastward flow transporting freshwater from river runoffs (Aschariyaphotha and Wongwises, 2012) into the SCS.
4.2 Interannual variability of the circulation in the Gulf of Thailand
The influences of ENSO and IOD are examined to understand the interannual variability of the GoT circulation. Low-frequency OSCAR velocity is calculated by removing the seasonal cycle, taken as a linear combination of the annual and semiannual harmonics that best fit the 6-year observations, and signals with periods shorter than 90 d. A 90 d low-pass filter is also applied to Niño3.4 and DMI (see the Datasets section). Complex correlation between the low-frequency indices, which have a phase of zero (±π) for a positive (negative) value, and the low-frequency currents is calculated over the entire GoT (Fig. 8a, b). The correlation shows fascinating patterns revealing that the ENSO conditions strongly influence the circulation over the central and the eastern parts of the GoT, while IOD conditions influence the current along the western boundary of the GoT and the southern boundary of the observing domain.
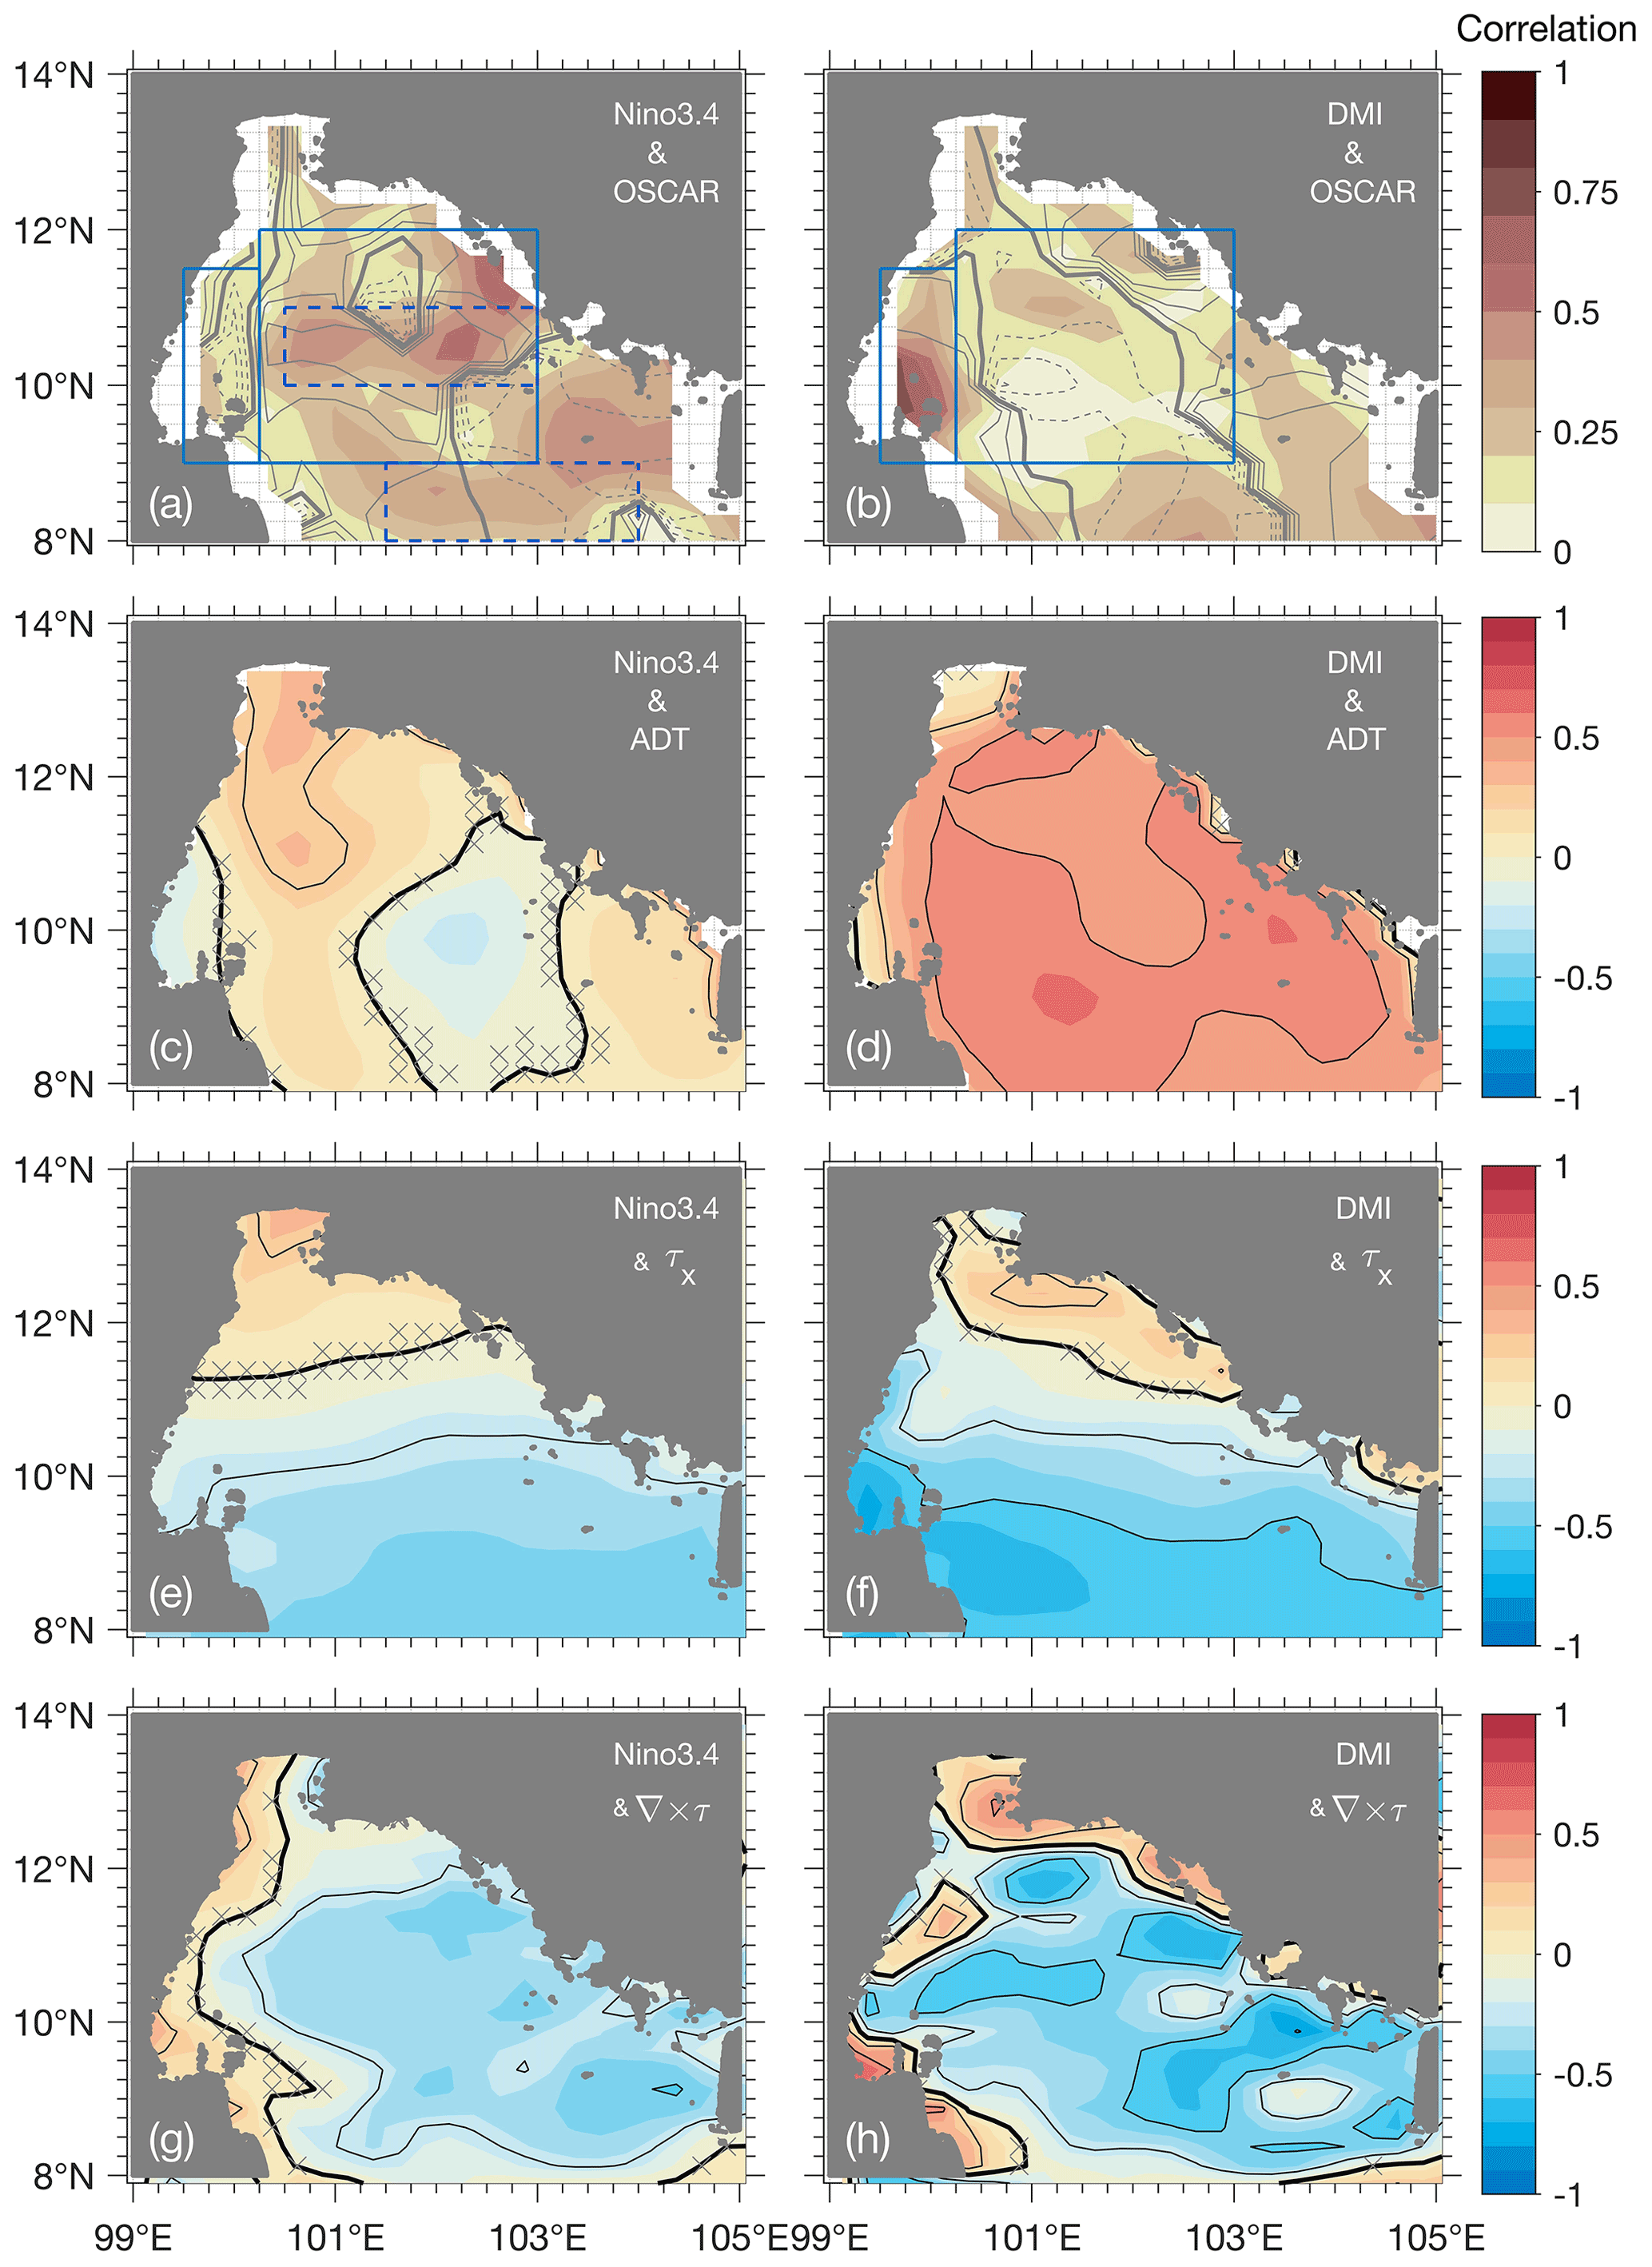
Figure 8Complex correlation was calculated between the OSCAR current (a, b)and the climate modes: Niño 3.4 (left column) and Dipole Mode Index (right column) with gray contour showing the phase associated with the complex correlation map. Solid (dashed) gray line is plotted every showing the positive (negative) phase relationship; thick gray line designates the zero contour. Correlation maps between the climate modes and the selected forcings: (c, d) sea surface height, (e, f) zonal wind stress, (g, h) wind stress curl. The blue boxes in (a) and (b) designate the western boundary region (9.0–11.5∘ N, 99.5–100.2∘ E) and the GoT interior (9.0–12.0∘ N, 100.2–103.0∘ E). Dashed blue boxes in (a) are areas with large low-frequency variability presented in Fig. 9c. The thick black contour in (c–h) is plotted at zero and the thin black contour is plotted every 0.25. Crosses in (c–h) mark the regions where the correlation is not significant with 95 % confidence.
Along the western boundary of the GoT, a strong correlation between the low-frequency current and low-frequency DMI is found with a phase relationship of indicating northward (southward) current anomaly during a positive (negative) IOD condition (Fig. 8b). The low-frequency meridional current averaged in the 9.0–11.5∘ N, 99.5–100.2∘ E region is used to represent the current along the western boundary; the low-frequency DMI explains 45 % of the variance of the alongshore meridional flow (Fig. 9b). During the southwest monsoon and fall monsoon transition in 2016 when a negative IOD event occurs, the southward western boundary current (Fig. 4) intensifies. In contrast, the seasonal southward current significantly weakens during the southwest monsoon and fall monsoon transition of 2019 when a positive IOD occurs. In addition, DMI correlates with the OSCAR current along the southern boundary of the domain. With the phase relationship of approximately ±π, the current is westward (eastward) along ∼8∘ N during a positive (negative) IOD event. The result suggests that IOD events not only affect the current along the western boundary but they also impact the continuous current from the southeastern entrance to the western boundary of the GoT (Figs. 3–5). The results contrast with the finding by Higuchi et al. (2020) that suggests an anomalous outflow during the southwest monsoon season of a positive IOD event. To understand the dynamics associated with the low-frequency variability of the GoT circulation, correlations between low-frequency DMI and selected forcings, which are ADT, zonal wind stress and wind stress curl, are calculated (Fig. 8c, e, g). Similarly, those between Niño3.4 and the selected forcing are also computed (Fig. 8d, f, h). Note that the meridional wind stress is also considered; however, its correlation with either of the indices does not exhibit a distinct variation pattern over the GoT. The low-frequency variability of the current along the western boundary during IOD events is likely associated with local zonal wind stress (Fig. 8f). The low-frequency component of the zonal wind stress shows a strong correlation with the DMI along the GoT western boundary with correlation coefficients as large as −0.75 and along the southern boundary of the domain with correlation coefficients as large as −0.58; the correlation pattern is similar to that between the OSCAR current and the DMI (Fig. 8b). The negative correlation suggests the westward (eastward) wind stress anomaly during a positive (negative) IOD event yielding a northwestward (southeastward) surface Ekman current anomaly along the western boundary, consistent with the low-frequency OSCAR current. Although the low-frequency wind stress curl and ADT also suggest a northward flow anomaly along the western boundary, the influence is roughly the same along the entire western boundary as well as the eastern boundary (Fig. 8d, f). Therefore, the low-frequency variability of the current along the GoT western boundary is likely not associated with the ADT and wind stress curl variability during IOD conditions. Correlation between low-frequency Niño3.4 and the low-frequency meridional current is small (R=0.14) but significant, with 95 % confidence suggesting a tendency of a northward (southward) current anomaly during an El Niño (La Niña) event; however, the current anomaly is not clearly apparent during the 2015/2016 El Niño and the 2017/2018 La Niña (Fig. 9b).

Figure 9Comparison between low-frequency current and the climate modes: (a) meridional velocity averaged along the western boundary (solid black) and the Dipole Mode Index (dashed orange); (b) mean zonal velocity in the middle (solid black) and to the south (dashed black) of the GoT interior and Niño 3.4 index (solid orange). Correlation coefficients between the current and both climate modes are shown in the lower right corner of each subplot. The correlation coefficients between the climate modes and the mean zonal velocity in the middle (to the south) of interior box are shown as the first (second) values.
In the GoT interior, a region of strong correlation between Niño3.4 and the OSCAR current is found at ∼ 10.0–11.0∘ N, 100.5–103.0∘ E (the northern dashed box in Fig. 8a), with the out-of-phase relationship that indicates the westward current anomaly during an El Niño event and the eastward current anomaly during a La Niña event. Considering the low-frequency zonal current averaged over the region, Niño3.4 explains 34 % of the low-frequency variance of the zonal flow (Fig. 9c). With a 75 d lag of the area-averaged current, the correlation improves to −0.71; half of the variance in the low-frequency zonal current in this region is associated with ENSO condition. Along the southern boundary of the domain (∼ 8–9∘ N, 101.5–104.0∘ E), the correlation is also strong and significant with 95 % confidence. However, the relationship is in-phase indicating an eastward (westward) current anomaly during an El Niño (a La Niña) event. This results in a weak GoT inflow at the southeastern entrance during an El Niño event consistent with weak circulation found in the SCS (Chao et al., 1996; Wang et al., 2006). The low-frequency Niño3.4 explains 14 % of variance in the area-averaged low-frequency zonal current with no lag (Fig. 9c). This opposing pattern produces a cyclonic current anomaly in the GoT interior during an El Niño event and an anticyclonic anomaly during a La Niña with its location farther south than the seasonal cyclonic and anticyclonic circulation (Figs. 3, 4a, c). The low-frequency cyclonic (anticyclonic) circulation during an El Niño (a La Niña) event colocates with anomalously low (high) ADT suggesting the dominance of geostrophic response in the GoT interior to ENSO variability (Fig. 8c). The mechanism setting up the low-frequency ADT variability is unclear; it cannot be explained by the local wind stress and wind stress curl (Fig. 8e, g) but might relate to the winter warm pool located at the eastern boundary of the GoT (Li et al., 2014). Still, the influence of low-frequency wind stress curl on the ADT through coastal trapped Kelvin waves cannot be eliminated. The correlation map suggests a negative (positive) wind stress curl at the GoT eastern boundary between 8.5 and 11.5∘ N during an El Niño (La Niña) event yielding a positive (negative) ADT anomaly that could propagate northward in the form of coastal trapped Kelvin waves. During the 2015 and 2016 northeast monsoon, the cyclonic circulation centered at 9.7∘ N, 101.7∘ E is clearly apparent during the northeast monsoon and into the spring monsoon transition (Fig. 9c), while the seasonal cyclonic circulation centered at 10.5∘ N, 101.5∘ E is missing (Figs. 3–4). Therefore, the seasonal cyclonic circulation is located farther south during the El Niño event. Shortly after the peak of the 2017 and 2018 La Niña event, an anticyclonic anomaly centered at the same location (9.7∘ N, 101.7∘ E) develops (Fig. 9c). The anticyclonic eddy anomaly in the GoT interior becomes more pronounced during the 2018 spring monsoon transition when the La Niña decays. The low-frequency DMI is significantly correlated with the low-frequency zonal current in the interior. However, it explains less than 5 % of the low-frequency zonal current variance, and the general circulation pattern away from the western boundary and the uGoT do not show a significant deviation from the seasonal current during the negative IOD event in 2016 and the positive IOD event in 2019 (Figs. 8b, 9c).
The ADT, zonal wind stress and wind stress curl are also examined over the uGoT region to understand how these forcings, which potentially influence the uGoT interannual circulation, vary during the ENSO and IOD events (Fig. 8). Positive correlation is found between the ADT over the uGoT and Niño3.4 indicating a tendency of an anomalously high (low) sea level, particularly along the eastern boundary during an El Niño (La Niña) event (Fig. 8c). The pattern is consistent with that produced by the wind stress curl (Fig. 8g). Therefore, the geostrophic current is likely anomalously northward (southward) along the western boundary of the uGoT during an El Niño (La Niña) event. In addition, a positive correlation between the zonal wind stress and Niño3.4 is present reflecting an anomalously southward (northward) wind-driven Ekman current during an El Niño (La Niña) event. Correlations between the selected forcings and DMI are generally lower than those with the Niño3.4 (Fig. 8c–h). The correlation between DMI and ADT is weak over the northwestern part of the uGoT; higher positive correlation is observed to the south of the uGoT and along the eastern boundary. As a result, an anomalously high (low) ADT is likely present to the south of the uGoT and the eastern boundary during a positive (negative) IOD event producing an eastward (westward) geostrophic current to the south of the uGoT and a northward (southward) geostrophic current along the eastern boundary (Fig. 8d). A positive correlation between DMI and wind stress curl is also found over the uGoT potentially contributing to a lower increase in the sea level compared to that in the rest of the GoT where negative correlation is present (Fig. 8f). IOD events are overall not significantly correlated to the zonal wind stress over the uGoT (Fig. 8f).
This study exploits the synergy of the available remotely sensed observations to understand variability of the GoT circulation that reveals different responses to the different climate modes. The interannual current along the western boundary is more sensitive to IOD conditions, while that in the GoT interior is more sensitive to ENSO conditions (Figs. 8, 9). At the seasonal timescale, the observations reveal spontaneous adjustment of the basin-averaged ADT following the basin-averaged wind stress curl signal that is different from the rest of the SCS (Zhou et al., 2012). Still, the associated mechanisms vary over different parts of the GoT (Fig. 7). For example, the ADT at the southern part of the uGoT correlates highly with the local wind stress curl reflecting the influence of the local Ekman pumping, while the ADT along the western boundary is highly related to the wind stress curl to its north suggesting the influence of coastal trapped Kelvin waves on modifying the sea level along the western boundary. Approximately half of the surface current variability is geostrophic (Figs. 4, 6) set up by ADT variability similar to circulation in the SCS (Gan et al., 2006). The ageostrophic current is significantly explained by the Ekman current, although the portion being explained varies spatially. The Ekman current accounts for a larger percentage of the ageostrophic flow along the western boundary and the GoT interior, particularly to the south of ∼ 10∘ N, compared to region to the north of this latitude (Figs. 4, 6).
The OSCAR surface current product also demonstrates the seasonal reversing circulation pattern at the surface, explaining 28 % of the total current variance over the 2014–2019 period, following the monsoon wind reversal (Fig. 3a–c). The seasonal pattern confirms the anticyclonic circulation in the GoT interior with an outflow at the southeastern entrance during the southwest monsoon (Fig. 4) consistent with findings from Wyrtki (1961) and Aschariyaphotha et al. (2008). A cyclonic circulation along the western boundary of the GoT as suggested by a numerical simulation (Yanagi and Takao, 1998) is present but narrow, confined to the west of ∼ 100.5∘ E (Fig. 1a). Although the anticyclonic geostrophic circulation at the rim of the GoT (Sojisuporn et al., 2010) is not distinct, the southward geostrophic flow along the western boundary is strong. During the northeast monsoon, the OSCAR product shows strong northward flow along the western boundary and an inflow at the southern entrance consistent with observational (Sojisuporn et al., 2010) and numerical studies (Yanagi and Takao, 1998; Aschariyaphotha et al., 2008). The 6-year averaged surface velocity displays the dominance of cyclonic circulation in the GoT interior (Fig. 4), in agreement with that observed during the Naga expedition (Wyrtki, 1961).
In addition, the finding reveals the importance of the GoT circulation during the monsoon transitions; there are strong seasonal flows along the western boundary and at the southeastern entrance suggesting water exchange with the SCS. During the spring monsoon transition, a strong northward flow along the western boundary is superimposed on the circulation pattern during the northeast monsoon (Figs. 3–4). In contrast, a southward flow is present along the western boundary and a strong southeastward current is observed at the southeastern entrance during the fall monsoon transition. As the western boundary current is connected to that at the southeastern entrance (Fig. 5), the results highlight the connection between circulation in the GoT and the SCS that distinctly occurs during the monsoon transitions. Moreover, variability of the circulation during the transition seasons could greatly impact the properties of water in the GoT.
Although this study offers insightful details of the GoT circulation, particularly to the south of 12.5∘ N, there are still forcings that are not considered, for example, tidal currents and planetary waves. Previous studies have indicated the importance of the tidal pattern over the GoT that is different from one region to another (Yanagi and Takao, 1998) and is heavily dependent on the tidal pattern in the SCS (Cui et al., 2019). It cannot be concluded that there is an effect of coastal trapped Kelvin waves on the coastal circulation, which is also observed in the nearby regions (Sprintall et al., 2000; Wang et al., 2003; Yin et al., 2014; Liu et al., 2011; Delman et al., 2018), despite the observed influence of remote wind stress curl on the western boundary current. Thus, examination of these factors could further improve the understanding of dynamics associated with the GoT circulation.
The OSCAR third-degree Version 1 data are provided by Physical Oceanography Distributed Active Archive Center. CCMP Version-3.0 vector wind analyses are produced by Remote Sensing Systems. Data are available at https://doi.org/10.56236/RSS-uv6h30 (Mears et al., 2022). This study has been conducted using EU Copernicus Marine Service Information (2020) (https://doi.org/10.48670/moi-00148). Niño 3.4 is provided by Climate Prediction Center – NOAA (2020) and is available at https://www.cpc.ncep.noaa.gov/data/indices/wksst8110.for. DMI is provided by Ocean Observations Panel for Climate – NOAA (2020) and is available at https://stateoftheocean.osmc.noaa.gov/sur/ind/dmi.php.
The author has declared that there are no competing interests.
Publisher’s note: Copernicus Publications remains neutral with regard to jurisdictional claims in published maps and institutional affiliations.
The author would like to thank Sittipong Thamrongpairoj for patiently reviewing the equations presented in the paper.
This research has been supported by the Burapha University (grant no. 001/2564).
This paper was edited by John M. Huthnance and reviewed by three anonymous referees.
Adebisi, N., Balogun, A.-L., Min, T. H., and Tella, A.: Advances in estimating Sea Level Rise: A review of tide gauge, satellite altimetry and spatial data science approaches, OceanCoast. Manag., 208, 105632, https://doi.org/10.1016/j.ocecoaman.2021.105632, 2021. a
Akhir, M.: Surface Circulation and Temperature Distribution of Southern South China Sea from Global Ocean Model (OCCAM), Sains Malays., 41, 701–714, 2012. a
Alberty, M., Sprintall, J., MacKinnon, J., Germineaud, C., Cravatte, S., and Ganachaud, A.: Moored Observations of Transport in the Solomon Sea, J. Geophys. Res.-Oceans, 124, 8166–8192, 2019. a
Aschariyaphotha, N. and Wongwises, S.: Simulations of Seasonal Current Circulations and Its Variabilities Forced by Runoff from Freshwater in the Gulf of Thailand, Arab. J. Sci. Eng., 37, 1389–1404, 2012. a, b
Aschariyaphotha, N., Wongwises, P., Wongwises, S., Humphries, U. W., and You, X.: Simulation of Seasonal Circulations and Thermohaline Variabilities in the Gulf of Thailand, Adv. Atmos. Sci., 25, 489–506, 2008. a, b, c, d, e, f, g, h, i, j
Black, E., Slingo, J., and Sperber, K. R.: An Observational Study of the Relationship between Excessively Strong Short Rains in Coastal East Africa and Indian Ocean SST, Mon. Weather Rev., 131, 74–94, https://doi.org/10.1175/1520-0493(2003)131<0074:AOSOTR>2.0.CO;2, 2003. a
Bonjean, F. and Lagerloef, G. S. E.: Diagnostic Model and Analysis of the Surface Currents in the Tropical Pacific Ocean, J. Phys. Oceanogr., 32, 2938–2954, 2002. a
Buranapratheprat, A., Yanagi, T., and Sawangwong, P.: Seasonal Variations in circulation and Salinity Distributions in the Upper Gulf of Thailand, La Mer, 40, 147–155, 2002. a, b, c, d, e, f
Buranapratheprat, A., Yanagi, T., Sojisuporn, P., and Booncherm, C.: Influence of local wind field on seasonal circulations in the upper Gulf of Thailand, Coast. Mar. Sci., 30, 19–26, 2006. a, b, c
Buranapratheprat, A., Yanagi, T., and Matsumura, S.: Seasonal variation in water column conditions in the upper Gulf of Thailand, Cont. Shelf Res., 28, 1509–2522, 2008. a, b, c, d, e, f
Buranapratheprat, A., Niemann, K. O., Matsumura, S., and Yanagi, T.: MERIS imageries to investigate surface chlorophyll in the upper Gulf of Thailand, Coast. Mar. Sci., 33, 22–28, 2009. a, b
Caruso, M. J., Gawarkiewicz, G. G., and Beardsley, R. C.: Interannual variability of the Kuroshio intrusion in the South China Sea, J. Oceanogr., 62, 559–575, https://doi.org/10.1007/s10872-006-0076-0, 2006. a
Centurioni, L. R., Niiler, P. N., and Lee, D.-K.: Near-surface circulation in the South China Sea during the winter monsoon, Geophys. Res. Lett., 36, L06605, https://doi.org/10.1029/2008GL037076, 2009. a
Chao, S.-Y., Shaw, P.-T., and Wu, S. Y.: El Niño modulation of the South China Sea circulation, Prog. Oceanogr., 38, 51–93, https://doi.org/10.1016/S0079-6611(96)00010-9, 1996. a, b
Climate Prediction Center – National Oceanic and Atmospheric Administration (NOAA): Sea Surface Temperature, Climate Prediction Center – National Oceanic and Atmospheric Administration (NOAA) [data set], https://www.cpc.ncep.noaa.gov/data/indices/wksst8110.for, last access: 24 February 2020. a
Cui, X., Fang, G., and Wu, D.: Tidal resonance in the Gulf of Thailand, Ocean Sci., 15, 321–331, https://doi.org/10.5194/os-15-321-2019, 2019. a
Delman, A. S., McClean, J. L., Sprintall, J., Talley, L. D., and Bryan, F. O.: Process-Specific Contributions to Anomalous Java Mixed Layer Cooling During Positive IOD Events, J. Geophys. Res.-Oceans, 123, 4153–4176, https://doi.org/10.1029/2017JC013749, 2018. a, b
Ducet, N., Traon, P. Y. L., and Reverdin, G.: Global high-resolution mapping of ocean circulation from TOPEX/Poseidon and ERS-1 and -2, J. Geophys. Res., 105, 19477–19498, 2000. a
EU Copernicus Marine Service Information: Global Ocean Gridded L4 Sea Surface Heights And Derived Variables Reprocessed 1993 Ongoing, EU Copernicus Marine Service Information [data set], https://doi.org/10.48670/moi-00148, last access: 20 March 2020. a
Gan, J., Li, H., Curchitser, E. N., and Haidvogel, D. B.: Modeling South China Sea circulation: Response to seasonal forcing regimes, J. Geophys. Res.-Oceans, 111, C06034, https://doi.org/10.1029/2005JC003298, 2006. a, b, c, d
Giddings, S. N. and MacCready, P.: Reverse Estuarine Circulation Due to Local and Remote Wind Forcing, Enhanced by the Presence of Along-Coast Estuaries, J. Geophys. Res.-Oceans, 122, 10184–10205, https://doi.org/10.1002/2016JC012479, 2017. a
Higuchi, M., Anongponyoshun, M., Phaksopa, J., and Onishi, H.: Influence of monsoon-forced Ekman transport on sea surface height in the Gulf of Thailand, Agr. Nat. Resour., 54, 205–210, https://doi.org/10.34044/j.anres.2020.54.2.12, 2020. a
Holgate, S. J., Matthews, A., Woodworth, P. L., Rickards, L. J., Tamisiea, M. E., Bradshaw, E., Foden, P. R., Gordon, K. M., Jevrejeva, S., and Pugh, J.: New Data Systems and Products at the Permanent Service for Mean Sea Level, J. Coastal Res., 29, 493–504, https://doi.org/10.2112/JCOASTRES-D-12-00175.1, 2013. a
Hu, J., Kawamura, H., Hong, H., and Qi, Y.: A Review on the Currents in the South China Sea: Seasonal Circulation, South China Sea Warm Current and Kuroshio Intrusion, J. Oceanogr., 56, 607–624, https://doi.org/10.1023/A:1011117531252, 2000. a, b, c, d
Jaroenongard, C., Babel, M. S., Shrestha, S., Weesakul, S., Nitivattananon, V., and Khadka, D.: Projecting Relative Sea Level Rise under Climate Change at the Phrachula Chomklao Fort Tide Gauge in the Upper Gulf of Thailand, Water, 13, 1702, https://doi.org/10.3390/w13121702, 2021. a
Jilan, S.: Overview of the South China Sea circulation and its influence on the coastal physical oceanography outside the Pearl River Estuary, Cont. Shelf Res., 24, 1745–1760, https://doi.org/10.1016/j.csr.2004.06.005, 2004. a
Klinck, J. M.: EOF Analysis of Central Drake Passage Currents from DRAKE 79, J. Phys. Oceanogr., 15, 288–298, https://doi.org/10.1175/1520-0485(1985)015<0288:EAOCDP>2.0.CO;2, 1985. a
Kubryakov, A. A. and Stanichny, S. V.: Estimating the quality of the retrieval of the surface geostrophic circulation of the Black Sea by satellite altimetry data based on validation with drifting buoy measurements, Izv. Atmos. Ocean. Phys., 490, 930–938, 2013. a
Kundu, P. K.: Ekman Veering Observed near the Ocean Bottom, J. Phys. Oceanogr., 6, 238–242, https://doi.org/10.1175/1520-0485(1976)006<0238:EVONTO>2.0.CO;2, 1976. a
Kundu, P. K. and Allen, J. S.: Some Three-Dimensional Characteristics of Low-Frequency Current Fluctuations near the Oregon Coast, J. Phys. Oceanogr., 6, 181–199, https://doi.org/10.1175/1520-0485(1976)006<0181:STDCOL>2.0.CO;2, 1976. a
Li, J., Zhang, R., Ling, Z., Bo, W., and Liu, Y.: Effects of Cardamom Mountains on the formation of the winter warm pool in the Gulf of Thailand, Cont. Shelf Res., 91, 211–219, 2014. a, b
Liu, Q., Kaneko, A., and Jilan, S.: Recent progress in studies of the South China Sea circulation, J. Oceanogr., 64, 753–762, 2008. a, b
Liu, Q., Feng, M., and Wang, D.: ENSO-induced interannual variability in the southeastern South China Sea, J. Oceanogr., 67, 127–133, https://doi.org/10.1007/s10872-011-0002-y, 2011. a, b
Meyers, G.: Variation of Indonesian throughflow and the El Niño-Southern Oscillation, J. Geophys. Res.-Oceans, 101, 12255–12263, https://doi.org/10.1029/95JC03729, 1996. a
Mears, C., Lee, T., Ricciardulli, L., Wang, X., and Wentz, F.: RSS Cross-Calibrated Multi-Platform (CCMP) 6-hourly ocean vector wind analysis on 0.25 deg grid, Version 3.0, Remote Sensing Systems, Santa Rosa, CA, available at https://www.remss.com/, https://doi.org/10.56236/RSS-uv6h30 (last access: 24 October 2020), 2022. a, b
Nan, F., Xue, H., and Yu, F.: Kuroshio intrusion into the South China Sea: A review, Prog. Oceanogr., 137, 314–333, https://doi.org/10.1016/j.pocean.2014.05.012, 2015. a
North, G. R., Bell, T. L., Cahalan, R. F., and Moeng, F. J.: Sampling Errors in the Estimation of Empirical Orthogonal Functions, Mon. Weather Rev., 110, 699–706, https://doi.org/10.1175/1520-0493(1982)110<0699:SEITEO>2.0.CO;2, 1982. a
Ocean Observations Panel for Climate – NOAA: Dipole Mode Index, Ocean Observations Panel for Climate – NOAA [data set], https://stateoftheocean.osmc.noaa.gov/sur/ind/dmi.php, last access: 21 February 2020. a
Poulain, P.-M., Menna, M., and Mauri, E.: Surface Geostrophic Circulation of the Mediterranean Sea Derived from Drifter and Satellite Altimeter Data, J. Phys. Oceanogr., 42, 973–990, https://doi.org/10.1175/JPO-D-11-0159.1, 2012. a
PSMSL: Tide Gauge Data, PSMSL [data set], http://www.psmsl.org/data/obtaining/ (last access: 1 October 2020), 2019. a
Saji, N. H., Goswami, B. N., Vinayachandran, P. N., and Yamagata, T.: A dipole in the tropical Indian Ocean, Nature, 401, 360–363, 1999. a, b
Saramul, S.: Seasonal Monsoon Variations in Surface Currents in the Gulf of Thailand Revealed by High Frequency Radar, Eng. J., 21, 25–37, 2017. a, b, c, d
Saramul, S. and Ezer, T.: On the dynamics of low latitude, wide and shallow coastal system: numerical simulations of the Upper Gulf of Thailand, Ocean Dyn., 64, 557–571, 2014. a, b, c, d, e
Sojisuporn, P., Morimoto, A., and Yanagi, T.: Seasonal variation of sea surface current in the Gulf of Thailand, Coast. Mar. Sci., 34, 91–102, 2010. a, b, c, d, e, f
Sprent, P. and Smeeton, N. C.: Applied Nonparametric Statistical Methods, 4th edn., ISBN 978-1584887010, Chapman and Hall/CRC, 2007. a
Sprintall, J., Gordon, A. L., Murtugudde, R., and Susanto, R. D.: A semiannual Indian Ocean forced Kelvin wave observed in the Indonesian seas in May 1997, J. Geophys. Res.-Oceans, 105, 17217–17230, https://doi.org/10.1029/2000JC900065, 2000. a, b
Sriwoon, R., Pholpunthin, P., Kishino, M., and Furuya, K.: Population dynamics of green Noctiluca scintillans (Dinophyceae) associated with the monsoon cycle in the upper Gulf of Thailand, J. Phycol., 44, 605–615, https://doi.org/10.1111/j.1529-8817.2008.00516.x, 2008. a
Suvapepun, S.: Long term ecological changes in the Gulf of Thailand, Mar. Pollut. Bull., 23, 213–217, https://doi.org/10.1016/0025-326X(91)90677-K, 1991. a
Trenberth, K. E.: The Definition of El Niño, B. Am. Meteorol. Soc., 78, 2771–2778, https://doi.org/10.1175/1520-0477(1997)078<2771:TDOENO>2.0.CO;2, 1997. a
Trisirisatayawong, I., Naeije, M., Simons, W., and Fenoglio-Marc, L.: Sea level change in the Gulf of Thailand from GPS-corrected tide gauge data and multi-satellite altimetry, Global Planet. Change, 76, 137–151, 2011. a
Wang, D. P. and Mooers, C. N. K.: Coastal-trapped waves in a continuously stratified ocean, J. Phys. Oceanogr., 6, 853–863, 1976. a
Wang, D., Wang, W., Shi, P., Guo, P., and Gan, Z.: Establishment and adjustment of monsoon-driven circulation in the South China Sea, Sci. China Ser. D, 46, 173–181, https://doi.org/10.1360/03yd9016, 2003. a, b
Wang, Y., Fang, G., Wei, Z., Qiao, F., and Chen, H.: Interannual variation of the South China Sea circulation and its relation to El Niño, as seen from a variable grid global ocean model, J. Geophys. Res.-Oceans, 111, C11S14, https://doi.org/10.1029/2005JC003269, 2006. a, b
Weare, B. C., Navato, A. R., and Newell, R. E.: Empirical Orthogonal Analysis of Pacific Sea Surface Temperatures, J. Phys. Oceanogr., 6, 671–678, https://doi.org/10.1175/1520-0485(1976)006<0671:EOAOPS>2.0.CO;2, 1976. a
Wyrtki, K.: Scientific Results of marine investigations of the South China Sea and the Gulf of Thailand 1959–1961, Tech. Rep. 164–169, University of California at San Diego, 1961. a, b, c, d, e, f
Yanagi, T. and Takao, T.: Clockwise Phase Propagation of Semi-Diurnal Tides in the Gulf of Thailand, J. Oceanogr., 54, 143–150, 1998. a, b, c, d, e, f, g, h, i, j
Yanagi, T., Sachoemar, S. I., Takao, T., and Fujiwara, S.: Seasonal Variation of Stratification in the Gulf of Thailand, J. Oceanogr., 57, 461–470, 2001. a, b, c, d, e, f
Yin, L., Qiao, F., and Zheng, Q.: Coastal-Trapped Waves in the East China Sea Observed by a Mooring Array in Winter 2006, J. Phys. Oceanogr., 44, 576–590, https://doi.org/10.1175/JPO-D-13-07.1, 2014. a, b
Yu, Y., Emery, W. J., and Leben, R. R.: Satellite altimeter derived geostrophic currents in the western tropical Pacific during 1992–1993 and their validation with drifting buoy trajectories, J. Geophys. Res.-Oceans, 100, 25069–25085, https://doi.org/10.1029/95JC02146, 1995. a
Zhou, J., Li, P., and Yu, H.: Characteristics and mechanisms of sea surface height in the South China Sea, Global Planet. Change, 88–89, 20–31, 2012. a, b