the Creative Commons Attribution 4.0 License.
the Creative Commons Attribution 4.0 License.
 | 06 Dec 2023
Delayed-mode reprocessing of in situ sea level data for the Copernicus Marine Service
Jue Lin-Ye
Begoña Pérez Gómez
Alejandro Gallardo
Fernando Manzano
Marta de Alfonso
Elizabeth Bradshaw
Angela Hibbert
The number of tide gauges providing coastal sea level data has significantly increased in recent decades. They help in the issue of coastal hazard warnings, in the forecasting (indirectly through models) of storm surges and tsunamis, and in operational oceanography applications. These data are automatically quality controlled in near-real time in the Copernicus Marine Service. A new initiative seeks to provide delayed-mode reprocessed data for the Copernicus Marine Service by developing a new product and upgrading the software used in its automated quality control. Several new modules, such as buddy checking or the detection of attenuated data, are implemented. The new product was launched in November of 2022. The entire reprocessing is discussed in detail. An example of the information that can be extracted from the delayed-mode reprocessed product is also given.
- Article
(3222 KB) - Full-text XML
- BibTeX
- EndNote


Sea level has long been in the public spotlight for being one major indicator of climate change. It is now an essential ocean variable1. Remote and in situ (non-remote) observations show that the sea level rise has been accelerating in recent decades (Nerem et al., 2018; Dangendorf et al., 2019). It raises concerns about a corresponding increase in the magnitude, frequency, and impact of coastal extreme events (Vousdoukas et al., 2018; Kirezci et al., 2020; Almar et al., 2021). Tide gauge data are an essential source of information to understand the contribution of different physical processes to sea level variations at different timescales. Therefore, reliable delayed-mode reprocessed sea level data are crucial for the validation of hindcasting and forecasting ocean models for both short-term forecasts and long-term climatic studies.
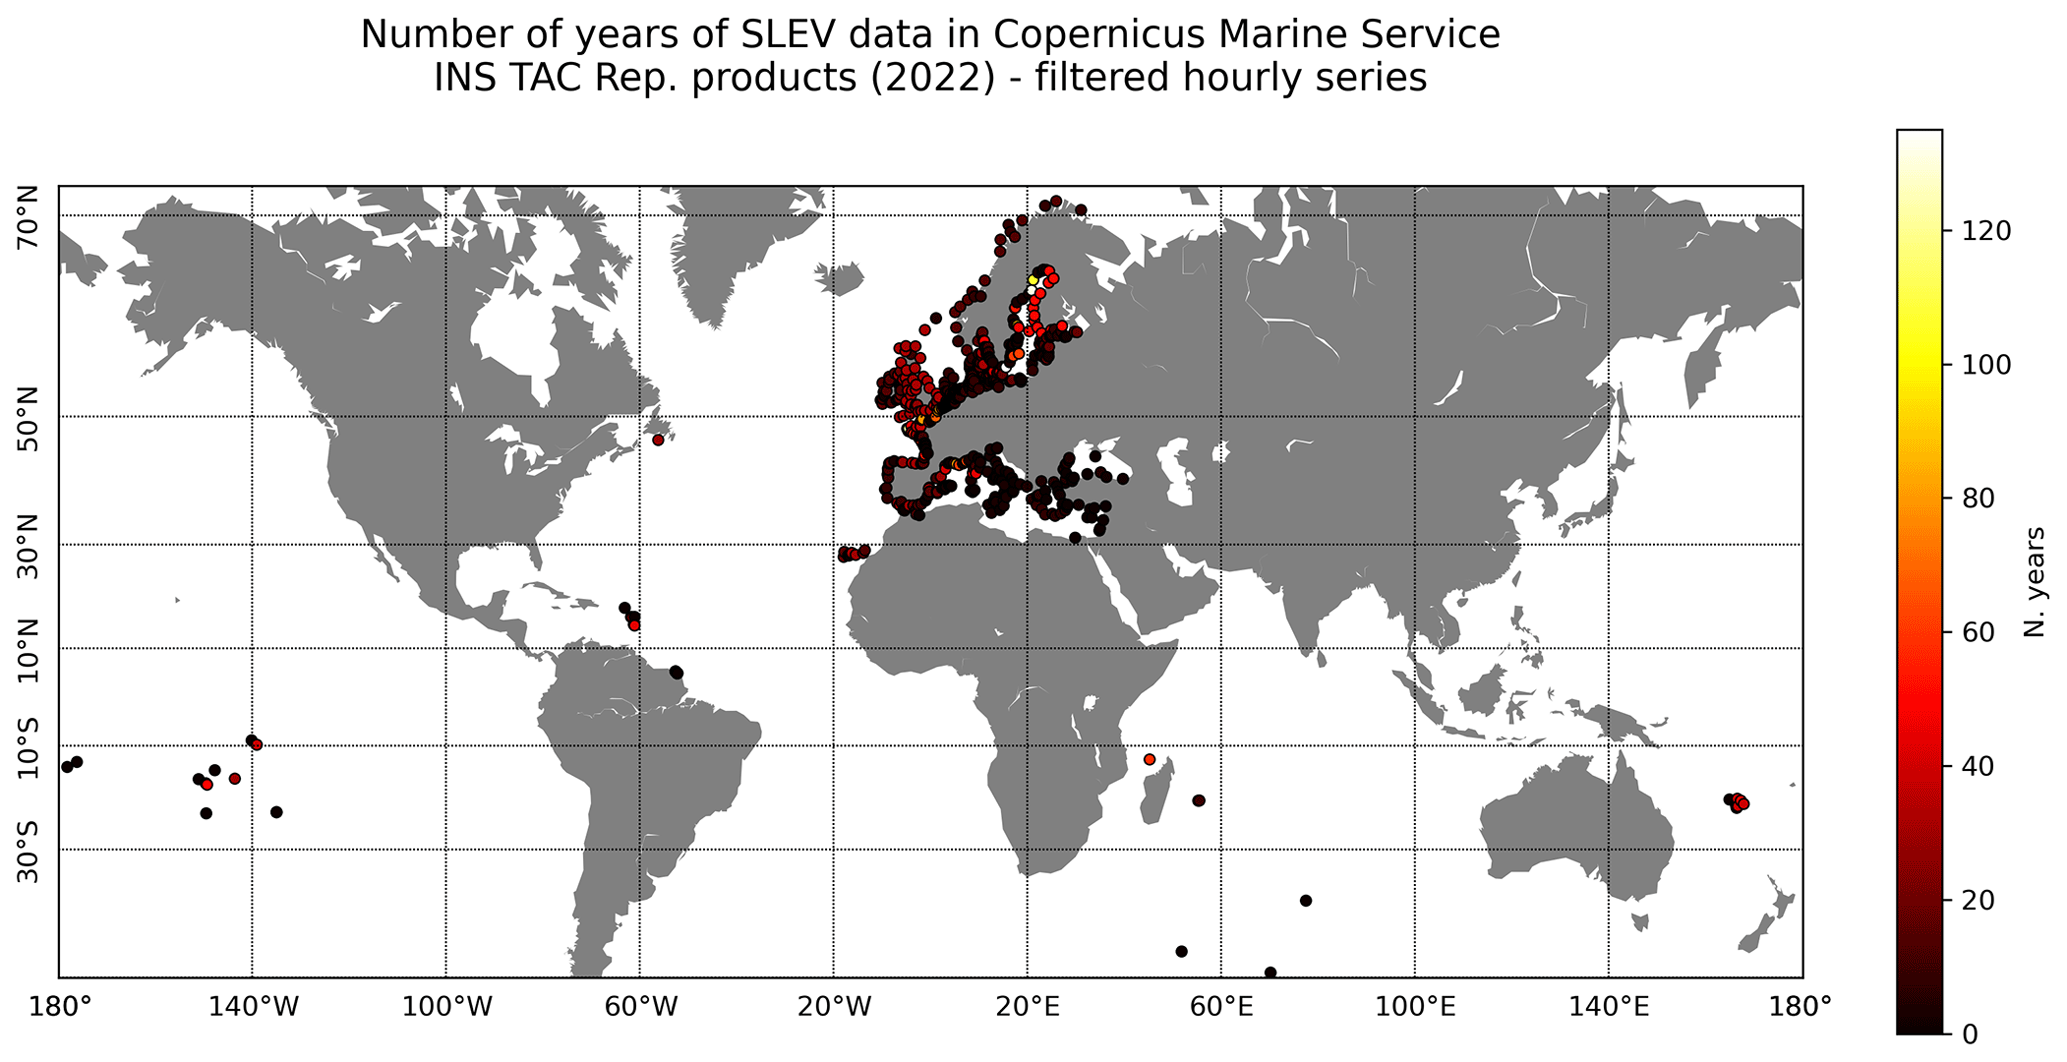
Figure 1Time series length of tide gauges that are included in the reprocessed product, first released in November of 2022.
In the past, the quality controlling of sea level measurements heavily relied on expert visual inspection, mainly done at the national level by tide gauge network operators. This is still a key part of the process, but the community has increasingly adopted automation to detect low-quality data more quickly and exhaustively (IOC, 2020), both in near-real-time (NRT) and delayed mode, depending on the application. Likewise, expert knowledge, ruled by physical formulation, can be partially translated into machine language. The combination of automation and an efficient algorithm can minimise the total cost of the quality control and can make it possible to apply quality controlling to a large network of thousands of tide gauge stations. Up to now, automatic quality controlling was applied in NRT for in situ sea level data in the Copernicus Marine In Situ Thematic Assembly Centre (INS TAC). However, a more comprehensive and exhaustive quality controlling in delayed mode, including additional tests and validation methods of historical time series, was not performed at a centralised site for the generation of a higher-quality dataset in this service (Sea Level Reprocessed or Multi-Year product). This is essential to ensure a more reliable use of these data for scientific applications, including aggregation into existing datasets that download data from the INS TAC (EuroSea project: Deliverable 3.3), and this is the main achievement of the new product described in this paper, especially for those hundreds of stations where this reprocessing and validation of the historical time series are not available or done at the national level.
The Copernicus Marine Service provides regular and systematic reference information on the physical and biogeochemical ocean and sea-ice state for the global ocean and the European region seas (Le Traon, 2019; Copernicus Marine In Situ TAC Data Management Team, 2021). Four key application areas of the Copernicus Marine Service are as follows:
-
maritime safety
-
marine resources
-
marine and coastal environments
-
weather, seasonal forecasting, and climate.
Observations are used by Copernicus Marine Service Thematic Assembly Centres (TACs) to provide high-level data products, as well as by Copernicus Marine Service Monitoring and Forecasting Centres (MFCs) to validate and constrain their global and regional ocean analysis and forecasting systems. The sources for the data can be satellites or in situ observations.
The Copernicus Marine Service In Situ Thematic Assembly Center (INS TAC) is the main interface between the Copernicus Marine Service and the global, regional, and coastal in situ observing networks. It collects, processes, and carries out the quality controlling of the upstream in situ data, required to both constrain and directly validate modelling and data assimilation systems and to directly serve downstream applications and services. The in situ network includes the network of tide gauges, argos, research vessels, moorings, gliders, and surface drifters, among other methods of measurement. The in situ observations are for sea level, waves, temperature, salinity, currents, chlorophyll, oxygen, nutrients, pH, and fugacity of CO2. The INS TAC delivers NRT products that are available within 24 h, having completed automatic quality processing, as well as scientifically assessed reprocessed products.
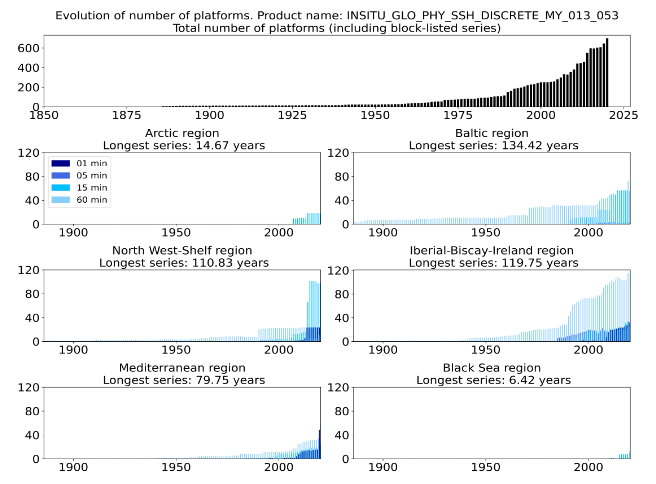
Figure 2Evolution of the number of tide gauges per year in the Copernicus Marine Service INS TAC. The figure includes the series that span less than 1 year at the end of 2020. Product name: INSITU_GLO_PHY_SSH_DISCRETE_MY_013_053.
Until November of 2022, the tide gauges only provided NRT data products, while a sea level delayed-mode reprocessed product was pending. This functionality is also unavailable, until this date, in other major databases, such as the Global Extreme Sea Level Analysis (GESLA, which aggregates existing NRT data in INS TAC) and the Global Sea Level Observing System (GLOSS), which rely on national providers' efforts in quality controlling and processing. There is, currently, a contract under way to deliver this delayed-mode reprocessed sea level product for the Copernicus Marine Service (Product User Manual, 2022; Quality Information Document, 2022). A first release was made in November of 2022. Its product and the software used to carry out the quality controlling at that moment are described herein. The spatial coverage consists mostly of European waters at this moment (Fig. 1). The most veteran tide gauges are in the Baltic and the Iberian–Biscay–Irish regions. Some of these stations still operate and offer series of over 100 years.
The time series used in this product span a myriad of periods. Some Baltic stations started operating in 1886, whereas dozens of others were installed as late as 2019 (Fig. 2). The newer sensors have different precisions, which tend to be in millimetres, compared to older sensors, used at some point in the century-long series, that can have a precision of centimetres. Following the Baltic area, more tide gauges were successively installed in the Iberian–Biscay–Irish region; the Mediterranean region; the Arctic; the North West shelf; and, more recently, the Black Sea region (Fig. 2). Most NRT data in the Mediterranean basin had series shorter than 1 year as of 2020. New tide gauges are being installed in Turkey and other eastern Mediterranean countries. Some geographically non-European islands also contribute, at the global level, to this product.
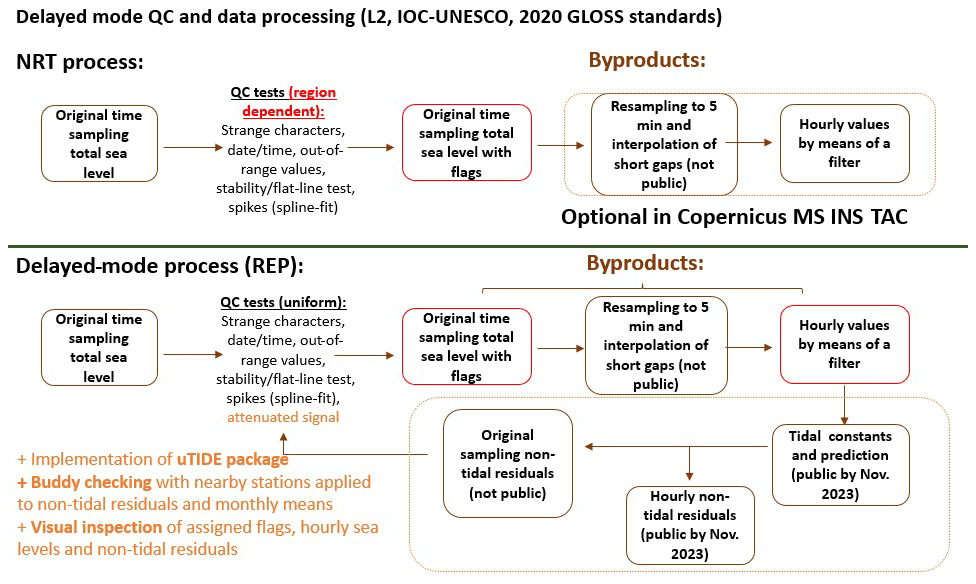
The NRT process (Fig. 3) in Copernicus takes total sea levels at the original time sampling (as measured by the tide gauges), applies an automatic quality control test, and flags sea level data points where appropriate. These series are transformed into an intermediate, 5 min sampled format, where short gaps (below or equal to 27 min) are interpolated. Then, a Pugh filter (Pugh, 1987) is applied to produce hourly sea levels. In the Copernicus Marine Service, the original, automatically flagged total sea level and the hourly filtered total sea level are both available as NRT products.
The quality controlling of tide gauge time series is performed with the SEa LEvel NEar-real-time (SELENE) quality control processing software (Puertos del Estado, 2019). The original software was created in the 1990s, based on the Fortran 77 programming language and C-Shell scripts. It included quality controlling, filtering to hourly values, and computation of non-tidal residuals. The NRT service (every 15 min) in the Copernicus Marine Service now uses the SELENE software adapted to Python language.
The SELENE software follows best practices, as defined by GLOSS (IOC, 2020). In NRT, it applies the L1 quality control level, as defined by the IOC (2020), including out-of-range spike detection and stability tests. The quality controlling of SELENE software uses a series of station configuration parameters. These are the maximum and minimum total and de-tided sea levels; the degree of the polynomial for spike detection, as well as the size of the window of time to be fit to the polynomial; the maximum standard deviation allowed for the non-spike data; and the limit for the stuck data (data that keep being constant for an abnormally long time) to start to constitute such (that is, once the data are constant for as long as the limit time, they are considered to be stuck).
Prior to the launch of the NRT operational service, a sensitivity test was carried out on tide gauges from Puertos del Estado. The data in the test had a sampling of 1 min. The polynomial used for the total sea levels was optimal at 2∘, the best window size was 200 points (sampling points), and the maximum standard deviation was equal to 4. The polynomial used for de-tided sea levels was optimal at 3∘, the best window size was 500 points, and the maximum standard deviation was equal to 5. The limit for stuck data was equal to 10 points. The limits for the maximum and minimum total sea levels and the de-tided sea levels were given by an expert for each tide gauge. This set of criteria was extended to the Iberian–Biscay–Irish region in the NRT automatised quality control in the Copernicus Marine Service.
The original de-tiding module of SELENE is based on the Foreman tidal prediction package in Fortran 77 (Foreman, 1977). The de-tided sea level observations facilitate quality controlling since tidal variations often dominate a sea level record, making subtle errors more difficult to detect. On the contrary, bad data can easily present as abrupt changes in the non-tidal residual while being told apart from the real extreme surges, which evolve more gradually. The corrected time series were then used to improve the sea level forecasts of the Nivmar sea level forecasting system of Puertos del Estado (Álvarez-Fanjul et al., 2001; Pérez Gómez et al., 2013). This was performed by means of a nudging technique, still operational today. However, the de-tiding module is only available in internal reprocessing in Puertos del Estado; it is not yet applied in the operational NRT mode in the Copernicus Marine Service in situ NRT product as it requires the computation of yearly tidal constants at each station in the Copernicus Marine Service.
The interest of international tide gauge communities (such as the Copernicus Marine Service, GLOSS, and EuroGOOS Tide Gauge Task Team) was in the SELENE software – first used in the Copernicus Marine Service as the NRT quality control of total sea level – being a modern, open-source (Python), and well-documented format. It had to be multi-platform (Linux, MacOS, and Windows), and it is now used by some regions in the Copernicus Marine Service INS TAC and by some national providers for purposes outside the Copernicus system.
The delayed-mode reprocessing follows a similar procedure as the NRT process (Fig. 3). The products (https://doi.org/10.48670/moi-00307) available in the first release of November 2022 comprise quality-controlled versions of the original series of total sea level and the hourly filtered series of sea level. These products end in December 2020 and are available for the 639 stations that were operational by that time. The series that, by December of 2020, presented less than 1 year of data were excluded (Fig. 1). The reprocessed product has been assigned with corresponding metadata to better identify the product from each station. An updated version of the SELENE software, developed in 2022, is used for the automated quality control. The reprocessing is complemented by visual inspection. The reprocessing can more accurately flag the bad or dubious data than the NRT product, which can only rely on automated quality controlling of a short moving time window (a few days), applied every 15 min. With the new tests implemented for delayed mode in the first release of this product, the reprocessing flags 1.9 % of the sea level data as bad or dubious data, whereas the NRT automated quality control flagged about 0.3 % of the sea level measurements as bad or dubious data. In some tide gauges, the total sea level is already reprocessed by national providers. In this case, the data mode is read from the source metadata of each sea level file and recorded as a station configuration parameter. When the data mode is reprocessed, the original flagging is assumed to be correct, although some further automated and visual quality controlling is carried out by default.
The upgraded SELENE software contains a series of new modules. The changes can, in their turn, improve the NRT quality control. A new version of the de-tiding module had been incorporated into Python language. The corresponding Python package is called uTide (Codiga, 2011), also based upon Foreman. It is used by other authors, such as Mélet et al. (2021), for tide gauge data reprocessing. uTide accepts non-uniform sampling frequencies. This flexibility proves to be handy since some time series uploaded to the Copernicus Marine Service are not entirely uniform in terms of sampling intervals. Astronomical constants are given for each year where large gaps (>0.5 week) add up to less than 1 month. Also,
for all months, where A is the monthly amplitude of the M2 tidal component. If a year does not comply with these conditions and if astronomical constants are not computed for that year, the de-tiding process can borrow the constants from up to 3 years prior to or later than that year for its computation.
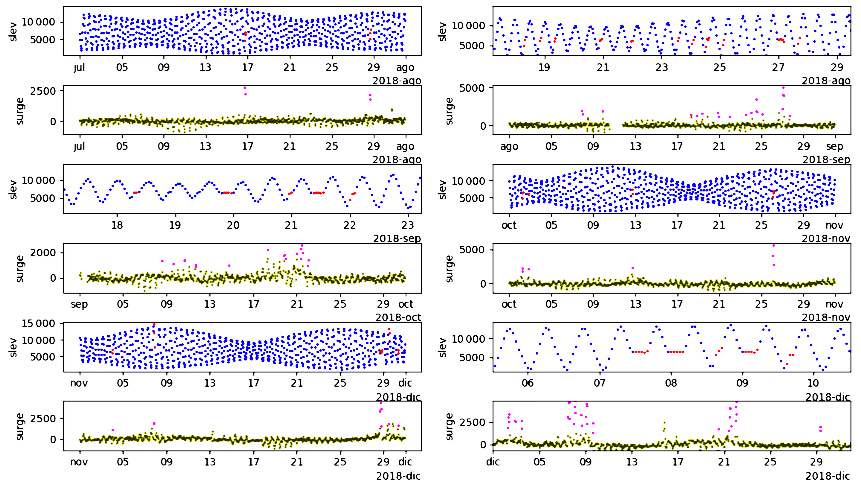
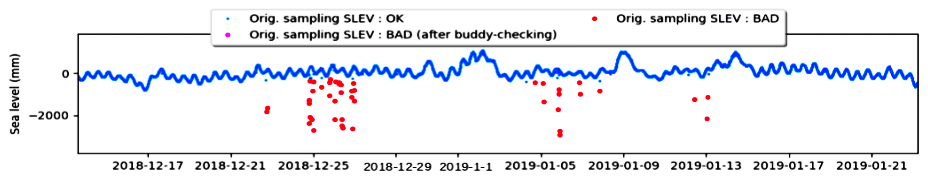
Figure 4Example of detection of bad data in the total sea level (slev, in millimetres) with the help of de-tided sea level (surge, in millimetres). Subplots for the total sea level in August, September, and December are zoomed-in on to see the detection of bad data. Bad data are shown in red for the total sea level and in pink for the de-tided sea level.
Hourly de-tided sea level and astronomical tide for the Iberian–Biscay–Irish region will be available as delayed-mode reprocessed products in the Copernicus Marine Service by November 2023. Neither of them contain the non-astronomical tide. That is, cyclical fluctuation of the sea level that are generated by non-astronomical phenomena. The de-tided sea level can, internally, help pinpoint anomalous behaviour, such as in Fig. 4. These small errors are not easily detectable by visual inspection, and this automation can significantly reduce workload. Other issues detectable with de-tided sea levels are clock malfunction and datum changes when combined with visual inspection.
A new module added to the SELENE software is the buddy checking, applied to hourly de-tided sea levels and monthly mean sea levels. It has been implemented to compare the target station to neighbouring stations within a range of 0.01∘ (approximately 1 km). Another module is the detection of attenuated data. The attenuated data are easily detectable by a human, but it is difficult to have a machine tell these data apart from neap tides. Neap tides are more centred around the mean water level of the sea level, and attenuation usually presents itself as a fluctuation around a value far away from the mean water level. Specific testing is carried out to set the parameters and the criteria to tell the two cases apart. Because of the level of complication of the specific criteria, the reader may refer to the Product User Manual.
Finally, a sensitivity test was carried out to calibrate the station configuration parameters used by SELENE in the tide gauges in the Copernicus Marine Service. A unified criterion for station configuration parameters is created. It is designed to be further used in other regions of the planet. The limits for the maximum and minimum total sea levels are the mean water level plus or minus the 99th percentile of the total sea level in the whole time series. The limits for the maximum and minimum de-tided sea levels are the same as for the total sea level, but the mean water level is set to be null as it is eliminated from the data during de-tiding. The polynomial, used to detect spikes in the total sea level is 2∘; the maximum standard deviation allowed for non-spikes is equal to 3. The window size of total sea level data to be fitted to the polynomial depends on the frequency of sampling. The greater the sampling frequency, the more the elements that should be within the window (see Product User Manual for details). The window for fitting de-tided sea levels is double that of the window for total sea levels. This is because the total sea level has cyclicities caused by astronomical tides, whereas the de-tided sea level does not have such cyclicity. These customised parameters can improve the performance of SELENE by successfully detecting spikes, even in difficult cases (Fig. 5).
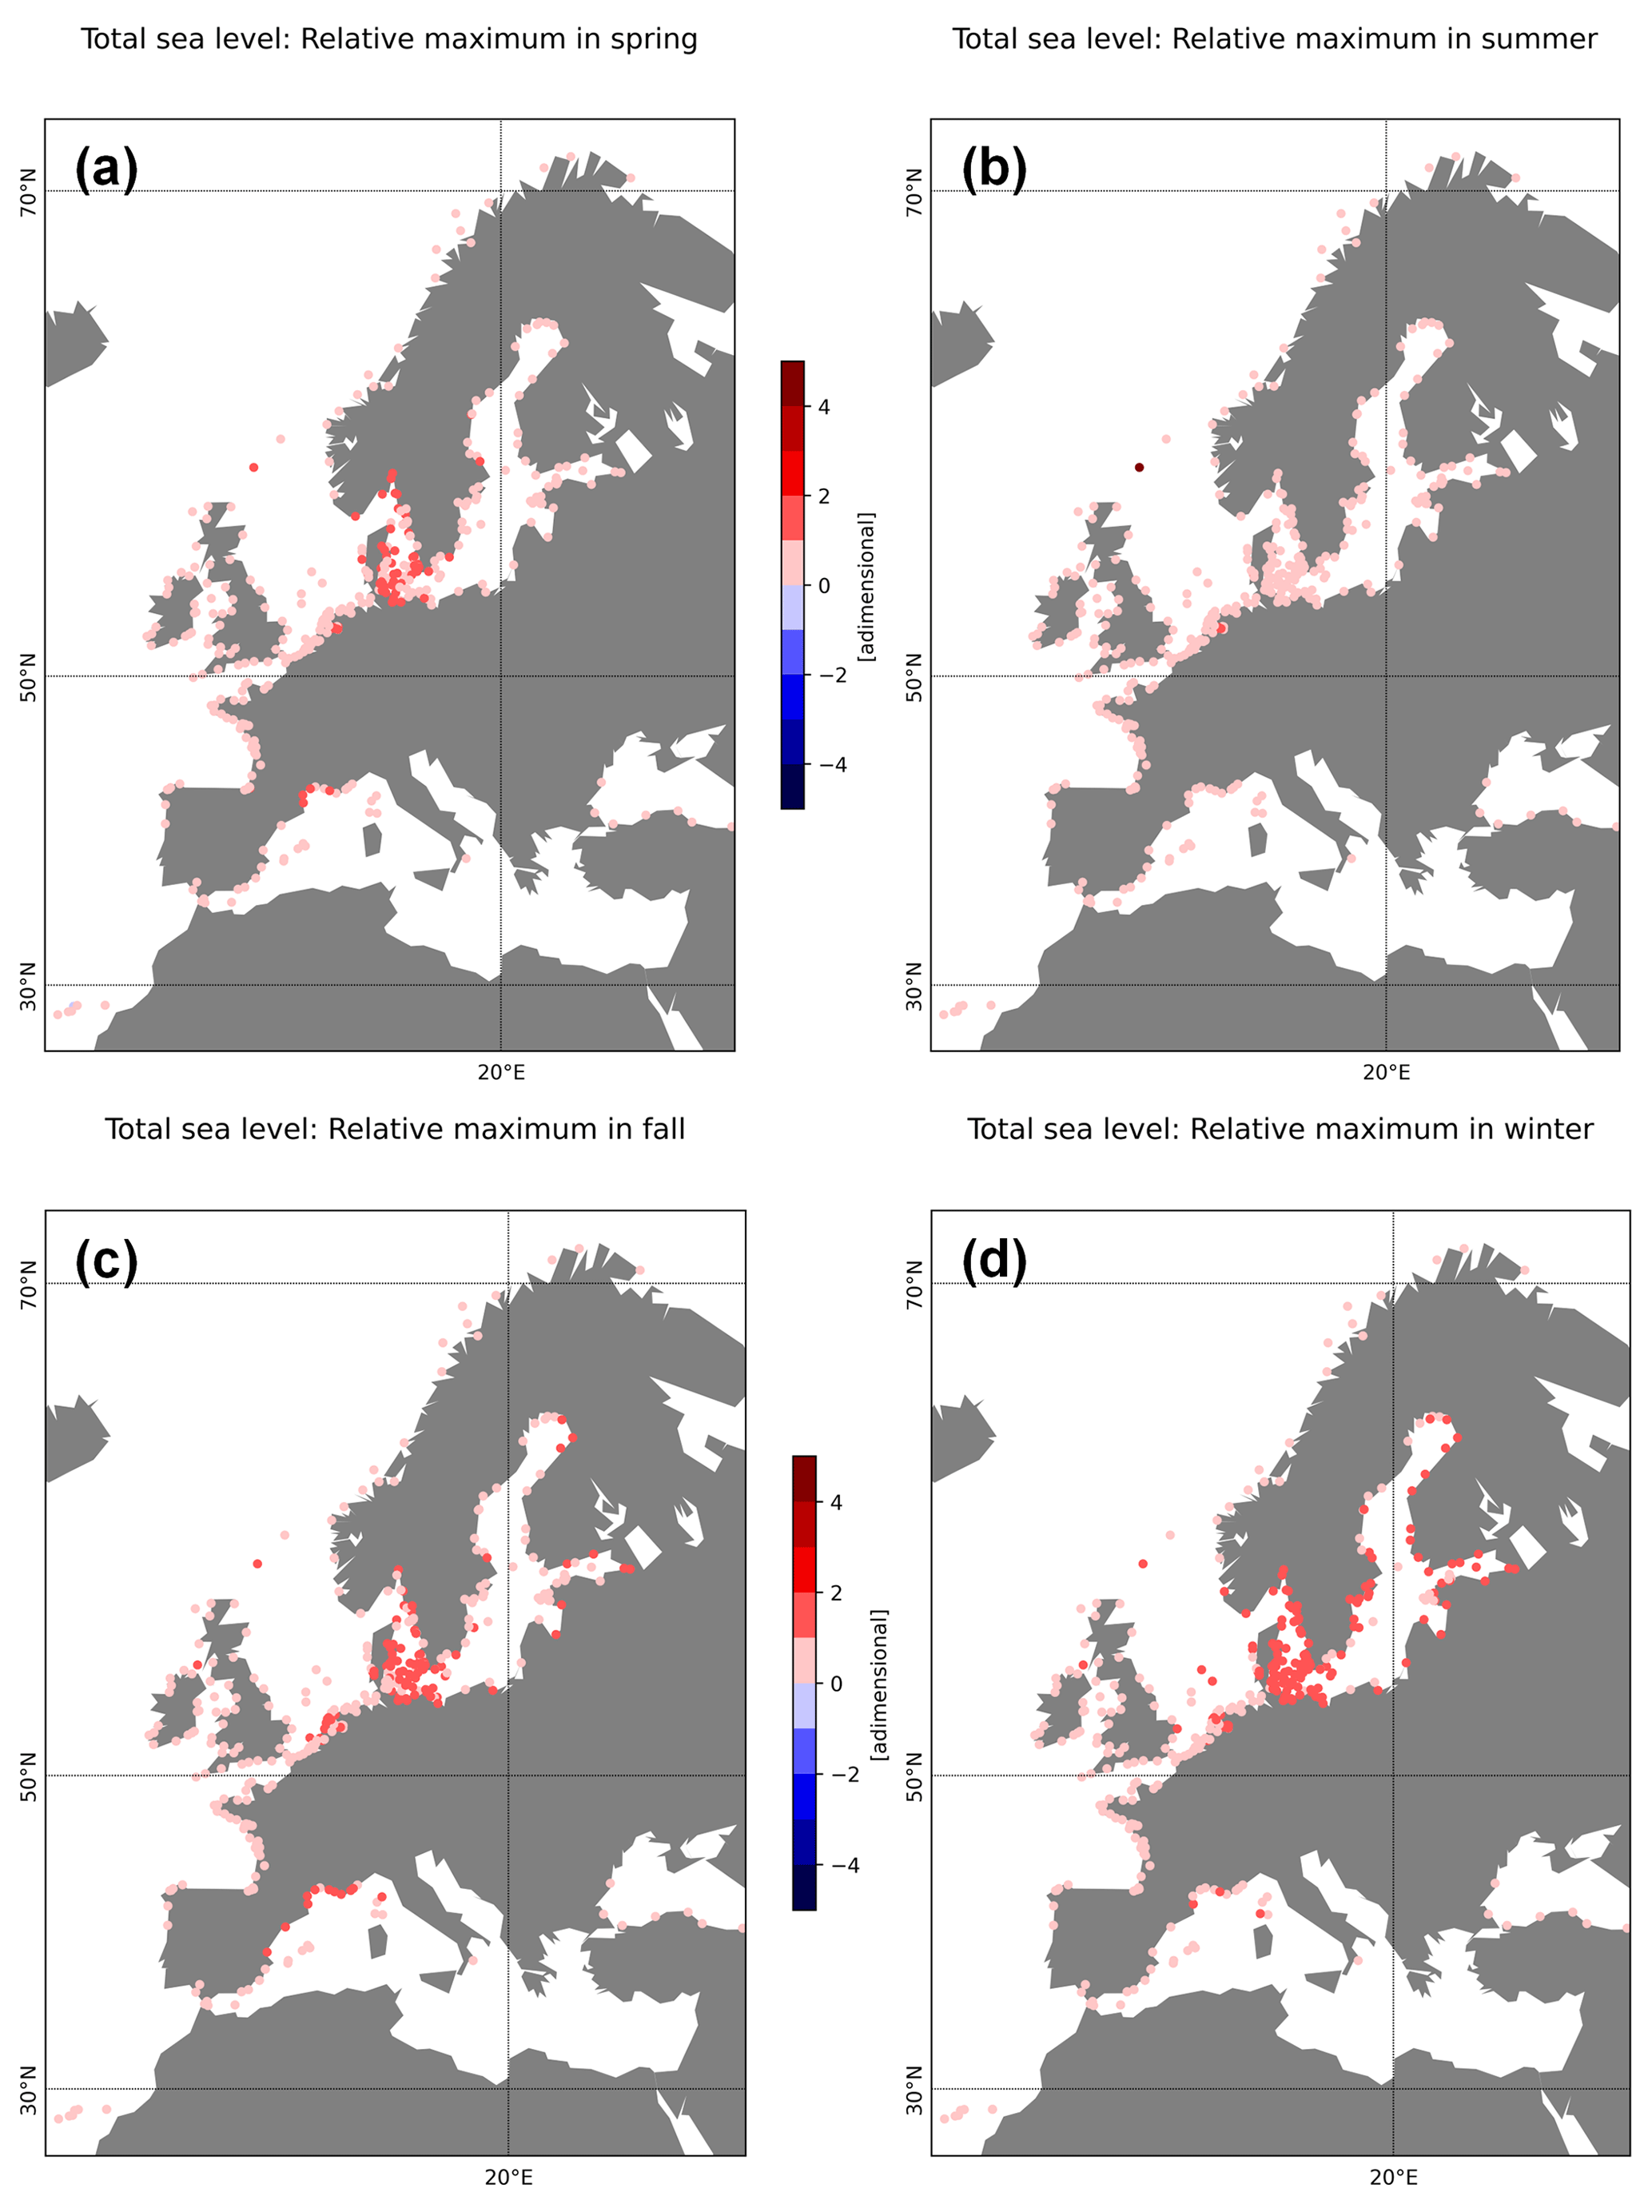
Figure 6Relative maximum sea levels (maximum sea levels at each station divided by the corresponding tidal range) in each season.
The limit for stuck data starts with 10 points. Then, the limit can be more lax in the case of reduced precision (in centimetres instead of millimetres) or when the data are flagged as stuck in over 50 % of the total time series. This situation is commonplace for older tide gauges. If, despite the modifications to the limit of stuck data, the total sea level is still being flagged often during a visual inspection, the time series can be classified as having many stuck or too many stuck. In this case, the limit can be further modified depending on the sampling frequency (Product User Manual).
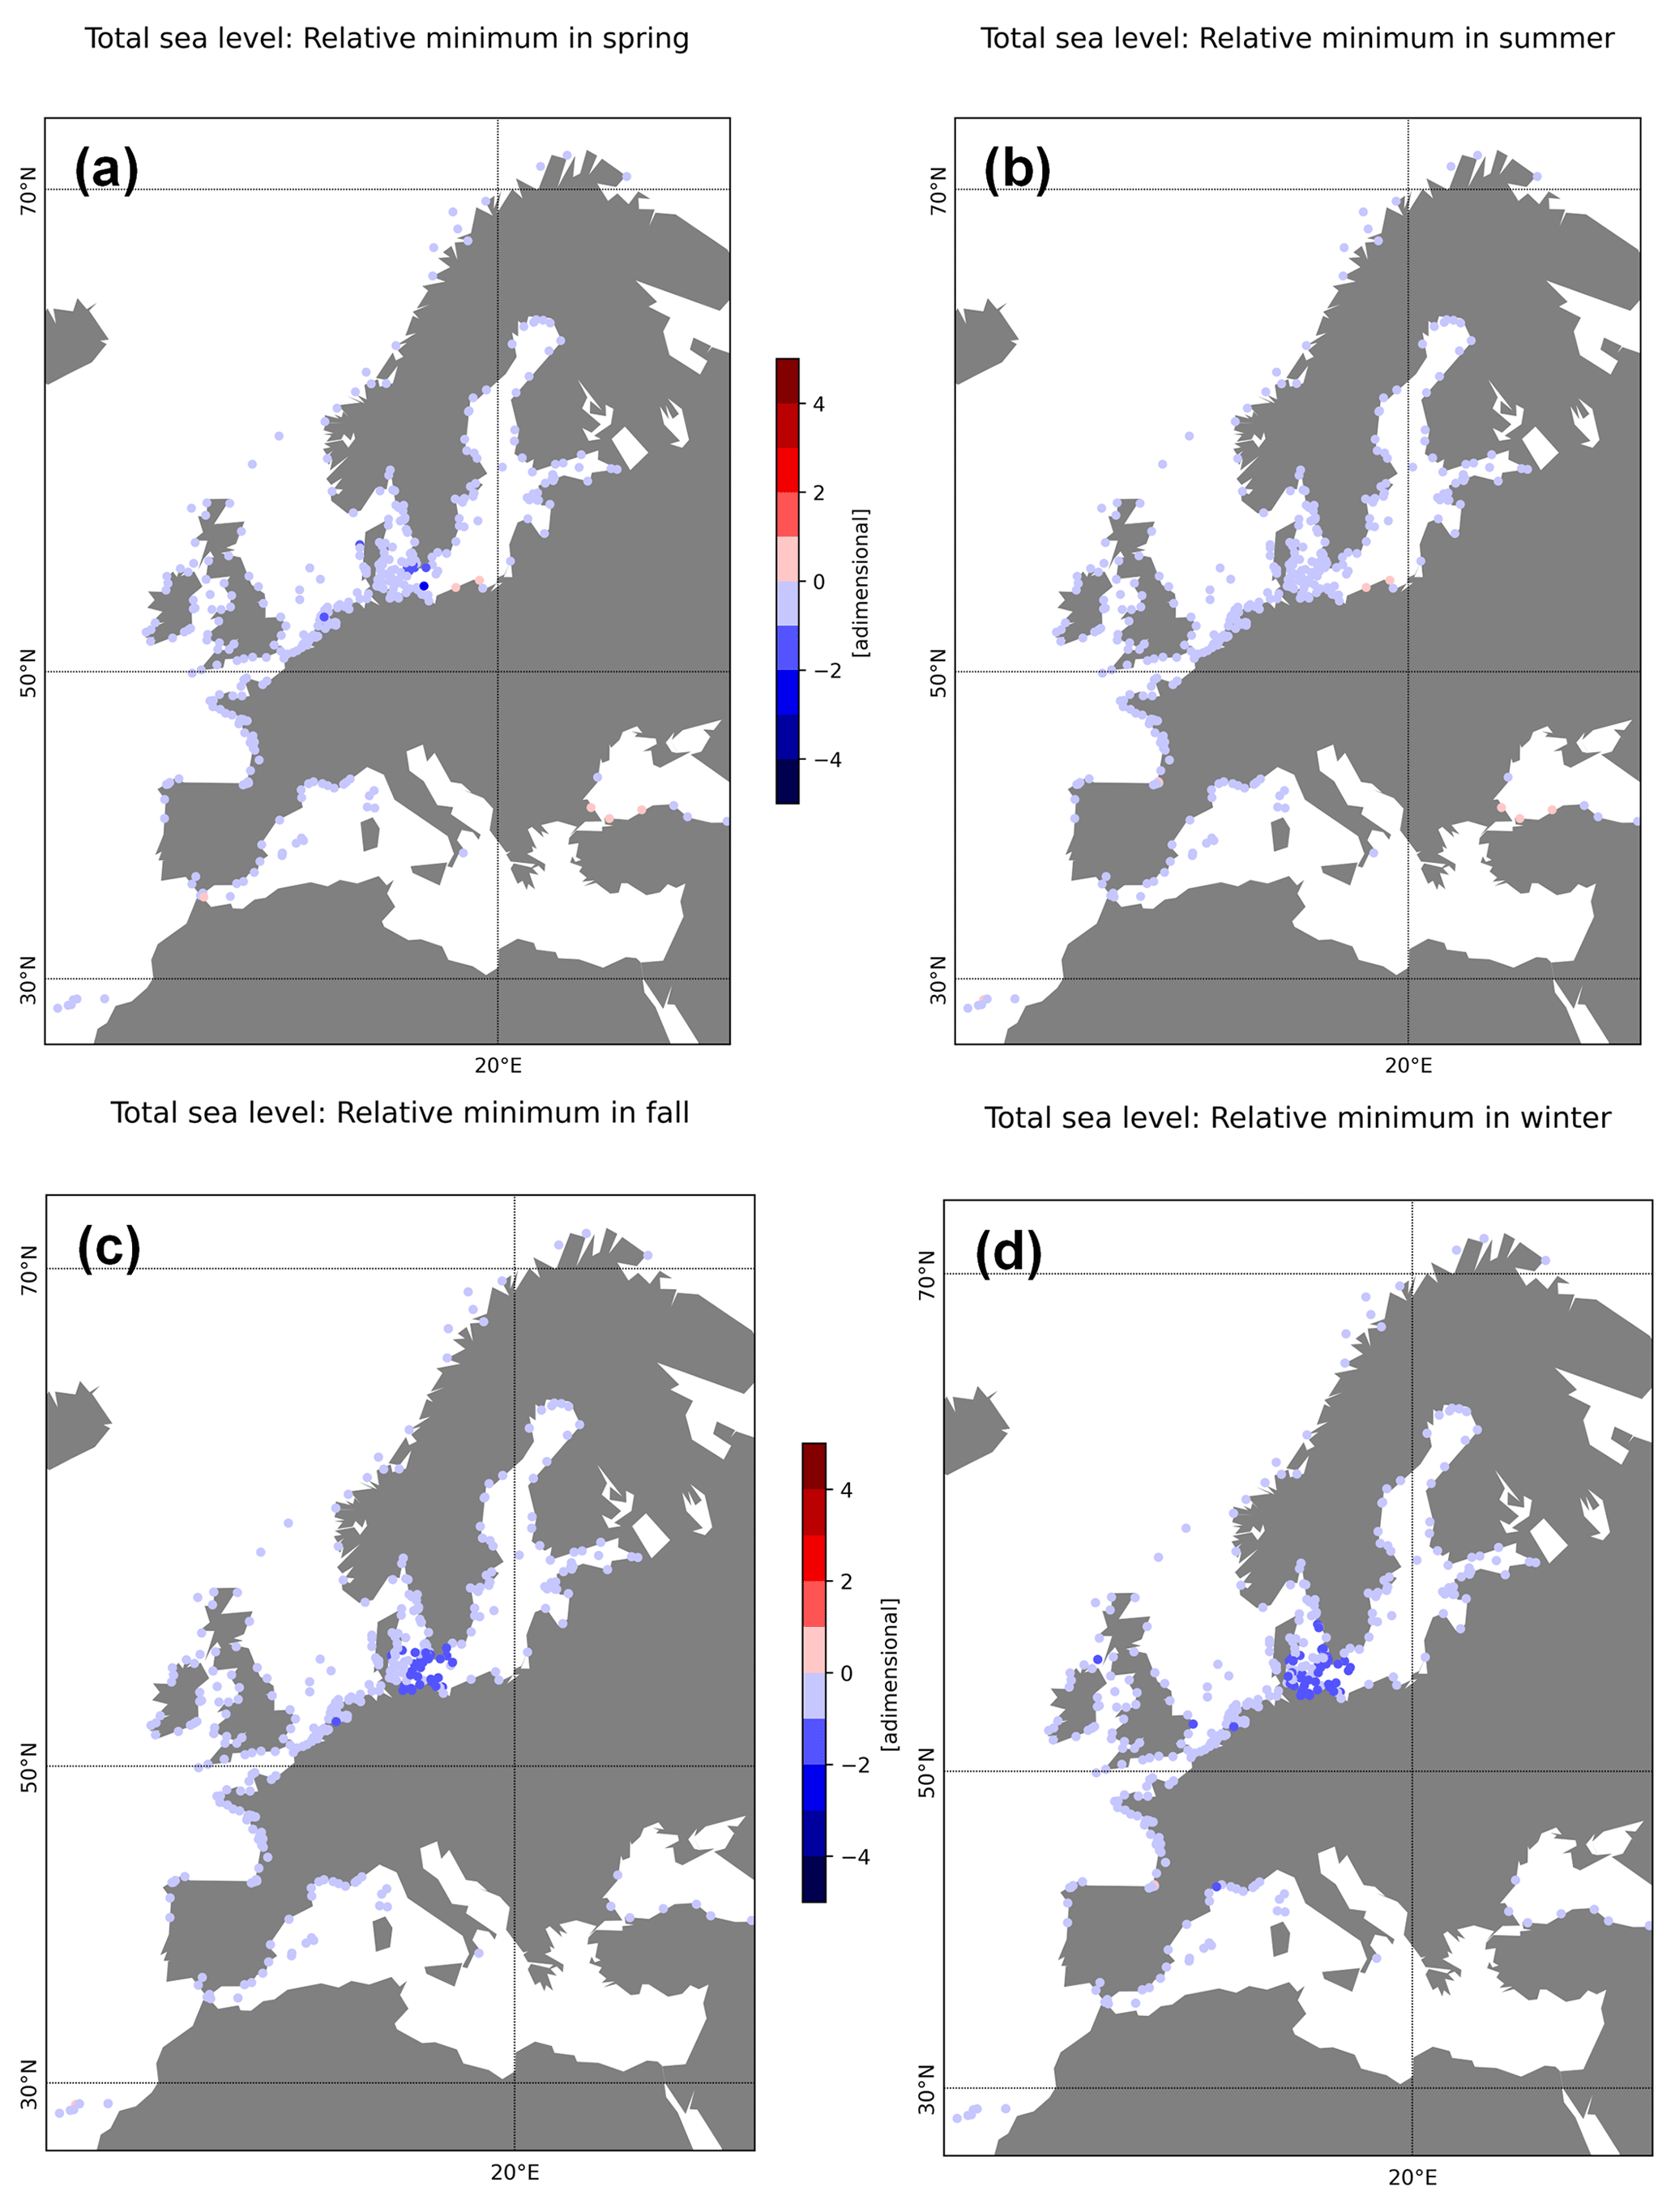
Figure 7Relative minimum sea levels in each season.
The processing speed of the first Python version of the SELENE software (currently used in the NRT service) was slower than that of the original Fortran 77 code in Puertos del Estado. The software was only computationally possible with a time window of 15 min, the one used for NRT quality controlling. However, the reprocessing of extensive series in a delayed-mode reprocessed product was very costly. In the upgrade of the SELENE software, the computational cost of the Python-based algorithm has been reduced 10-fold. One change is that, while the version of SELENE used in the NRT process dealt with every time t to find spikes, the delayed-mode reprocessing starts the detection of spikes only in specific cases. The increment of data at the time t must be larger than 100 mm and greater than the following value:
where slevmax and slevmin are the maximum and minimum total sea levels.
The reprocessed total sea level product has many applications for scientists and coastal stakeholders. As an example, seasonal extreme water levels can be computed, normalised (divided) by the tidal range. Seasonal relative maximum sea levels derived in this way could help highlight regions most at risk of flooding. Alternatively, seasonal relative lowest water levels can also be useful to remind harbours to keep their maintenance on schedule and to ensure that their channels have enough draft for ships to circulate freely.
From hourly (filtered) total sea level, the maximum and minimum values for each season are computed. The values for all stations are scaled to share a single mean water level. These extreme sea level parameters are subsequently divided by the tidal range at each station in order to produce the relative extreme sea levels. The tidal range is computed as the difference between the 99th percentile and the 1st percentile of the whole time series. The relative maximum and minimum hourly total sea levels in each season are shown in Figs. 6 and 7, respectively. Note that the used series are the ones that, by December of 2020, presented a time interval longer than 1 year. Moreover, each series has a different length, as shown in Fig. 1.
According to the European Environment Agency (https://www.eea.europa.eu, last access: 15 February 2023) and to the reprocessed sea level data, the (absolute) highest water levels are in the Iberian–Biscay–Irish area and the North West shelf. The areas with the most extreme water levels are the British coasts in the Irish Sea, as well as the French coast in the English Channel, both near the Atlantic Ocean. Some high water levels are typical in the Frisian Sea, near the Germany–Denmark border. This area, too, is heavily influenced by the Atlantic Ocean. However, the Iberian–Biscay–Irish area and the North West shelf are geographically and technologically more prepared for such ranges of sea level since they are typically macro-tidal. Attention must be paid to micro-tidal and meso-tidal areas with large percentage increases in sea level, for small changes can induce floods in them.
The Strait of Kattegat (between the east coast of Denmark and the southwestern coast of Sweden, located at 56.82∘ N, 11.39∘ E) exhibits the highest relative sea levels in spring, autumn, and winter (Fig. 6). Furthermore, during autumn–winter, the phenomenon of high relative sea levels extends to the neighbouring Gulf of Bothnia (the gulf between Sweden and Finland, located at 62.33∘ N, 19.55∘ E). The Strait of Kattegat also presents the lowest relative sea levels in autumn and winter (see Fig. 7). The northwestern Mediterranean displays high relative sea levels in spring, autumn, and winter. It is known that some of these regions, like Barcelona, in the northwestern Mediterranean have a history of engineering challenges for coastal protection, like during Storm Gloria (Pérez Gómez et al., 2021). Similarly, Denmark and Sweden have taken steps to improve their protection against floods because of the historical flood in 1872 (Hallin et al., 2021; Fredriksson et al., 2018). The upgrades were not always based on engineering but also on changes in the structure of the economic system and insurance policies, among others. Much more information can be drawn from the reprocessed sea level data. All this will improve communication between stakeholders.
The Copernicus delayed-mode reprocessed sea level product is crucial for the validation of ocean models for both short-term forecasts and long-term climatic studies (reanalysis). The quality of the data can determine both the veracity of the conclusions and the correctness of the decisions to be taken. The Copernicus Marine System already has a service of operational automated quality controlling of NRT data, which detects spikes, stuck data and among other errors. It uses a software called SELENE.
The delayed-mode reprocessed product described here was first made available in November of 2022 and was obtained by applying an upgraded version of SELENE software in delayed mode, including additional tests and visual inspection of the whole time series by an expert in sea level data. The upgrade includes an adaptation of the de-tiding module from Fortran 77 to Python language, the implementation of the buddy checking of hourly de-tided and monthly mean sea levels, the detection of attenuated data, and the creation of a criterion for determining the station configuration parameters used in the quality controlling. The criterion was obtained after carrying out sensitivity tests on each module of the SELENE software, such as the spike detection test and the stuck-data test, intended to be applied to the whole planet. The upgrade to SELENE has increased the ability of automatically flagging bad data by 1.6 % as compared to the automated quality controlling in the NRT process. The computational cost of the upgraded software is also 10 times lower if comparing the shared modules. This faster speed is possibly due to, in part, the pre-selection of data to apply spike detection.
The new delayed-mode sea level product is of major interest for the scientific community and other data aggregators using INS TAC sea level data and more broadly for coastal and local decision makers, such as coastal engineers intensively using tide gauges data to design coastal and port infrastructures. It is also an added-value product for those regions or countries where quality controlling of historical records is not performed at the national level. Product enhancements are planned, such as improvement of the geographical coverage, by including stations from the GLOSS network in 2024. Time extensions of the product to 6 months prior to the respective release will be regularly provided. Future goals for the reprocessing service include to compare monthly mean sea levels in relation to altimetry, as well as a feasibility study on the inclusion of vertical land motion corrections based on Global Navigation Satellite System (GNSS) receivers.
A version of the code is available at https://github.com/puertos-del-estado-medio-fisico/SELENE (Manzano et al., 2019).
The data are available at https://marineinsitu.eu/ (last access: November 2022).
JLY wrote the first version of the manuscript and created all figures. BPG supervised the new product and designed the reprocessing steps with support from AH and EB. BPG and FM created the SELENE software and JLY developed it further. JLY and AG reprocessed the sea level data available in Copernicus Marine Service. MdA, AG, FM and BPG worked on the data integration and dissemination in Copernicus Marine Service. BPG, MdA, EB and AH provided expert knowledge on ocean measurements and sea level. All of the authors contributed to the product development and reviewed the manuscript.
The contact author has declared that none of the authors has any competing interests.
Publisher’s note: Copernicus Publications remains neutral with regard to jurisdictional claims made in the text, published maps, institutional affiliations, or any other geographical representation in this paper. While Copernicus Publications makes every effort to include appropriate place names, the final responsibility lies with the authors.
We used the uTide Python package in the upgraded SELENE software. Many thanks to the developers for their help in solving the questions raised during the implementation of the tool.
The development of the SELENE software and the reprocessing of the sea level data in the Copernicus Marine Service have been carried out under contract no. 21001L07-COP-TAC INS-3100 by Copernicus.
This paper was edited by Anne Marie Treguier and reviewed by Laurent Testut and one anonymous referee.
Almar, R., Ranasinghe, R., Bergsma, E. W. J., Diaz, H., Mélet, A., Papa, F., Vousdoukas, M., Athanasiou, P., Dada, O., Almeida, L. P., and Kestenare, E.: A global analysis of extreme coastal water levels with implications for potential coastal overtoppping, Nat. Commun., 12, 3775, https://doi.org/10.1038/s41467-021-24008-9, 2021.
Codiga, D. L.: Unified tidal analysis and prediction using the UTide Matlab functions, PhD, https://doi.org/10.13140/RG.2.1.3761.2008, 2011.
Dangendorf, S., Hay, C., Calafat, F. M., Marcos, M., Piecuch, C. G., Berk, K., and Jensen, J.: Persistent acceleration in global sea-level rise since the 1960s, Nat. Clim. Change, 9, 705–710, 2019.
European Environment Agency: https://www.eea.europa.eu/data-and-maps/figures/mean-tidal-amplitude (last access: 1 August 2023), 2023.
EuroSea project: Deliverable 3.3: New Tide Gauge Data Flow strategy, https://eurosea.eu/download/eurosea-d3-3-new-tide-gauge-data-flow-strategy/?wpdmdl=3584&refresh=63eb77aad21ea1676375978 (last access: 24 July 2023), 2023.
Foreman, M. G. G.: Manual for tidal heights analysis and prediction, Pacific Marine Science Report 77–10, Institute for Ocean Sciences, Sydney, Canada, 1977.
Fredriksson, C., Martinez, G., Larson, M., and Eellend, B. F.: Using historical storms for flood risk management: the 1872 storm in south Sweden, RCC Perspec., 3, 11–18, 2018.
Hallin, C., Hofstede, J. L., Martinez, G., Jensen, J., Baron, N., Heimann, T., and Larson, M.: A comparative study of the effects of the 1872 storm and coastal flood risk management in Denmark, Germany, and Sweden, Water, 13, https://doi.org/https://doi.org/10.3390/w13121697, 2021.
IOC: Quality Control of in situ Sea Level Observations: A Review and Progress towards Automated Quality Control, Vol. 1, Paris, UNESCO, IOC Manuals and Guides No. 83, https://unesdoc.unesco.org/ark:/48223/pf0000373566 (last access: April 2022), 2020.
Kirezci, E., Young, I. R., Ranasinghe, R., Muis, S., Nicholls, R. J., Lincke, D., and Hinkel, J.: Projections of global-scale extreme sea levels and resulting episodic coastal flooding over the 21st Century, Nat. Sci. Rep., 10, 11629 https://doi.org/10.1038/s41598-020-67736-6, 2020.
Le Traon, P. Y., Reppucci, A., Alvarez Fanjul, E., Aouf, L., Behrens, A., Belmonte, M., and Zacharioudaki, A.: From observation to information and users: The Copernicus Marine Service perspective, Front. Mar. Sci., 6, 234, https://doi.org/10.3389/fmars.2019.00234, 2019.
Manzano, F., Gómez, B. P., and Lin-Ye, J.: SELENE, [code], https://github.com/puertos-del-estado-medio-fisico/SELENE, 2019.
Nerem, R. S., Beckley, B. D., Fasullo, J. T., Hamlington, B. D., Masters, D., and Mitchum, G. T.: Climate-change–driven accelerated sea-level rise detected in the altimeter era, P. Natl. Acad. Sci. USA, 115, 2022–2025, 2018.
Pérez Gómez, B., Álvarez Fanjul, E., Pérez, S., de Alfonso, M., and Vela, J.: Use of tide gauge data in operational oceanography and sea level hazard warning systems, J. Oper. Oceanogr., 6, 1–18, 2013.
Pérez Gómez, B., García-León, M., García-Valdecasas, J., Clementi, E., Mösso Aranda, C., Pérez-Rubio, S., and Álvarez Fanjul, E.: Understanding sea level processes during Western Mediterranean storm Gloria, Front. Mar. Sci., 8, 647437, https://doi.org/10.3389/fmars.2021.647437, 2021.
Pérez Gómez, B., Lin-Ye, J., Bradshaw, E., and Hibbert, A.: Issue 1.0, Puertos del Estado: SELENE: SEa LEvel NEar-real time quality control processing, Design & user's guide, version 1.0, 2019.
Pugh, D. T.: Tides, surges and mean sea level, 1987.
Quality Information Document, IN SITU TAC, INSITU_GLO_PHY_SSH_DISCRETE_MY_013_053, 2022.
Vousdoukas, M. I., Mentaschi, L., Voukouvalas, E., Verlaan, M., Jevrejeva, S., Jackson, L. P., and Feyen, L.: Global probabilistic projections of extreme sea levels show intensification of coastal flood hazard, Nat. Commun., 9, 2360 https://doi.org/10.1038/s41467-018-04692-w, 2018.
https://www.goosocean.org/index.php?option=com_content&view=article&id=14&Itemid=114I, last access: 1 March 2023
- Abstract
- Introduction
- The Copernicus Marine Service, the In Situ Thematic Centre (INS TAC), and the data dealt with in quality controlling
- The NRT: The NRT (L1) product and the SELENE software
- The delayed-mode: the reprocessed product (L2) and the upgraded SELENE software
- Possible applications
- Conclusions
- Code availability
- Data availability
- Author contributions
- Competing interests
- Disclaimer
- Acknowledgements
- Financial support
- Review statement
- References