the Creative Commons Attribution 4.0 License.
the Creative Commons Attribution 4.0 License.
 | 10 May 2022
Marine heatwaves in the Arabian Sea
Abhisek Chatterjee
Gouri Anil
Lakshmi R. Shenoy
Marine heatwaves (MHWs) are prolonged warm sea condition events that can have a destructive impact on marine ecosystems. The documentation of MHWs and assessment of their impacts is largely confined to a few regional seas or to global mean studies. The north Indian Ocean received almost no attention in this regard despite the fact that this ocean basin, particularly the Arabian Sea, has been warming at the most rapid pace among the other tropical basins in recent decades. This study shows the characteristics of MHW events for the Arabian Sea during 1982–2019. Our analysis shows that the duration (frequency) of MHWs exhibits a rapidly increasing trend of ∼20 d per decade (1.5–2 events per decade) in the northern Arabian Sea and the southeastern Arabian Sea close to the west coast of India, which is a multifold increase in MHW days (frequency) from the 80s. Notably, since the beginning of the satellite record, the years 2010 and 2016 have exhibited the maximum number of heatwave days when more than 75 % of days of the pre-monsoon and summer monsoon season experience heatwaves. The accelerated trend of the heatwave days is found to be driven by the rapid rise in the mean sea surface temperature (SST) of the Arabian Sea in the recent decade. Moreover, longer heatwave days are also associated with dominant climate modes. Among them, the Indian Ocean Basin Mode via the decaying phase of El Niño is the most influential mode contributing to more than 70 %–80 % of observed heatwave days in this basin. Further analysis of the most prolonged observed heatwave during April–June 2010 indicates that surface heat flux associated with the weaker latent heat loss and the shallow mixed layer was the primary cause of this event. Further, we note that the pre-monsoon cyclonic storms in the Arabian Sea often contribute to the waning of such heatwaves in the basin.
- Article
(10808 KB) - Full-text XML
- BibTeX
- EndNote


Sea surface temperature (SST) shows significant variability over a large spectrum of frequencies in space and time across the globe. However, there are times when extremes of such variability occur, causing severe stress to the local ecosystem and economies driven by such ecosystems. These warmer than normal extreme ocean conditions are referred to as Marine heatwaves (MHWs) and are defined as prolonged anomalously warm ocean conditions exceeding a pre-defined threshold (Pearce et al., 2011; Hobday et al., 2016). The term “Marine heatwave” was first coined to describe the Ningaloo Niño off the western coast of Australia during spring 2011 (Feng et al., 2013). These extreme warm events are shown to be responsible for widespread coral bleaching (Feng et al., 2013; Hughes et al., 2017), loss of Kelp forest off the coast of Australia and New Zealand (Wernberg et al., 2017; Thomsen et al., 2019), reduction in seagrass meadows (Arias-Ortiz et al., 2018), and widespread harmful algal blooms (Trainer et al., 2020). Further, these events have also been shown to impact economically important fishery industries in the northwest Atlantic (Mills et al., 2013), northeast Pacific (Cavole et al., 2016), and coastal Australia (Caputi et al., 2016). Owing to their devastating nature, MHWs and their generating mechanisms have received a lot of attention in the recent decade. Studies of major MHWs that appeared in various parts of the world over the last decade suggest that the evolution and the forcing mechanisms of such events differ considerably from region to region and predominantly depend on the local air–sea coupling, atmospheric conditions, oceanic preconditions, and remote climatic teleconnections (Holbrook et al., 2019; Oliver et al., 2021). For example, a persistent large-scale positive atmospheric pressure anomaly ridge caused unprecedented warm SST in the northeastern Pacific during 2013–2016 with anomalies exceeding more than 3 ∘C (Bond et al., 2015; Lorenzo and Mantua, 2016). A similar mechanism was at play during the summer of 2003 in the Mediterranean Sea (Olita et al., 2007) and in the Tasman Sea during the summer of 2017/2018 off the coast of New Zeeland (Salinger et al., 2019). On the other hand, advection of warm water was found to be a major driver for the widespread MHW along the western coast of Australia in 2011 (Feng et al., 2013), in the tropical ocean around Australia in 2015/2016 (Benthuysen et al., 2018), southeast of Australia in the Tasman Sea during 2015/2016 (Oliver et al., 2017), and off the coast of California (Durazo and Baumgartner, 2002). Climate variabilities also play a significant role in modulating MHWs in the tropical/extratropical oceans (Holbrook et al., 2019). Among them, the El Niño–Southern Oscillation (ENSO) is shown to be the dominant climate mode that influences MHW occurrence and duration in the tropical Pacific (Holbrook et al., 2020). In the Indian Ocean, the positive phase of ENSO (Roxy et al., 2014; Chakravorty et al., 2014; Swapna et al., 2014), Indian Ocean Basin Mode (Klein et al., 1999; Du et al., 2009), and Indian Ocean Dipole mode (Saji et al., 1999; Chowdary and Gnanaseelan, 2007) favour warming of SST in large parts of the basin. In the extratropics, on the interannual timescale, MHWs in the northeast Pacific are primarily associated with the positive phase of Pacific Decadal Oscillation (PDO). However, in the longer timescale, the Pacific Decadal Oscillation and North Pacific Gyre Oscillation (NPGO) contribute to the genesis of heatwaves (Lorenzo and Mantua, 2016). On the other hand, the North Atlantic Oscillation (NAO) shows strong associations with the MHWs of the northwest Atlantic (Scannell et al., 2016).
Notably, over the last few decades, the Indian Ocean, particularly the Arabian Sea, has seen rapid warming at a rate much faster than in the other tropical basins (Levitus et al., 2012). This warming not only shows a negative influence on the primary productivity of the Arabian Sea (Roxy et al., 2016) but also influences a shift in the phytoplankton community from diatoms to Noctiluca scintillans in the northern Arabian Sea (Goes et al., 2020), reduced rainfall in the Indian subcontinent (Roxy et al., 2015) and increased flooding on the Indian mainland (Ajayamohon and Suryachandra, 2008). Moreover, the frequency of cyclogenesis in the Arabian Sea has increased over the last few decades, primarily believed to be driven by this rapid rise in the SST (Murakami et al., 2020; Deshpande et al., 2021). However, the impact of persistent MHW on this enhanced cyclogenesis is yet to be explored. While the understanding of the genesis of MHWs across the globe has advanced rapidly over the last decade, there are not many studies to document these events in the northern Indian Ocean. In a recent study, Saranya et al. (2022) discussed the genesis of MHWs in the western Arabian Sea and in the northern Bay of Bengal during summer and their connection to the Indian summer monsoon.
Further, the southeastern Arabian Sea and the northern Arabian Sea are economically very important as they constitute one of the major fishing zones in the Arabian Sea. As per the recent report from Central Marine Fisheries Research Institute, India (CMFRI, 2007), total fish landing from the Indian exclusive economic zones (EEZs) was 2.49×10⁶ t during 2001–2005, and of this, 67 % of the catch was from the eastern Arabian Sea (Shankar et al., 2018). Hence, like other parts of the global ocean, MHWs in this region are very likely significantly influencing the local marine ecosystem, the migration of species, and the associated fishery-dependent economy. Therefore, documenting and understanding the genesis of MHWs in the Arabian Sea, particularly in the coastal oceans that possess significant economic importance, is necessary for better predicting these MHWs and assessing their impacts on this region. Hence, in this study, we document MHWs in the Arabian Sea with a particular emphasis on the coastal waters close to the west coast of India and try to decipher the possible physical mechanisms that influence the genesis of such heatwaves in this region. Section 2 describes the data we use and the model configuration, experiments, and forcing. The observed trends in the MHWs are discussed in Sect. 3. The influence of the SST trend and the variabilities are given in Sect. 4. In Sect. 5, the impact of various climate modes is discussed. In Sect. 6, the role of different physical processes for the heatwaves during 2010 is presented as a case study. Finally, Sect. 7 summarizes our main results and discusses the possible implications of this study.
2.1 Sea surface temperature and MHW detection
To detect MHWs for the Arabian Sea, we have used daily NOAA OISST version 2 (Reynolds et al., 2007). The SST data are analysed for the period of 1982–2019 available on a grid. The MHW detection tool heatwaveR package (Schlegel and Smit, 2018) is used for MHW detection. This tool uses the MHW definition based on Hobday et al. (2016) and characterizes an MHW as an anomalous, warm, discrete event prolonged for more than 5 continuous days with SST higher than a particular threshold. The threshold is defined from a fixed seasonal climatological baseline with warmer SST above the 90th percentile of the daily variability. Two consecutive events within 3 d are regarded as a single event. The climatological baseline is defined based on a fixed 30-year period 1982–2011. This seasonally varying threshold allows heatwave events to occur at any season across the year. In order to understand the MHW characteristics, three heatwave metrics are evaluated here: MHW duration is defined as the days between the start and end dates of an event; MHW intensity refers to maximum SST anomaly during an event; and MHW frequency is calculated based on the number of events occur during a season or year.
2.2 Ocean model
The model used in the present study is an ocean general circulation model based on the Modular Ocean Model version 5 (MOM5; Griffies, 2012). The model configuration uses a hydrostatic and Boussinesq approximation. Model coordinates are discretized based on generalized orthogonal coordinates in the horizontal and z* coordinates in the vertical. The model domain extends from 30–120∘ E and 30∘ S–30∘ N with a uniform horizontal resolution of and 40 z* levels in the vertical. The model bathymetry is based on Sindhu et al. (2007), with a minimum depth set to 15 m. The horizontal mixing is based on Griffies and Hallberg (2000), and the vertical mixing scheme is based on Large et al. (1994). The horizontal friction is set to the lowest value to keep the model stable. The temperature and salinity fields are relaxed to climatological values (Chatterjee et al., 2012) with a timescale of 30 d within the 4∘ sponge layer at the open eastern and southern boundaries. Salinity at the surface is restored with a relaxation of 15 d. To realistically simulate the cross basin flow, the narrow Palk strait between India and Sri Lanka is closed in this model (Chatterjee et al., 2013, 2017).
2.2.1 Model experiments and forcing
The model is initially spun-up for 35 years from a state of rest, and then the interannual run was carried out for 1990–2018 using the restart state of the ocean from the final-year simulation of the climatological run. For forcing the model, daily surface momentum fluxes (zonal and meridional wind stress) and surface heat fluxes (shortwave radiation, longwave radiation, air temperature, and 2 m specific humidity) are obtained from Tropflux data (Praveen et al., 2012, 2013). The precipitation and surface air pressure are obtained from the NCEP reanalysis product (Kalnay et al., 1996). The monthly climatological river discharge is based on Vörösmarty et al. (1996) and Papa et al. (2010) and is introduced over the top 15 m of the water column. The model is extensively validated for the north Indian Ocean in earlier studies (Chatterjee et al., 2013, 2019; Shankar et al., 2016, 2018; Vijith et al., 2016; Lakshmi et al., 2020). In order to analyse the model-simulated anomaly for each variable, this 29-year interannual simulation is used to calculate a climatological field.
2.2.2 Mixed-layer heat budget
In order to understand the dominant physical forcing in the genesis of MHWs, a volume-averaged mixed-layer heat budget analysis has been carried out using the temperature and velocity fields taken from the model simulation. The mixed-layer temperature tendency over the time-varying mixed layer and fixed region of area A is given by
where T is the SST, t is time, and the overbar represents volume averaged over the region A and within the time-varying mixed-layer depth h. AdvH is the horizontal advection of temperature, Q is the net surface heat flux corrected for shortwave penetration below the surface mixed layer, ρCP is the specific heat capacity of seawater, w represents the vertical velocity, and kv is the vertical eddy diffusivity. The vertical advection and diffusion together represent subsurface processes that influence mixed-layer temperature.
Figure 1 shows the trend of various MHW characteristics of the Arabian Sea (north of 5∘ N). Annually, the number of MHW days increased significantly over the entire Arabian Sea (Fig. 1a). The northern Arabian Sea and the southern Arabian Sea show the strongest annual increasing trend with a rate of ∼3 d yr−1. A similar increasing trend is also noticeable in the Persian Gulf and the Gulf of Aden, two marginal seas connected to the Arabian Sea. The rest of the Arabian Sea, including the coastal water of India, shows an annual increase in the MHW days at a rate of 1.5–2 d yr−1. We find that the pre-monsoon or spring intermonsoon (PRM; March–April–May) and the summer monsoon (SWM; June–July–August–September) seasons constitute most of the marine heatwave days observed annually across the years, with about 60 % of heatwaves days occurring during these two seasons in the Arabian Sea. This is the time when the north Indian Ocean sees rapid warming (SST can reaches close to 31 ∘C) as the Inter-Tropical Convergence Zone (ITCZ) moves to the Northern Hemisphere over the Indian landmasses (Joseph, 1990; Vinayachandran and Shetye, 1991; Shenoi et al., 1999; Chatterjee et al., 2012). Notably, the trends of the heatwave days show marked spatial contrast between the two seasons (Fig. 1d and g). During the PRM season, the strongest trend is primarily limited to the northern Arabian Sea along the coast of Pakistan, the northwestern coast of India (coast of Gujarat and Maharastra), and the western boundary of the Arabian Sea along the coast of Arabia and Somalia. In comparison, the rest of the Arabian Sea does not show any notable increase in heatwave days. On the other hand, during SWM, a significant increase in heatwave days is observed in the southeastern Arabian Sea, particularly all along the west coast of India. Additionally, the northern Arabian Sea continues to show a significant increasing trend similar to the PRM season but limited mainly along the coast of Iran, Pakistan, and the northeast coast of India. The western Arabian Sea does not show any significant trend in heatwave days during this season.
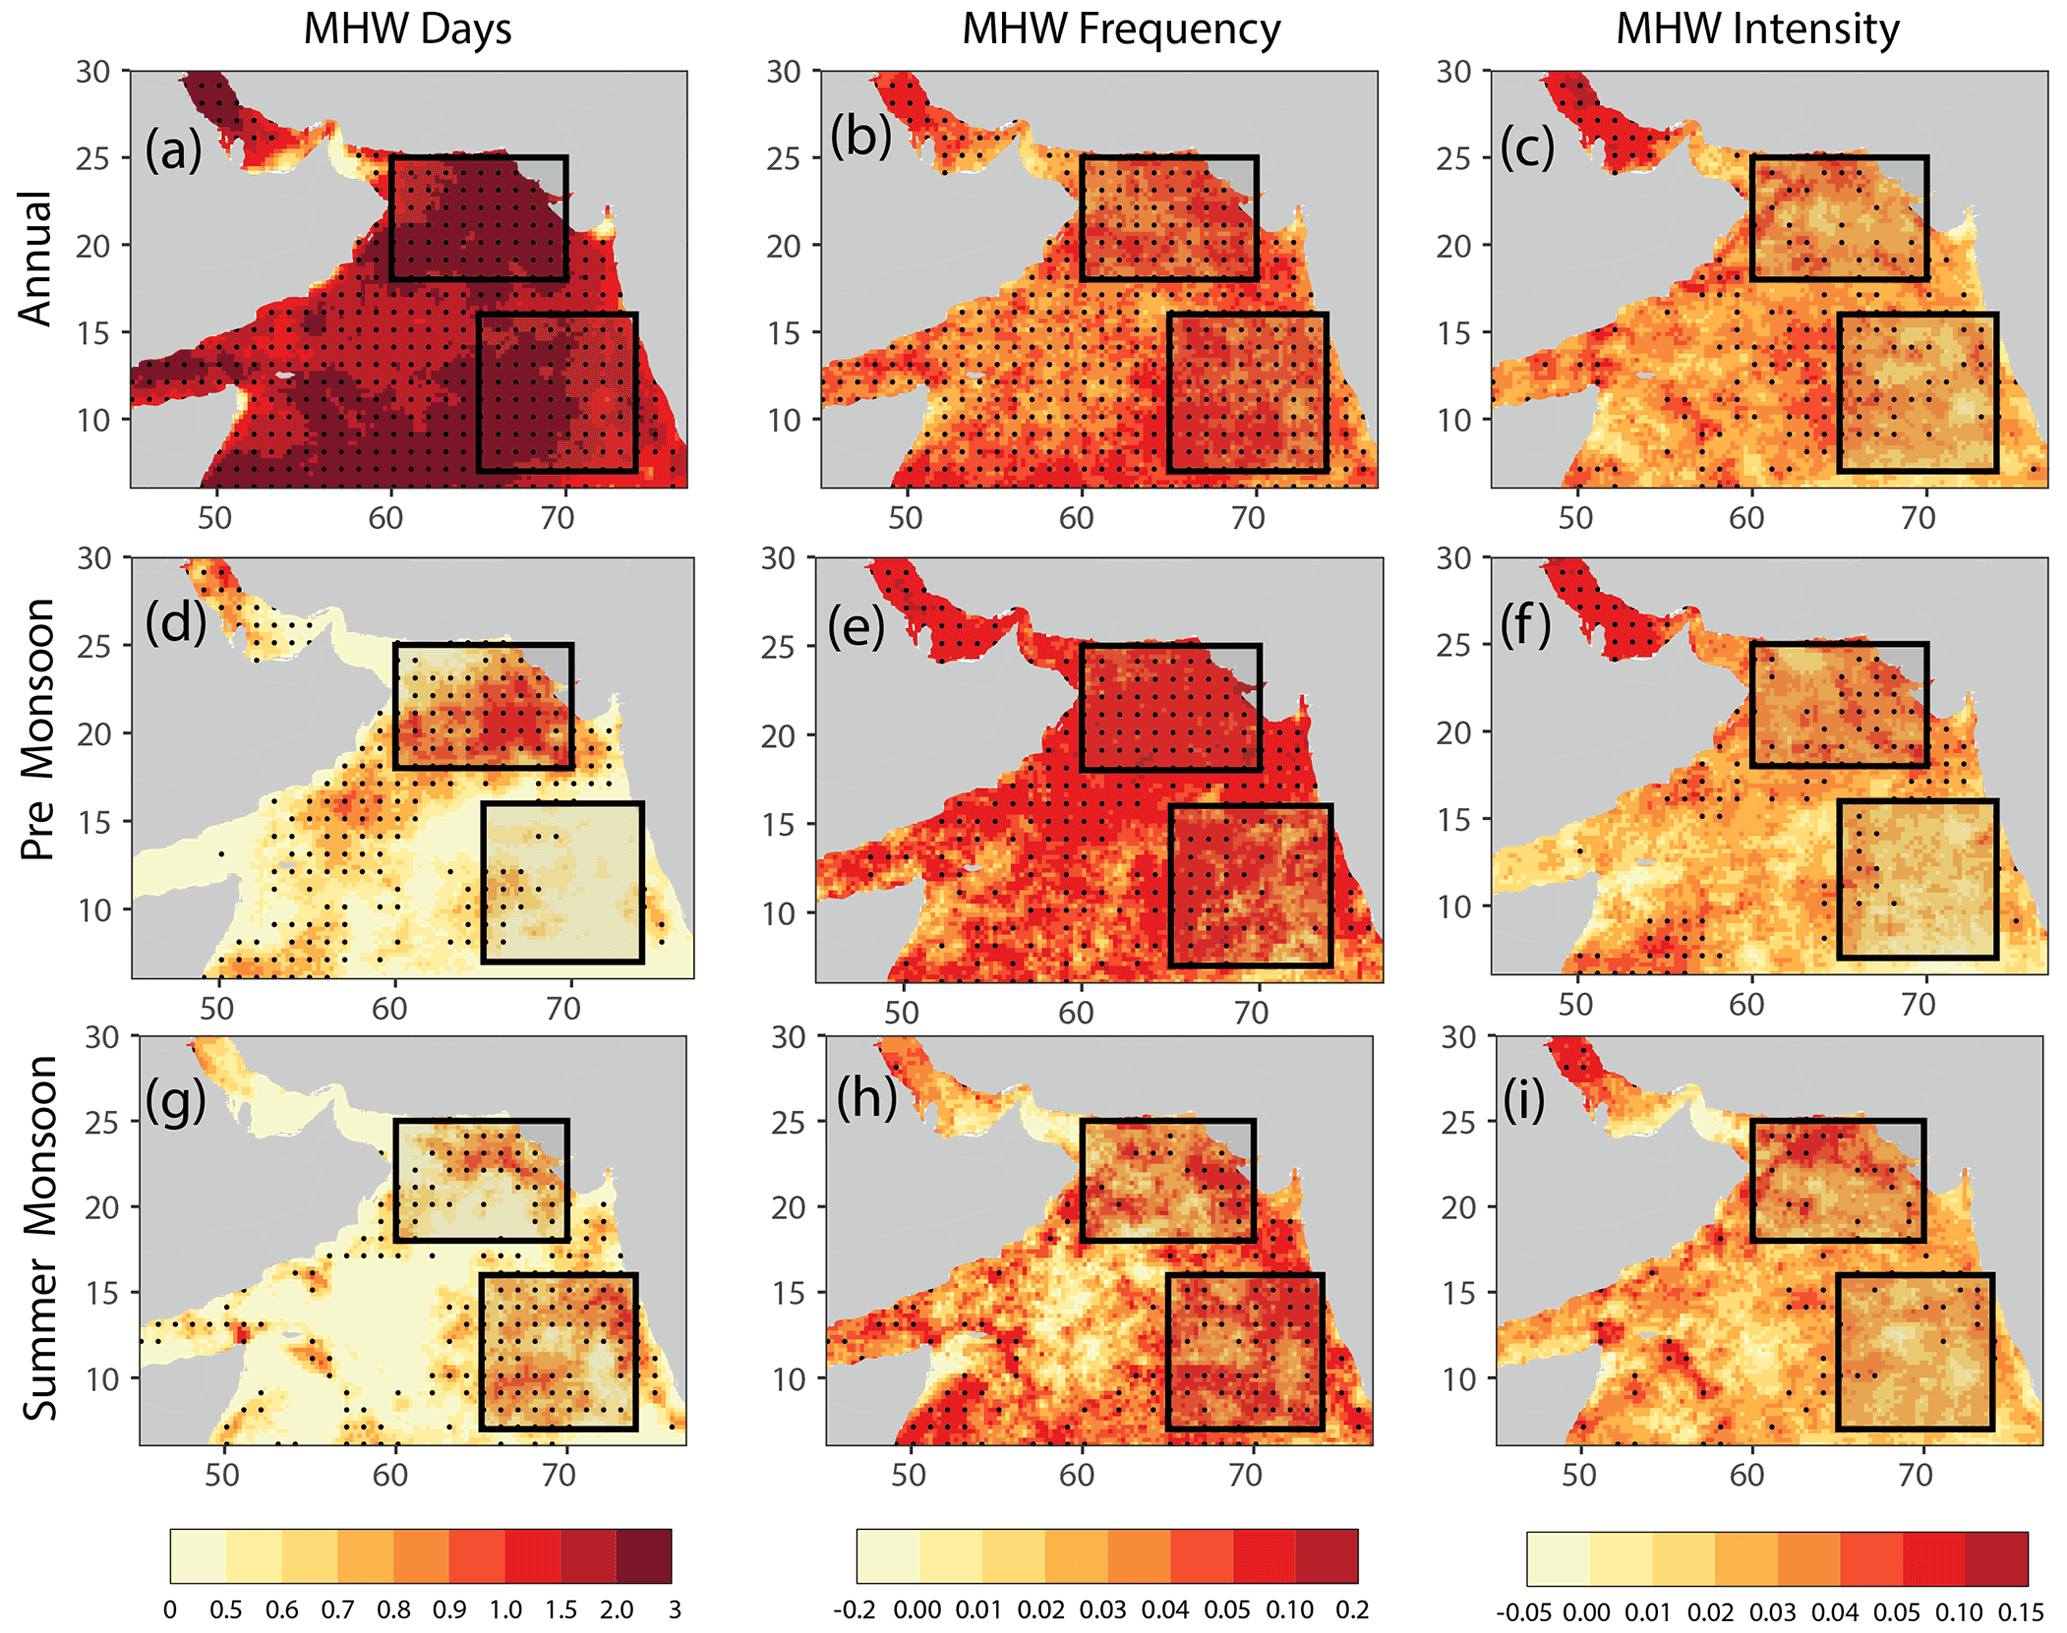
Figure 1Trend for the MHW days (d yr−1; a, d, and g), MHW frequency (events per year; b, e, and h), and MHW intensity (; c, f, and i) for the annual (a–c), pre-monsoon (d–f), and summer monsoon (g–i) periods. The trends within the 99 % confidence limit are marked by stippling. The black boxes represent the north Arabian Sea (NAS) and the southeastern Arabian Sea (SEAS). The trends are calculated for the period 1982–2019.
The spatial heterogeneity in the observed MHWs across the two seasons is owing to the underlying differences in the oceanic dynamics and the air–sea interactions. During PRM, the rapid rise in SST is primarily driven by weaker winds, a shallow mixed layer (∼20–30 m; Montégut et al., 2004), the remotely forced propagating Rossby waves (Schott and McCreary, 2001; Vinayachandran and Shetye, 1991; Rao and Sivakumar, 1999; Shenoi et al., 1999; Durand et al., 2004; Shankar et al., 2004; Vinayachandran et al., 2007) and the intrusion of the Bay of Bengal freshwater by the coastal currents (Shenoi et al., 1999). However, by late May, as the summer monsoon winds start to blow over the Arabian Sea, the SST cools rapidly along the western boundary of the Arabian Sea (Vinayachandran et al., 2021). However, the central and eastern Arabian Sea remains warm (>28 ∘C) until July (Chatterjee et al., 2012). By August, SST drops below 28 ∘C over most parts of the Arabian Sea driven by cloud cover and strong wind-driven mixing (Phillips et al., 2021). It is likely that this mean SST rise during these two seasons possibly has a significant impact on the MHW genesis over this region and thus is studied separately.
The frequency of heatwaves also shows a marginal annual increasing trend across the Arabian Sea, but the stronger trend of ∼0.06–0.08 events per year is limited to the southern and northeastern Arabian Sea and all along the west coast of India (Fig. 1b). During the PRM and SWM seasons, the increasing trend of heatwave frequency is mostly collocated with the regions where an increasing trend of heatwave days is observed (Fig. 1e and h). Therefore, while during the PRM season an increasing trend in frequency is observed in the northern Arabian Sea region at a rate of ∼0.1–0.15 events per year, the SWM season shows a similar trend along the west coast of India and across the southeastern Arabian Sea region. Note here that, annually, while the increase in the number of heatwaves over the 4 decades is only about three to four events, the heatwave days have increased by about 80–120 d. This indicates that the heatwaves have become much more prolonged in the recent decade than in the early 80s and 90s. On the other hand, heatwave intensity shows a meagre increase over most parts of the Arabian Sea. The most intense MHW intensity is experienced in the northern Arabian Sea, where an increasing rate of ∼0.05 is observed during the PRM season.
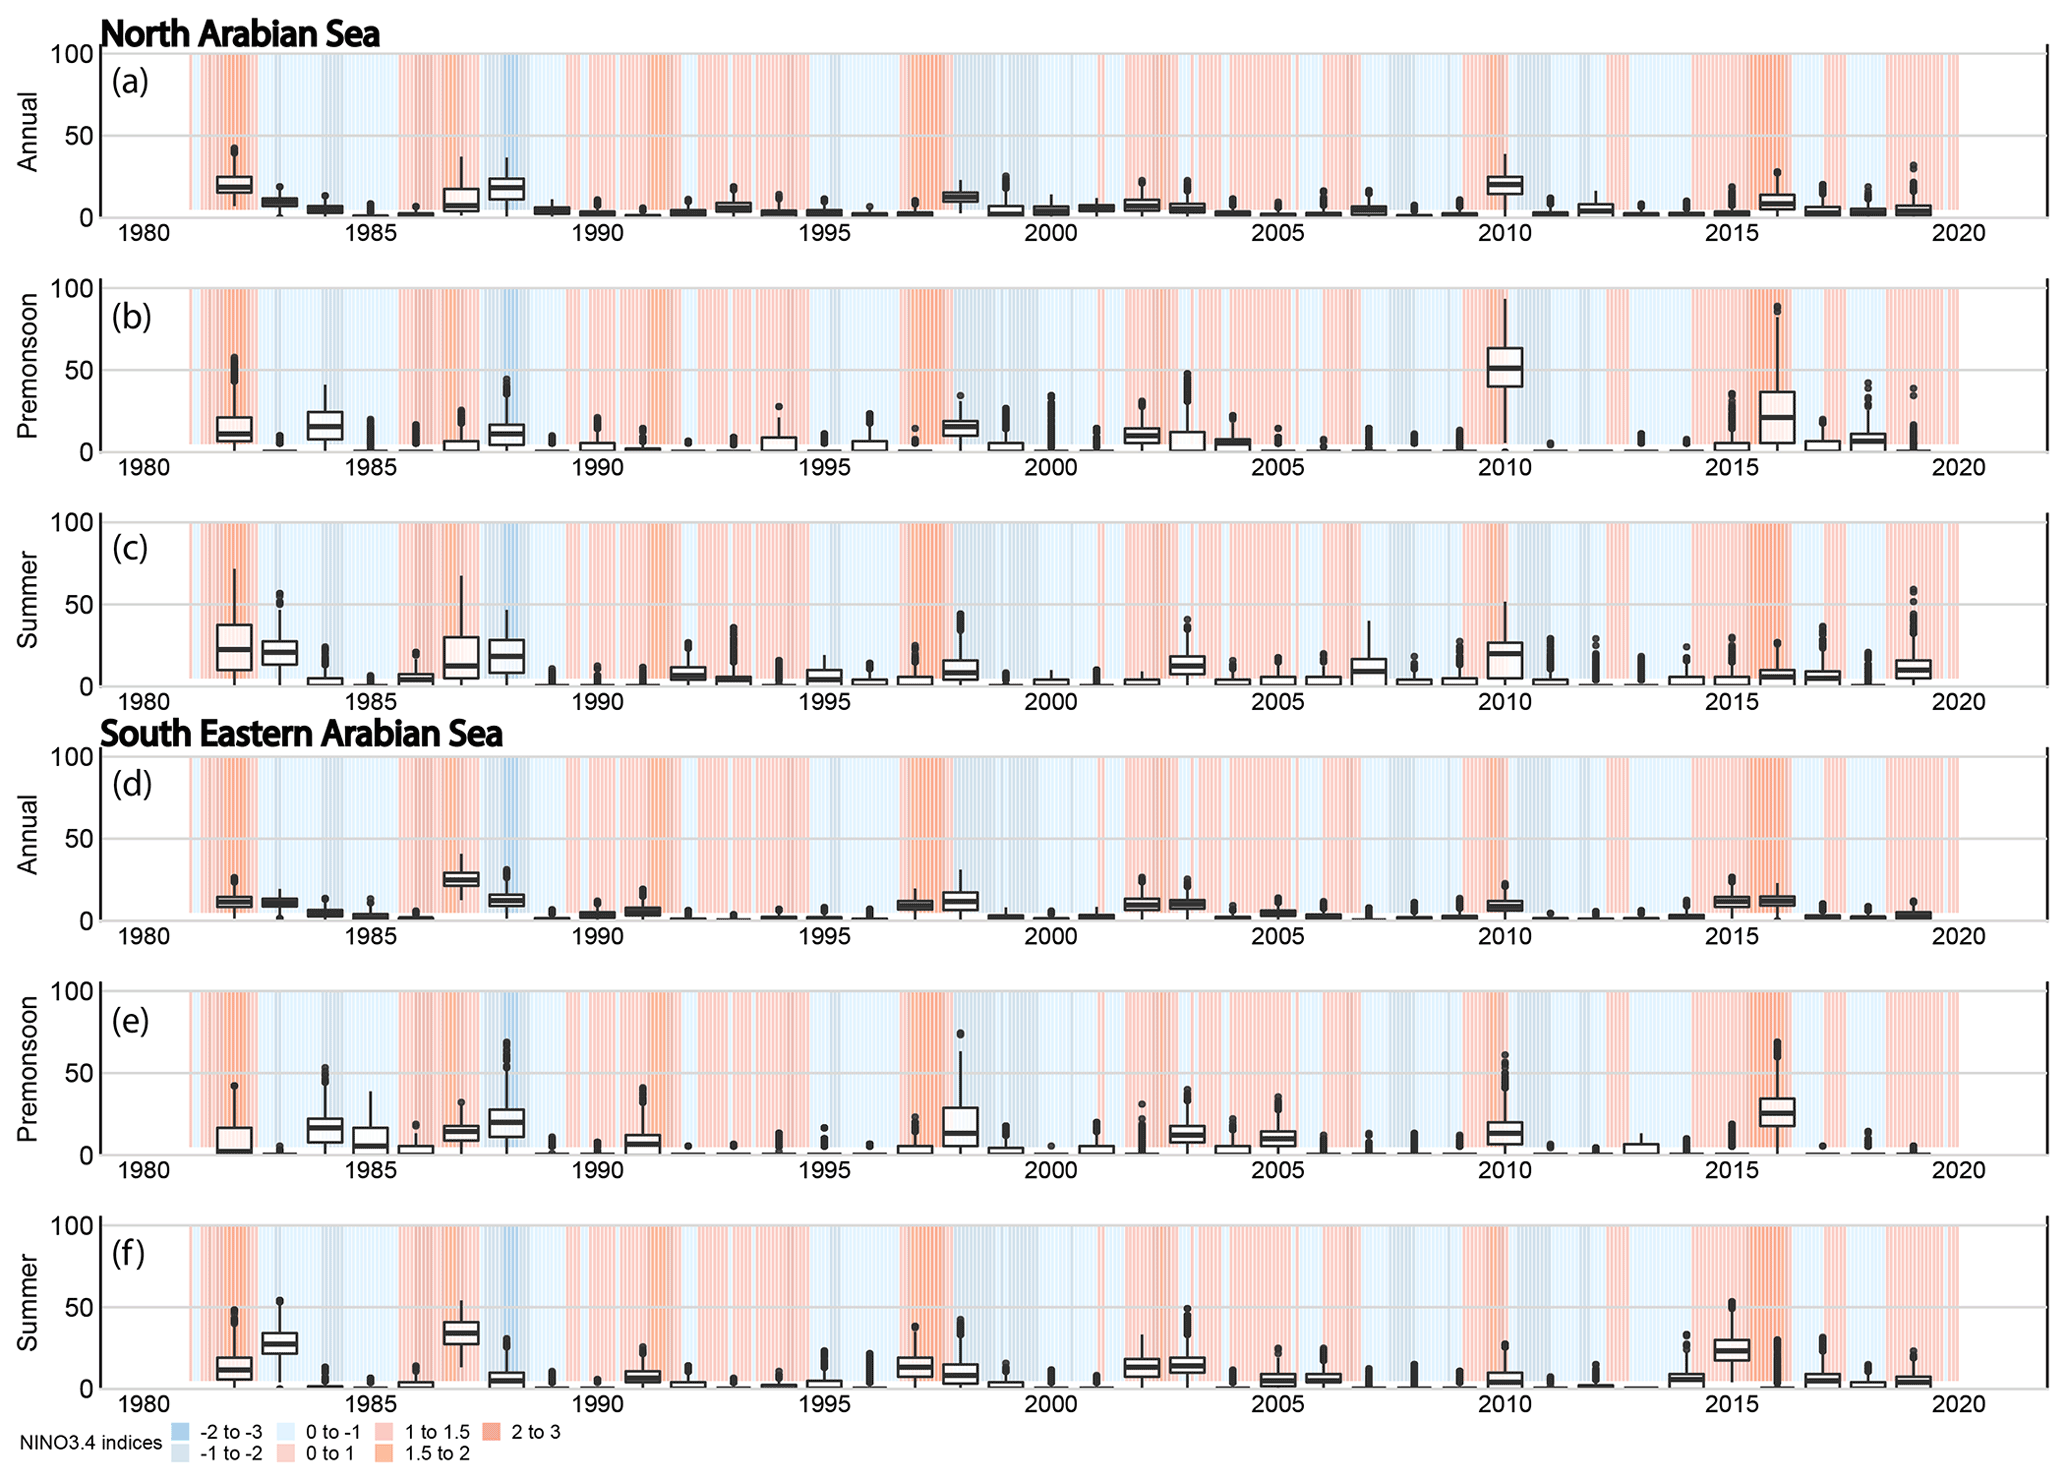
Next, in order to understand the heatwave characteristics in detail, based on the observed trend of the various heatwave characteristics, we have selected two regions in the Arabian Sea for further analysis: the northern Arabian Sea (NAS; 18–25∘ N, 60–70∘ E) and the southeastern Arabian Sea (SEAS; 7–16∘ N, 65–74∘ E) (black boxes in Fig. 1). Figure 2 shows the time series of the percentage of heatwave days across each year annually and seasons-wise since 1982 for these two selected regions. In both regions, the number of heatwave days was comparatively low until the year 2000 except for the years 1986/1987, 1992, and 1997/1998, coinciding with the initiation phase of El Niño and the positive phase of the Indian Ocean Basin Mode (IOBM). The warmer than usual SST during El Niño and the positive phase of IOBM thus potentially explains these exceptions. Annually during this pre-2000 era, only ∼5 %–10 % of days experience heatwaves in these regions. After 2000, the number of heatwave days increased significantly, with an average of ∼10 %–20 % days experiencing heatwaves in almost all years. Further, the rapid increase in heatwave days is observed from the year 2015 with at least 25 %–50 % of days experiencing heatwaves. During the PRM season, the percentage of heatwave days is marginally higher in the NAS compared to the SEAS (Fig. 2b and e). Moreover, as noted annually, during the PRM season, the NAS shows a marked rise in heatwave days from the year 2015 with consistently more than 25 %–50 % of days experiencing heatwaves in this region. Nevertheless, during the entire satellite era, the years 2010 and 2016 stand out as both regions experienced heatwaves for almost all days during this season. During the SWM season, the characteristics of heatwave days remain similar to what was observed in PRM (Fig. 2c and f). The only exception is that since 2015, the SEAS has experienced more heatwave days than the NAS. Notably, the summers of 2015, 2017, and 2019 exhibit at least 50 % or more heatwave days in the SEAS.
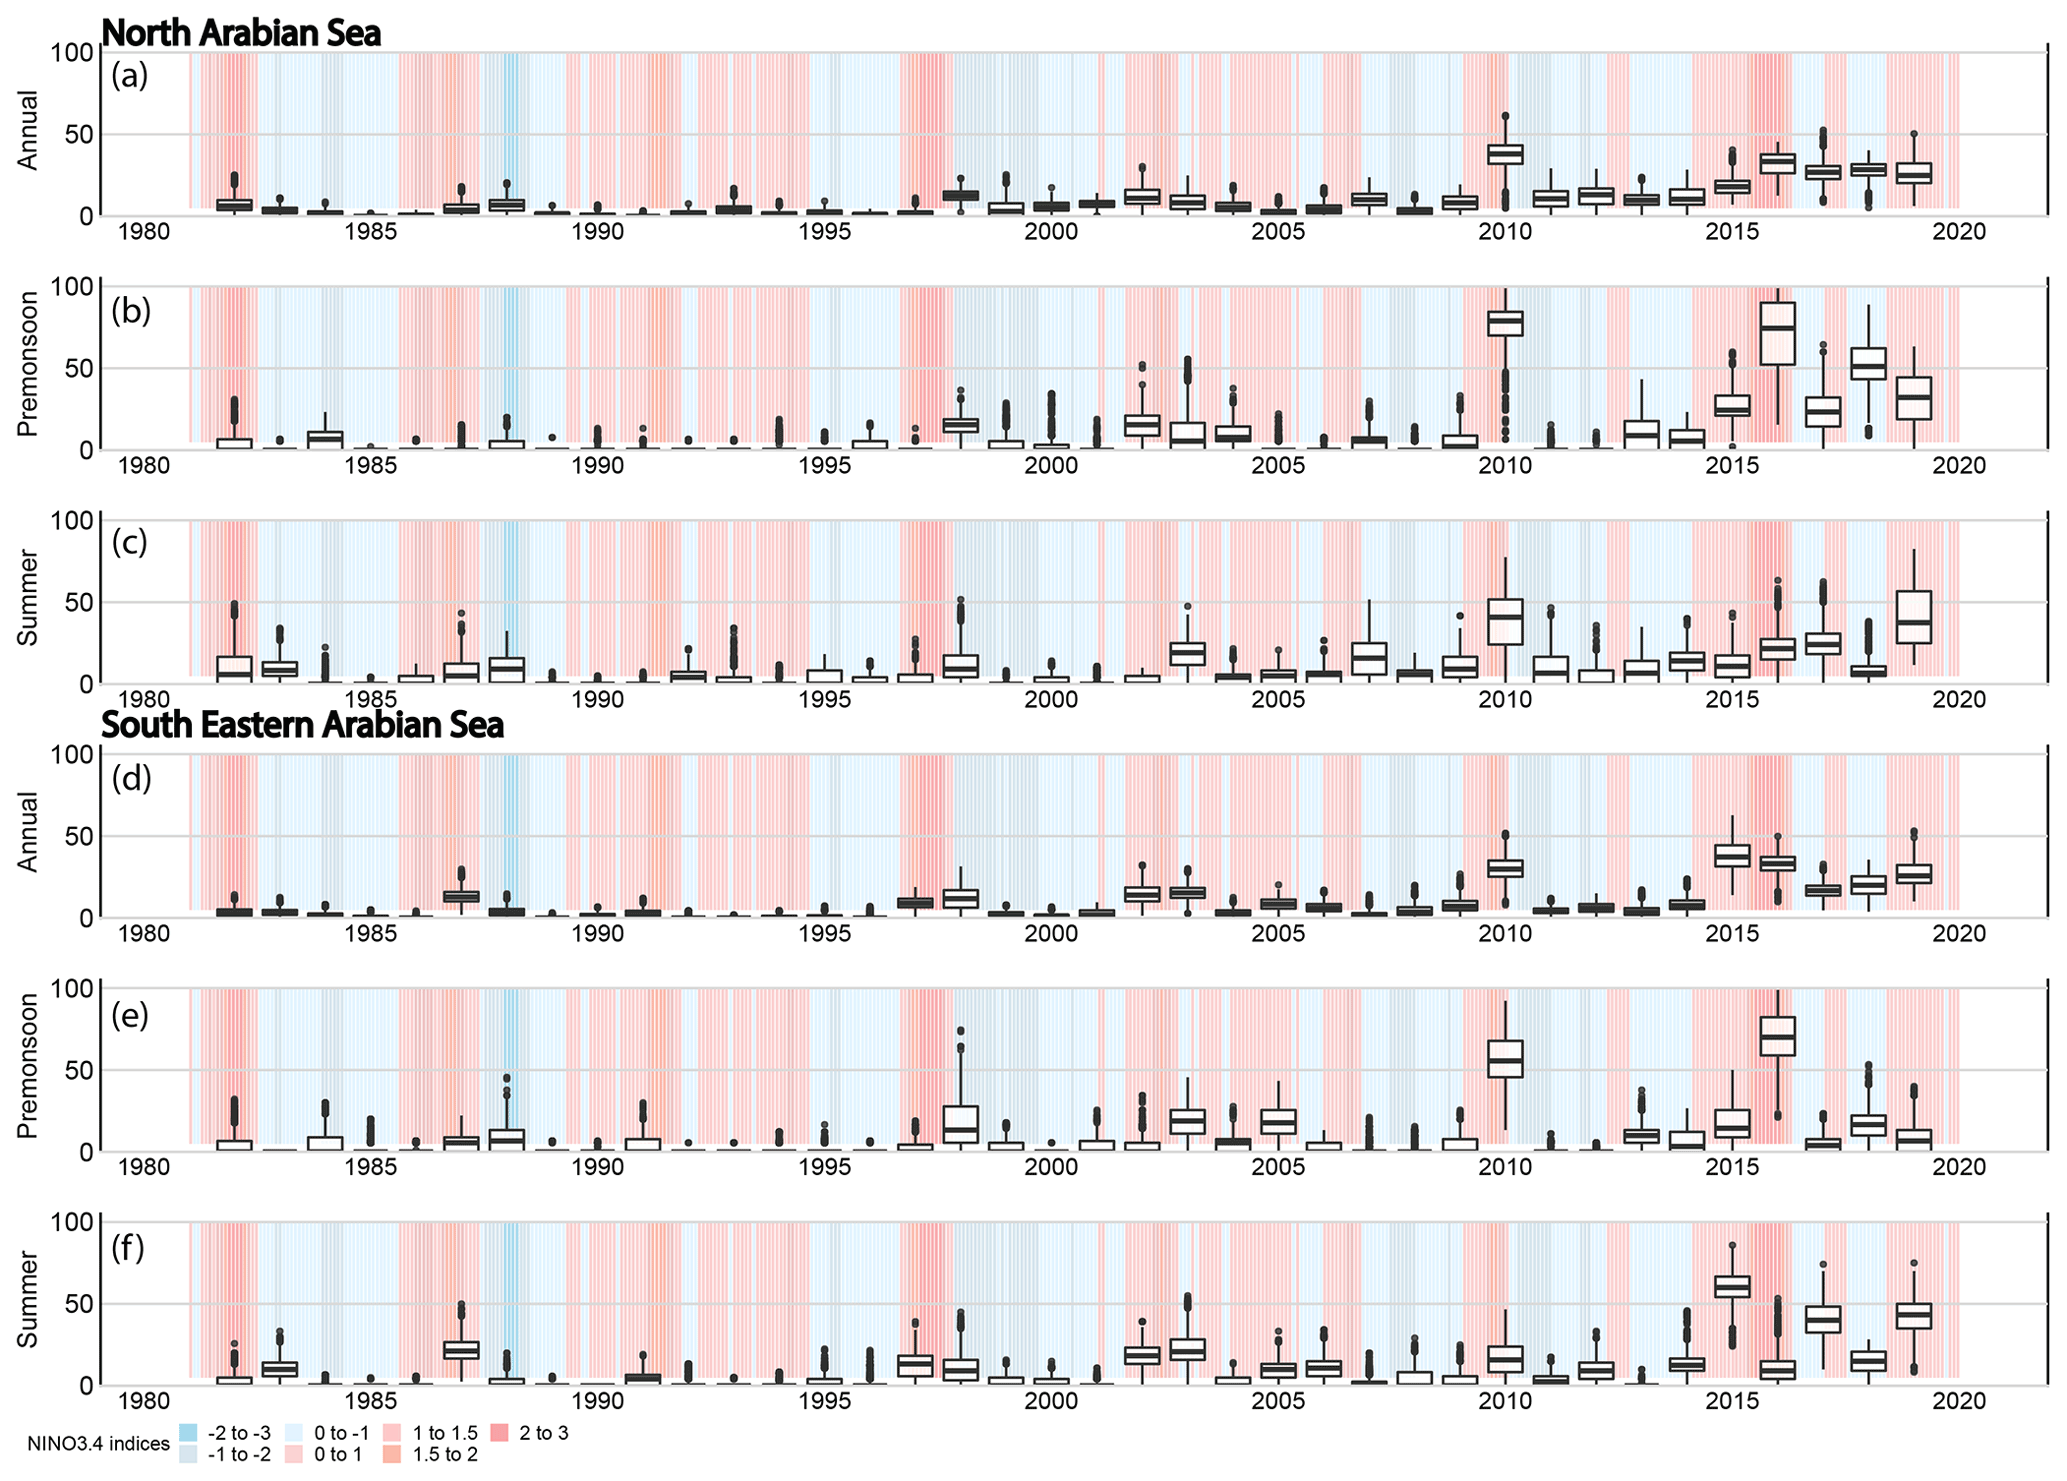
Figure 2Boxplots representing the percentage of days experiencing heatwaves during (a and d) annual, (b and e) pre-monsoon, and (c and f) summer monsoon for the northern Arabian Sea (NAS) and the southeastern Arabian Sea (SEAS). The background shading represents the Niño3.4 index.
Overall, there is a notable increasing trend of the heatwave days annually and for the PRM and SWM seasons. Notably, the number of heatwave events annually also increased progressively over the years (Fig. 3). The rapid increase in MHW days and frequency in the last decade coincides with the rapid mean SST warming of this region. This indicates that the anthropogenic warming of the mean SST is likely behind this increase in heatwaves over this region. Further, most of the intense heatwave years also coincide with the El Niño years, suggesting an important role of climate modes in modulating these extreme events in this region, which agrees with what is observed in other regional seas across the world ocean (Holbrook et al., 2019).
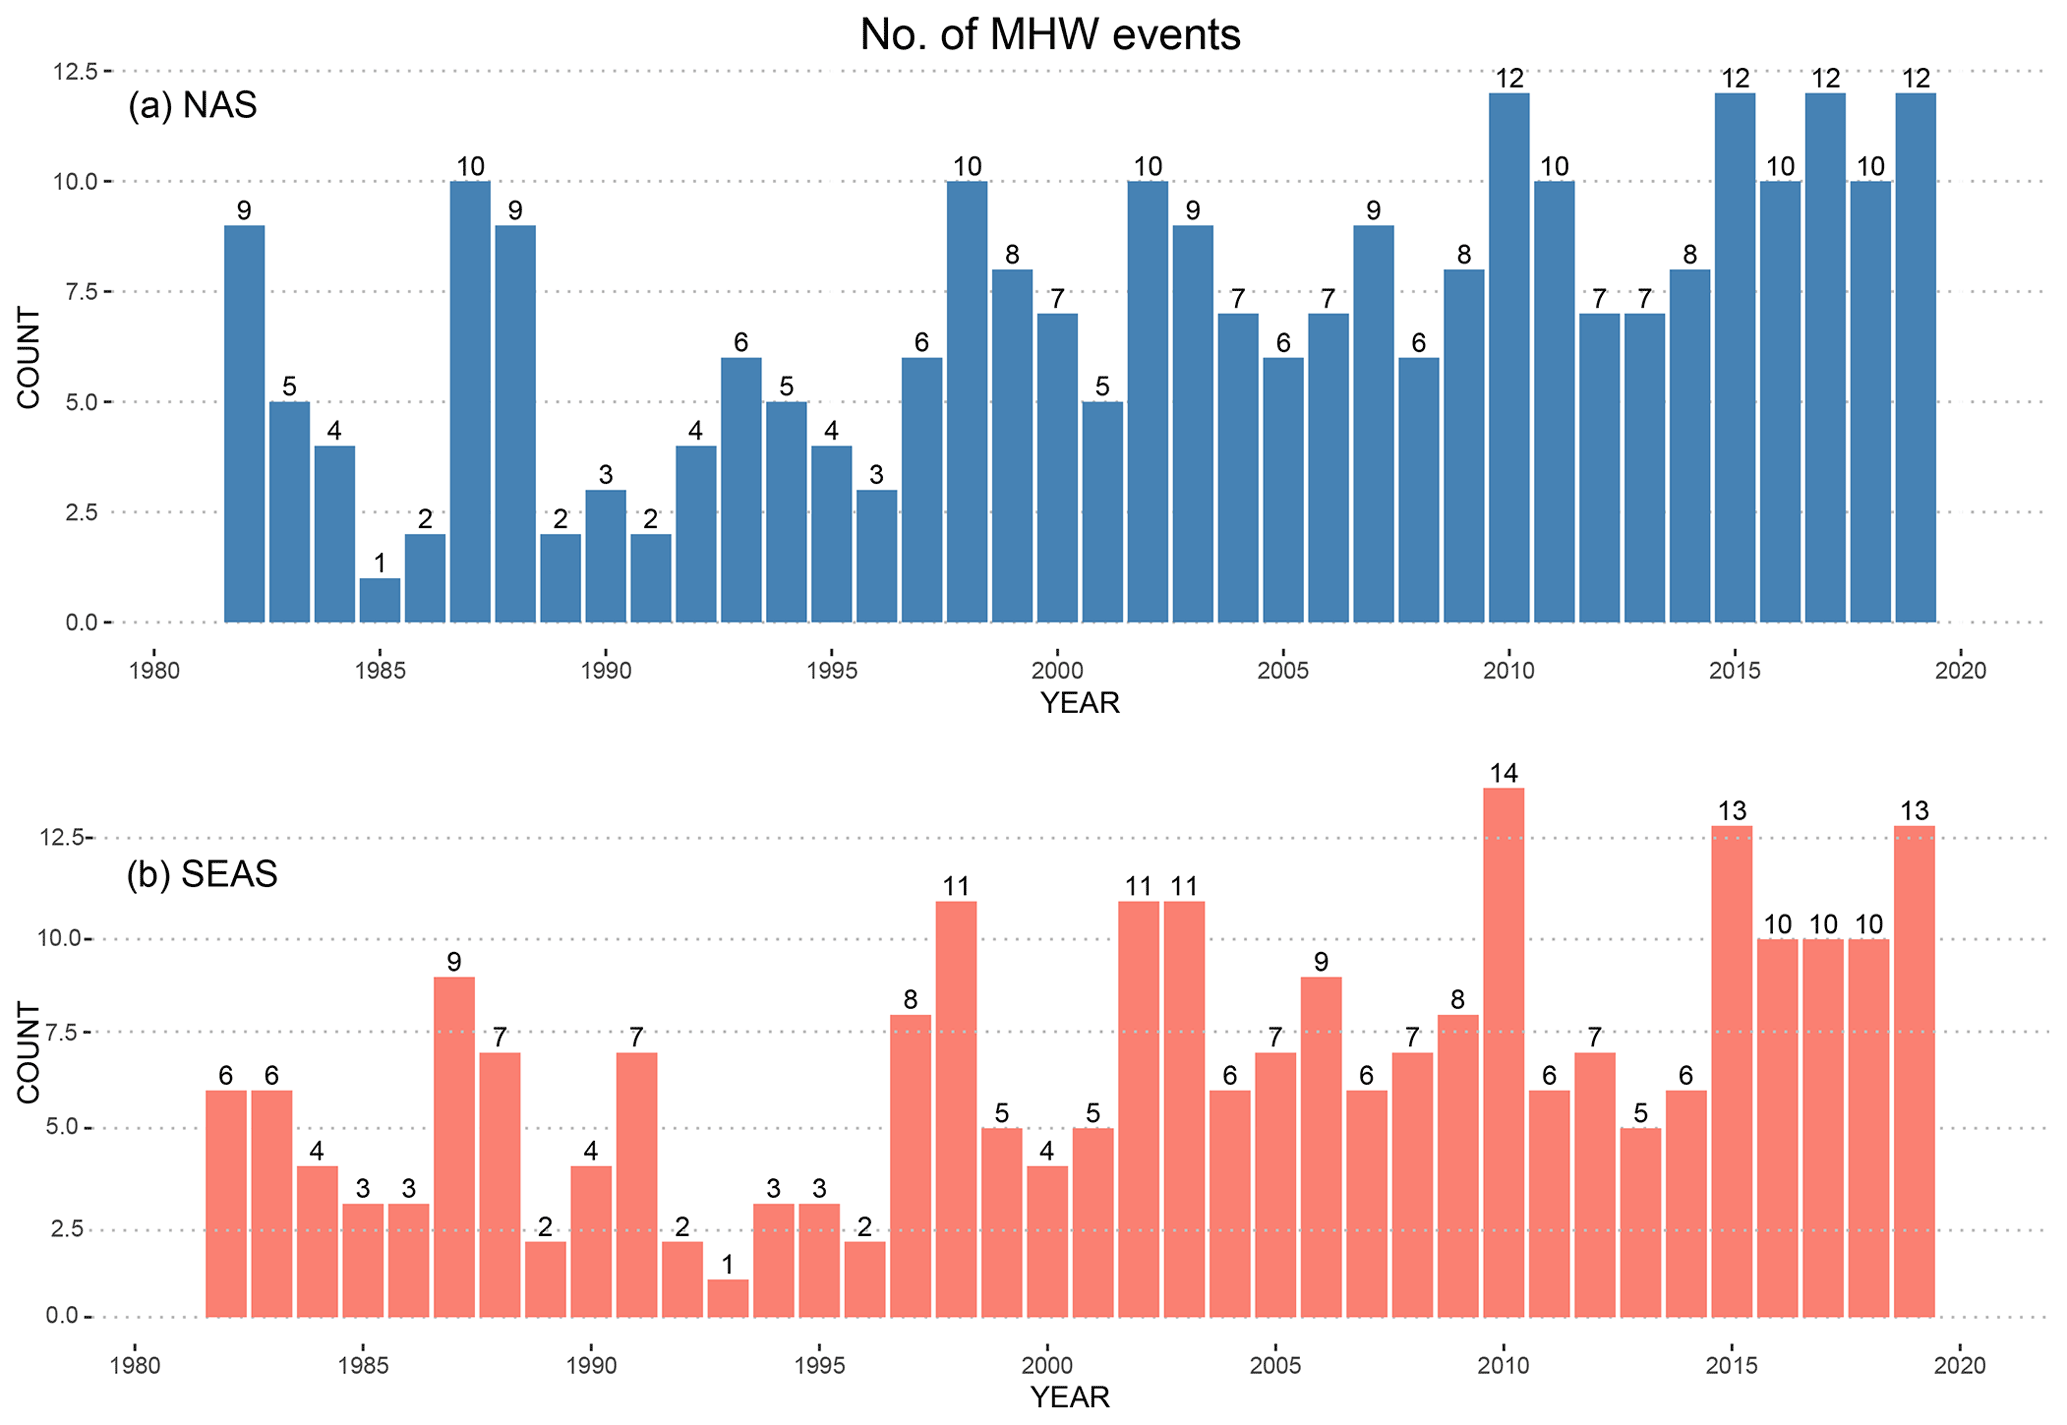
Figure 3Maximum number of heatwave events observed each year across the northern Arabian Sea (NAS) (a) and the southeastern Arabian Sea (SEAS) (b).
The Indian Ocean has been warming rapidly over the last few decades. An estimate based on Enhanced Reconstructed Sea Surface Temperature (ERSSTv4) indicates that the tropical Indian Ocean is warming at a rate of 0.15 ∘C per decade during 1951–2015 (Roxy et al., 2020); this is particularly conspicuous during summer months (Roxy et al., 2014). The SST trend calculated during the study period (1982–2019) for the Arabian Sea indicates that annual anomalous warming of ∼1.5 ∘C in the recent decade is limited to the northern part of the Arabian Sea and ∼0.75 ∘C in some parts of the southern Arabian Sea (Fig. 4a). However, the season-wise SST trend shows pronounced spatial contrast between the PRM and SWM seasons: while during PRM, the NAS experiences anomalous warming of more than ∼1.5 ∘C (Fig. 4b), during SWM the warming of ∼0.75–1 ∘C is located close to the west coast of India (Fig. 4c). Notably, the regions with the strongest warming trend also experience an increasing trend of MHWs (see Fig. 1), indicating that the warming of the mean SST contributes to the increasing trend of heatwave days in the Arabian Sea. This is in agreement with Oliver (2019), who suggest that about two-thirds of the global ocean experiences an increasing trend of heatwave days during the satellite period due to the rising mean temperature of the ocean. The use of a fixed climatological baseline in this (and other) studies inherently means that rapid warming in the recent decade shifted the mean SST towards the heatwave threshold.
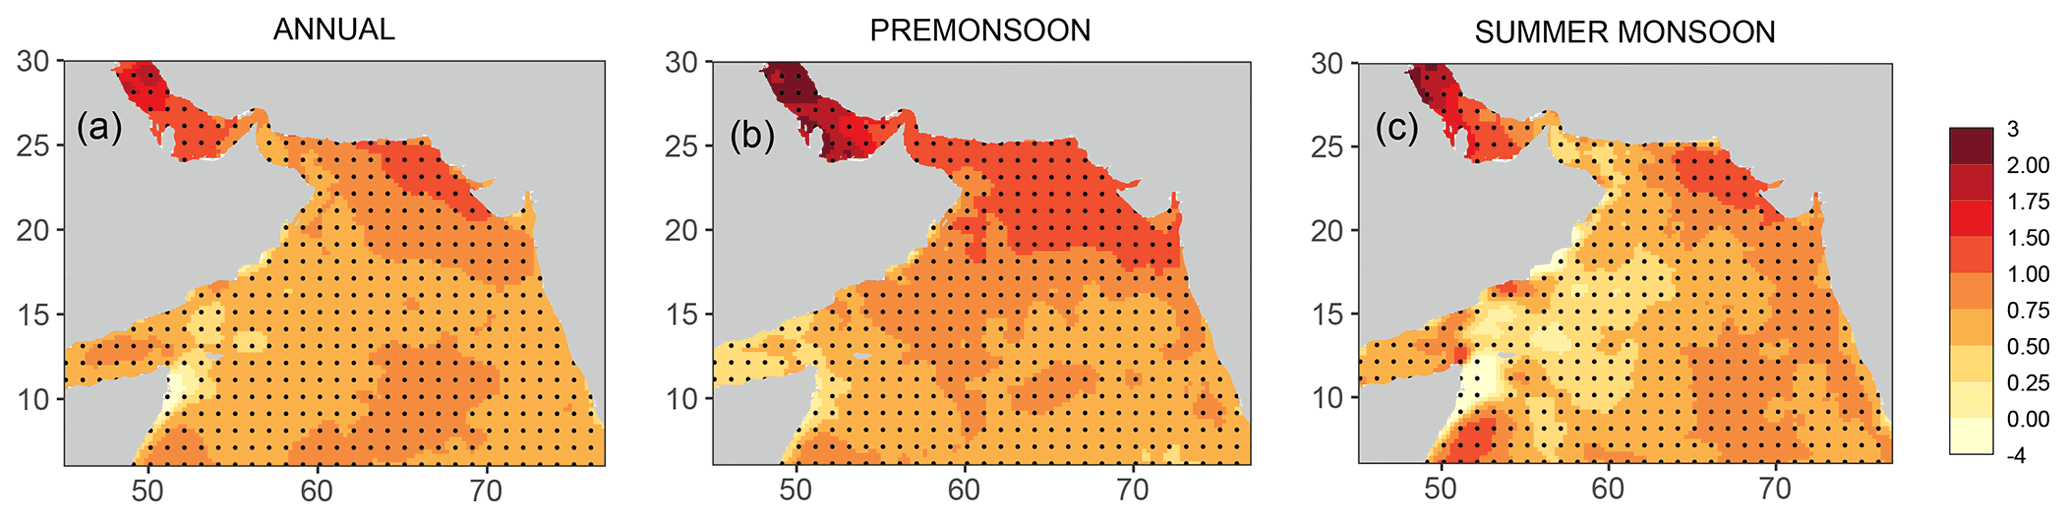
Figure 4Trends of SST (∘C per 37 years) over 1982–2019 for (a) annual, (b) pre-monsoon, and (c) summer monsoon period. Stippling show regions where the trend is 99 % significant based on two-tailed t test.
In order to understand the importance of the mean SST trend and the variability in the SST on the heatwave days over the Arabian Sea, the SST time series is decomposed as below:
Here, T(t) is the time series of SST, Ttr(t) is the SST trend, and Tvar(t) is the SST anomaly after removing the trend. Figure 5 shows the time series of the percentage of heatwave days based on detrended SST time series (Tvar). In this case, the duration of MHWs for each year and season is primarily driven by SST variability. The major contrast between heatwave days based on T(t) and Tvar(t) (compare Figs. 2 and 5) is that there is no secular trend in the heatwave days when calculated based on only SST variability. This supports the idea that the increasing trend in the MHW days in the Arabian Sea is driven by the rising temperature of the mean SST and not the variability. It should be noted that the detection of MHWs is relative to a fixed baseline. If one were to use a moving baseline, warming SSTs would not necessarily lead to a trend in MHW days. Note also that SST variability contributed most strongly during the PRM season of 2010 in the NAS region, with almost 50 %–75 % of days of this season experiencing heatwaves due to SST variability (Fig. 5b). The 2016 event was the second-strongest event in this region, contributed strongly by the SST variability. In fact, as the next section shows, we find that El Niño primarily drives these large number of heatwave days during the PRM season via the positive phase of the Indian Ocean Basin Mode. In contrast, in the SEAS, the SST variability contributed most for the year 2016 with almost 20 %–40 % of the observed heatwave days. The other notable years are 1988, 1998, and 2003, when a considerable number of days experience heatwaves in this region due to SST variability alone. On the other hand, during the SWM season, the contribution of SST variability is most notable for the years 1982, 1983, 1987, 1988, and 2010 in the NAS and the years 1983, 1987, 2003, and 2015 in the SEAS.
In order to compare the role of mean SST warming with the SST variability, Fig. 6 shows the time series of the ratio of the heatwave days owing to the SST trend and its variability by approximating Eq. (2) as follows:
assuming that MHWs based on Ttr and Tvar are independent of each other. This is a fairly good approximation as the seasonal climatology is prepared using a 30-year record and does not include the last decade when a rapid increase in SST is observed. Thus, it can provide useful insights into the role of the mean warming trend of SST in MHW generation. It shows a very secular shift after the year 2000 in the driving force of the total annual heatwave days in the Arabian Sea. While, during the pre-2000 era, the natural variability of SST contributes most in driving the MHWs, post-2000, the warming trend of mean SST becomes the dominant factor. It also shows that the influence of mean SST warming increased very rapidly over the last 2 decades, which is expected to continue further under the unabated Indian Ocean warming. However, there are years when the ratio is much smaller when the climate-mode-driven variability contributes significantly to these extreme warm events as noted in Fig. 5.
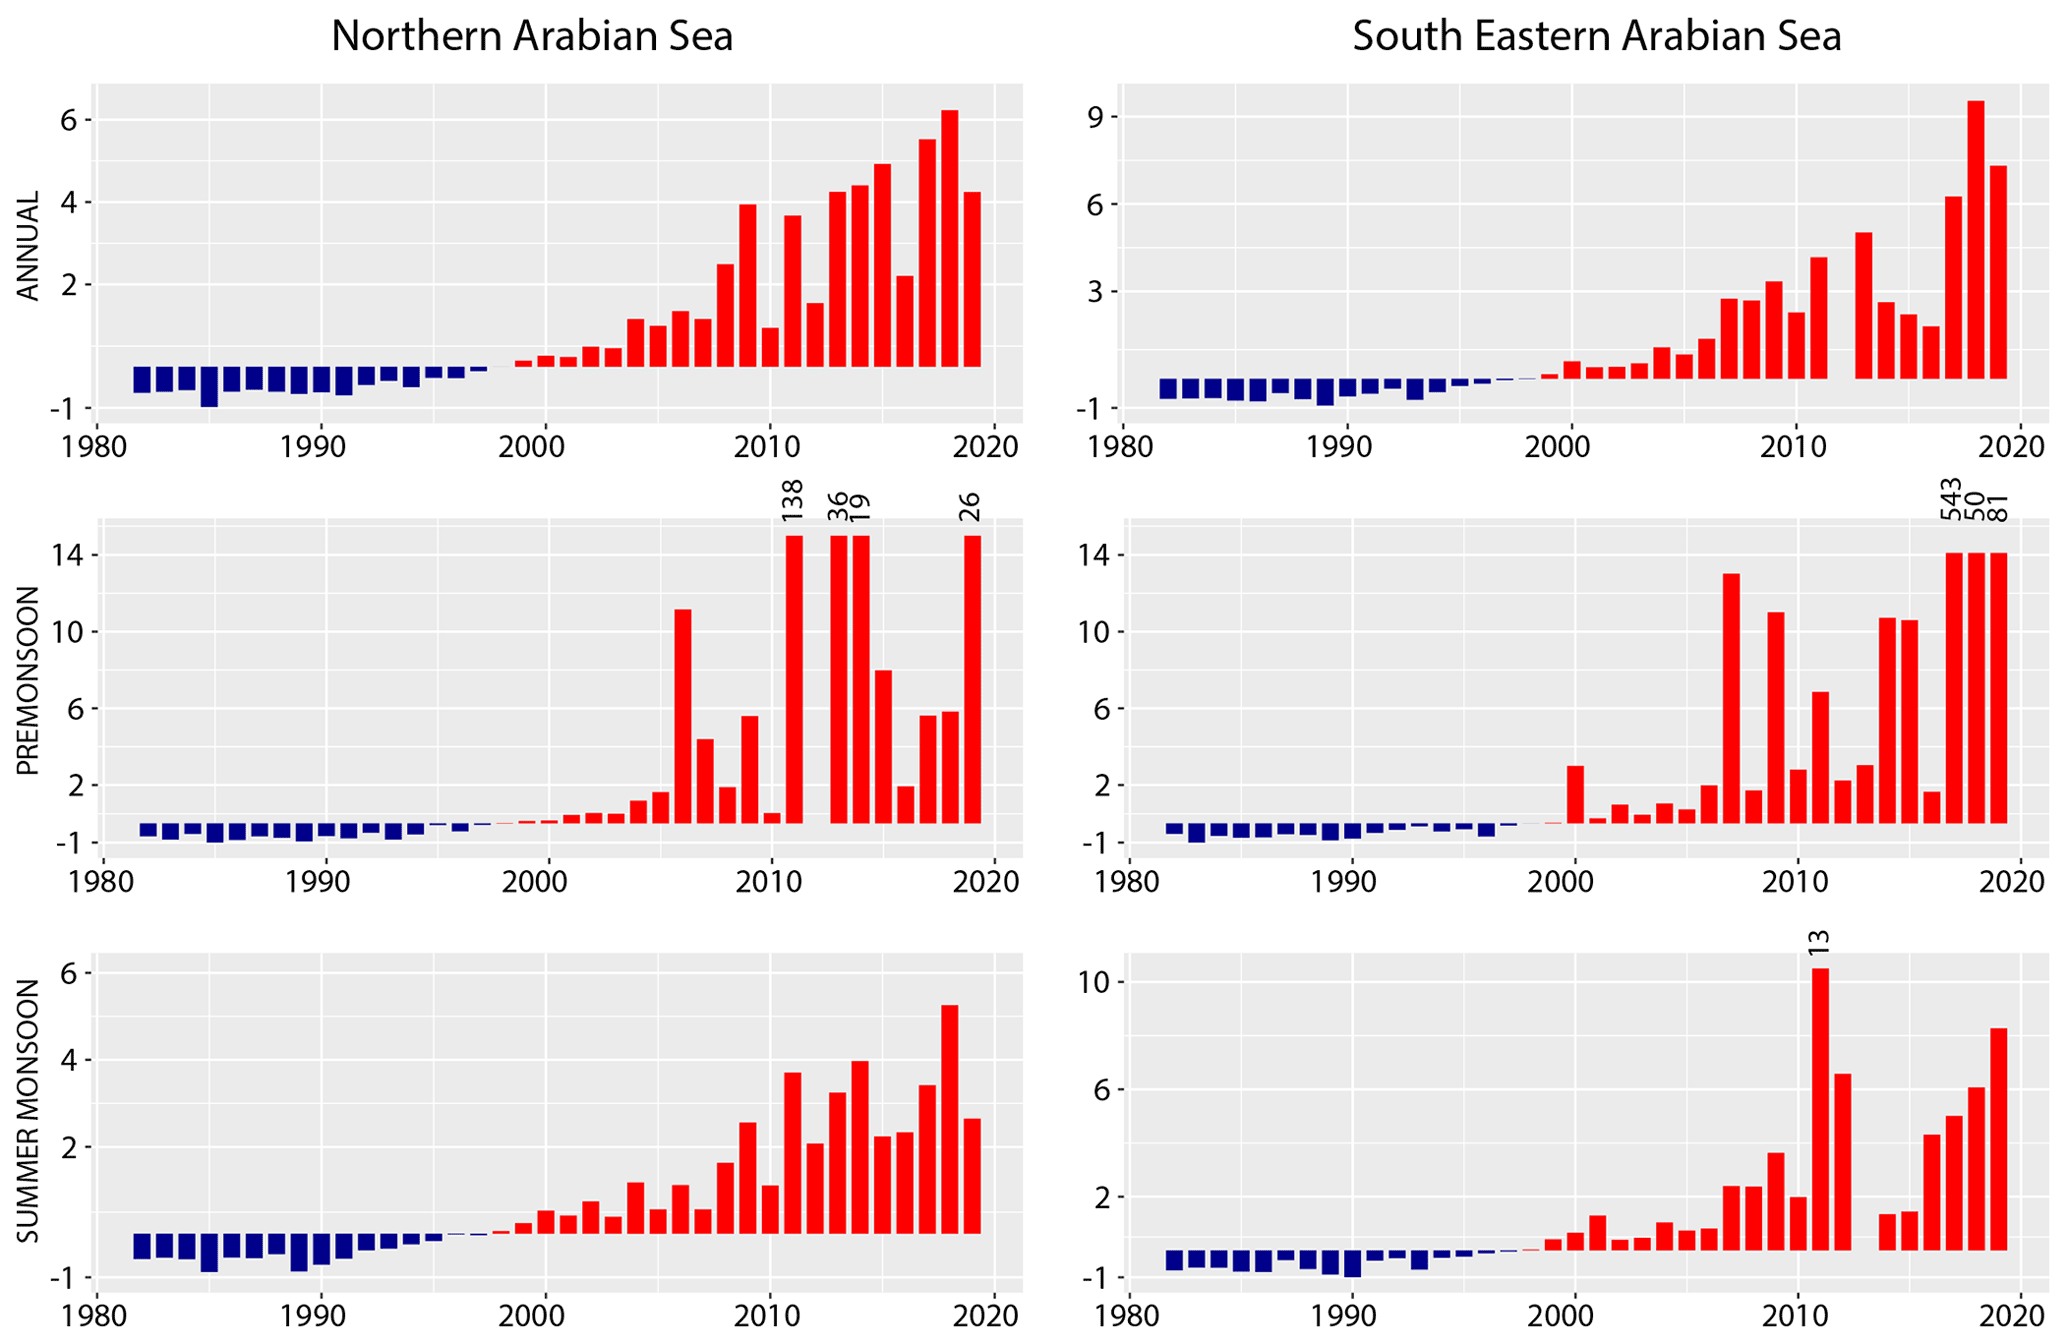
Figure 6Ratio of MHW days derived using SST and detrended SST based on Eq. (3). Note that a few bars are truncated and the actual ratio is written at the top of the corresponding bars.
The Indian Ocean dipole mode (IOD) and El Niño–Southern Oscillation (ENSO) are the two dominant climate modes that contribute to the SST variability of the tropical Indian Ocean on an interannual timescale (Saji et al., 1999; Du et al., 2009). During the positive phase of the IOD, the western Indian Ocean shows anomalous warming, whereas the eastern Indian Ocean cools. In the negative phase, the sign of the SST anomaly reverses. Similarly, ENSO modulates the SST in the tropical Pacific, but the influence of ENSO can be felt in other basins as well through an atmospheric teleconnection via anomalous Walker circulation (Du et al., 2009; Roxy et al., 2014) and the inter-basin transport of water mass properties (Lee et al., 2015). During the positive phase of ENSO, i.e. during El Niño, the western Indian Ocean shows warmer anomaly due to the weakening of the summer monsoon winds and increased shortwave radiation (Swapna et al., 2014). On the other hand, during La Nina, most parts of the Indian Ocean experience a cooler anomaly except the west coast of Australia where SST is elevated due to heat transport via the Leeuwin current (Feng et al., 2013; Benthuysen et al., 2014). Note here that many IODs co-occurred with ENSO, and, therefore, atmospheric teleconnections associated with ENSO are often considered to be one of the primary triggers of the IOD events (Allan et al., 2001). Nevertheless, there are many instances when extreme IOD appears in the absence of ENSO, suggesting the importance of regional processes within the Indian Ocean in the evolution of IOD (Ashok et al., 2003). However, considering the strong coupling between the ENSO and IOD mode, separating the effects of these modes on the Indian Ocean warming sometimes becomes challenging.
Additionally, associated with the direct impact of ENSO, the Indian Ocean warming mode (also referred to as Indian Ocean Basin Mode; IOBM), which peaks during the decaying phase of El Niño and after La Nina, also contributes to the widespread warming of the tropical Indian Ocean (Xie et al., 2009). Notably, the initiation of IOBM is primarily caused by the ENSO-induced suppressed atmospheric convection over the tropical Indian Ocean (Klein et al., 1999). However, it can act as a capacitor to influence atmospheric teleconnection till next summer in the decaying phase of El Niño (Xie et al., 2009). Hence, the warming of the Indian Ocean during the positive IOBM inherently contains the effect of a previous El Niño.
Similarly, the North Atlantic Oscillation (NAO) has also been shown to play an important role in modulating the SST of the Indian Ocean on an interannual to decadal timescale (Xie et al., 2021). Therefore, these climate modes can support the genesis or suppression of heatwaves depending upon their phases via modulating the thermocline depth and associated air–sea interactions of the basin (Holbrook et al., 2019, 2020; Oliver et al., 2021).
This section will look at the role of these climate modes, particularly IOD, ENSO, IOBM, and NAO, in the genesis of MHWs in the Arabian Sea. As noted already in the previous section, the greatest number of heatwave days were observed either during the initiation phase of El Niño or during the decaying phase of El Niño (i.e. during the positive phase of IOBM).
This indicates that El Niño and IOBM climate modes play a significant role in modulating heatwaves in this region. Figure 7a shows the correlation between MHW days derived from the detrended SST observation and the climate modes. ENSO shows the strongest correlation in the south–central Arabian Sea with a correlation coefficient of ∼0.5. The correlation decreases northward and, in fact, turns negative in the Persian Gulf region. This is in line with the correlation between Indian Ocean SST warming and the El Niño mode (Roxy et al., 2014). The influence of IOD is most prominent in the western Arabian Sea in the vicinity of the western box of the IOD. Otherwise, the correlation is generally weak for the rest of the basin except close to the coast of Iran and Pakistan, where a marginal increase in correlation is observed. However, note here that, unlike ENSO, the spatial and temporal length scale of IOD is much smaller. Thus, the correlation across the entire year may be less, but it can still significantly influence a larger region during its peak phase. As expected, IOBM, which represents the basin-wide warming mode of the tropical Indian Ocean, shows the strongest influence on the MHW days with a correlation coefficient of ∼0.5 in most parts of the Arabian Sea. In this case also, like ENSO, the correlation decreases in the north. The influence of NAO is the weakest among the other climate modes and is mostly limited to the SEAS region close to the southern part of the west coast of India during its negative phase.

Figure 7(a) Correlation between MHW days based on detrended SST (∘C) and major climate modes. Stippling represents regions where correlation is 99 % significant. (b) Percentage of co-existing days between observed heatwaves and climate modes for annual, pre-monsoon, and summer monsoon periods.
As evident in the correlation map, the strong association of IOBM with the MHW days is also reflected in the large percentage of heatwaves days that co-occur with the positive phase of IOBM (Fig. 7b). Annually, about 60 % and 75 % of heatwave days co-occur with the positive IOBM in the NAS and SEAS, respectively. These co-existing numbers go much higher during the PRM season, with more than 82 % of heatwave days coinciding with the positive IOBM phase in the SEAS region. The next most influential climate mode is the positive phase of ENSO or El Niño. This is more conspicuous during the PRM season as both the regions experience close to 50 % co-existence between heatwave days and El Niño. On the other hand, a positive IOD also significantly co-exists with more than 40 % of heatwave days during this season. During the SWM season, this association between IOBM and heatwaves decrease a bit with about 43 % and 68 % of heatwave days co-occurring with the positive IOBM in the NAS and SEAS, respectively. The influence of El Niño, on the other hand, shows a marked difference between the NAS and SEAS regions. During summer, while in the SEAS, El Niño co-occurs with ∼50 % heatwave days; in the NAS, both the phases (i.e. El Niño and La Nina) co-occur in ∼20 % of heatwave days. This equal co-occurrence of heatwave days in the NAS indicates that there is no causal relationship between heatwave and ENSO in this region and it is, therefore, possibly a mere coincidence. A similar relationship is observed for the IOD mode as well; i.e. heatwaves during its positive and negative phase co-occur for an almost similar number of days and thus suggest that IOD most likely does not cause heatwaves in the NAS during summer months. On the other hand, as seen in the correlation maps, the negative phase of NAO likely contributes to the genesis of MHWs in the SEAS, with close to 20 % of heatwave days coinciding with this mode during this season.
The dynamical processes responsible for the genesis of MHWs across the global ocean vary significantly (Holbrook et al., 2019). Moreover, the processes may differ from one event to the other in a particular region. For example, different processes were involved in the consecutively observed MHW events in the South China Sea during 2016–2018 (Gao et al., 2020), in the northeast Pacific during 2014–2015 (Lorenzo and Mantua, 2016) and 2019–2020 (Chen et al., 2021), or along the southeastern Australian coast (Oliver et al., 2017; Li et al., 2020). The Arabian Sea also exhibits similar heterogeneity in the processes responsible for the genesis of MHWs across the seasons per year (more details are given in the discussion section). In this study, we analysed the heatwave event during the year 2010 as it was the longest observed event since the availability of satellite observations and it lasted for about 60–70 d (Figs. 8 and 9). The initiation of the heatwave appears sometime in the last week of March in the northern and northeastern parts of the Arabian Sea when the SST is hovering around 27–29 ∘C, i.e. about 0.5 ∘C more than the threshold (Fig. 10). By the third week of April, the heatwave event covers the entire northern part of the Arabian Sea. By May, with the northward movement of the ITCZ, the entire Arabian Sea turns very warm with SST more than 31 ∘C. This intensifies the heatwave further to its peak, and it spreads along the western part of the Arabian Sea along the coast of Arabia with an intensity of ∼2 ∘C. By the end of May, a low-level southwesterly surface wind (also known as Findlater Jet; Findlater, 1969) starts to blow along the coast of Somalia, causing water to upwell along the coast (Schott and McCreary, 2001; Chatterjee et al., 2019; Vinayachandran et al., 2021). As the summer monsoon winds intensify, the upwelling signature extends all along the western boundary of the Arabian Sea, thus leading to a rapid decrease in SST in the western Arabian Sea and causing the heatwave to limit in the northeastern Arabian Sea close to the northwest coast of India. Finally, by mid-June, the heatwave event wanes as the summer monsoon clouds set in across the western ghats of India. The onset of summer monsoon clouds reduces the shortwave radiation, thus contributing to the decreasing temperature and termination of the heatwave.
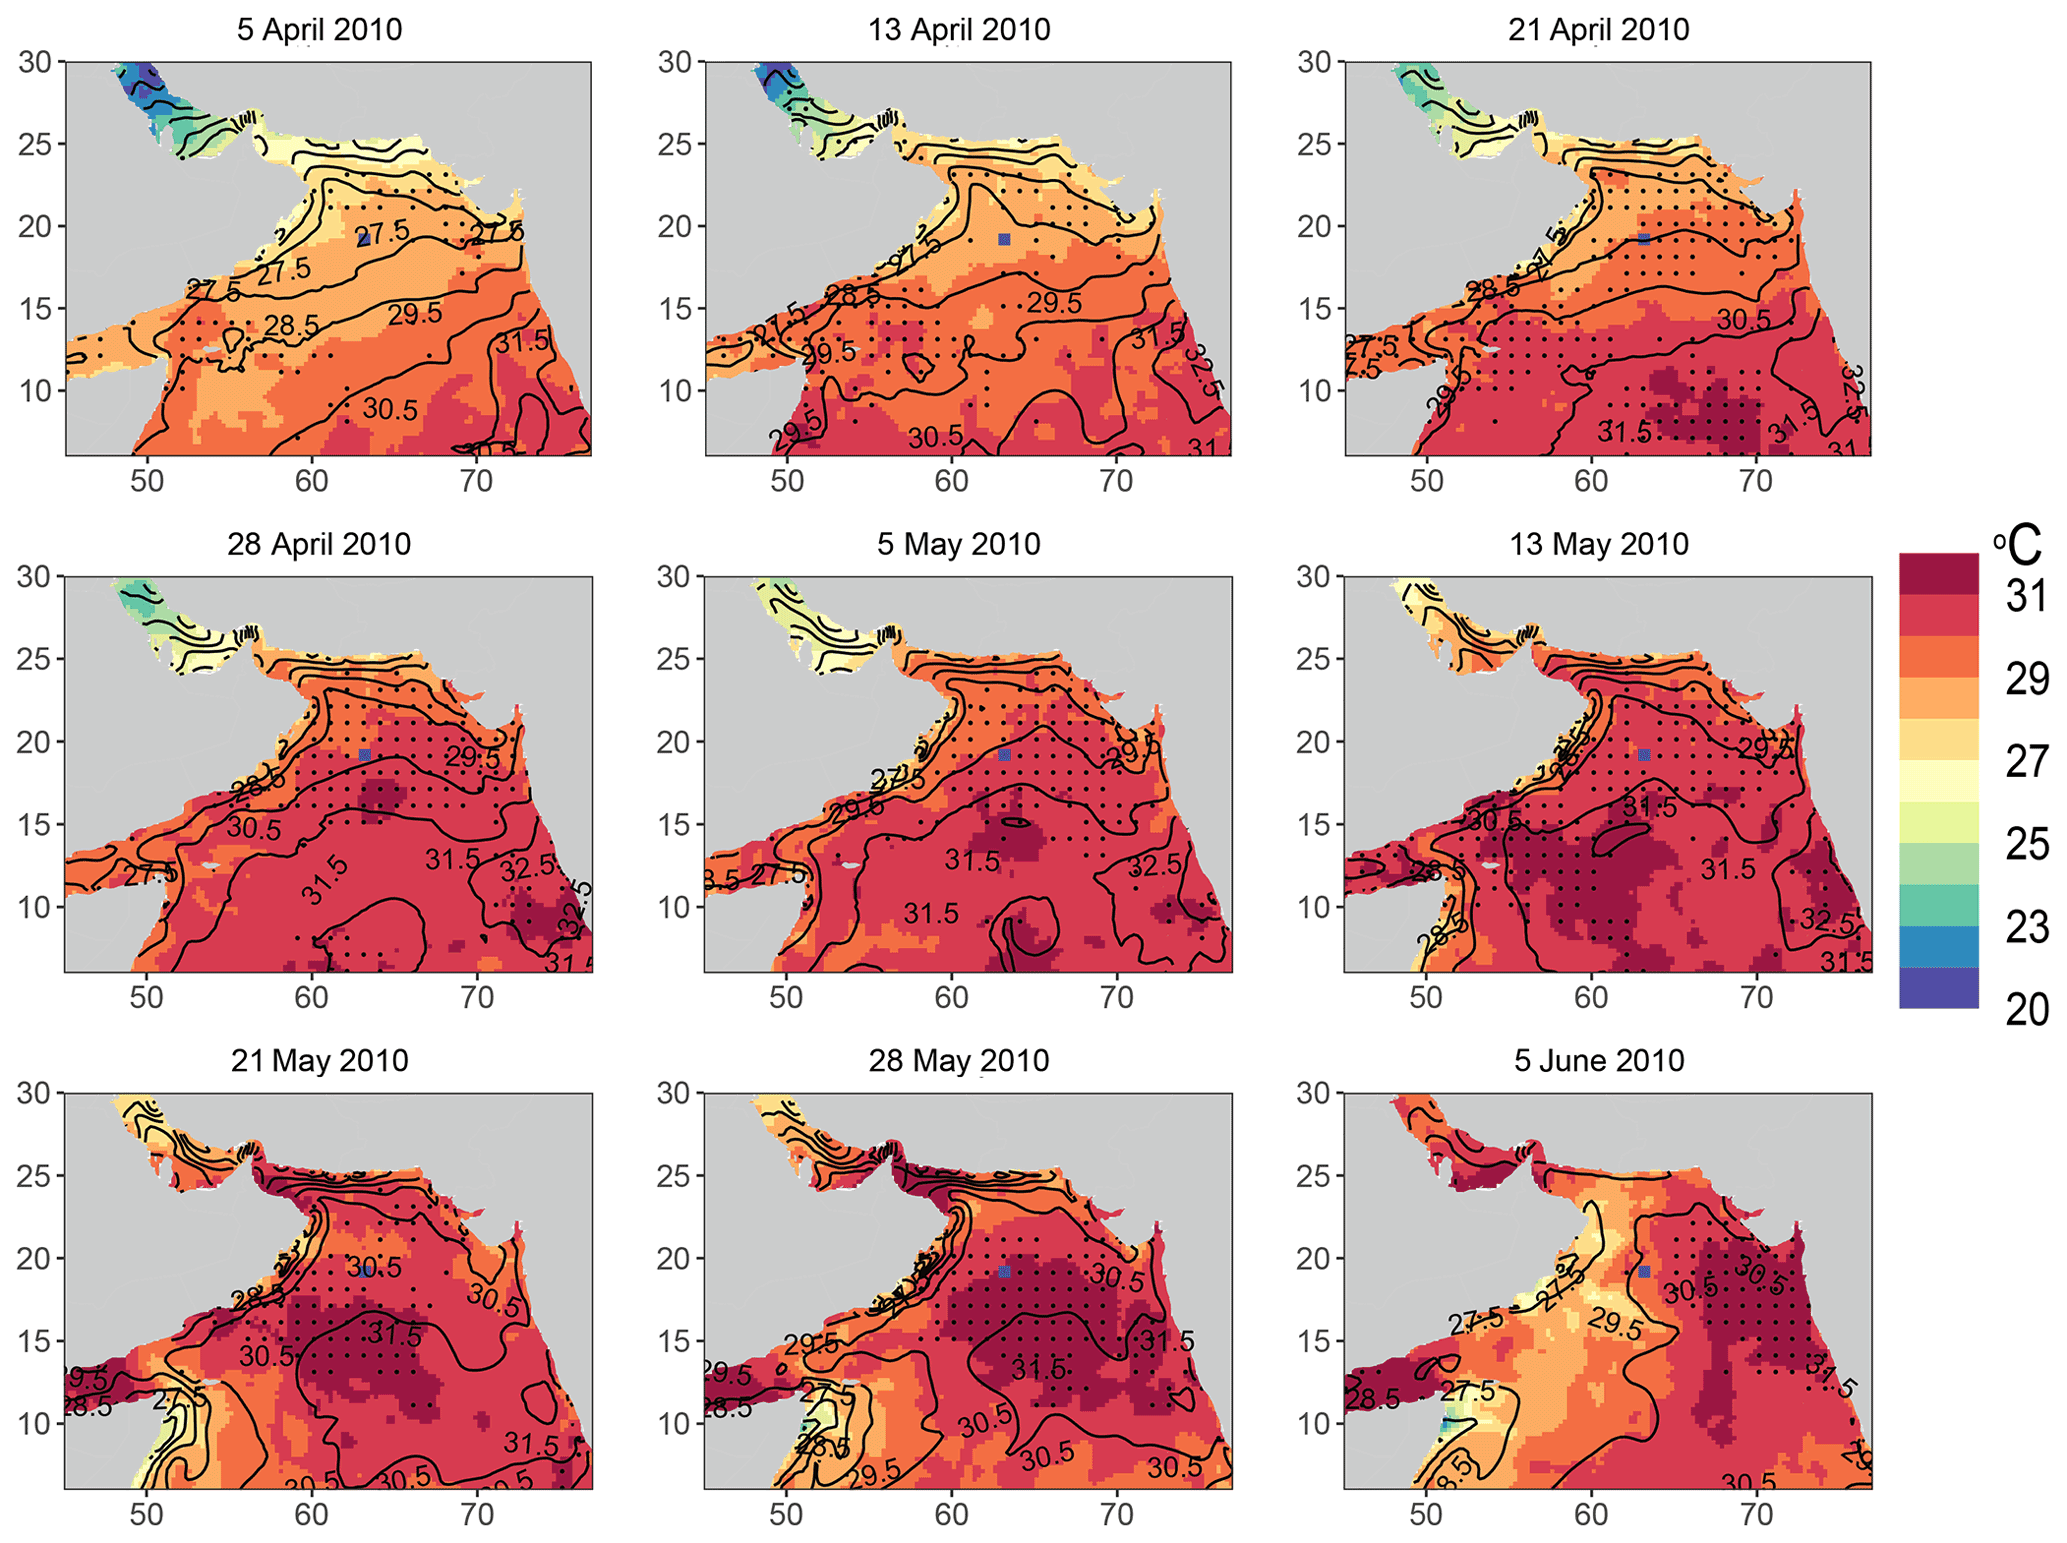
Figure 8Evolution of observed SST (shading; daily averaged) with model-simulated SST overlaid (contour) during April–June 2010. Regions experiencing MHWs are marked by stippling. The blue dot in the north–central Arabian Sea (19∘ N, 63∘ E) shows the location where the heat budget analysis was performed.
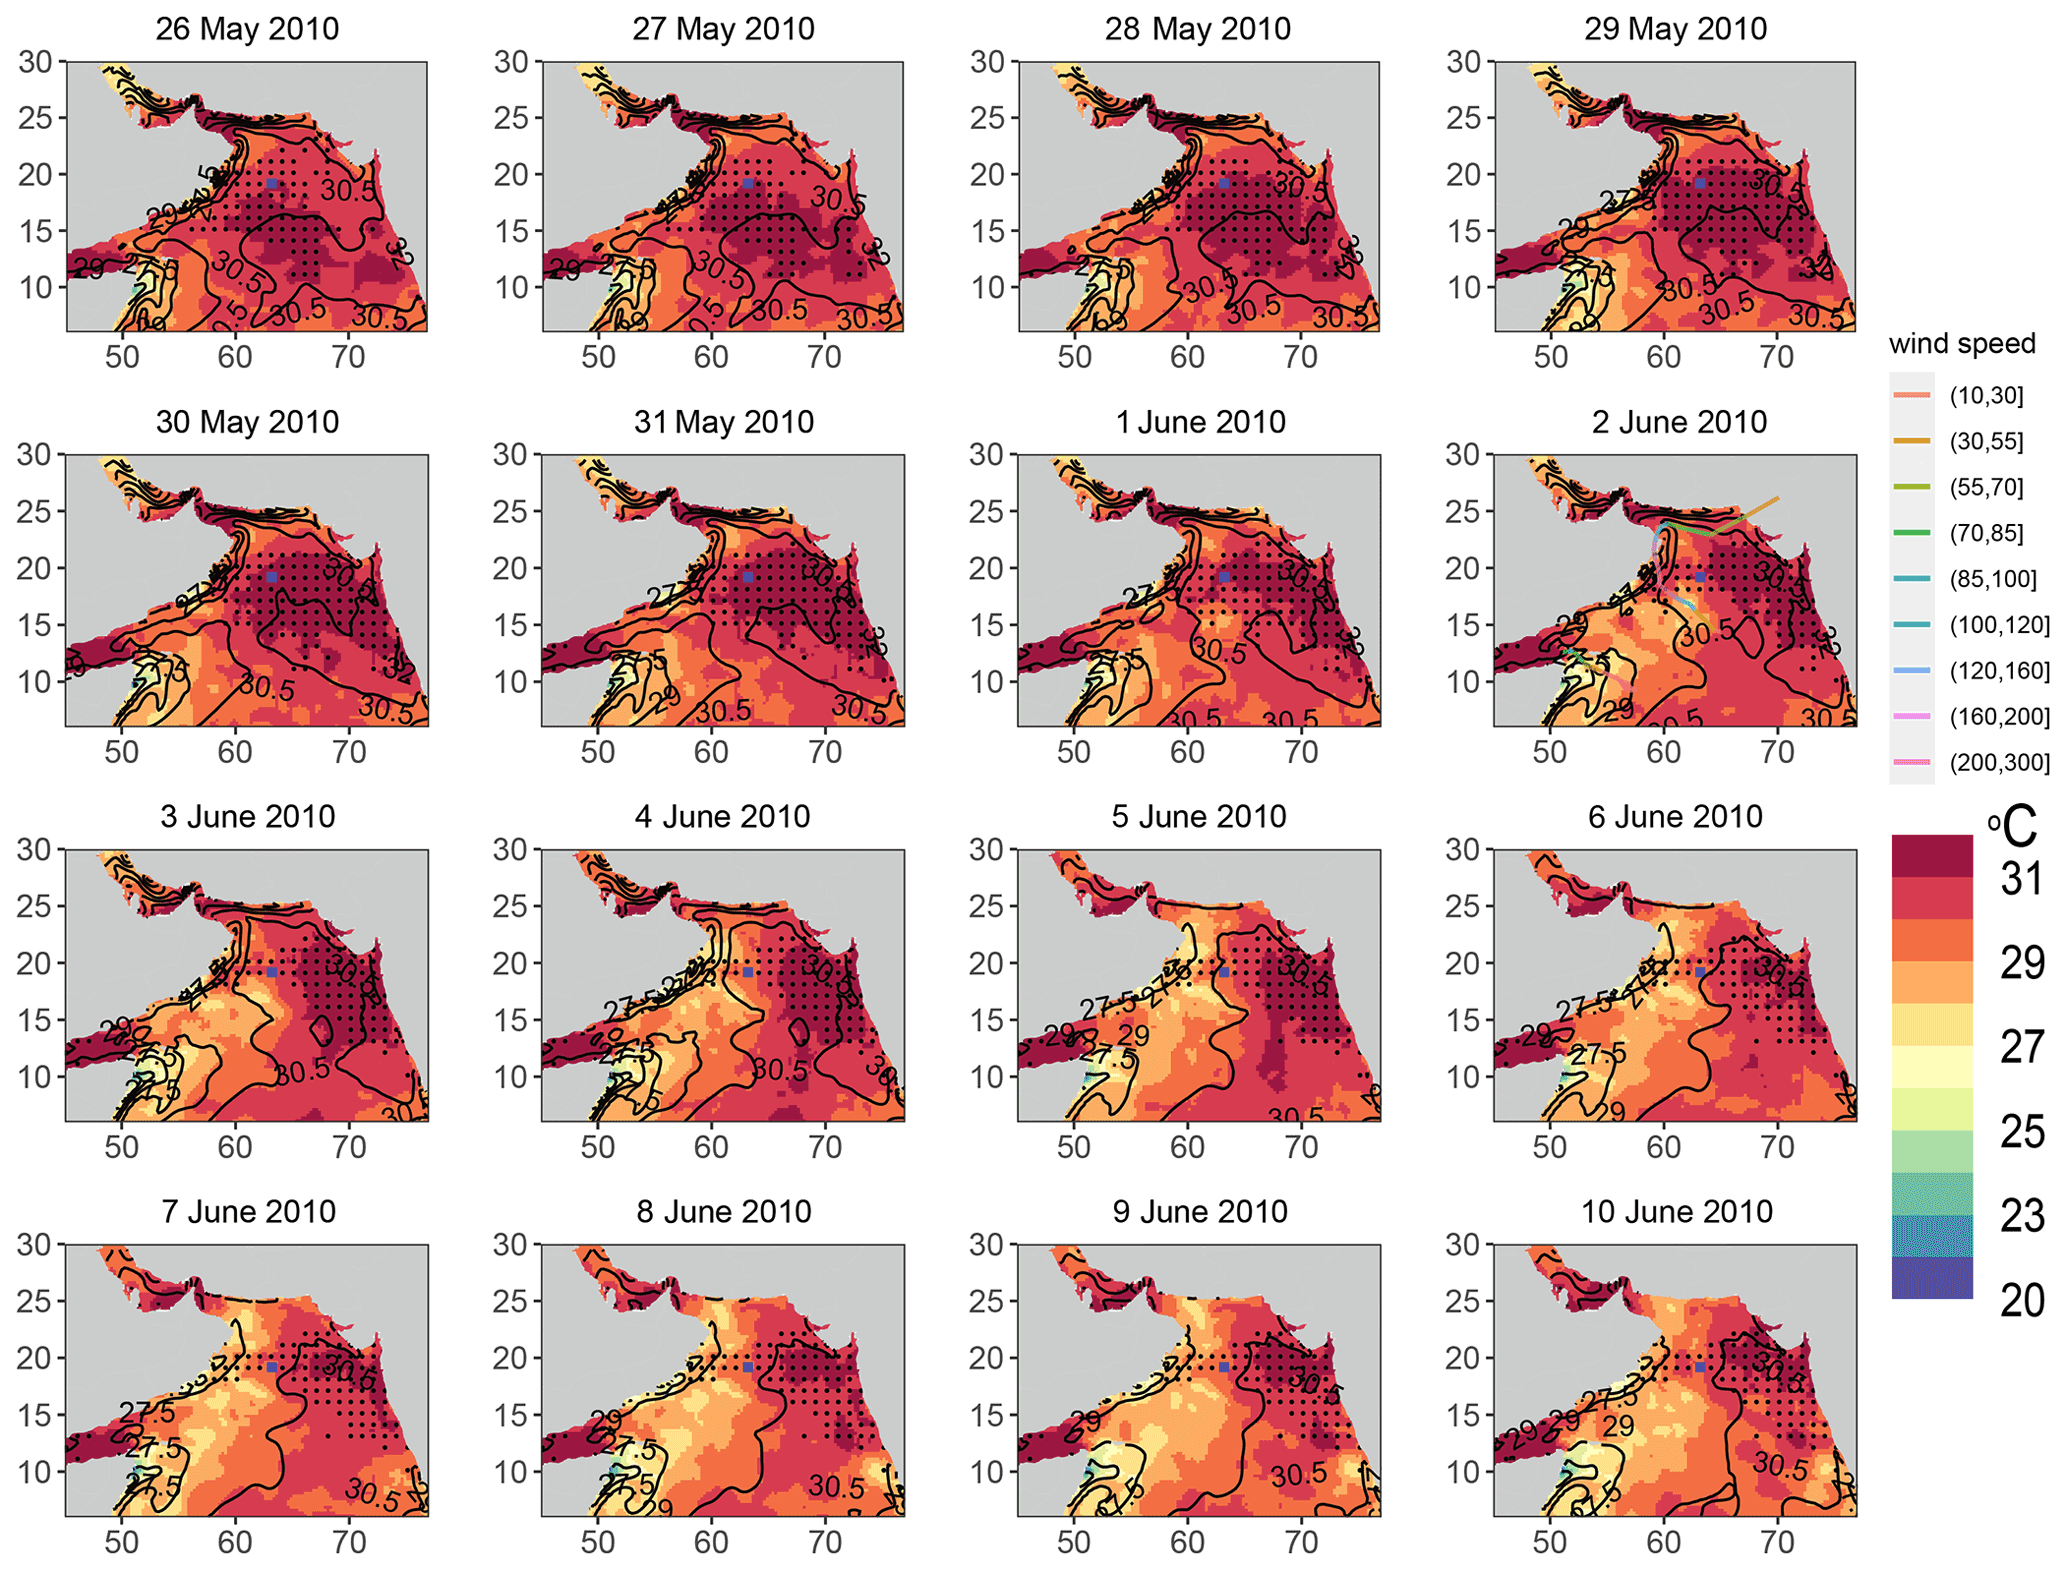
Figure 9Same as Fig. 8 but plotted daily to show the decaying phase of the heatwave event. The coloured curve on the panel for 2 June 2010 represents track (and wind speed) of the tropical cyclone Phet.
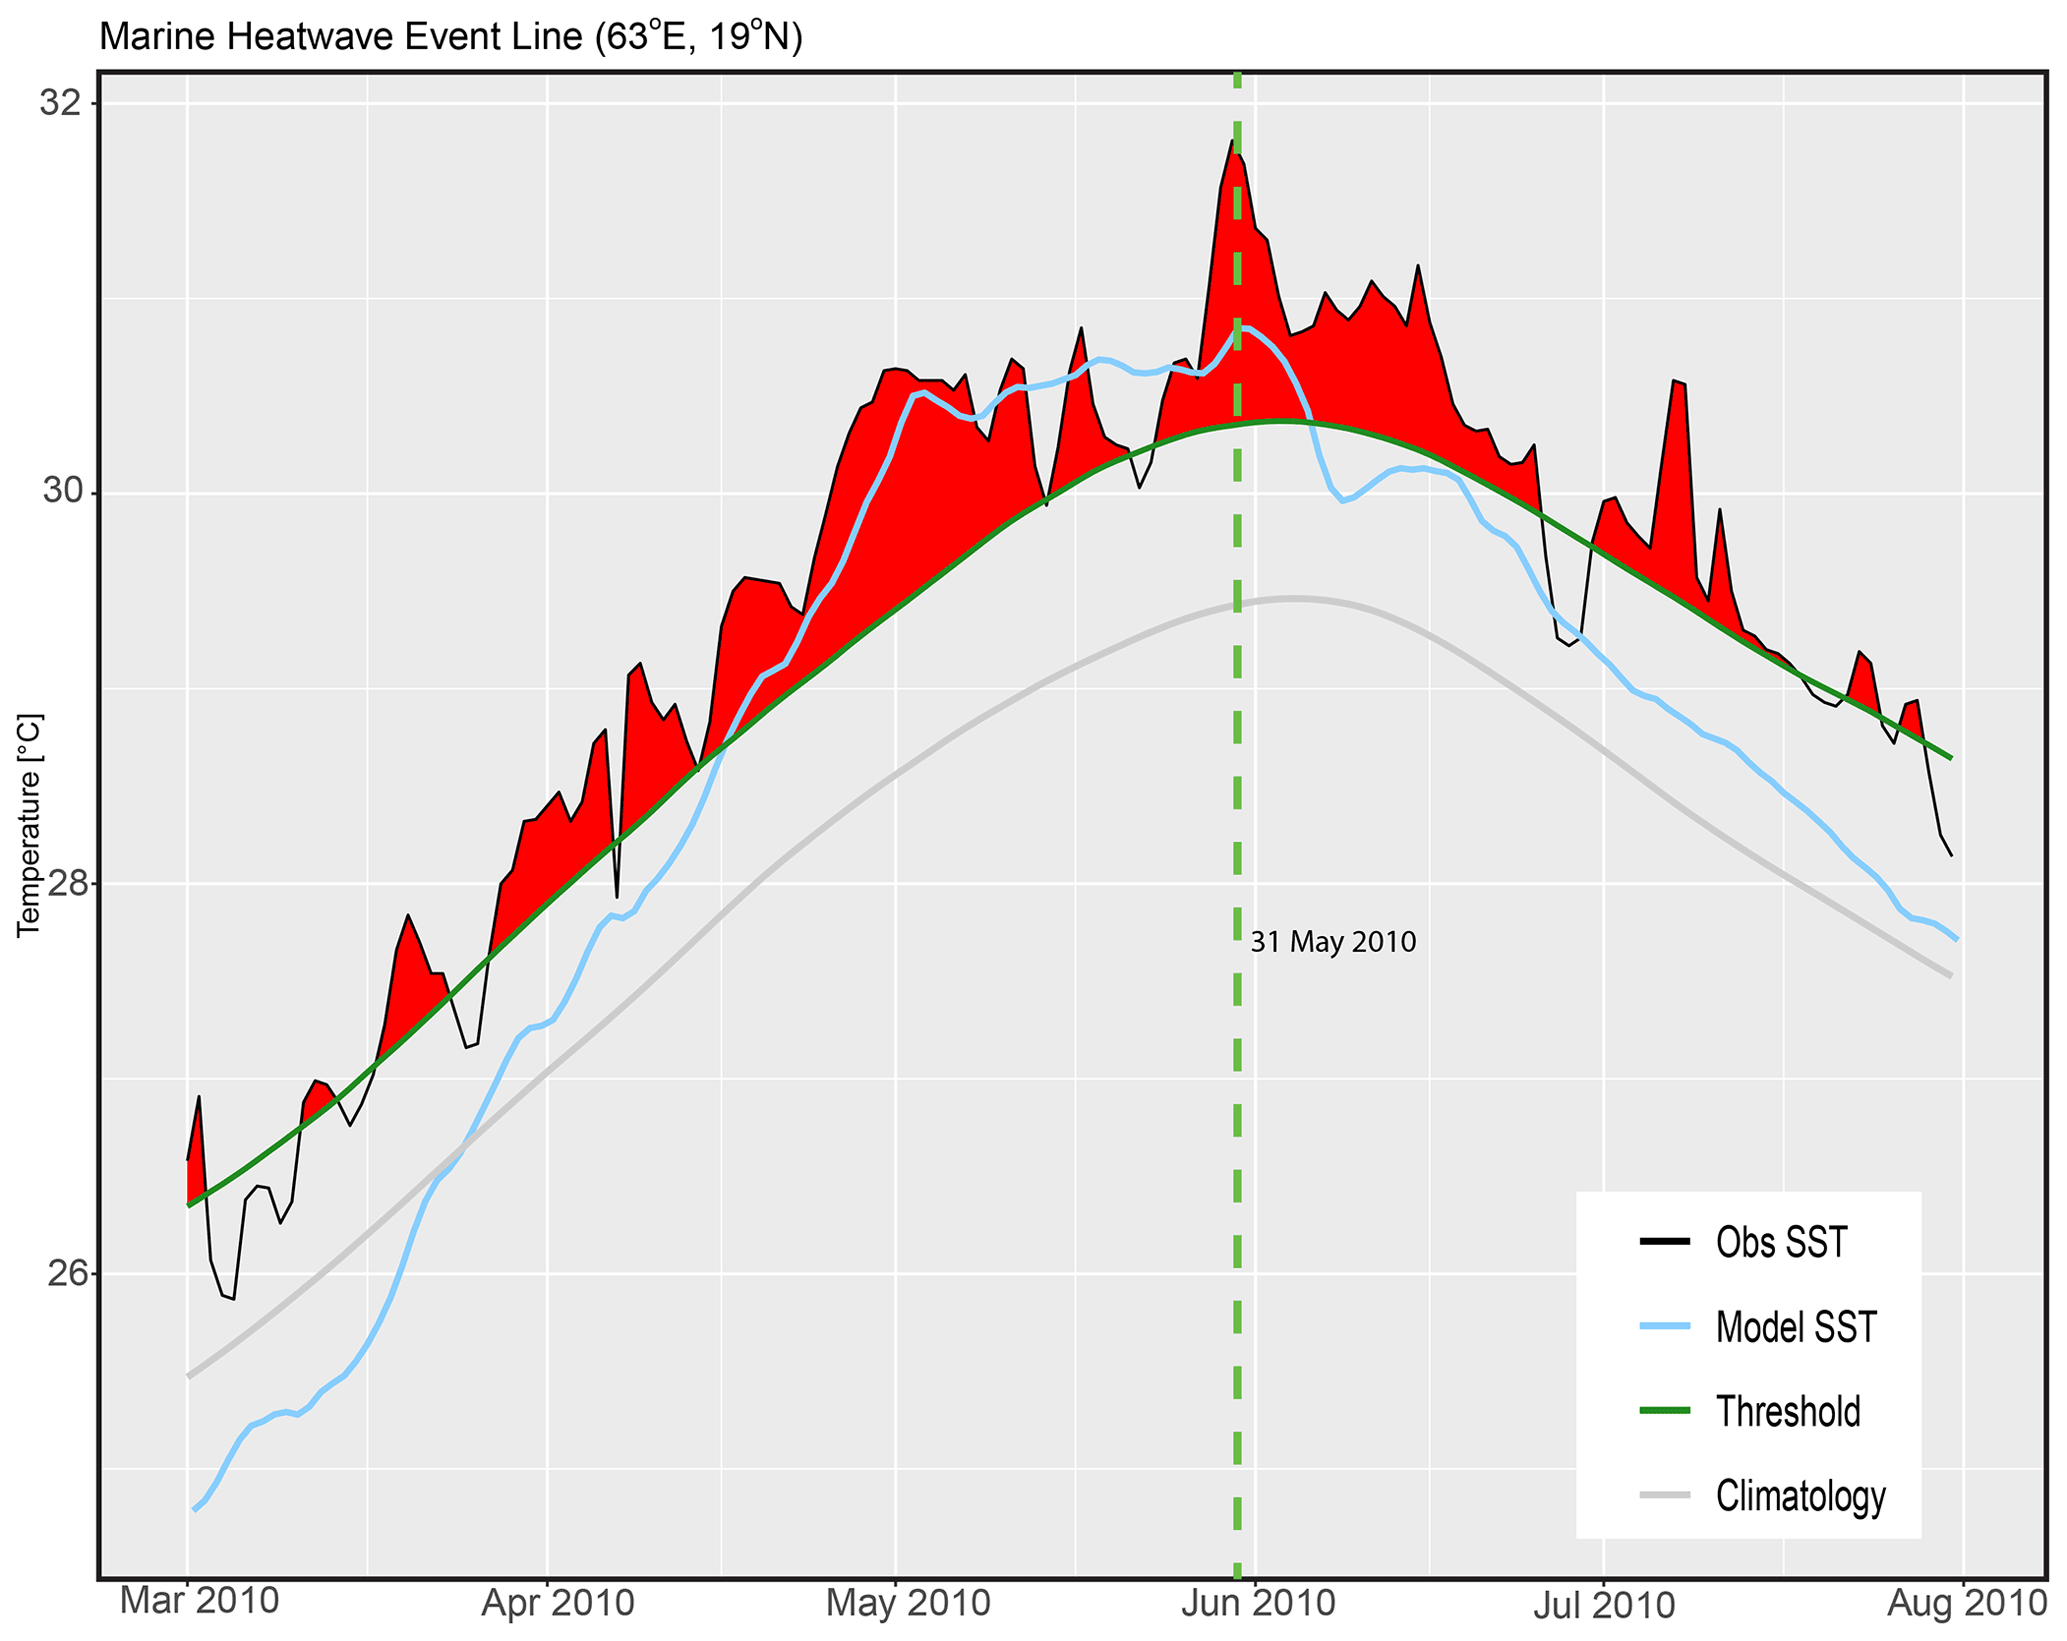
Figure 10Event line plot of the 2010 pre-monsoon heatwave event in the north–central Arabian Sea (19∘ N, 63∘ E). The red shading marks the departure of observed SST from the threshold i.e. the heatwave event. The blue line is the model-simulated SST. The green dashed line marks the initiation date of the tropical cyclone Phet.
The dominating processes involved in the generation of surface heatwaves in a particular region can be assessed through the analysis of heat sources and sinks in the upper mixed layer, which ultimately is reflected in the variation in the SST. This approach was employed earlier for the understanding of the evolution of heatwaves during the 2011 Ningaloo Niño off Western Australia (Benthuysen et al., 2014), during 2012 warming off northeastern America (Chen et al., 2014), and in the East China Sea and the south Yellow Sea during the summers of 2016–2018 (Gao et al., 2020). Here, we have used a similar mixed-layer heat budget formulation for the Arabian Sea (see Eq. 1) to understand the dominant physical processes that likely favour this heatwave event's generation. The model could simulate the rapid rise in SST during this period, albeit with a cold bias of about 0.5 ∘C (Fig. 10). The spatial pattern of SST is also captured quite well by the model throughout the season (Figs. 8 and 9), proving reasonable confidence in the mixed-layer budget based on this model simulation. Note, however, that the model failed to simulate very short-timescale SST variation (day to day), likely due to its resolution and coarser atmospheric flux used to force the model simulations.
Figure 11 shows the mixed-layer heat budget at a point (19∘ N, 63∘ E) located in the north–central Arabian Sea and central to the NAS box. The SST tendency starts to peak up by mid-March as the mixed layer shoals to about 20 m over most of the Arabian Sea (Fig. 12a), driven by weaker winds (Fig. 13). The weaker winds further add to the weakening of the evaporative cooling resulting in an increase in the net surface heat flux (Qv) (Fig. 11) and, therefore, a rapid increase in SST (Fig. 10). However, strong intraseasonal variability is evident, primarily driven by the net surface heat flux (Qv) owing to the intraseasonal variability in the surface winds. Owing to the weaker than normal winds driven by the El Niño atmospheric teleconnection, the anomalously shallow mixed layer during the pre-monsoon of 2010 (Fig. 12b) exaggerates the warming compared to the other years. The warming rate peaks in late April to early May as Qv continues to increase over the entire basin (Fig. 11). As the summer monsoon winds peak up (Fig. 13), the thermocline deepens and SST cools due to enhanced entrainment of cold subsurface water to the upper water column (Fig. 11). Additionally, enhanced wind speed increases the latent heat loss (Fig. 13) that further adds to the sharp decrease in Qv and, therefore, contributes to the further cooling of SST (Fig. 10). In the subsequent days, SST recovers a bit with a weakly positive tendency before a sharp drop again on 1 June 2010 driven by negative Qv and strong entrainment cooling (Fig. 11). This sharp drop in SST is linked to the severe cyclone Phet. The tropical cyclonic storm Phet first developed on 31 May 2010 in the central Arabian Sea around 1000 km west of Mumbai. It attains its peak wind speed of about 230 km h−1 on 2 June 2010 and makes landfall in eastern Oman on 3 June 2010 (see panel for 2 June in Fig. 8 for the cyclone track). The SST along this cyclone track decreases rapidly (by more than 1 ∘C) and contributes significantly to the weakening of the persisting heatwave in this region (Fig. 9). After this cyclone, the SST recovers slightly but remains relatively cooler (Fig. 10) due to the gradual decrease in shortwave flux and enhanced latent heat loss (Fig. 13). It indicates that cyclone Phet played a significant role in terminating the persisting heatwave in a large part of the western Arabian Sea. Finally, the following intensification of summer monsoon winds and the reduction in shortwave flux due to cloud cover reduces the SST further, resulting in the waning of the heatwave event from the northern Arabian Sea.
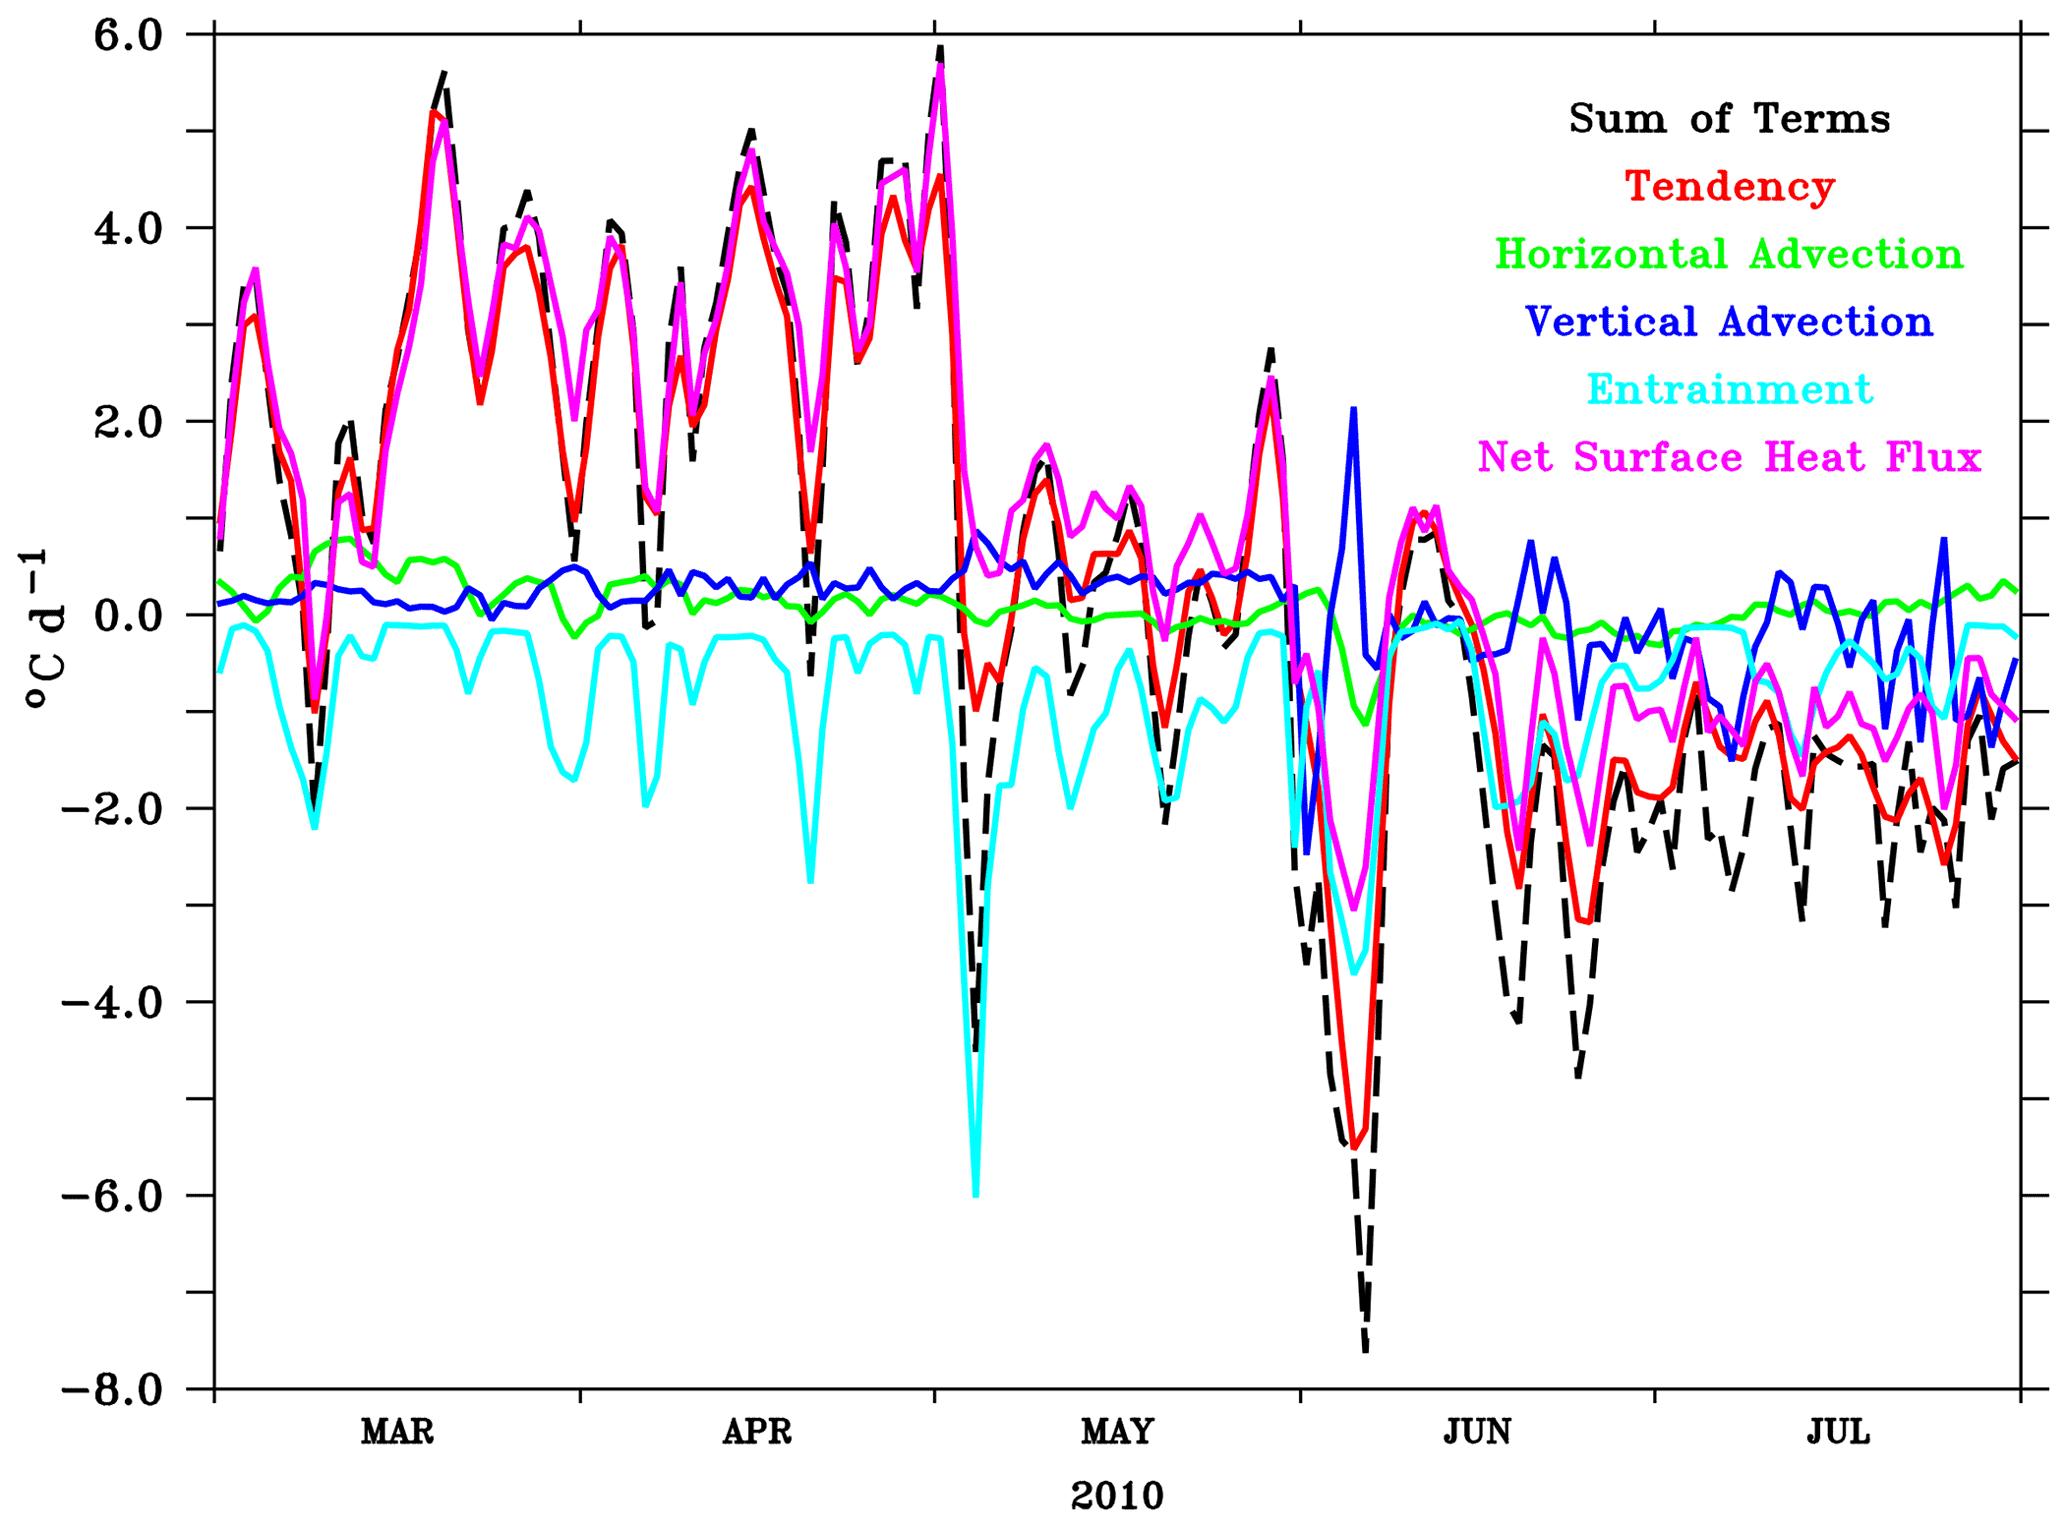
Figure 11Mixed-layer heat budget analysis in the north–central Arabian Sea (19∘ N, 63∘ E). The “sum of terms” represents the sum of all terms on the right side of Eq. (1).
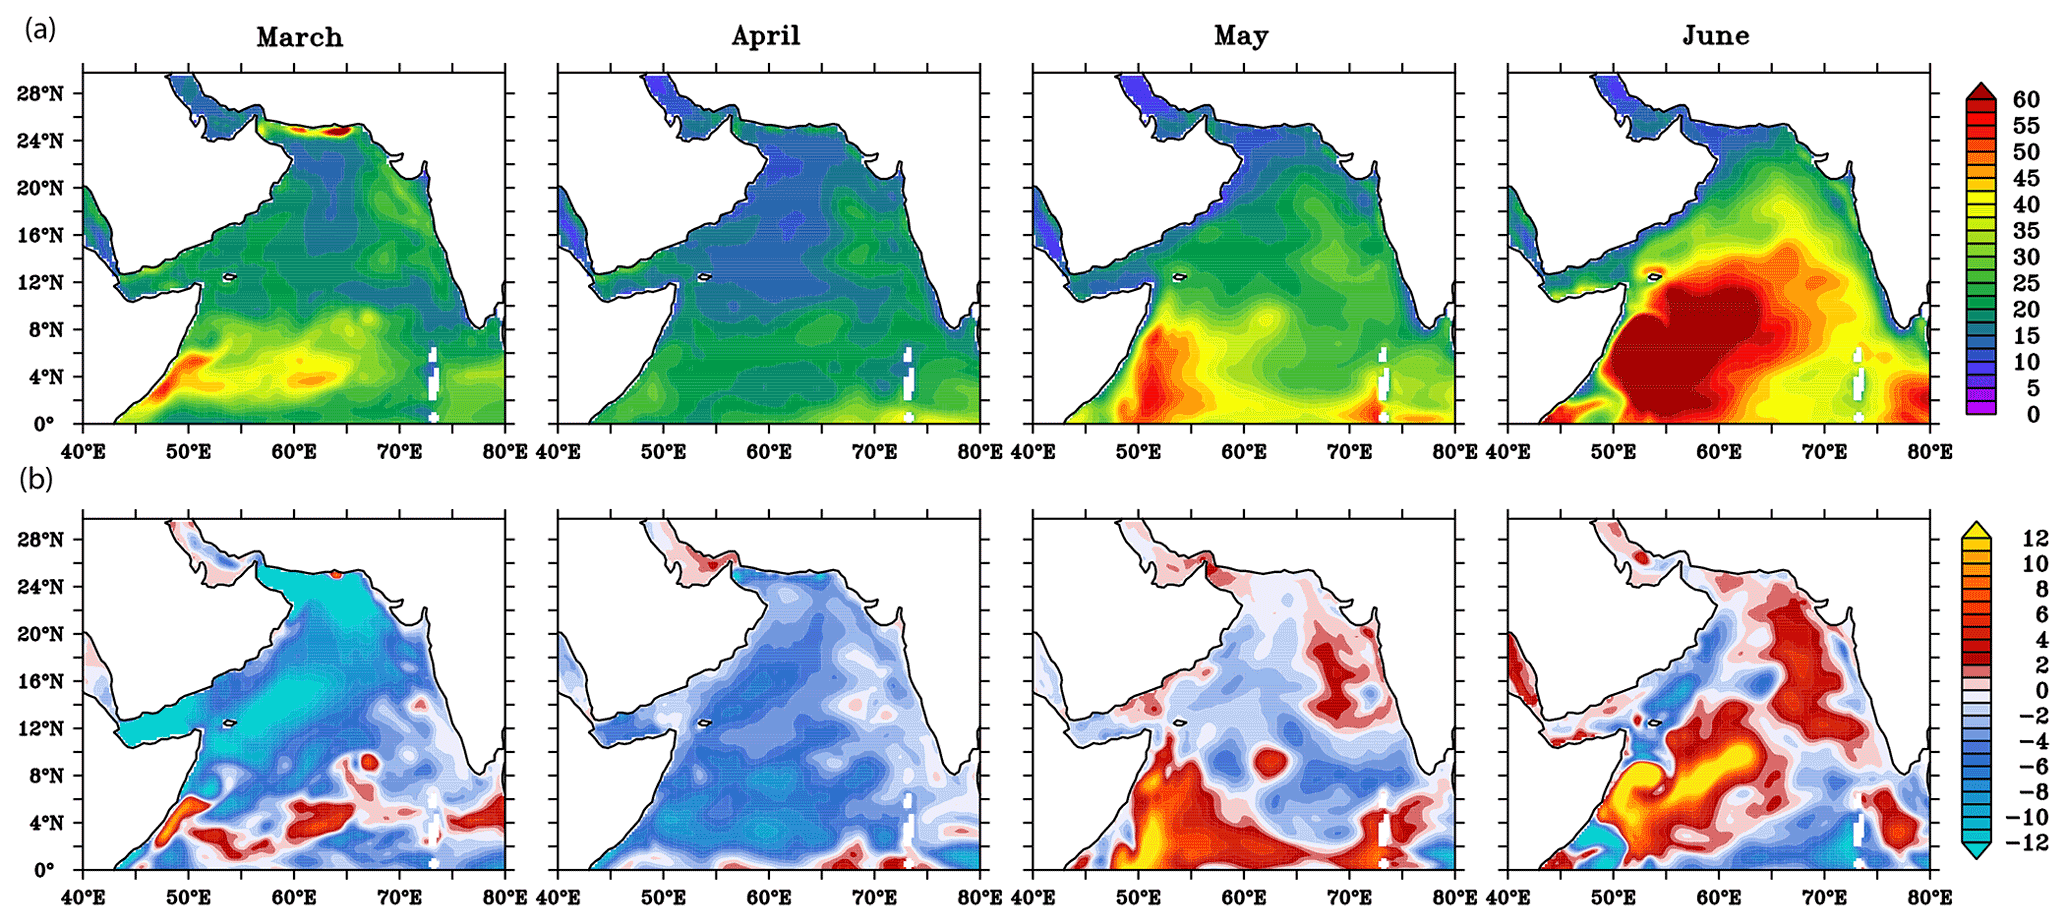
Figure 12Model-simulated mixed-layer depth (a) and anomaly (b) for March–June 2010.
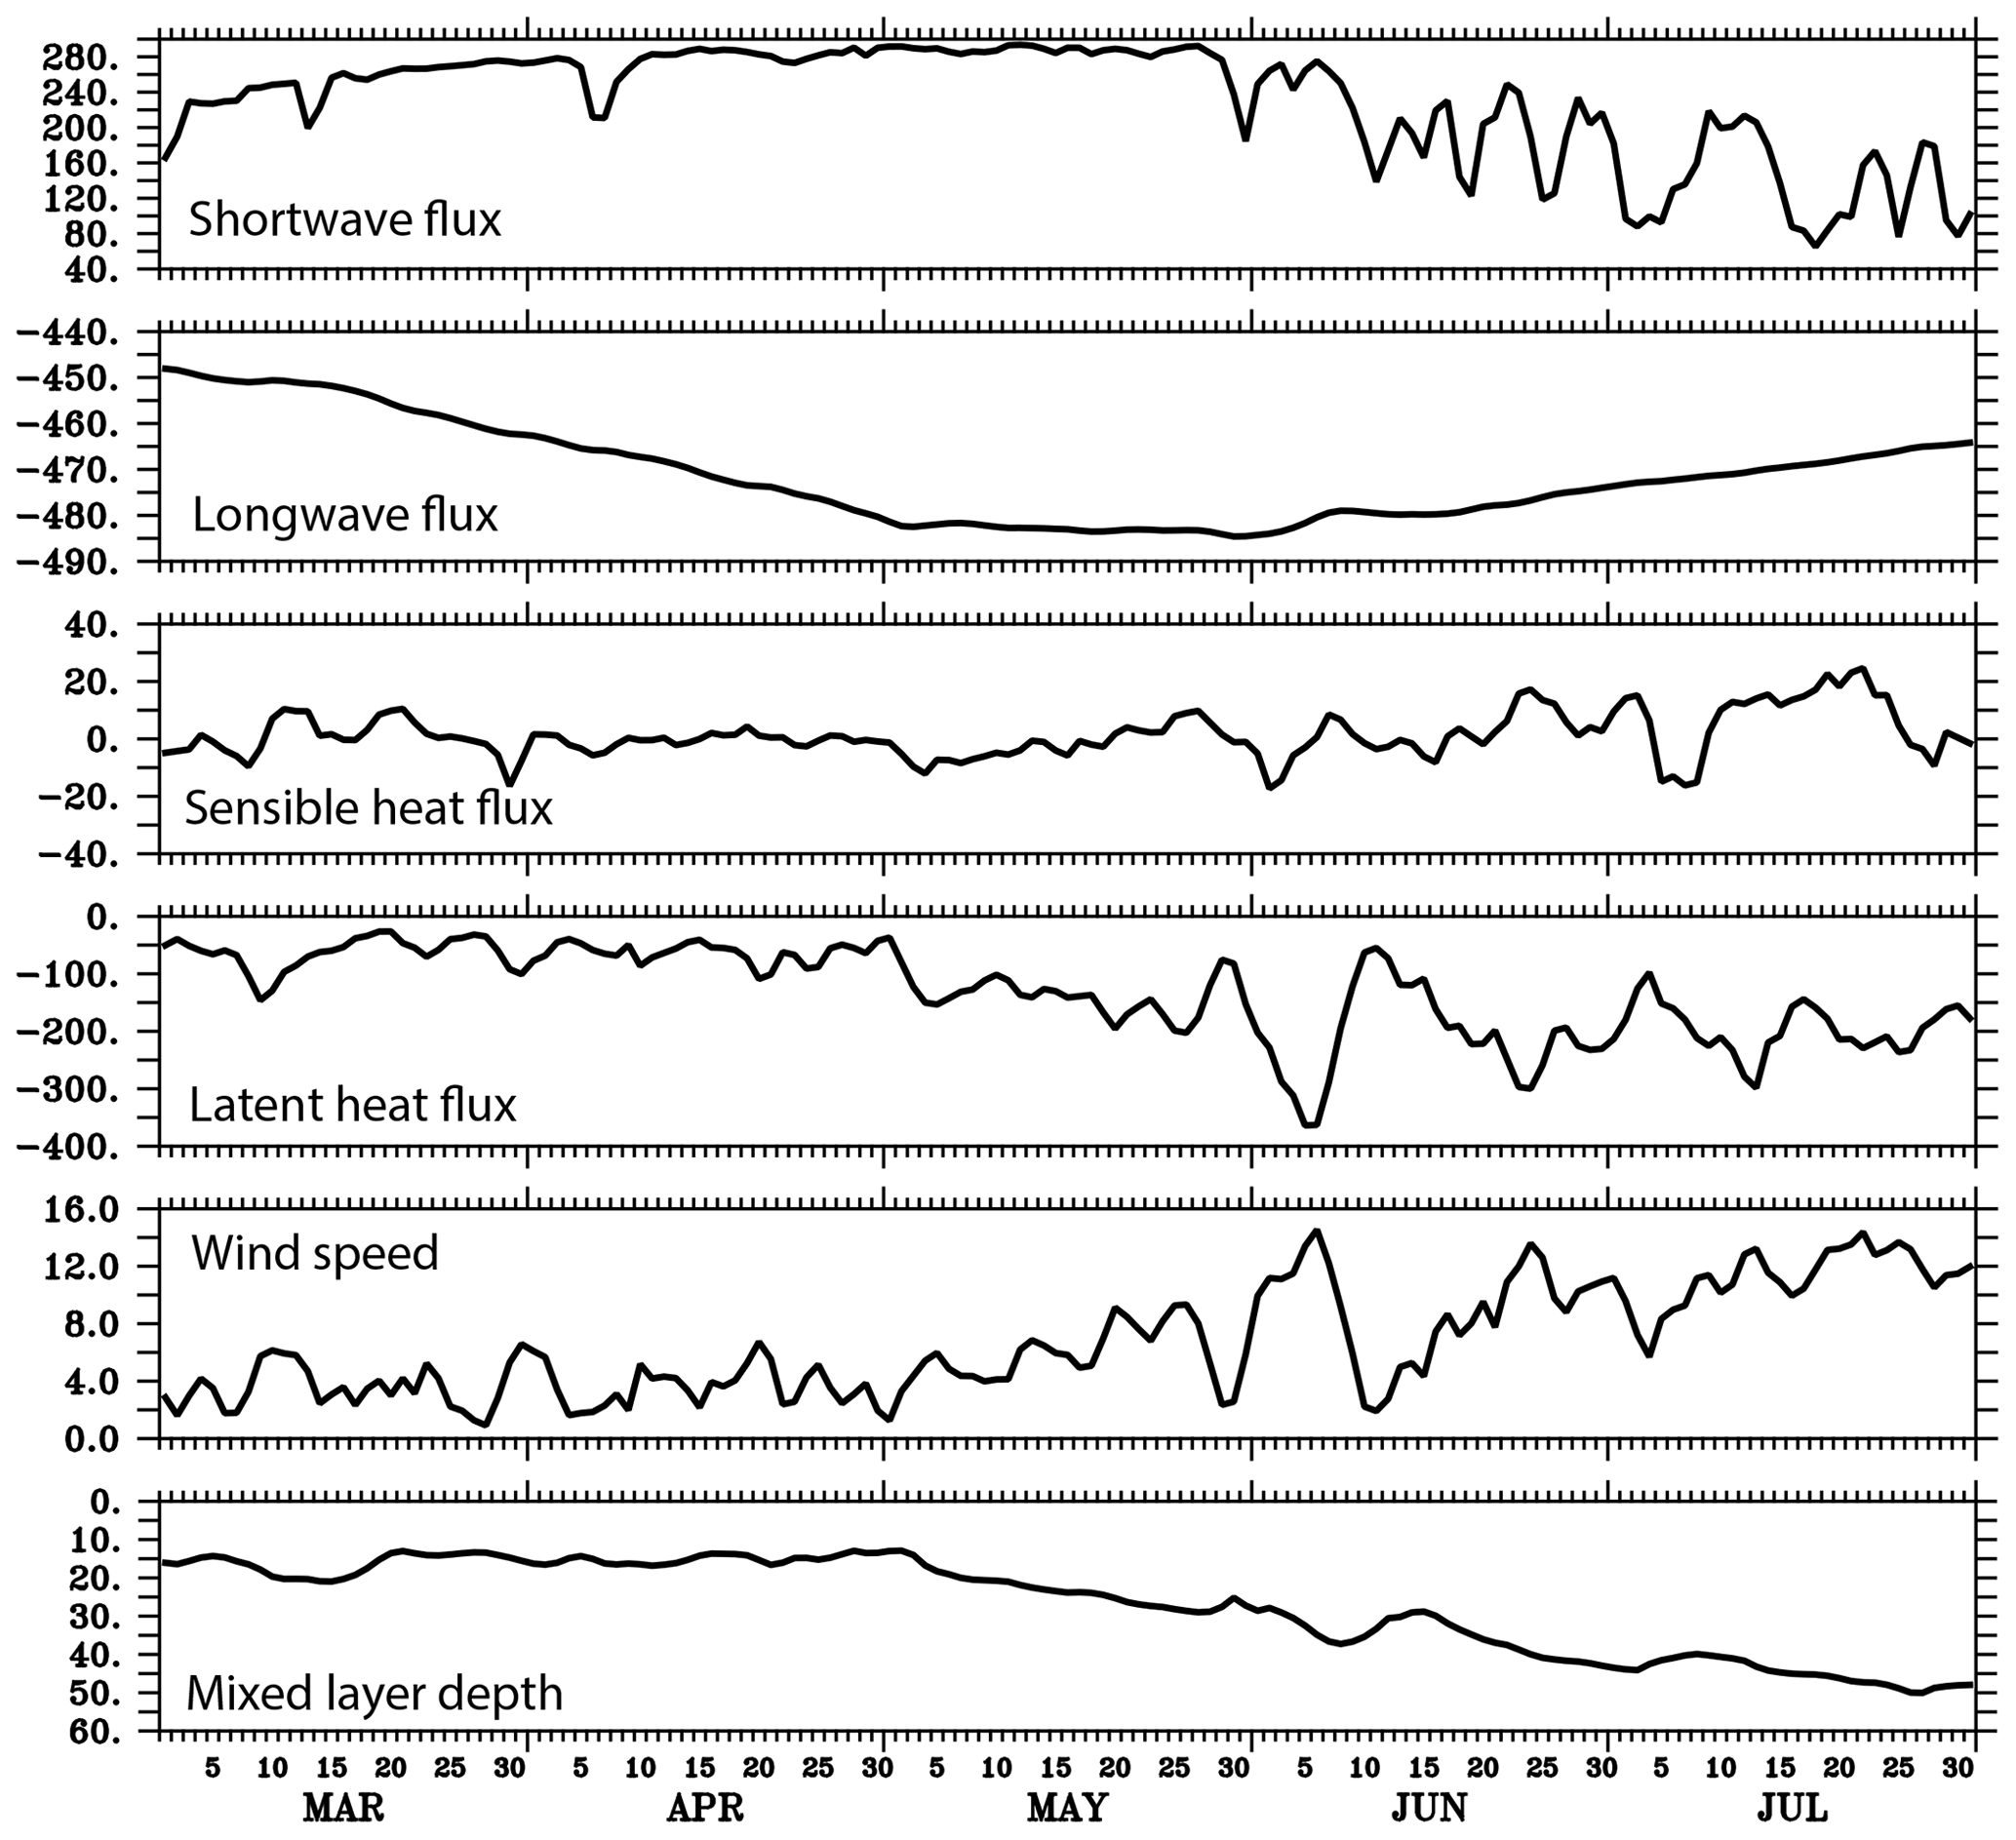
Figure 13Surface heat fluxes, wind speed, and mixed-layer depth in the north–central Arabian Sea during March–June 2010.
In this study, we have investigated the trends and genesis of the MHWs in the Arabian Sea (north of 5∘ N). Particularly, we have studied the three primary metrics of heatwaves: duration, frequency, and intensity for the period of 1982–2019 and rallied primarily on the OISSTv2 SST observations. Further, we have carried out a case study for the longest heatwave events during the study period using an ocean model simulation based on Modular Ocean Model version 5 (MOM5) for understanding the underlying forcing mechanism in the genesis of such heatwave events.
Like other regions of the world ocean, we find that the Arabian Sea also experiences a rapid increase in heatwave days. At the same time, the heatwave frequency shows a marginal increase, suggesting that the heatwaves have now become prolonged and, in fact, sometimes persistent for an entire season in the recent decade. However, due to the weaker SST variability in this basin, a consequence of equatorial proximity, there is no significant increase in the heatwave intensity, a parameter often used to mark these events. Thus, this region remains unexplored in terms of MHWs in other global studies. The increasing trend of heatwave days is mainly evident in the post-2000 era and becomes conspicuous after 2015.
A detailed study for the pre-monsoon (or spring intermonsoon) and the summer monsoon indicates that the heatwave trend varies significantly across the seasons. During the pre-monsoon, an increase in heatwave days at a rate of 15–20 d per decade is evident primarily in the northern part of the Arabian Sea and along the coast of Arabia. However, during summer, the increasing trend at a similar rate is evident all along the west coast of India and over a large part of the southeastern Arabian Sea. Noticeably, across the last 4 decades, the years 2010 and 2016 show the longest heatwave days as the strong El Niño, on top of the mean warming trend, caused high and persistently warm SST across the Arabian Sea. An analysis of heatwave days based on a detrended SST anomaly suggests that the enormous trend in the observed heatwave days is primarily linked to the rise in the mean SST of the Arabian Sea. The switch between the dominance of SST variability and the mean SST warming happened sometime around 2000. However, SST variability still contributes significantly for the years when climate variability is dominated by major climate modes and is a significant source of SST warming in this basin. A detailed study of the association of heatwave days and these climate modes indicates that the Indian Ocean Basin Mode (also referred to as Indian Ocean warming mode) very strongly influences the genesis of MHWs via the decaying phase of El Niño influence. In fact, during the pre-monsoon, when this Indian Ocean Basin Mode is most active, it co-exists in more than 70 %–80 % of heatwave days.
During the summer monsoon, its influence weakens over the entire Arabian Sea but remains significantly prominent in the southeastern Arabian Sea. However, co-existing days are reduced to merely 40 % in the northern part, as evident in the correlation maps. The next most influential climate modes are found to be El Niño and positive IOD. These modes contribute to about 40 %–50 % of heatwave days in the northern Arabian Sea during the pre-monsoon. During the summer monsoon, the impact of these climate modes is relatively weaker but still contributes to more than 40 % of heatwave days in the southeastern Arabian Sea. But, in the north, the influence of El Niño and IOD is almost negligible during this season. It is noteworthy here that the longest heatwave event in the Arabian Sea is noted during spring 2010, which also coincides with the strongest central Pacific El Niño in recent decades (Lee and McPhaden, 2010). In fact, the central Pacific El Niños seem to have a greater impact over the Indian Ocean and, therefore, on the Indian monsoon rainfall (Krishna Kumar et al., 2006). The severe drought during the summer of 2009 is one such example. More generally, with ENSO and IOBM forcing of the Indian Ocean regions, other environmental hazards (for example, droughts over the Indian subcontinent) will co-occur with MHWs. Therefore, adaptation strategies will potentially need to account for the societal impacts of multiple co-occurring environmental stressors on land and in the ocean related to climate variability and change.
The heatwave genesis and its forcing mechanisms vary considerably from year to year and within the Arabian Sea. A mixed-layer heat budget shows a substantial heterogeneity in the forcing mechanisms of the genesis of MHWs in the Arabian Sea (figure not shown). Considering that case studies designed for a particular heatwave event are necessary for such an understanding, we analyse the possible forcing mechanisms for the longest (∼70 d) and one of the most intense (∼2 ∘C) heatwaves over the study period observed during the pre-monsoon of the year 2010. Owing to the positive wind-evaporation–SST feedback during the El Niño of 2009–2010 (Du et al., 2009), the 2010 springtime SST in the Arabian Sea shows a strong positive tendency, leading to the formation of one of the strongest heatwaves in the recent decade (Fig. 8). The heatwave starts to decay in the western Arabian Sea with the initiation of summer monsoon winds in the northern Indian Ocean. The upwelled water along the coast of Arabia limits the heatwave in the northeastern part of the Arabian Sea by late May. The decrease in net surface heat flux due to enhanced latent heat loss and reduced shortwave flux adds to the rapid cooling of SST during this period. Finally, the wind-steering-driven cooling, associated with tropical cyclone Phet and subsequent intensification of the summer monsoon, weakens the heatwave further.
A similar process is also observed in the late spring of 2020 when a severe cyclone Nisagra, which made landfall in Mumbai (a city located on the west coast of India), caused severe destruction by means of loss of life and property over a vast area, and ended a 1.5-month persistent heatwave of and intensity of more than 1 ∘C along the west coast of India (Figs. 14 and 15). Interestingly, while we were writing this paper, another severe cyclone Tauktae hit the west coast of India and caused extensive damage to property and life. This time, the SST was again more than 31 ∘C off the west coast of India. These similar events suggest that persistent extreme warm conditions like heatwaves may be linked to the increased cyclogenesis over the Arabian Sea in the recent decade. In fact, as the number of heatwave days has increased significantly over the last 2 decades, the number of tropical cyclones has also increased over the Arabian Sea (Fig. 14), indicating a clear association between the heatwaves and the increased cyclogenesis in the Arabian Sea. In a recent study using a longer record, Deshpande et al. (2021) reported a 52 % increase in the frequency of cyclonic storms over the Arabian Sea in recent decades. Further study is required to understand the dynamical links between heatwaves and associated atmospheric conditions on the one hand and the observed enhanced cyclogenesis of this region on the other.
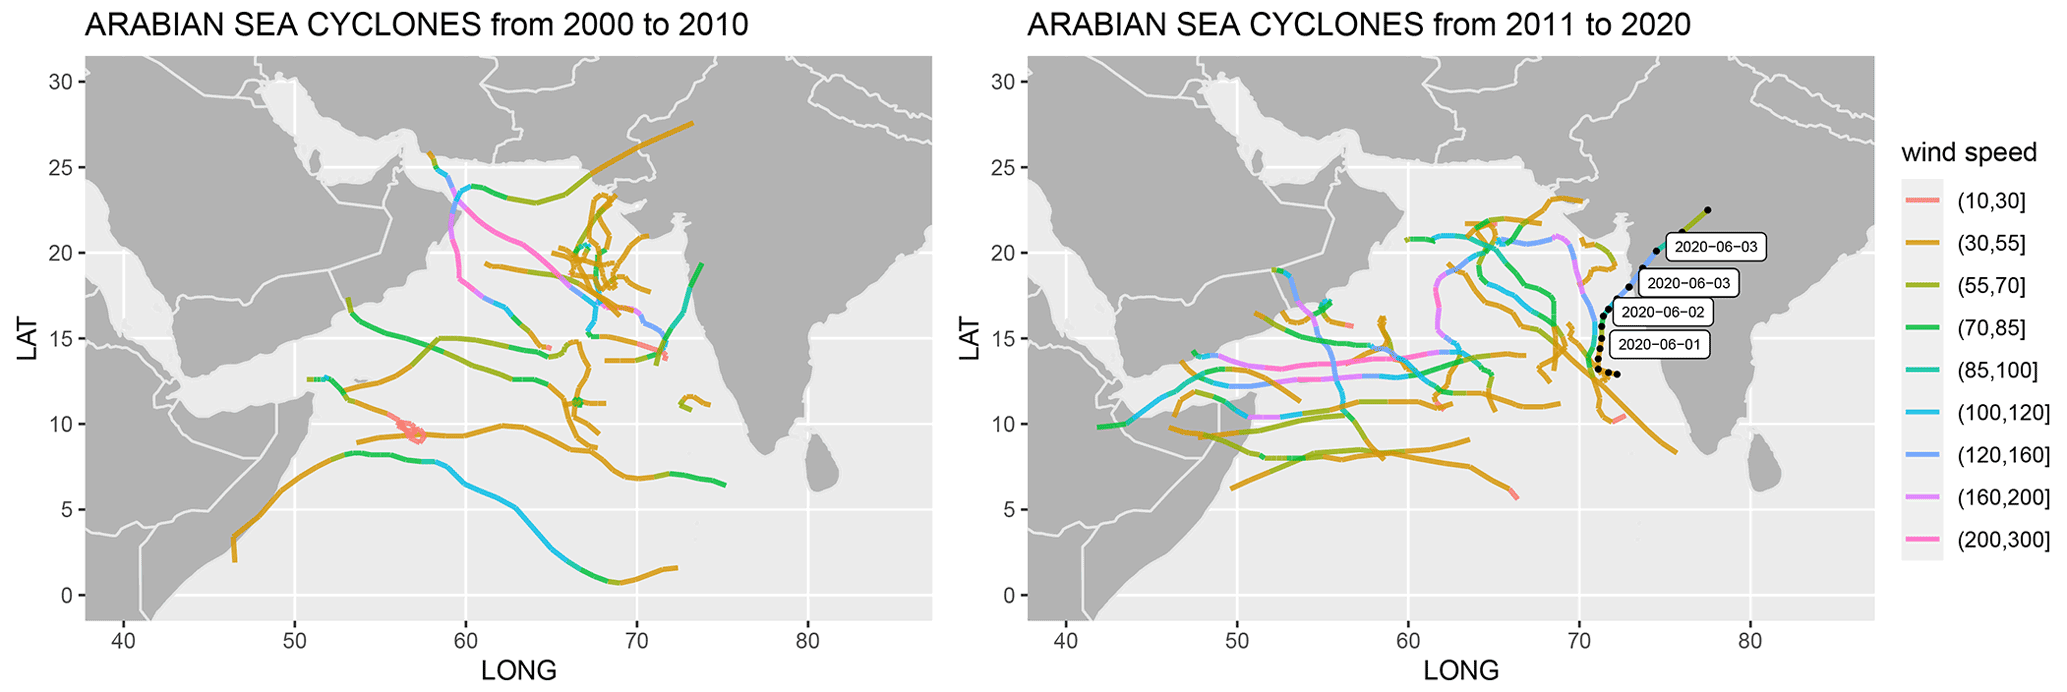
Figure 14Cyclone tracks and their wind speeds during 2000–2010 (left) and 2011–2022 (right). The cyclone Nisagra is marked by its propagation dates.

Figure 15Event line during March–July 2020 at a location off the west coast of India (off Goa). The green dashed line represents the date when the Nisagra cyclone passed over off Goa, India.
This rapid increase in heatwave days in the northern and southeastern Arabian Sea is also likely to have a severe impact on the physio-biogeochemical processes of this basin. One such possible impact is the recent increase in the harmful algal bloom in the Arabian Sea. Recent studies suggest that there is a manyfold increase in the harmful phytoplankton blooms in the northern Arabian Sea and along the west coast of India attributed primarily to the increased stratification, weaker winds, and warming of the Arabian Sea (Padmakumar et al., 2012; Al Shehhi et al., 2014; Goes et al., 2020). Considering that the regions of increased toxic blooms are collocated with the regions where the increased heatwave days are observed, a possible relation between these heatwave events and the triggering of harmful blooms cannot be neglected.
It is noteworthy that the heatwave extremes are defined here using a fixed baseline of 1982–2011. Hence, considering that the recent decades have experienced a rapid rise in SST, the overall SST running mean has shifted more towards the heatwave threshold in the recent past. Therefore, if one were to use a moving baseline, warming SSTs would not necessarily lead to a trend in MHW days. The construct of the MHW definition should take into account the ultimate impact we intend to address. The fixed baseline is possibly better suited when the impact on marine biology or atmospheric phenomena like cyclones is considered, whereas the moving baseline may be a better choice if the effects of the warming trend are to be avoided. The implication of various such heatwave definitions is discussed in Oliver et al. (2021).
In summary, this study documented marine heatwaves and their various characteristics in the Arabian Sea. This is the first study where a detailed analysis of marine heatwaves for the Arabian Sea, particularly for the coastal water of economic importance, is discussed. This study advocates further investigation of the impact of heatwave events on the coastal ecosystems and other oceanic properties of this tropical basin.
The daily OISST is obtained from https://coastwatch.pfeg.noaa.gov/erddap/ (Huang et al., 2020). The daily North Atlantic Oscillation Index was provided by the NCEP Climate Prediction Centre (https://ftp.cpc.ncep.noaa.gov/cwlinks/, last access: 7 May 2022). The best track data for cyclones are obtained from the “Best Track Archive” of the Joint Typhoon Warning Centre (https://www.metoc.navy.mil/jtwc/jtwc.html?north-indian-ocean, Naval Oceanography Portal, 2022). The model simulations will be made available upon request. The marine heatwave detection tool heatwaveR was taken from https://robwschlegel.github.io/heatwaveR/index.html (Schlegel and Smith, 2018).
AC designed the study and wrote the paper, AC and GA performed the data analysis, LRS conducted the model experiments. All authors contributed to developing the research and contributed to the discussion.
The contact author has declared that neither they nor their co-authors have any competing interests.
Publisher's note: Copernicus Publications remains neutral with regard to jurisdictional claims in published maps and institutional affiliations.
The lead author is grateful for the support provided by the Indian National Centre for Information Services (INCOIS), Ministry of Earth Sciences, to carry out this research. Funding for this work was provided from the “Deep Ocean Mission” programme of the Ministry of Earth Sciences, Government of India. The model simulations are carried out in the Ministry of Earth Science's central HPC facility, “MIHIR”. A part of this work was based on the master's dissertation thesis of Gouri Anil conducted at INCOIS. Lakshmi R. Shenoy was supported by the funding from an INSPIRE DST fellowship. Plotting and data analysis were carried out using R and Ferret software. This is INCOIS contribution no. 457.
This paper was edited by Neil Wells and reviewed by Michael McPhaden and one anonymous referee.
Ajayamohon, R. S. and Suryachandra, A. R.: Indian Ocean Dipole Modulates the Number of Extreme Rainfall Events over India in a Warming Environment, J. Meteorol. Soc. Jpn., 1, 245–252, 2008.
Al Shehhi, M. R., Gherboudj, I., and Ghedira, H.: An overview of historical harmful algae blooms outbreaks in the Arabian Seas, Mar. Pollut. Bull., 86, 314–324, https://doi.org/10.1016/j.marpolbul.2014.06.048, 2014.
Allan, R. J., Chambers, D., Drosdowsky, W., Hendon, H., Latif, M., Nicholls, N., Smith, I., Stone, R. C., and Tourre, Y.: Is there an Indian Ocean dipole and is it independent of the El Niño-Southern Oscillation?, CLIVAR Exchanges, 6, 18–22, 2001.
Arias-Ortiz, A., Serrano, O., Masqué, P., Lavery, P. S., Mueller, U., Kendrick, G. A., Rozaimi, M., Esteban, A., Fourqurean, J. W., Marbà, N., Mateo, M. A., Murray, K., Rule, M. J., and Duarte C. M.: A marine heatwave drives massive losses from the world's largest seagrass carbon stocks, Nat. Clim. Change, 8, 338–344, https://doi.org/10.1038/s41558-018-0096-y, 2018.
Ashok, K., Guan, Z., and Yamagata, T.: Influence of the Indian Ocean Dipole on the Australian winter rainfall, Geophys. Res. Lett., 30, 1821, https://doi.org/10.1029/2003GL017926, 2003.
Benthuysen, J., Feng, M., and Zhong, L.: Spatial patterns of warming off Western Australia during the 2011 Ningaloo Nino: Quantifying impacts of remote and local forcing, Cont. Shelf Res., 91, 232–246, 2014.
Benthuysen, J. A., Oliver, E. C. J., Feng, M., and Marshall, A. G.: Extreme marine warming across tropical Australia during austral summer 2015–2016, J. Geophys. Res., 123, 1301–1326, 2018.
Bond, N. A., Cronin, M. F., Freeland, H., and Mantua, N.: Causes and impacts of the 2014 warm anomaly in the NE Pacific, Geophys. Res. Lett., 42, 3414–3420, 2015.
Caputi, N., Kangas, M., Denham, A., Feng, M., Pearce, A., Hetzel, Y., and Arani, C.: Management adaptation of invertebrate fisheries to an extreme marine heatwave event at a global warming hot spot, Ecol. Evol., 6, 3583–3593, https://doi.org/10.1002/ece3.2137, 2016.
Cavole, L. M., Demko, A. M., Diner, R. E., Giddings, A., Koester, I., Pagniello, C. M. L. S., Paulsen, M.-L., Ramirez-Valdez, A., Schwenck, S. M., Yen, N. K., Zill, M. E., and Franks, P. J. S.: Biological impacts of the 2013–2015 warm-water anomaly in the Northeast Pacific: Winners, losers, and the future, Oceanography, 29, 273–285, https://doi.org/10.5670/oceanog.2016.32, 2016.
Chakravorty, S., Chowdary, J. S., and Gnanaseelan, C.: Epochal changes in the seasonal evolution of Tropical Indian Ocean warming associated with El Niño, Clim. Dynam., 42, 805–822, https://doi.org/10.1007/s00382-013-1666-3, 2014.
Chatterjee, A., Shankar, D., Shenoi, S., Reddy, G., Michael, G., Ravichandran, M., Gopalkrishna, V. V., Rao, E. P. R., Bhaskar, T. V. S. U., and Sanjeevan, V. N.: A new atlas of temperature and salinity for the North Indian Ocean, J. Earth Syst. Sci., 121, 559–593, 2012.
Chatterjee, A., Shankar, D., McCreary, J., and Vinayachandran, P.: Yanai waves in the western equatorial Indian Ocean, J. Geophys. Res.-Oceans, 118, 1556–1570, https://doi.org/10.1002/jgrc.20121, 2013.
Chatterjee, A., Shankar, D., McCreary, J., Vinayachandran, P., and Mukherjee, A.: Dynamics of Andaman Sea circulation and its role in connecting the equatorial Indian Ocean to the Bay of Bengal, J. Geophys. Res.-Oceans, 122, 3200–3218, https://doi.org/10.1002/2016JC012300, 2017.
Chatterjee, A., Kumar, B. P., Prakash, S., and Singh, P.: Annihilation of the Somali upwelling system during summer monsoon, Sci. Rep., 9, 7598, https://doi.org/10.1038/s41598-019-44099-1, 2019.
Chen, K., Gawarkiewicz, G. G., Lentz, S. J., and Bane, J. M.: Diagnosing the warming of the northeastern U. S. coastal ocean in 2012: a linkage between the atmospheric jet stream variability and ocean response, J. Geophys. Res.-Oceans, 119, 218–227, 2014.
Chen, Z., Shi, J., Liu, Q., Chen, H., and Li, C.: A persistent and intense marine heatwave in the Northeast Pacific during 2019–2020, Geophys. Res. Lett., 48, e2021GL093239, https://doi.org/10.1029/2021GL093239, 2021.
Chowdary, J. S. and Gnanaseelan, C.: Basin-wide warming of the Indian Ocean during El Niño and Indian Ocean dipole years, Int. J. Climatol., 27, 1421–1438, https://doi.org/10.1002/joc.1482, 2007.
CMFRI: Marine fisheries profile India, http://www.cmfri.org.in/data-publications-/5/2007 (last access: 7 May 2022), 2007.
de Boyer Montégut, C., Madec, G., Fischer, A. S., Lazar, A., and Iudicone, D.: Mixed layer depth over the global ocean: An examination of profile data and a profile-based climatology, J. Geophys. Res., 109, C12003, https://doi.org/10.1029/2004JC002378, 2004.
Deshpande, M., Singh, V. K., Ganadhi, M. K., Roxy, M. K., Emmanuel, R., and Kumar, U.: Changing status of tropical cyclones over the north Indian Ocean, Clim. Dynam., 57, 3545–3567, https://doi.org/10.1007/s00382-021-05880-z, 2021.
Du, Y., Xie, S.-P., Huang, G., and Hu, K.: Role of air–sea interaction in the long persistence of El Niño–induced North Indian Ocean warming, J. Climate, 22, 2023–2038, 2009.
Durand, F., Shetye, S. R., Vialard, J., Shankar, D., Shenoi, S. S. C., Ethe, C., and Madec, G.: Impact of temperature inversions on SST evolution in the Southeastern Arabian Sea during the pre-summer monsoon season, Geophys. Res. Lett., 31, L01305, https://doi.org/10.1029/2003GL018906, 2004.
Durazo, R. and Baumgartner, T. R.: Evolution of oceanographic conditions off Baja California, Prog. Oceanogr., 54, 7–31, 2002.
Feng, M., McPhaden, M. J., Xie, S.-P., and Hafner, J.: La Niña forces unprecedented Leeuwin Current warming in 2011, Sci. Rep., 3, 1277, https://doi.org/10.1038/srep01277, 2013.
Findlater, J.: Interhemispheric transport of air in the lower troposphere over the western Indian Ocean, Q. J. Roy. Meteor. Soc., 95, 400–403, https://doi.org/10.1002/qj.49709540412, 1969.
Gao, G., Marin, M., Feng, M., Yin, B., Yang, D., Feng, X., Ding, Y., and Song, D.: Drivers of marine heatwaves in the East China Sea and the South Yellow Sea in three consecutive summers during 2016–2018, J. Geophys. Res.-Oceans, 125, e2020JC016518, https://doi.org/10.1029/2020JC016518, 2020.
Goes, J. I., Tian, H., Gomes, H. d. R., Anderson, O. R., Khalid, A.-H., deRada, S., Luo, H., Lubna, A.-K., Adnan, A.-A., and Martinson, D. G.: Ecosystem state change in the Arabian Sea fuelled by the recent loss of snow over the Himalayan-Tibetan Plateau region, Sci. Rep., 10, 7422, https://doi.org/10.1038/s41598-020-64360-2, 2020.
Griffies, S. M.: Elements of the Modular Ocean Model (MOM): 2012 release, GFDL Ocean Group Technical Report No. 7, 1–631, 2012.
Griffies, S. M. and Hallberg, R. W.: Biharmonic friction with a Smagorinsky-like viscosity for use in large-scale eddy-permitting ocean models, Mon. Weather Rev., 128, 2935–2946, 2000.
Hobday, A. J., Alexander, L. V., Perkins, S. E., Smale, D. A., Straub, S. C., Oliver, E. C. J., Benthuysen, J. A., Burrows, M. T., Donat, M. G., Feng, M., Holbrook, N. J., Moore, P. J., Scannell, H. A., Gupta, A. S., and Wernberg, T.: A hierarchical approach to defining marine heatwaves, Prog. Oceanogr., 141, 227–238, 2016.
Holbrook, N. J., Scannell, H. A., Sen Gupta, A., Benthuysen, J. A., Feng, M., Oliver, E. C. J., Alexander, L. V., Burrows, M. T., Donat, M. G., Hobday, A. J., Moore, P. J., Perkins-Kirkpatrick, S. E., Smale, D. A., Straub, S. C., and Wernberg, T.: A global assessment of marine heatwaves and their drivers, Nat. Commun., 10, 2624, https://doi.org/10.1038/s41467-019-10206-z, 2019.
Holbrook, N. J., Sen Gupta, A., Oliver, E. C. J., Hobday, A. J., Benthuysen, J. A., Scannell, H. A., Smale, D. A., and Wernberg, T.: Keeping pace with marine heatwaves, Nat. Rev. Earth Environ., 1, 482–493, https://doi.org/10.1038/s43017-020-0068-4, 2020.
Huang, B., Liu, C., Banzon, V., Freeman, E., Graham, G., Hankins, B., Smith, T., and Zhang, H.-M.: Improvements of the Daily Optimum Interpolation Sea Surface Temperature (DOISST) Version 2.1, J. Climate, 34, 2923–2939, https://doi.org/10.1175/JCLI-D-20-0166.1, 2020 (data available at: https://coastwatch.pfeg.noaa.gov/erddap/, last access: 7 May 2022).
Hughes, T. P., Kerry, J. T., and Wilson, S. K.: Global warming and recurrent mass bleaching of corals, Nature, 543, 373–377, https://doi.org/10.1038/nature21707, 2017.
Joseph, P. V.: Warm pool over the Indian Ocean and monsoon onset, Trop. Ocean Atmos. Newsl., Winter, 53, 1–5, 1990.
Kalnay, E., Kanamitsu, M., Kistler, R., Collins, W., Deaven, D., Gandin, L., Iredell, M., Saha, S., White, G., Woollen, J., Zhu, Y., Chelliah, M., Ebisuzaki, W., Higgins, W., Janowiak, J., Mo, K. C., Ropelewski, C., Wang, J., Leetmaa, A., Reynolds, R., Jenne, R., and Joseph, D.: The NCEP/NCAR 40 year reanalysis project, B. Am. Meteorol. Soc., 77, 437–471, 1996.
Klein, S. A., Soden, B. J., and Lau, N.-C.: Remote sea surface temperature variations during ENSO: Evidence for a tropical atmospheric bridge, J. Climate, 12, 917–932, 1999.
Kumar, K. K., Rajagopalan, B., Hoerling, M., Bates, G., and Cane, M.: Unraveling the mystery of Indian monsoon failure during El Nino, Science, 314, 115–119, https://doi.org/10.1126/science.1131152, 2006.
Lakshmi, R. S., Chatterjee, A., Prakash, S., and Mathew, T.: Biophysical interactions in driving the summer monsoon chlorophyll bloom off the Somalia coast, J. Geophys. Res.-Oceans, 125, e2019JC015549, https://doi.org/10.1029/2019JC015549, 2020.
Large, W. G., McWilliams, J. C., and Doney, S. C.: Oceanic vertical mixing: A review and a model with a nonlocal boundary layer parameterisation, Rev. Geophys., 32, 363–403, 1994.
Lee, S.-K., Park, W., Baringer, M. O., Gordon, A. L., Huber, B., and Liu, Y.: Pacific origin of the abrupt increase in Indian Ocean heat content, Nat. Geosci., 8, 445–449, 2015.
Lee, T. and McPhaden, M. J.: Increasing intensity of El Niño in the central-equatorial Pacific, Geophys. Res. Lett., 37, L14603, https://doi.org/10.1029/2010GL044007, 2010.
Levitus, S., Antonov, J. I., Boyer, T. P., Baranova, O. K., Garcia, H. E., Locarnini, R. A., Mishonov, A. V., Reagan, J. R., Seidov, D., Yarosh, E. S., and Zweng, M. M.: World ocean heat content and thermosteric sea level change (0–2000 m), 1955–2010, Geophys. Res. Lett., 39, L10603, https://doi.org/10.1029/2012GL051106, 2012.
Li, Z., Holbrook, N. J., Zhang, X., Oliver, E. C. J., and Cougnon, E. A.: Remote Forcing of Tasman Sea Marine Heatwaves, J. Climate, 33, 5337–5354, 2020.
Lorenzo, E. D. and Mantua, N.: Multi-year persistence of the 2014/15 North Pacific marine heatwave, Nat. Clim. Change, 6, pages 1042–1047, https://doi.org/10.1038/nclimate3082, 2016.
Mills, K. E., Pershing, A. J., Brown, C., Chen, Y., Chiang, F.-S., Holland, D. S., Lehuta, S., Nye, J. C., Sun, J., Thomas, A. C., and Wahle, R. A.: Fisheries Management in a Changing Climate: Lessons From the 2012 Ocean Heat Wave in the Northwest Atlantic, Oceanography 26, 191–195, https://doi.org/10.5670/oceanog.2013.27, 2013.
Murakami, H., Delworth, T. L., Cooke, W. F., Zhao, M., Xiang, B., and Hsu, P.-C.: Detected climatic change in global distribution of tropical cyclones, P. Natl. Acad. Sci. USA, 117, 10706–10714, 2020.
Naval Oceanography Portal: North Indian Ocean Best Track Data, Naval Oceanography Portal [data set], https://www.metoc.navy.mil/jtwc/jtwc.html?north-indian-ocean, last access: 7 May 2022.
Olita, A., Sorgente, R., Natale, S., Gaberšek, S., Ribotti, A., Bonanno, A., and Patti, B.: Effects of the 2003 European heatwave on the Central Mediterranean Sea: surface fluxes and the dynamical response, Ocean Sci., 3, 273–289, https://doi.org/10.5194/os-3-273-2007, 2007.
Oliver, E.: Mean warming not variability drives marine heatwave trends, Clim. Dynam., 53, 1653–1659, https://doi.org/10.1007/s00382-019-04707-2, 2019.
Oliver, E. C. J., Benthuysen, J. A., Bindoff, N. L., Hobday, A. J., Holbrook, N. J., Mundy, C. N., and Perkins-Kirkpatrick, S. E.: The unprecedented 2015/16 Tasman Sea marine heatwave, Nat. Commun., 8, 16101, https://doi.org/10.1038/ncomms16101, 2017.
Oliver, E. C. J., Benthuysen, J. A., Darmaraki, S., Donat, M. G., Hobday, A. J., Holbrook, N. J., Schlegel, R. W., and Gupta, A. S.: Marine heatwaves, Annu. Rev. Mar. Sci., 13, 313–342, https://doi.org/10.1146/annurev-marine-032720-095144, 2021.
Padmakumar, K. B., Menon, N. R., and Sanjeevan, V. N.: Is Occurrence of Harmful Algal Blooms in the Exclusive Economic Zone of India on the Rise?, Int. J. Ocean., 2012, 1–7, https://doi.org/10.1155/2012/263946, 2012.
Papa, F., Durand, F., Rossow, W. B., Rahman, A., and Bala, S. K.: Satellite altimeter-derived monthly discharge of the Ganga-Brahmaputra River and its seasonal to interannual variations from 1993 to 2008, J. Geophys. Res., 115, C12013, https://doi.org/10.1029/2009JC006075, 2010.
Pearce, A., Lenanton, R., Jackson, G., Moore, J., Feng, M., and Gaughan, D.: The “marine heat wave” off Western Australia during the summer of 2010/11, Fisheries Research Report No. 222, Department of Fisheries, Western Australia, 40 pp., 2011.
Phillips, H. E., Tandon, A., Furue, R., Hood, R., Ummenhofer, C. C., Benthuysen, J. A., Menezes, V., Hu, S., Webber, B., Sanchez-Franks, A., Cherian, D., Shroyer, E., Feng, M., Wijesekera, H., Chatterjee, A., Yu, L., Hermes, J., Murtugudde, R., Tozuka, T., Su, D., Singh, A., Centurioni, L., Prakash, S., and Wiggert, J.: Progress in understanding of Indian Ocean circulation, variability, air–sea exchange, and impacts on biogeochemistry, Ocean Sci., 17, 1677–1751, https://doi.org/10.5194/os-17-1677-2021, 2021.
Praveen, K. B., Vialard, J., Lengaigne, M., Murty, V., and Mcphaden, M. J.: TropFlux: Air-sea fluxes for the global tropical oceans-description and evaluation, Clim. Dynam., 38, 1521–1543, 2012.
Praveen, K. B., Vialard, J., Lengaigne, M., Murty, V., Mcphaden, M. J., Cronin, M., Pinsard, F., and Gopala, R. K.: TropFlux wind stresses over the tropical oceans: Evaluation and comparison with other products, Clim. Dynam., 40, 2049–2071, 2013.
Rao, R. R. and Sivakumar, R.: On the possible mechanisms of the evolution of a mini-warm pool during the pre-summer monsoon season and the genesis of onset vortex in the southeastern Arabian Sea, Q. J. Roy. Meteor. Soc., 125, 787–809, 1999.
Reynolds, R. W., Smith, T. M., Liu, C., Chelton, D. B., Casey, K. S., and Schlax, M. G.: Daily high-resolution-blended analyses for sea surface temperature, J. Climate, 20, 5473–5496, https://doi.org/10.1175/2007JCLI1824.1, 2007.
Roxy, M., Ritika, K., Terray, P., and Masson, S.: The curious case of Indian Ocean warming, J. Climate, 27, 8501–8509, 2014.
Roxy, M., Ritika, K., Terray, P., Murtugudde, R., Ashok, K., and Goswami, B. N.: Drying of Indian subcontinent by rapid Indian Ocean warming and a weakening land-sea thermal gradient, Nat. Commun., 6, 7423, https://doi.org/10.1038/ncomms8423, 2015.
Roxy, M. K., Modi, A., Murtugudde, R., Valsala, V., Panickal, S., Prasanna, K. S., Ravichandran, M., Vichi, M., and Lévy M.: A reduction in marine primary productivity driven by rapid warming over the tropical Indian Ocean, Geophys. Res. Lett., 43, 826–833, https://doi.org/10.1002/2015GL066979, 2016.
Roxy, M. K., Gnanaseelan, C., Parekh, A., Chowdary, J. S., Singh, S., Modi, A., Kakatkar, R., Mohapatra, S., and Dhara, C.: Indian Ocean warming, in: Assessment of Climate Change over the Indian Region, edited by: Krishnan, R., Sanjay, J., Gnanaseelan, C., Mujumdar, M., Kulkarni, A., and Chakraborty, S., Springer, https://doi.org/10.1007/978-981-15-4327-2, 2020.
Saji, N. H., Goswami, B. N., Vinayachandran, P. N., and Yamagata, T.: A dipole mode in the tropical Indian Ocean, Nature, 401, 360–363, 1999.
Salinger, M. J., Renwick, J., Behrens, E., Mullan, A. B., Diamond, H. J., Sirguey, P., Smith, R. O., Trought, M. C. T., Alexander, L. V., Cullen, N. J., Fitzharris, B. B., Hepburn, C. D., Parker, A. K., and Sutton, P. J.: The unprecedented coupled ocean-atmosphere summer heatwave in the New Zealand region 2017/18: drivers, mechanisms and impacts, Environ. Res. Lett., 14, 044023, https://doi.org/10.1088/1748-9326/ab012a, 2019.
Saranya, J. S., Roxy, M. K., Dasgupta, P., and Anand, A.: Genesis and trends in marine heatwaves over the tropical Indian Ocean and their interaction with the Indian summer monsoon, J. Geophys. Res.-Oceans, 127, e2021JC017427, https://doi.org/10.1029/2021JC017427, 2022.
Scannell, H. A., Pershing, A. J., Alexander, M. A., Thomas, A. C., and Mills, K. E.: Frequency of marine heatwaves in the North Atlantic and North Pacific since 1950, Geophys. Res. Lett., 43, 2069–2076, https://doi.org/10.1002/2015gl067308, 2016.
Schlegel, R. W. and Smit, A. J.: heatwaveR: A central algorithm for the detection of heatwaves and cold-spells, Journal of Open Source Software, 3, 821, https://doi.org/10.21105/joss.00821, 2018 (data available at: https://robwschlegel.github.io/heatwaveR/index.html, last access: 7 May 2022).
Schott, F. and McCreary, J. P.: The monsoon circulation of the Indian Ocean, Prog. Oceanogr., 51, 1–123, 2001.
Shankar, D., Gopalakrishna, V. V., Shenoi, S. S. C., Durand, F., Shetye, S. R., Rajan, C. K., Johnson, Z., Araligidad, N., and Michael, G. S.: Observational evidence for westward propagation of temperature inversions in the southeastern Arabian Sea, Geophys. Res. Lett., 31, L08305, https://doi.org/10.1029/2004GL019652, 2004.
Shankar, D., Remya, R., Vinayachandran, P., Chatterjee, A., and Behera, A.: Inhibition of mixed-layer deepening during winter in the northeastern Arabian Sea by the West India Coastal Current, Clim. Dynam., 47, 1049–1072, 2016.
Shankar, D., Remya, R., Anil, A. C., and Vijith, V.: Role of physical processes in determining the nature of fisheries in the eastern Arabian Sea, 172, 124–158, https://doi.org/10.1016/j.pocean.2018.11.006, 2018.
Shenoi, S. S. C., Shankar, D., and Shetye, S. R.: On the sea surface temperature high in the Lakshadweep Sea before the onset of southwest monsoon, J. Geophys. Res., 104, 15703–15712, 1999.
Sindhu, B., Suresh, I., Unnikrishnan, A., Bhatkar, N., Neetu, S., and Michael, G.: Improved bathymetric datasets for the shallow water regions in the Indian Ocean, J. Earth Syst. Sci., 116, 261–274, 2007.
Swapna, P., Krishnan, R., and Wallace, J. M.: Indian Ocean and monsoon coupled interactions in a warming environment, Clim. Dynam., 42, 2439–2454, https://doi.org/10.1007/s00382-013-1787-8, 2014.
Thomsen, M. S., Mondardini, L., Alestra, T., Gerrity, S., Tait, L., South, P. M., Lilley, S. A., and Schiel, D. R.: Local extinction of bull kelp (Durvillaea spp.) due to a marine heatwave, Front. Mar. Sci., 6, 84, https://doi.org/10.3389/fmars.2019.00084, 2019.
Trainer, V. L., Kudela, R. M., Hunter, M. V., Adams, N. G., and McCabe, R. M.: Climate Extreme Seeds a New Domoic Acid Hotspot on the US West Coast, Front. Clim., 2, 571836, https://doi.org/10.3389/fclim.2020.571836, 2020.
Vijith, V., Vinayachandran, P., Thushara, V., Amol, P., Shankar, D., and Anil, A.: Consequences of inhibition of mixed-layer deepening by the West India Coastal Current for winter phytoplankton bloom in the northeastern Arabian Sea, J. Geophys. Res.-Oceans, 121, 6583–6603, https://doi.org/10.1002/2016JC012004, 2016.
Vinayachandran, P. N. and Shetye, S. R.: The warm pool in the Indian Ocean, P. Indian Acad. Sci.-Earth, 100, 165–175, 1991.
Vinayachandran, P. N., Shankar, D., Kurian, J., Durand, F., and Shenoi, S. S. C.: Arabian Sea Mini Warm Pool and the Monsoon Onset Vortex, Curr. Sci. India, 93, 203–214, http://www.jstor.org/stable/24099306 (last access: 7 May 2022), 2007.
Vinayachandran, P. N. M., Masumoto, Y., Roberts, M. J., Huggett, J. A., Halo, I., Chatterjee, A., Amol, P., Gupta, G. V. M., Singh, A., Mukherjee, A., Prakash, S., Beckley, L. E., Raes, E. J., and Hood, R.: Reviews and syntheses: Physical and biogeochemical processes associated with upwelling in the Indian Ocean, Biogeosciences, 18, 5967–6029, https://doi.org/10.5194/bg-18-5967-2021, 2021.
Vörösmarty, C., Fekete, B., and Tucker, B.: River discharge database, Version 1.0 (RivDIS v1. 0), Volumes 0 through 6. A contribution to IHP-V Theme: 1. Technical documents in hydrology series, UNESCO, Paris, 1996.
Wernberg, T., Bennett, S., Babcock, R. C., de Bettignies, T., Cure, K., Depczynski, M., Dufois, F., Fromont, J., Fulton, C. J., Hovey, R. K., Harvey, E. S., Holmes, T. H., Kendrick, G. A., Radford, B., Santana-Garcon, J., Saunders, B. J., Smale, D. A., Thomsen, M. S., Tuckett, C. A., Tuya, F., Vanderklift, M. A., and Wilson, S.: Climate-driven regime shift of a temperate marine ecosystem, Science, 353, 169–172, https://doi.org/10.1126/science.aad8745, 2017.
Xie, S. P., Hu, K., Hafner, J., Tokinaga, H., Du, Y., Huang, G., and Sampe, T.: Indian Ocean capacitor effect on Indo-Western Pacific climate during the summer following El Nino, J. Climate, 22, 730–747, 2009.
Xie, T., Li, J., Chen, K., Zhang, Y., and Sun, C.: Origin of Indian Ocean multidecadal climate variability: role of the North Atlantic Oscillation, Clim. Dynam., 56, 3277–3294, https://doi.org/10.1007/s00382-021-05643-w, 2021.
- Abstract
- Introduction
- Data and methodology
- Trends in the MHW
- Role of Indian Ocean warming and SST variability
- Role of dominant climate modes
- Dynamical mechanisms inferred from a case study
- Summary and discussion
- Data availability
- Author contributions
- Competing interests
- Disclaimer
- Acknowledgement
- Review statement
- References