the Creative Commons Attribution 4.0 License.
the Creative Commons Attribution 4.0 License.
 | 16 Feb 2022
Responses of estuarine circulation to the morphological evolution in a convergent, microtidal estuary
Rui Zhang
Bo Hong
Lei Zhu
Heng Zhang
The Huangmaohai estuary (HE) is a funnel-shaped microtidal estuary in the west of the Pearl River Delta (PRD) in southern China. Since China reformed and opened up in 1978, extensive human activities have occurred and greatly changed the estuary's topography and modified its hydrodynamics. In this study, we examined the morphological evolution by analyzing remote sensing data with ArcGIS tools and studied the responses of hydrodynamics to the changes in topography from 1977 to 2010 by using the Delft3D model. We took the changes in estuarine circulation during neap tides in dry seasons as an example. The results show that human reclamation caused a narrowing of the estuary, and channel dredging deepened the estuary. These human activities changed both the longitudinal and lateral estuarine circulations. The longitudinal circulation was observed to increase with the deepening and narrowing of the estuary. The lateral circulation experienced changes in both the magnitude and pattern. The momentum balance analysis shows that when the depth and width changed simultaneously, the longitudinal estuarine circulation was modulated by both the channel deepening and width reduction, in which the friction, pressure gradient force, and advection terms were altered. The analysis of the longitudinal vortex dynamics indicates that the changes in the vertical shear of the longitudinal flow, lateral salinity gradient, and vertical mixing were responsible for the change in the lateral circulation. The changes in water depth are the dominant factors affecting lateral circulation intensity. This study has implications for sediment transport and morphological evolution in estuaries heavily impacted by human interventions.
- Article
(18944 KB) - Full-text XML
- BibTeX
- EndNote


Estuarine circulation, the tidally averaged flow in estuaries including both the longitudinal and lateral circulations, is the main driving force for the transport of sediment, pollutants, and other materials, and also one of the primary factors affecting the ecological environment of estuaries (Kjerfve et al., 1981). Estuarine circulation is influenced by many factors (Geyer and Maccready, 2014), such as sea-level fluctuations (Wilson and Filadelfo, 1986), river discharge, tides (Pritchard, 1952), and winds (Scully et al., 2005; Waterhouse et al., 2013; Geyer and Maccready, 2014; Salles et al., 2015; Chen et al., 2020a). Topography in an estuary has a significant effect on the pattern and intensity of the estuarine circulation (Fischer, 1976; Dyer, 1977). Human activities may change the estuarine topography, leading to changes in the estuarine circulation and associated material transport. Therefore, a study of the estuarine circulation and its response to human activities is essential for integrated management of the development of estuarine resources and the maintenance of the estuary's ecological health.
Channel deepening by dredging and sand mining is a common practice in the development and maintenance of navigable channels in estuaries. Generally speaking, channel deepening can increase the longitudinal estuarine circulation by decreasing the bottom friction and increasing the baroclinic forcing which is proportional to the water depth (Amin, 1983; Chernetsky et al., 2010; Winterwerp, 2011). On the other hand, the increase in water depth can also increase the salt intrusion and decrease the along-channel density gradient, thus reducing the baroclinic forcing. Channel deepening also affects the estuarine circulation in other ways, such as increasing the Stokes transport and the associated compensating return flow (Amin, 1983) and altering the nonlinear tidal rectification (Li and O'Donnell, 1997) and tidal asymmetry in mixing between flood and ebb tides (tidal straining) (Simpson et al., 1990). Therefore, the effect of channel deepening is an intricate balance between these reinforcing and/or competing effects. Chant et al. (2018) demonstrated that a relatively small (15 %) increase in water depth can result in a double exchange flow. They attributed this increase to the increase in along-channel salinity gradient and/or a reduction in vertical mixing, but they did not give a clear distinction of how these two effects work together and which is dominant.
Change in estuary width is another aspect of topographic change in estuaries and is mainly caused by reclamation and utilization of salt marshes and construction of coastal protection structures along the estuarine banks. Change in estuary width generates a change in the estuarine convergence and therefore a change in the estuarine circulation. Burchard et al. (2014) concluded that an increase in the estuarine convergence results in an enhancement or reduction of the longitudinal estuarine circulation as increased estuarine convergence can reduce or even reverse the straining-induced circulation, though the advection-induced circulation is increased. Changes in estuarine width can also modify the lateral circulation and feedback to the generation of the longitudinal estuarine circulation through the change in lateral advection (Lacy et al., 2003; Lerczak and Rockwell Geyer, 2004; Scully et al., 2009; Burchard et al., 2010, 2014). Lerczak and Rockwell Geyer (2004) suggested that lateral effects on the longitudinal estuarine circulation would be stronger in narrower estuaries given a constant lateral salinity gradient. Schulz et al. (2015) investigated the impact of the depth-to-width ratio of the estuarine cross section on the longitudinal estuarine circulation and found that the longitudinal estuarine circulation exhibits a distinct maximum in medium-wide channels. They diagnosed the mechanisms for such a phenomenon and attributed them to the sensitivities of the straining- and advection-induced circulations on the changes in depth-to-width ratio.
As revealed by Lerczak and Geyer (2004) and other researchers (Chen et al., 2020b), lateral processes play important roles in the generation of the longitudinal estuarine circulation. In estuaries, the pattern and intensity of lateral circulation are controlled by three processes (Li et al., 2014): vertical shear of the longitudinal current affecting the tilting of planetary vorticity, lateral salinity gradient (baroclinicity), and diffusion. The longitudinal estuarine circulation can affect the lateral circulation through all three mentioned factors. Therefore, the interaction between the longitudinal and lateral processes is fully nonlinear and quite complex. Though these interactions have been discussed in detail (Scully et al., 2009; Li et al., 2017), several questions remain open: how does the longitudinal estuarine circulation affect the intensity and vortex structure of the lateral circulation? Does a decreased/increased lateral circulation necessarily lead to a weakened/strengthened longitudinal circulation? These questions become complicated in an estuary where both width and depth vary. Previous studies showed that the narrowing and deepening of the Yangtze River estuary resulted in an enhanced longitudinal estuarine circulation (Zhu, 2018), which changed from transversely sheared to vertically sheared. The estuarine stratification was also found to be strengthened, along with an increase in the intensity of lateral circulation. Zhu et al. (2015) investigated the influences of channel deepening and widening on the tidal and non-tidal circulations of Tampa Bay, USA, and found that the non-tidal circulation was strengthened by these human interventions. However, how does the estuarine circulation respond to both narrowing and deepening/shallowing of the estuary? What happens when the narrowing rate is much larger or smaller than the deepening rate in an estuary? Here, the narrowing rate is the ratio of the difference of cross-section widths between two consecutive years divided by the width in the earlier year. Similarly, the deepening rate is the ratio of the difference of water depth in the cross section between the two consecutive years divided by the earlier year's depth.
Here, we try to address the above questions by studying the changes in the estuarine circulation from 1977 to 2010 in the Huangmaohai estuary (HE), a microtidal estuary in the southwest of the Pearl River Delta (PRD), which experienced different stages of topographic changes under human activities: narrowing and deepening (1977–1994 and 2003–2010), and narrowing and shallowing (1994–2003). Thus, it provided a good opportunity to study the effect of human activities induced morphological evolution on the estuarine circulation.
In this study, we used a state-of-the-art three-dimensional baroclinic model (Delft3D) to simulate the changes in hydrodynamics in the HE in different years and examined the changes in intensities of the longitudinal and lateral estuarine circulations, followed by an analysis of the mechanisms for these changes by conducting diagnostic analyses of the momentum balance. The structure of the rest of the paper is as follows. Section 2 introduces the study area and numeral model. Section 3 presents the results of morphological evolution and changes in the estuarine circulation. Then, the mechanisms for the changes in estuarine circulation are investigated using the momentum and vortex balance equations in Sect. 4. Finally, the conclusions are presented in Sect. 5.
2.1 Study area
The HE is located in the west of the PRD in southern China and exhibits a distinctly convergent geometry, with a latitude ranging from 21∘50′ to 22∘13′ N and a longitude ranging from 113∘00′ to 113∘51′ E (Fig. 1). The estuary is composed of a bay (Huangmao Bay) and a tidal river. The bay is trumpet shaped with an area of 409 km2. It has a complex bathymetry comprised of two channels and three shoals, namely the West Channel and East Channel, the West Shoal, Middle Shoal, and East Shoal. In recent decades, the West Channel has been observed to shrink and has almost disappeared now (Jia et al., 2012). The width of the bay is 30 km at the estuary mouth and decreases to 1.8 km at the head. The mean water depth of the bay is 4.5 m (Gong et al., 2014). The bay is connected to the upstream river catchment by two constrictions (Yamen and Hutiaomen outlets). Several islands, namely Dajin Island, Hebao Island, and Gaolan Island, are scattered at the estuary's mouth (shown in Fig. 1b).
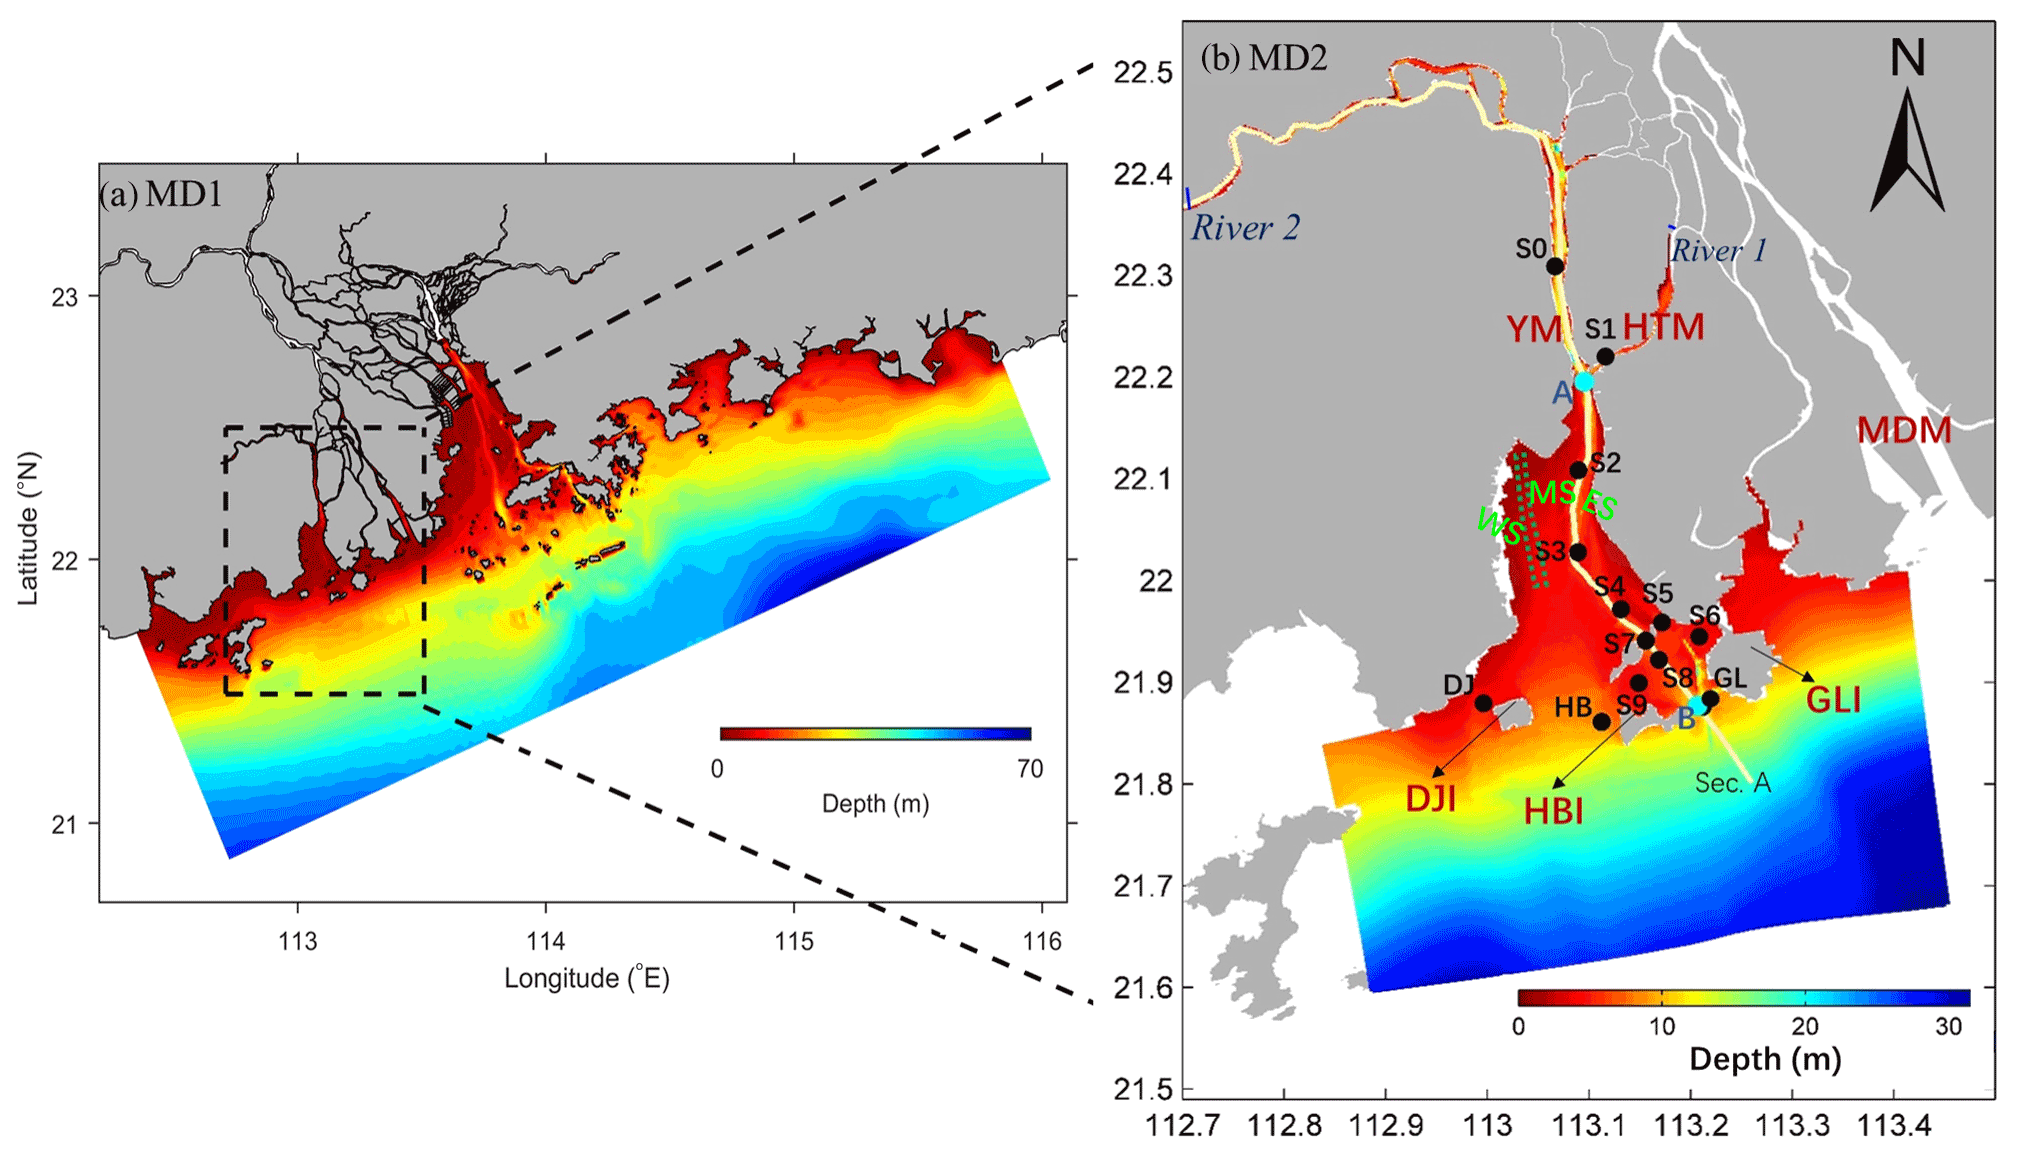
Figure 1The study area (Huangmaohai estuary) and observation stations. Major topographic features and domains of the nested modeling system over (a) the PRD and (b) the HE and its adjacent waters. YM indicates Yamen; HTM indicates Hutiaomen; MDM indicates Modaomen; DJI indicates Dajing Island; GLI indicates Gaolan Island; HBI indicates Hebao Island. The black dots (S0–S9, DJ, HB, and GL) in the MD2 domain indicate stations of field deployments in March 2010. The solid lines represent the along-channel transect (Section A (AB)), which lies in the East Channel. The dotted green lines represent the West Channel in 1977. Three shoals are shown in panel (b): West Shoal (WS), Middle Shoal (MS), and East Shoal (ES).
The HE has a subtropical monsoon climate, with the precipitation in the wet season (from May to September) being high. Approximately 80 % of the river discharge occurs during the wet season, with an average discharge of 200.23 m3 s−1. The tides in the HE are mixed semidiurnal with dominant semidiurnal constituents and smaller diurnal constituents. The tidal range is approximately 1.5 m at the mouth and experiences an initial increase from the mouth towards the head due to a strong convergence of the bay width. Further landward in the tidal river beyond the bay head, the tidal range decreases by the overwhelming bottom friction (Gong et al., 2012). The tidal current velocity ranges from 0.5 to 1.5 m s−1 (Huang, 2011) and is higher in deep channels than on shallow shoals. The tidal currents are generally rectilinear in deep channels but become more rotary in shallow shoals.
Since the 1980s, human activities have been intense in the HE. A hydroelectric power project upstream of the estuary, channel dredging, sand mining, and construction of Gaolan Island levees have led to great changes in the HE's topography. Also, the HE has rich tidal flat resources and endured frequent reclamation activities. From 1965 to 2003, a total of 142.29 km2 of the tidal flat were reclaimed, with an average reclamation rate of 3.74 km2 a−1, and the reclamation rate continuously but gradually increased during that period. After 2003, the reclamation rate slowed down. In terms of channel dredging, the Yamen Waterway Project was conducted in 1997 to deepen the channel between S0 and S3 in Fig. 1b (Luo, 2010). In April 2005, the Yamen Channel regulation project was implemented to alleviate the serious siltation in the channel, with the channel being dredged to a depth of about 6 m.
In the following, we chose 1977, 1994, 2003, and 2010 as the representative years to study the typical scenarios of bathymetric changes in the HE.
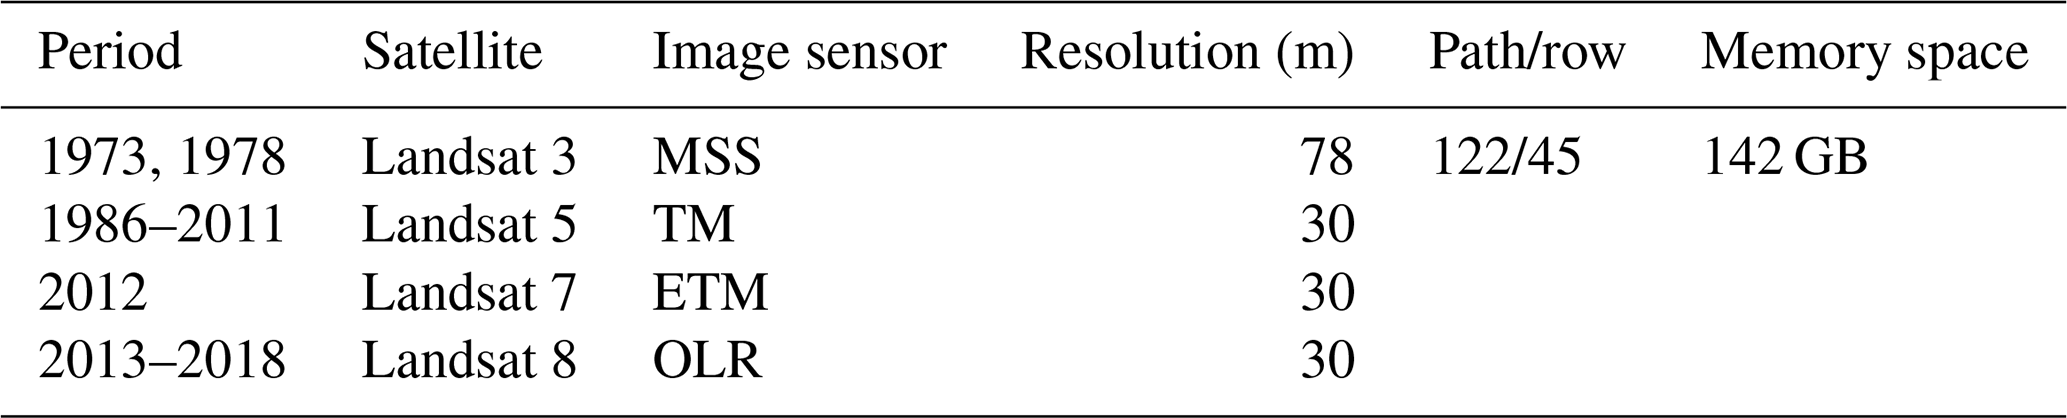
2.2 Remote sensing and topographic data
Remote sensing data were used for coastline extraction and included Landsat Multi-Spectral Scanner (MSS) data, Landsat Thematic Mapper (TM) data, and Landsat Operational Land Imager (OLI) data. A total of 66 images (Table 1) were downloaded from http://www.gscloud.cn/ (last access: 4 November 2021). These data were firstly processed by geometric (with errors less than 0.5 pixels; Ai et al., 2019) and atmospheric corrections by the ENVI 5.3 software. The topography data inside the HE were derived from nautical charts (1977, 1994, 2003, and 2010), published by the Navigation Safety Guarantee Bureau. The filling and excavation toolbox of ArcGIS was used to calculate the difference between the volumes in two consecutive periods by superimposing the corresponding digital elevation models (DEMs). We thus obtained the average siltation rates of the study area over different years (Fig. 2a–c).
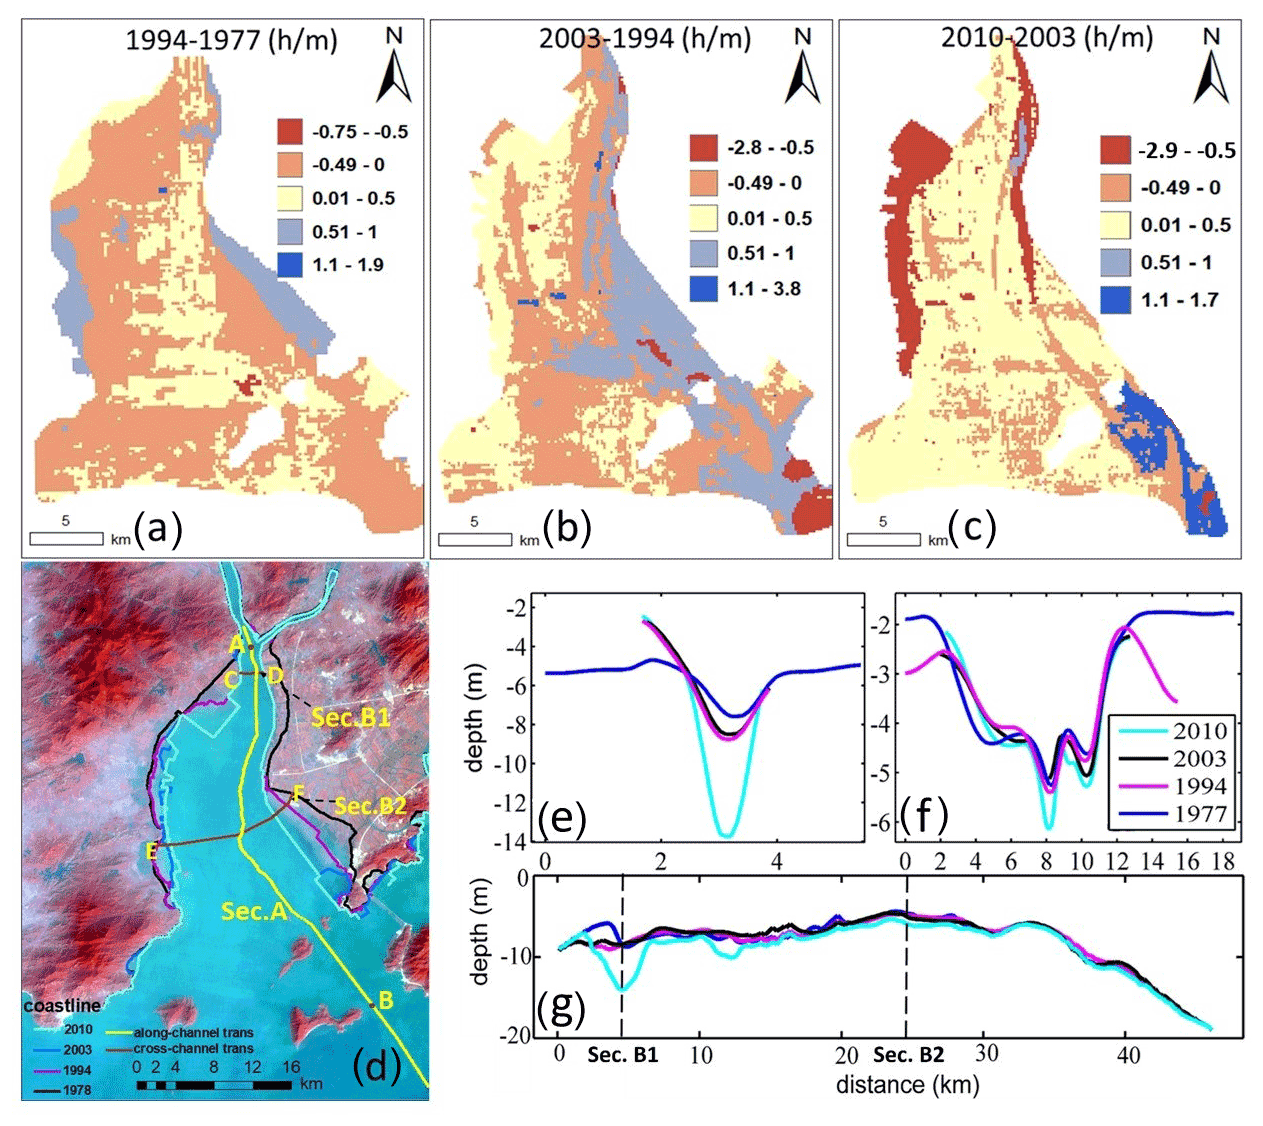
Figure 2(a–c) Water depth difference between years (a 1994–1977; b 2003–1994; c 2010–2003), where the positive value indicates “deepening” and the negative one indicates “siltation”; (d) shorelines of 1977–2010 and locations of two cross sections (AB: Sec. A; CD: Sec. B1; EF: Sec. B2); (e, f, g) rhe bathymetric evolution in Secs. B1, B2, and A in 1977, 1994, 2003, and 2010.
2.3 Numerical model setup and validation
The numerical model Delft3D, a fully three-dimensional hydrodynamic water quality model (Lesser et al., 2004), was used to simulate the hydrodynamics in the HE. Its algorithm can guarantee the conservation of mass, momentum, and energy. The model grid consisted of a nesting grid system, with MD1 (parent model, Fig. 1a) covering the whole PRD and MD2 (child model) covering the HE. For the MD2 model, a curvilinear orthogonal grid of 269×620 was established, with the horizontal resolution ranging from 64 m in the channel to 324 m at the ocean boundary. Vertically, the grid was discretized into 10 layers of σ coordinate. The model system used here is the same as the one in Chen et al. (2020a). MD1, based on a 1-D (for the river network) and 3-D coupled model, covered the whole PRD and the coastal region with a horizontal resolution of 2 km near the open boundary and 500 m inside the PRE (Fig. 1a). The open sea boundaries for MD1 comprised hourly tidal elevations and depth-averaged tidal currents derived from nine tidal constituents (M2, S2, N2, K2, K1, O1, P1, Q1, and M4) taken from the global tidal circulation model (TPXO 8, http://volkov.oce.orst.edu/ tides/tpxo8_atlas.html, last access: 20 March 2020) with a resolution of ∘ and daily water elevation, 3-D temperature, salinity (a constant salinity of 34 psu at the open ocean boundary), and velocity data from the Hybrid Coordinate Ocean Model (https://hycom.org, last access: 20 March 2020) with a resolution of ∘ (Chen et al., 2020a). Thus, the sources of water level variation and currents at the offshore boundary in MD1 are (1) tides; (2) non-tidal components by external forcings, such as winds, air pressure, water temperature, and large-scale circulation in the South China Sea. The results from MD1 were interpolated to provide ocean boundary conditions for the MD2 model; there were no “wind and wave effects” in MD2.
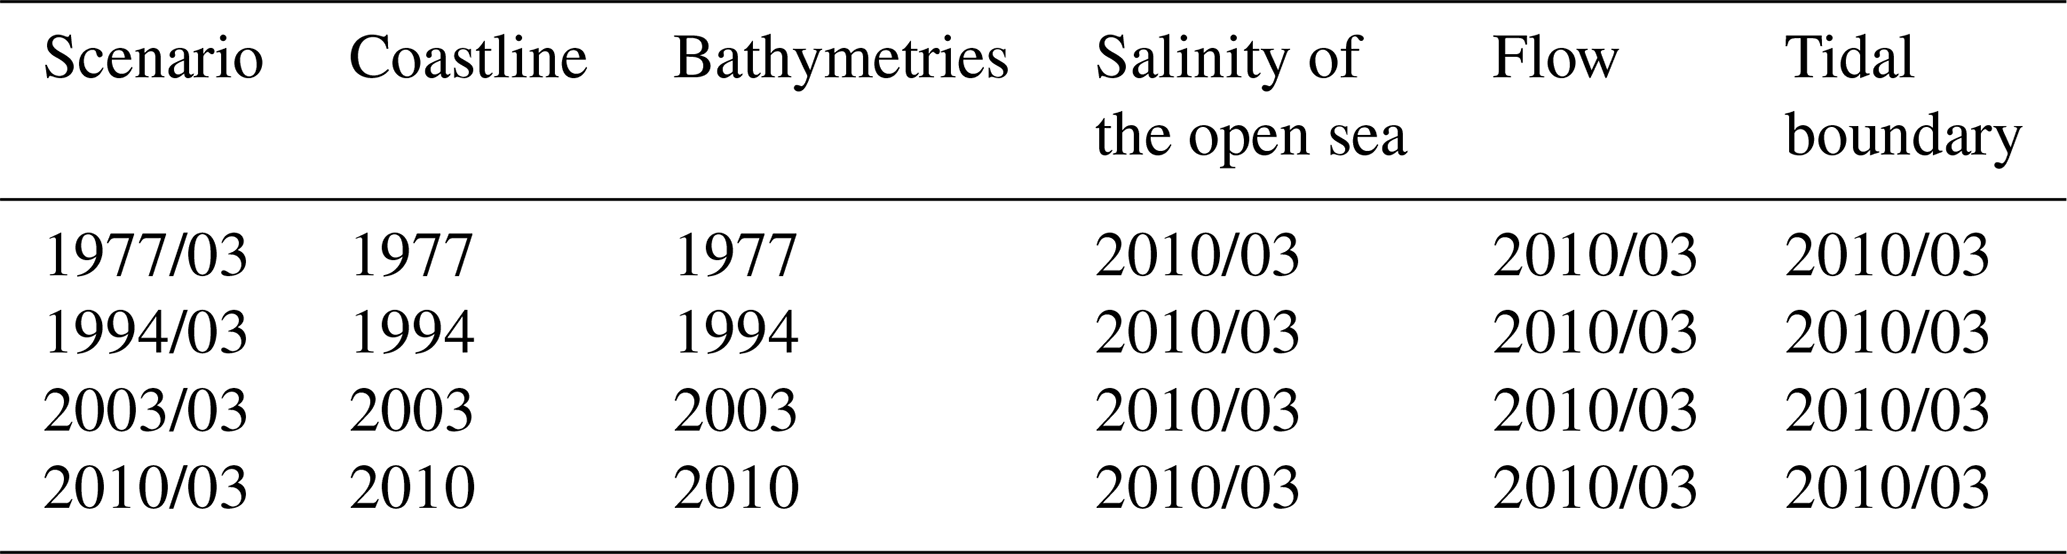
As mentioned above, the hydrodynamics in the HE experiences distinct seasonal variation. The estuarine circulation during the wet season has been extensively studied before (Chen et al., 2020a, b). Here, we choose the dry season to investigate the changes in the estuarine circulation caused by topographic changes in different years. We conducted a series of numerical experiments using the bathymetry data in 1977, 1994, 2003, and 2010. The simulation time was chosen to be from 00:00 LT (local time) on 1 March to 23:00 LT on 31 March in the dry season, when observation data were available in 2010. Field measurements were carried out at 14 mooring stations on 17 March at 17:00 LT to 18 March 2010 at 22:00 LT. The measured variables included vertical profiles of current, temperature, and salinity. In all the four scenarios, two upstream boundaries were specified (Fig. 1b): at River 2 by specifying real-time water level data from the MD1 model from 00:00 LT on 1 March 2010, to 23:00 LT on 31 March 2010, with a time interval of 1 h; at River 1 by specifying a constant river discharge of 100 m3 s−1. The choice of this constant value was based on previous simulation experiences (Chen et al., 2020a, b). The salinities at the river inflow boundaries were set to be 0 psu. The only changing condition of the four scenarios was the topography (Table 2), so the effect of topographic change can be distinguished. The measured data from 14 stations in 2010 were used to validate the model.
Table 2Coastline, bathymetry, salinity, flow, and tidal boundary in the four model scenarios.
Dates are given in yyyy/mm.
In this study, the Willmott skill score (SK) was used to evaluate whether the model result is consistent with the observed data (Willmott, 1981). The SK is defined as
where n is the number of the observed data, M and O are model simulation results and observations, respectively, and is the average value of the observation data. SK is used to measure the consistency between the model results and the observations, with a value between 0 and 1. The larger the value is, the more consistent the simulation results are with the observed data.
Firstly, the water level of the MD2 model was validated. The SKs of the four observed stations are all above 0.86, indicating that the water level simulation is reasonable. Secondly, the modeled current directions showed good performance except for the surface layer at stations DJ and S0; almost all the SKs are greater than 0.7 (Table 3). The simulation of the current speed is worse than that of the current direction, but the SKs at most stations are above 0.6, showing good performance. Lastly, the trends of observed and simulated salinities are consistent, and almost all the SKs of salinity validation are above 0.5, especially in S1–S3, showing a good performance of the salinity simulation.
Table 3Skill scores by comparison of modeled results with observations.
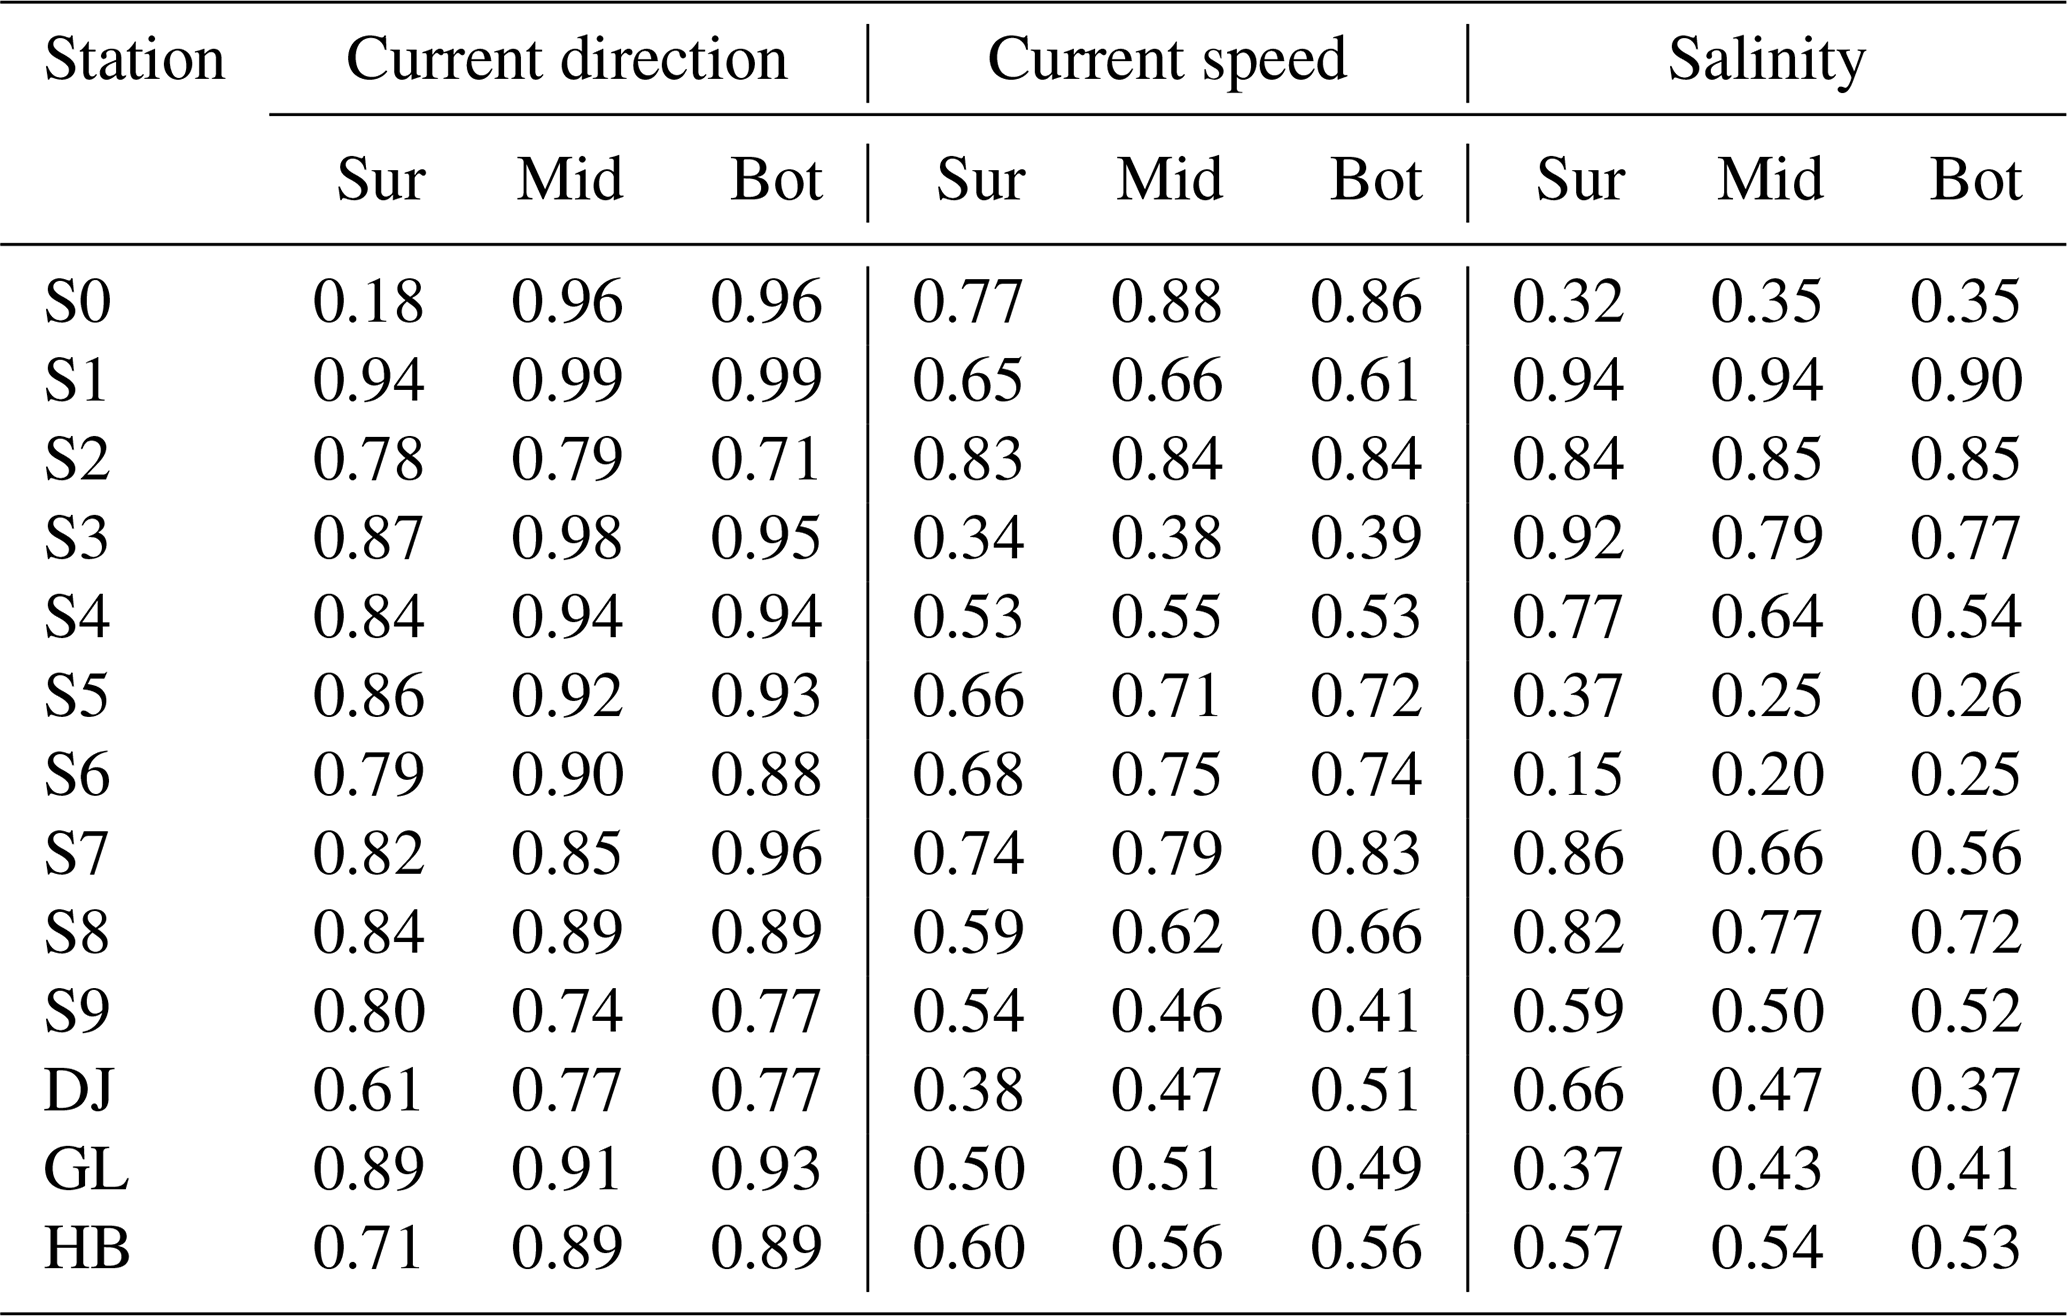
As a whole, the simulation of surface currents is worse than that in other layers, since winds and waves were not included in our MD2 model simulations, in which the surface flow is more susceptible to these forcings. The specified river flow at River 2 was constant, which may deviate from the real-time data (not available), leading to a poor salinity reproduction at upstream stations. In short, the water level and current are well validated. The simulation of salinity is generally good, except for some deviations at upstream stations. It shows that the model can reasonably simulate the hydrodynamic processes in the area and can be used for the following hydrodynamics study in the HE.
3.1 Morphological evolution
Morphological changes between 1977, 1994, 2003, and 2010 are shown in Fig. 2a–c. Figure 2a shows that most areas in the HE experienced siltation from 1977 to 1994, but the East Channel was deepened by about 0–0.5 m. In the middle of the bay, the nearshore areas were under erosion, and the erosion thickness at the eastern shore was twice that at the western shore. In other areas, the siltation thickness was between 0 and 0.5 m. From 1994 to 2003, erosion occurred in the West Shoal, East Channel, East Shoal, and Middle Shoal. Siltation of 0.01–0.5 m happened in the rest of the area, which accounted for most of the HE, so the HE became shallower in 2003. In 2003, siltation in the East Channel was serious and the water depth there became only 2 m (Li, 2019). From 2003 to 2010, the West Shoal became significantly shallower with a siltation thickness of about 0.5–1 m. The East Shoal almost disappeared, and its relict area endured siltation of 1.1–1.7 m, which was mainly due to the construction of coastal protection work. Strong erosion occurred in other areas, especially in the upper bay with a deepening of more than 4 m, and the overall water depth of the HE became greater in 2010.
Overall, the water depth of the HE changed considerably from 1977 to 2010. It first experienced erosion, then underwent siltation, and was followed by erosion again.
Figure 2d shows the changes of coastlines for the four representative years. To calculate the rate of geometry convergence, the DSAS tool (version 5.0) in Arcmap 10.3 was used to calculate the end-point rates for cross-shore transects. A more detailed procedure is in Zhang et al. (2019). We chose one longitudinal section along the channel in the estuary and two cross sections (in Fig. 2d) along the channel for analysis. The longitudinal section (Sec. A) extends from the bay head (point A in Fig. 1b) to the estuary mouth (point B in Fig. 1b), spanning a distance of 50 km. Section B1 is located at about 4 km downstream from the bay head, where the water depth changes sharply in the lateral (or longitudinal) direction (see Fig. 2e). Section B2 is approximately 24 km downstream from the bay head and near the null point in the middle of the estuary (see Fig. 2f), and the width of the estuary varied dramatically here (see Fig. 2e). In Sec. A, the water depth near the point of Sec. B1 endured a great change in 2010 due to channel dredging (Fig. 2g). In other periods, the water depth along its course endured gradual deepening. In Sec. B1, the bathymetric change is featured by an increase in water depth and negligible change in width over time. In Sec. B2, both the water depth and width experienced changes from 1977 to 2010, with the depth increased and width decreased (Fig. 2f). The above three sections clearly depict the topographic changes of the estuary in different years.
3.2 Changes in the vertically averaged flow and salinity
Here, we present the changes in the tidally and vertically averaged flow and salinity during neap tides in Fig. 3. In 1977 (Fig. 3a), the current speed was generally small, except in the inter-island sections and in the channel. The vertically averaged flow was seaward in the upper bay and the right part of the lower bay (looking landward). It became landward at the left part of the lower bay. In 1994 (Fig. 3b), the current speed was increased in the channel, particularly near Sec. B1. The overall flow pattern was almost similar to that in 1977. In 2003 (Fig. 3c), the flow pattern still remained unchanged when compared to that in previous years. The current speed was decreased relative to that in 1994. In 2010 (Fig. 3d), the seaward flow became more dominant in the upper bay and more biased southwestward. The seaward flow in the channel was greater than that in 2003. The 10 psu isohaline kept moving upstream over time and reached beyond the bay head and entered into the tidal river of the estuary in 2010.
Overall, we observed that the tidally and vertically averaged flow during neap tides experienced an increase–decrease–increase trend by the topographic changes, whereas the saltwater consistently intruded more landward.
In addition, we present the horizontal distributions of tidally averaged surface and bottom circulation and salinity during neap tides for different years in the Appendix (Figs. A1 and A2 in Appendix A). Over the study period, the enhancement of salt intrusion was stronger for the bottom layer and weaker for the surface layer, whereas the increase in residual flow was stronger in the surface layer and weaker in the bottom layer.
For the hydrodynamic characteristics of the HE during the flood and ebb tides, Chen et al. (2020a) have investigated the intratidal dynamic processes in detail.
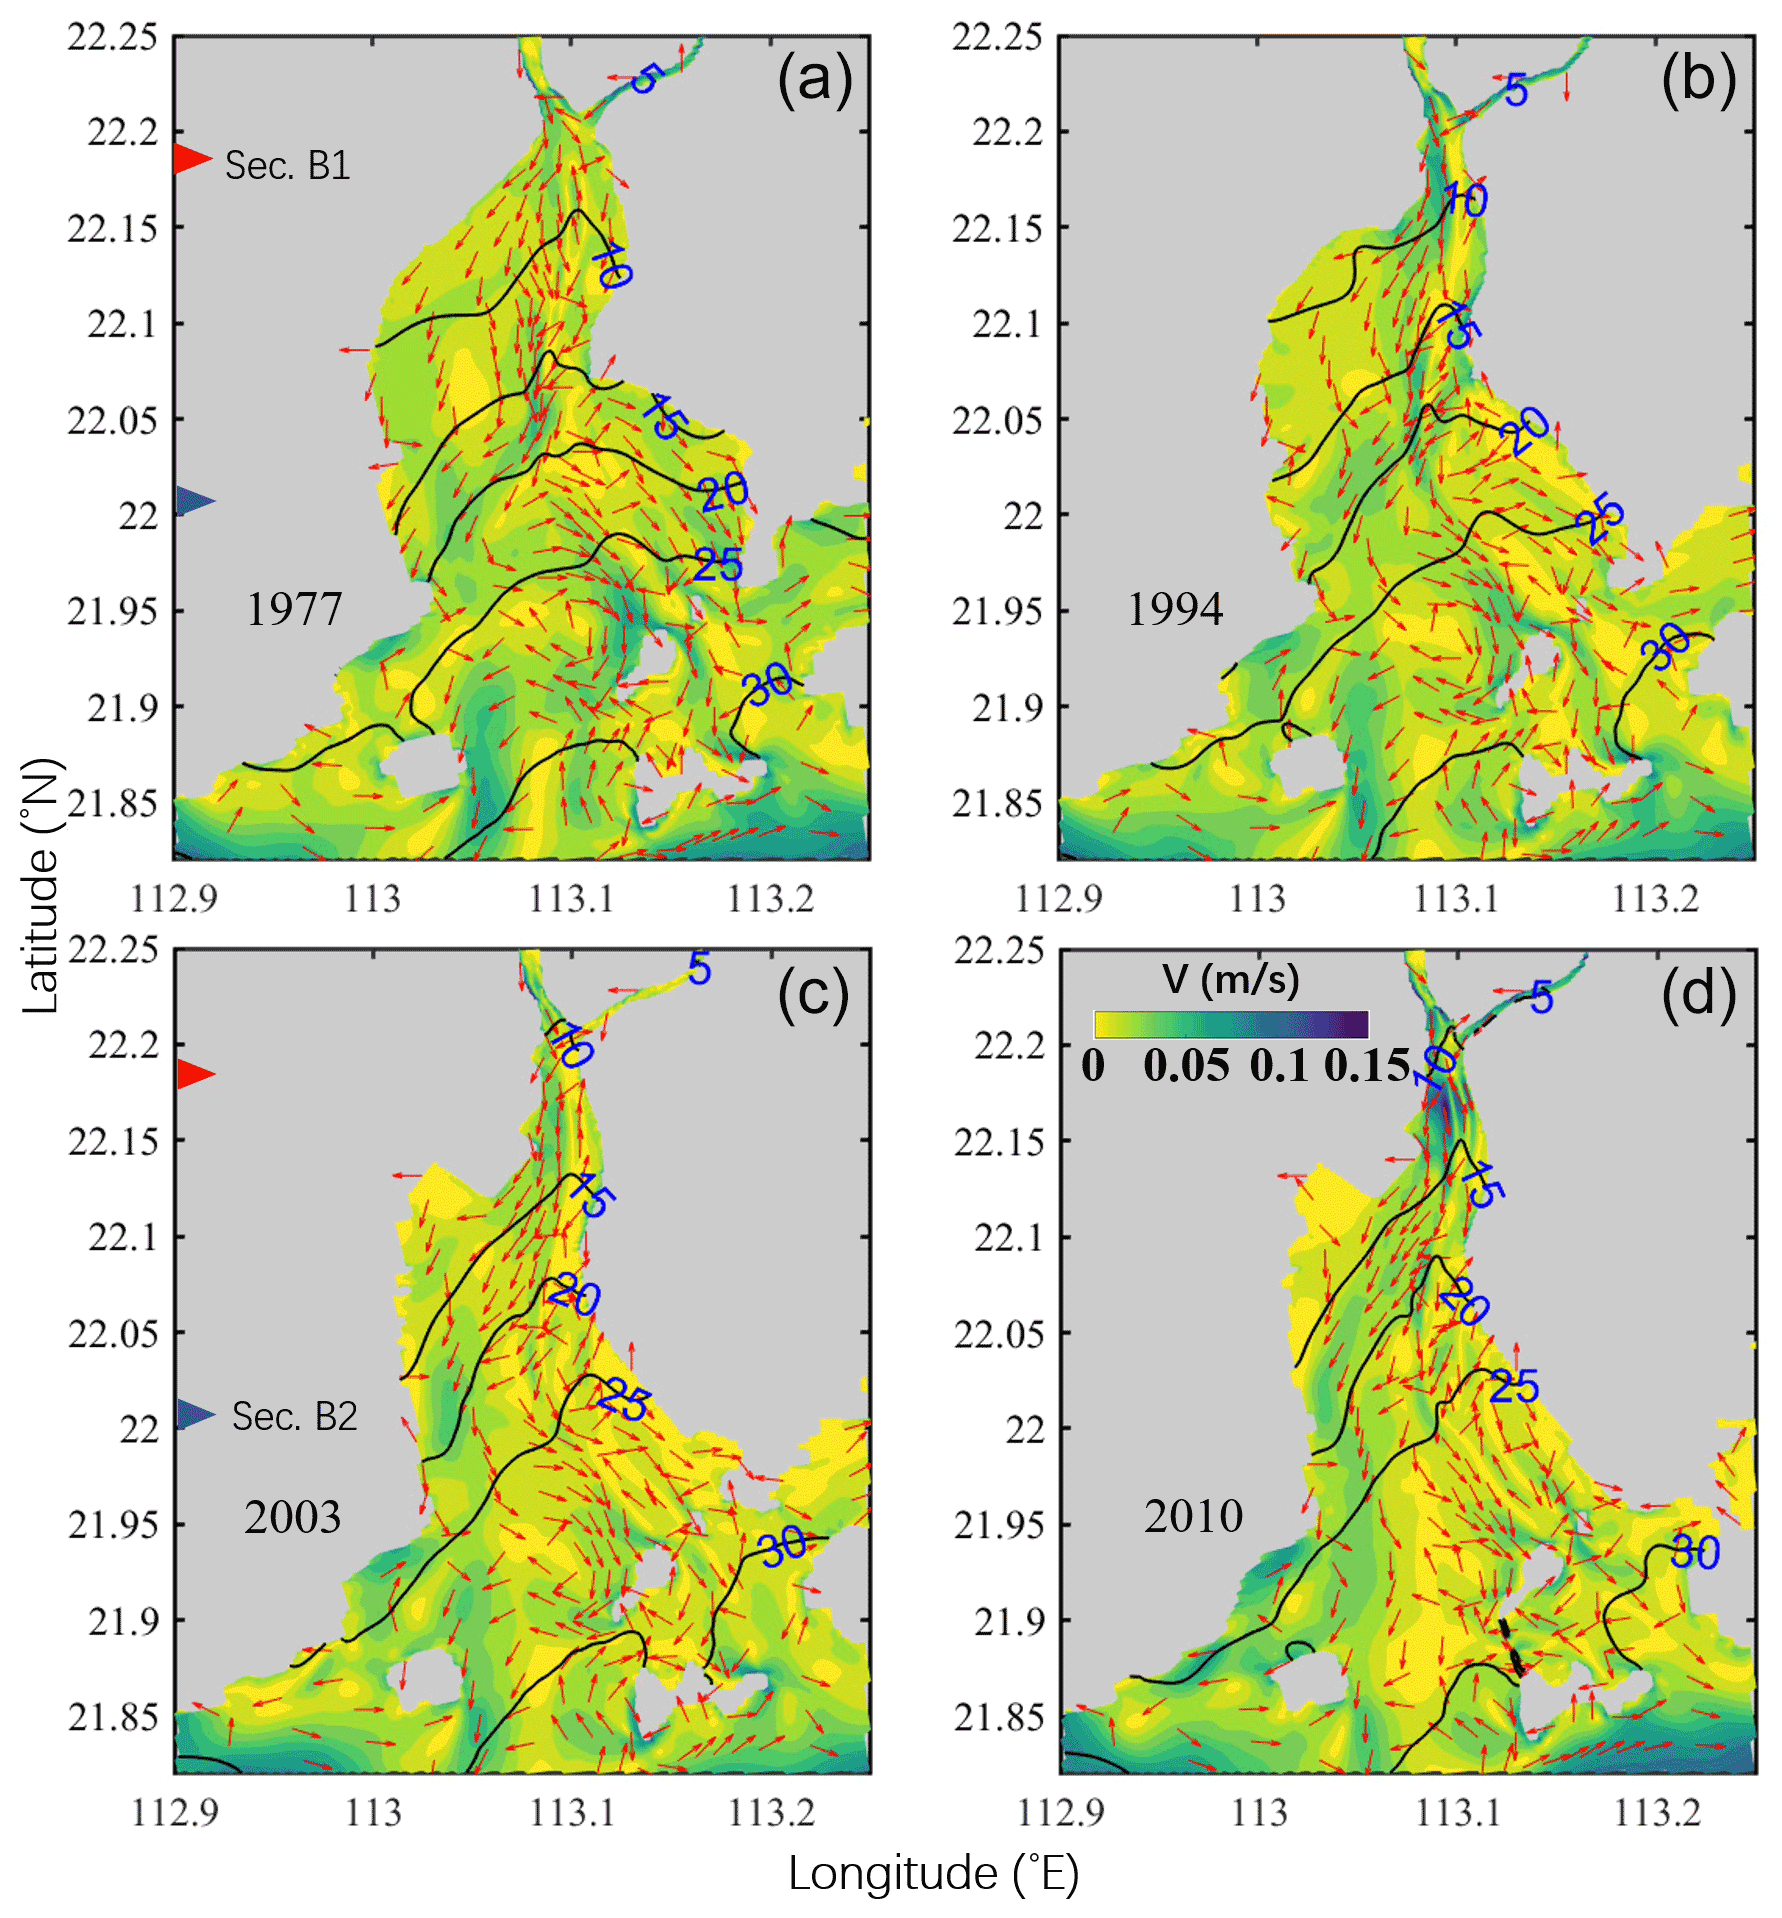
Figure 3Patterns of the tidally and vertically averaged circulation during neap tide (from 10 March at 00:00 LT to 11 March at 00:00 LT (25 h)) in 1977 (a), 1994 (b), 2003 (c), and 2010 (d). The magnitude of the current is represented by the color shading, while the current direction is shown by the arrows. The salinity is depicted by the contour lines. The red and blue triangles depict the positions of two cross sections (Secs. B1 and B2).
3.3 Changes in the estuarine circulation
Figure 4a–d show that the upper part of the estuary (upstream of the null point) was highly stratified, and the lower part of the estuary (downstream of the null point) was well mixed. The classical exchange flow structure was more distinct upstream of the null point. Over time, the surface seaward flow became stronger and more concentrated with the narrowing of the estuary, particularly in 2010. It extended more downstream to near the estuary mouth with the narrowing of the estuary, as evidenced by the extent of the seaward flow of 0.2 m s−1. Concomitantly, the bottom landward flow was strengthened and concentrated with the increase in depth. It should be noted that the greatly enhanced estuarine circulation between 3 to 8 km in 2010 (Fig. 4d) could be induced by the intratidal fluctuation of the halocline in response to the large topography change there (Geyer and Nepf, 1996; Chen et al., 2012; Wang et al., 2015).
We also present the changes in the surface and bottom current horizontally. Figure 4e1–g1 show that when the estuary deepened (1977–1994 and 2003–2010), the surface current velocity increased in the channel, and when the estuary shoaled (1994–2003), the surface current velocity in the channel decreased. The changes in the bottom current showed a similar trend (Fig. 4e2–g2), except at the upper part of the channel from 1977 to 1994, in which the width was considerably decreased.
Along with the change in the longitudinal estuarine circulation, the salt intrusion in Sec. A did not change significantly from 1977 to 1994 but increased from 2003 on, particularly in 2010, when the isohaline of 15 psu reached Sec. B1, whose salinities were less than 12 psu in previous years (Fig. 4a–d). The salt intrusions at the surface and bottom gradually increased with the estuary narrowing (Fig. 4e1–g2).
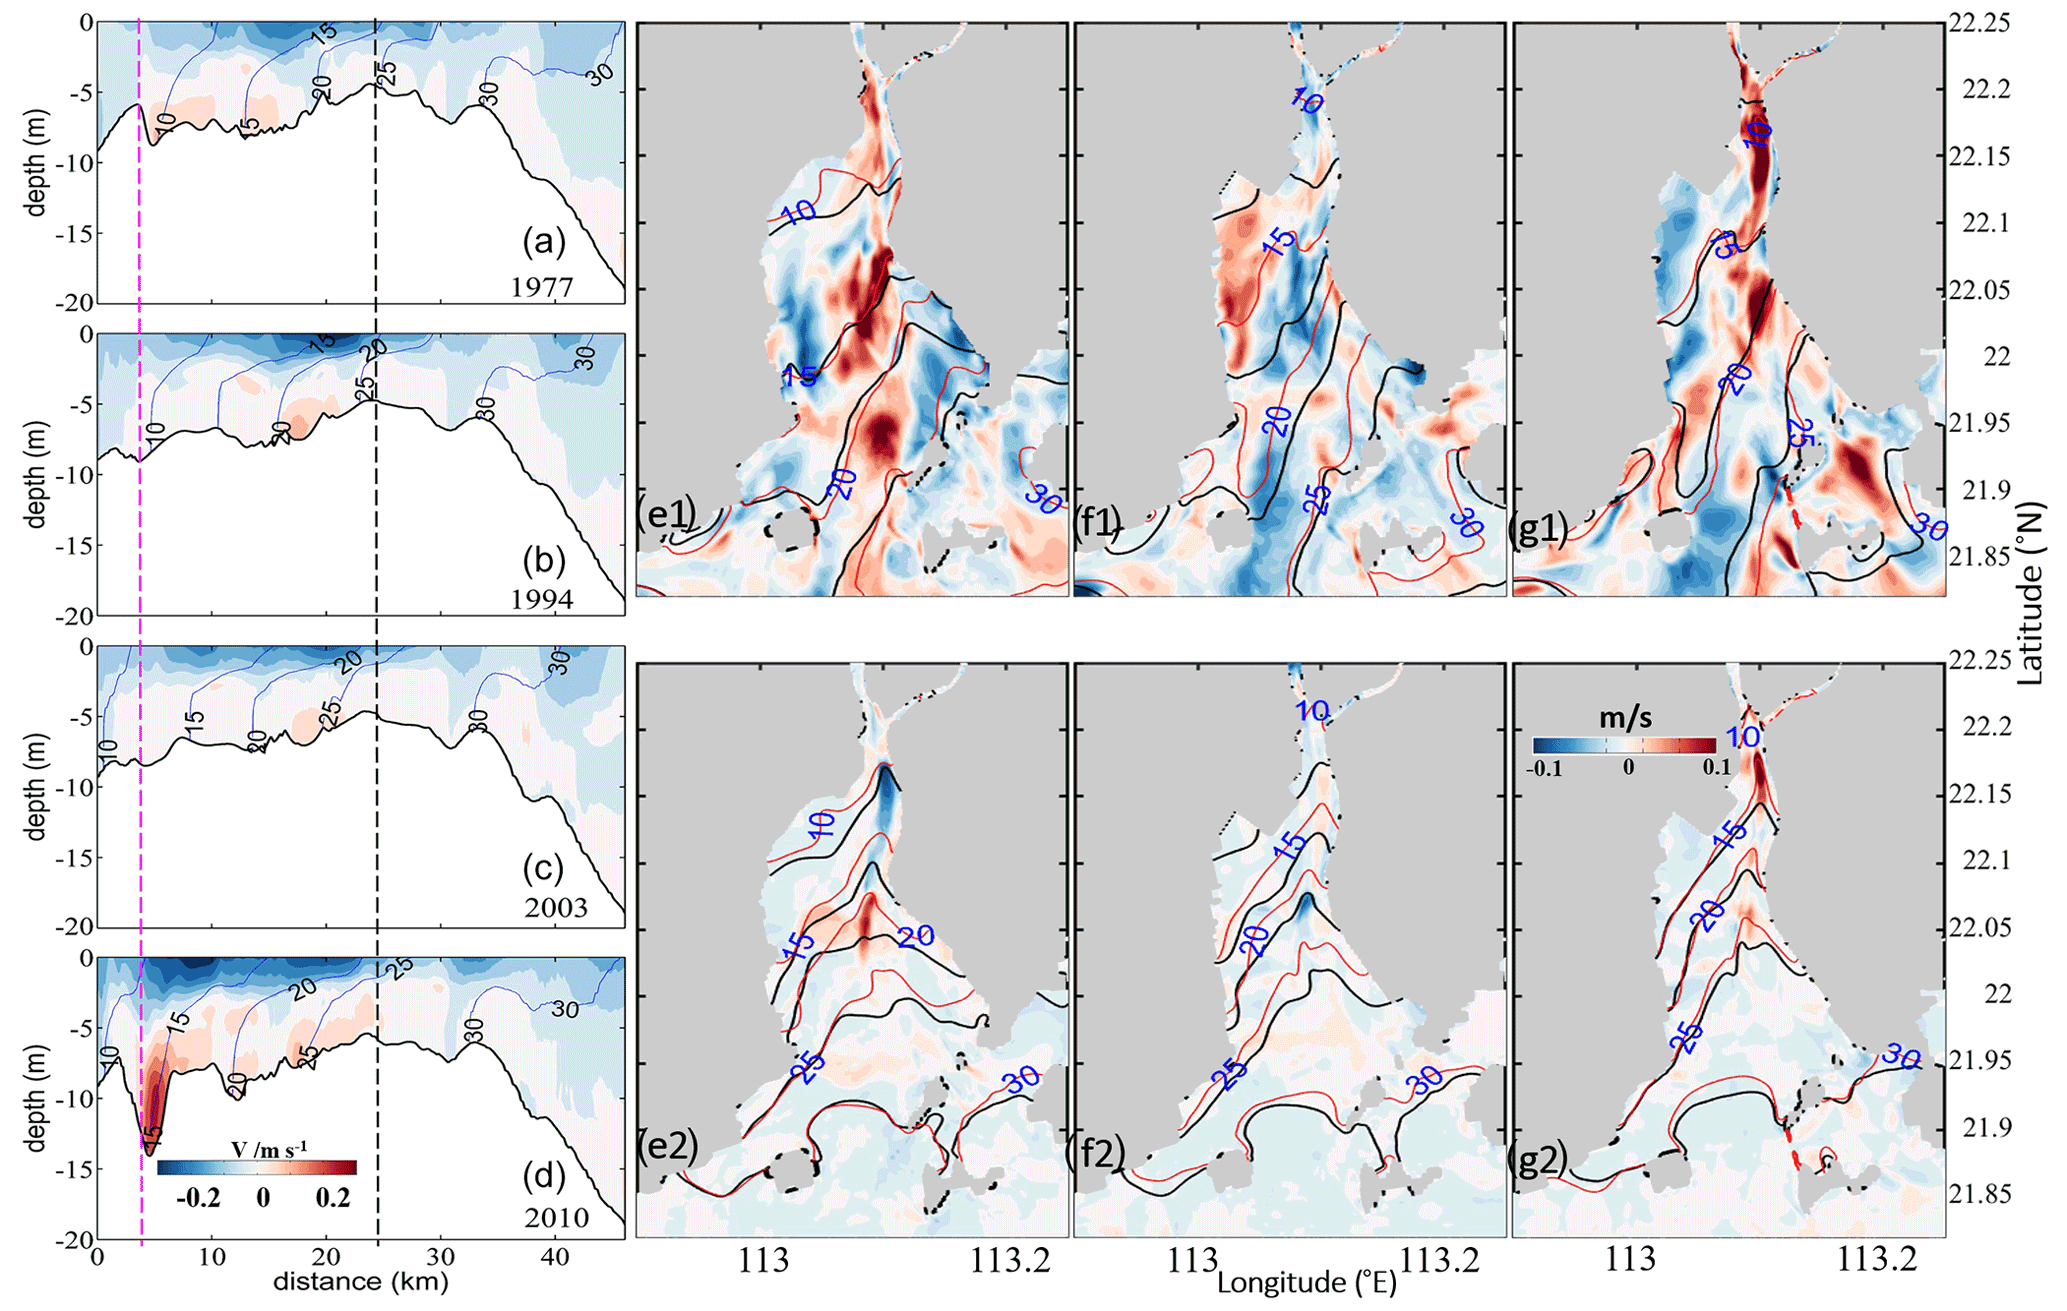
Figure 4The patterns of the tidally averaged estuarine circulation during the neap tide (from 10 March at 00:00 LT to 11 March at 00:00 LT (25 h)) in March 1977 (a), 1994 (b), 2003 (c), and 2010 (d). The thin lines are the isolines of salinity in panels (a)–(d). The dotted pink and black lines represent the locations of Secs. B1 and B2, respectively. The starting point of the x axis is point A in Fig. 1b. Surface tidally averaged current differences from 1977 to 1994 (e1), from 1994 to 2003 (f1), and from 2003 to 2010 (g1). Bottom tidally averaged current differences from 1977 to 1994 (e2), from 1994 to 2003 (f2), and from 2003 to 2010 (g2). The red and black lines represent the isolines of salinity in the later year and the earlier year.
To analyze the changes of lateral circulation in the estuary, we show the structure and intensity of the lateral circulation at the two cross sections (Figs. 5 and 6).
In Sec. B1 (Fig. 5), with the increase of water depth, the salinity difference between the surface and bottom increased, along with an increase in the bottom salinity. For the lateral circulation, there was no distinct gyre structure in 1977. In 1994, the lateral flow was dominated by an eastward flow. In 2003, a clockwise vortex developed over the West Shoal (0.5–1 km). Meanwhile, a counterclockwise circulation with smaller vortex intensity was developed in the region of 1–2 km from the western shore. Another clockwise circulation developed over the East Shoal. When the estuary became deepened in 2010, the distribution of the lateral circulation was similar to that in 1977, but the vortex intensity increased significantly to about 2–4 times that of 1977.

Figure 5The tidally averaged (from 10 March at 00:00 LT to 11 March at 00:00 LT (25 h)) lateral circulation and isohalines (blue lines) in Sec. B1 in 1977 (a2), 1994 (b2), 2003 (c2), and 2010 (d2). The starting point of the x axis is point C in Fig. 2d. wy is the longitudinal vorticity in Sec. B1 in 1977 (a1), 1994 (b1), 2003 (c1), and 2010 (d1). The arrows indicate the magnitude of lateral flow and vertical flow per unit length: 10 cm s−1 and 1.5 mm s−1, respectively. There are more model grid points than arrows (horizontal resolution: 68–180 m).
Figure 6 shows the changes in lateral circulation in Sec. B2. With the decrease of estuary width, the salinity increased in the cross section over the years. There developed a clockwise circulation at the right of the deep channel in 1977 and 1994. This clockwise vortex was seen to move westward from 2003 on. The spatial extent of the clockwise circulation in the deep channel increased significantly over time. Clockwise vortices developed over the East Shore from 1977 to 2010, but their intensity became weaker starting from 2003. In 1977 and 1994, the distance between the deep channel and the East Shore was greater than 2 km, which was sufficient for accommodating clockwise vortices. From 2003 on, the accommodation space at the East Shore became limited and restricted the full development of the clockwise vortex. Over the West Shoal, the lateral circulation pattern showed a counterclockwise circulation in 1977 and 1994. However, since 2003, the lateral circulation over the West Shoal began to develop a two-cell pattern, with a counterclockwise gyre at the surface and a clockwise one near the bottom. The clockwise cell developed well in 2010.

Figure 6The tidally averaged (from 10 March at 00:00 LT to 11 March at 00:00 LT (25 h)) lateral circulation and isohalines (blue lines) in Sec. B2 in 1977 (a2), 1994 (b2), 2003 (c2), and 2010 (d2). The starting point of the x axis is point E in Fig. 2d. wy is the longitudinal vorticity in Sec. B2 in 1977 (a1), 1994 (b1), 2003 (c1), and 2010 (d1). The arrows indicate the magnitude of lateral flow and vertical flow per unit length: 5 cm s−1 and 0.2 mm s−1, respectively. There are more model grid points than arrows (horizontal resolution: 64–316 m).
As a whole, over the study period, the longitudinal estuarine circulation continued to increase, whereas the lateral circulation experienced varying changes at different cross sections. In the upstream cross section (Sec. B1), when the estuary narrowed, the original pattern of two-cell vortices with opposite polarity was disrupted. However, it was amplified in 2010 when the water depth was increased. At the cross section in the middle of the estuary (Sec. B2), a similar two-cell pattern was developed. However, in 2003 and 2010, the single cell at the West Shoal was split into two cells: a counterclockwise cell at the surface and a clockwise cell at the lower part.
3.4 Relationship between the changes in the intensity of estuarine circulation and the changes in topography
To further quantitatively identify the influence of topographic changes on the estuarine circulation, we calculated the changes in the intensity of estuarine circulations in the longitudinal and lateral directions. The magnitude of estuarine circulation in the longitudinal section was used to represent the intensity of the longitudinal estuarine circulation (Chen and Sanford, 2009). The method was to subtract the subtidal longitudinal velocity of the bottom layer from that on the surface layer. The magnitude of the vorticity in the cross sections was used to represent the intensity of the lateral circulation (Becherer et al., 2015) and is expressed as
where wy is the longitudinal vorticity in the cross sections. w and u are the currents in the vertical and lateral directions, respectively. is small and can be ignored; therefore, Eq. (2) can be simplified as
When wy is positive, the lateral circulation is a counterclockwise vortex; conversely, when wy is negative, the lateral circulation is a clockwise vortex.
The results of the averaged intensity of estuarine circulation along Sec. A and the averaged intensity of vorticity in the cross sections are listed in Table 4.
Table 4The changes of width and depth (the maximum depth), area (cross-section area), w-to-d, narrowing rate, deepening rate, and the intensity of circulations (w-to-d: width-to-depth ratio; narrowing rate: the ratio of the difference of cross-section widths between 2 years divided by the width in the earlier year; deepening rate: the ratio of the difference of water depth in the cross section between the corresponding 2 years divided by the earlier depth; a positive narrowing rate indicates that the estuary is narrowed; a positive deepening rate indicates that the estuary is deepened).
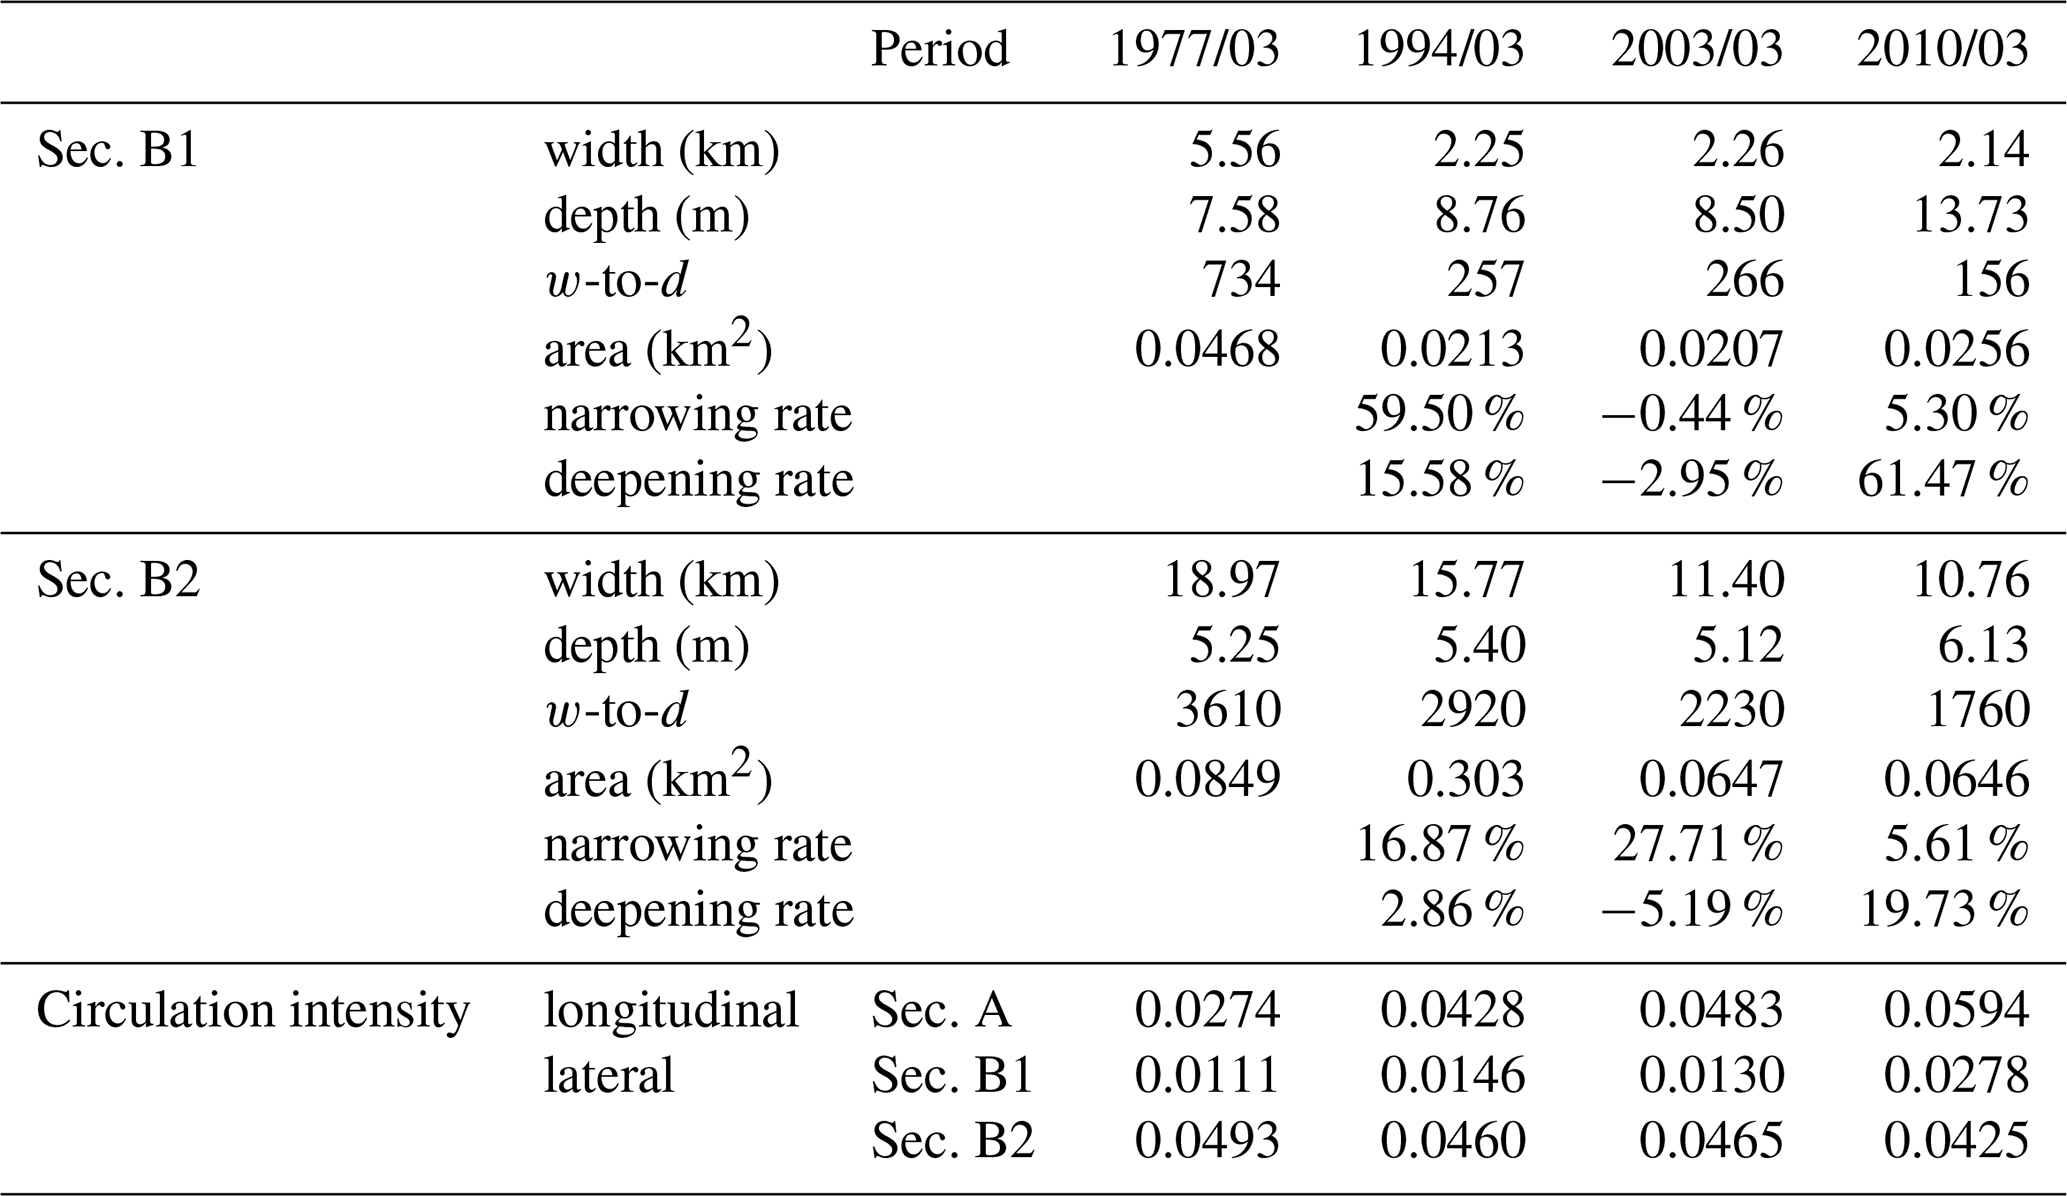
Table 4 indicates that the longitudinal estuarine circulation intensity increased with the estuary narrowing and was largest (0.0594 m s−1) in 2010.
The lateral circulation intensity varied in different cross sections. For Sec. B1, it increased gradually when the estuary deepened (from 1994 to 2010). When the deepening rate reached the maximum (61.47 %) in 2010, the lateral circulation intensity reached the maximum as well. The intensity of lateral circulation increased when the estuary deepened and narrowed (from 1977 to 1994 and from 2003 to 2010), but it decreased when the estuary shallowed and narrowed (from 1994 to 2003). For Sec. B2, the intensity of lateral circulation decreased when the estuary deepened and narrowed (from 1977 to 1994 and from 2003 to 2010). However, this trend was altered when the estuary entered into the “narrowing and shallowing period”, with the deepening rate being −5.19 %. It indicates that changes in water depth were the dominant factors affecting the lateral circulation intensity.
In general, the relationship between the longitudinal estuarine circulation intensity and the estuary width showed a monotonic decrease, while that between the longitudinal estuarine circulation intensity and the water depth shows a monotonic increase, but the lateral circulation intensity seemed to have no simple linear relationship with the topographic change.
4.1 Contribution of momentum terms to the variation of the longitudinal estuarine circulation
To explain the change in the longitudinal estuarine circulation intensity, we conducted a diagnostic study by examining the changes in terms of the momentum balance equations. We calculated each term of the momentum equation in the longitudinal direction in the tidally averaged timescale:
By comparing the changes in each term and linking them with the characteristics of morphological evolution, we explain the response of the longitudinal estuarine circulation to bathymetric change in the perspective of momentum balance. Though the change in an individual momentum term in Eq. (4) cannot represent the change in the longitudinal estuarine circulation as a whole, it can reflect the change in the corresponding component for the estuarine circulation (Cheng, 2013). For example, an increase or decrease in the baroclinic pressure gradient force can reflect the change in the gravitational circulation, and the change in the advection term is representative of the change in tidal rectification. In the following, we present the vertically averaged values for these different terms along the longitudinal section in different years. It should be noted that the friction term consists of a component of the tidal mean eddy viscosity multiplied by the tidal mean vertical current shear, and a component of the correlation between eddy viscosity and vertical current shear, which is referred to as the tidal straining (Simpson et al., 1990).
Figure 7 shows that during the neap tide, the baroclinic pressure gradient force was balanced by barotropic gradient force, friction, and advection terms in each year. This is different from the classic estuarine momentum balance (Pritchard, 1956) but consistent with the recent understanding of estuarine physics (Geyer and MacCready, 2014). The Coriolis force is quite small as both the latitude of the HE and the residual current are small. The high value of the baroclinic term was observed to shift upstream over time. As the baroclinic term is the multiplication of the salinity gradient and water depth, the changes in this term over years can be induced by the change in water depth and/or the salinity gradient. It can be seen from Fig. 4 that north of the null point, the salt intrusion gradually moved towards the bay head with the estuary narrowing, thus increasing the salinity gradient there. In the meantime, the upstream water depth was increased due to channel dredging, particularly in 2010. Therefore, the increase of the baroclinic term was caused by both the increases in water depth and salinity gradient. Although the barotropic term contributed a lot to the momentum balance, it did not change obviously with the morphological evolution. The advection term in Sec. B1 increased slightly with the estuary narrowing, especially in the deepening part of the channel in 2010. The friction term was larger in 2010 than in other years, because the salt intrusion increased the vertical shear of the longitudinal current in Sec. B1. Nevertheless, the increase in friction term was much smaller than that of the baroclinic term. Chant et al. (2018) attributed the increase in exchange flow to the increase in along-channel salinity gradient and/or a reduction in vertical mixing by deepening, but in our case, the increase in baroclinic term was dominant and the change in vertical mixing even posed a reversed effect.
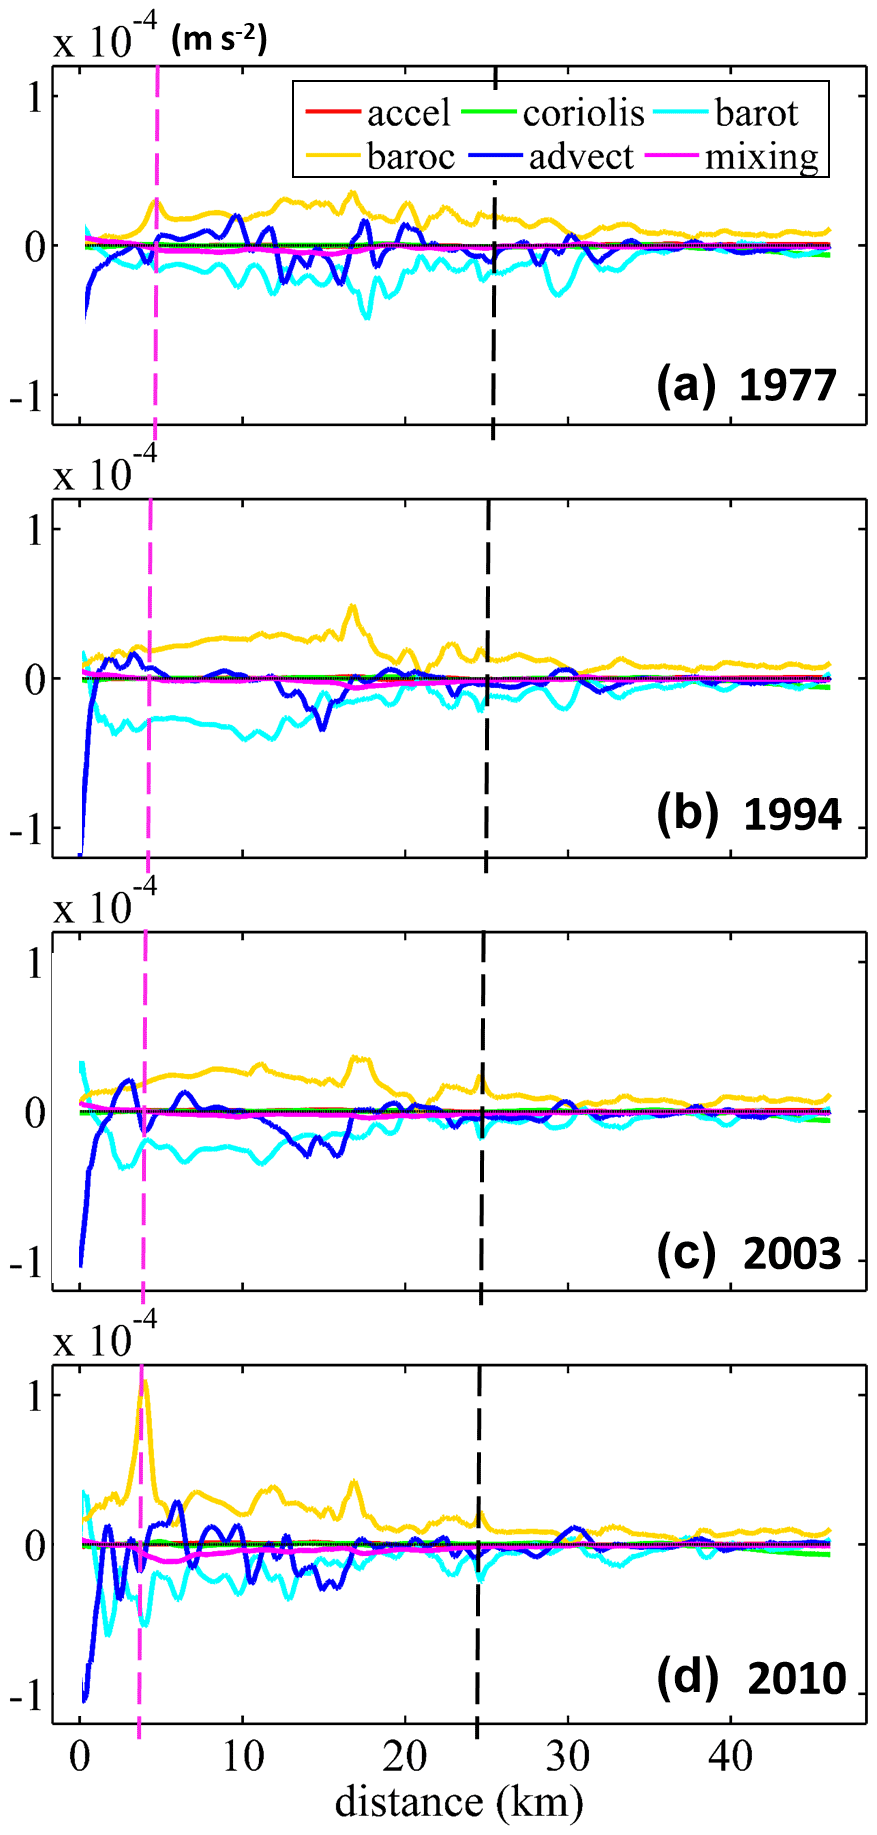
Figure 7Patterns of the tidally averaged longitudinal momentum terms during neap tide (from 10 March at 00:00 LT to 11 March at 00:00 LT (25 h)) in Sec. A in 1977 (a), 1994 (b), 2003 (c), and 2010 (d). The starting point of the x axis is point A in Fig. 1b. “accel” in legend: local acceleration term (the 25 h average rate of change of longitudinal flow); “barot” in legend: the barotropic pressure gradient force; “baroc” in legend: the baroclinic pressure gradient force.
To further identify the changes in different terms, the advection term was divided into lateral (x direction), longitudinal (y direction), and vertical (z direction) advection terms (Fig. 8). It is worth noting that the sum of the advection terms in x and z directions represents the effect of the lateral circulation.
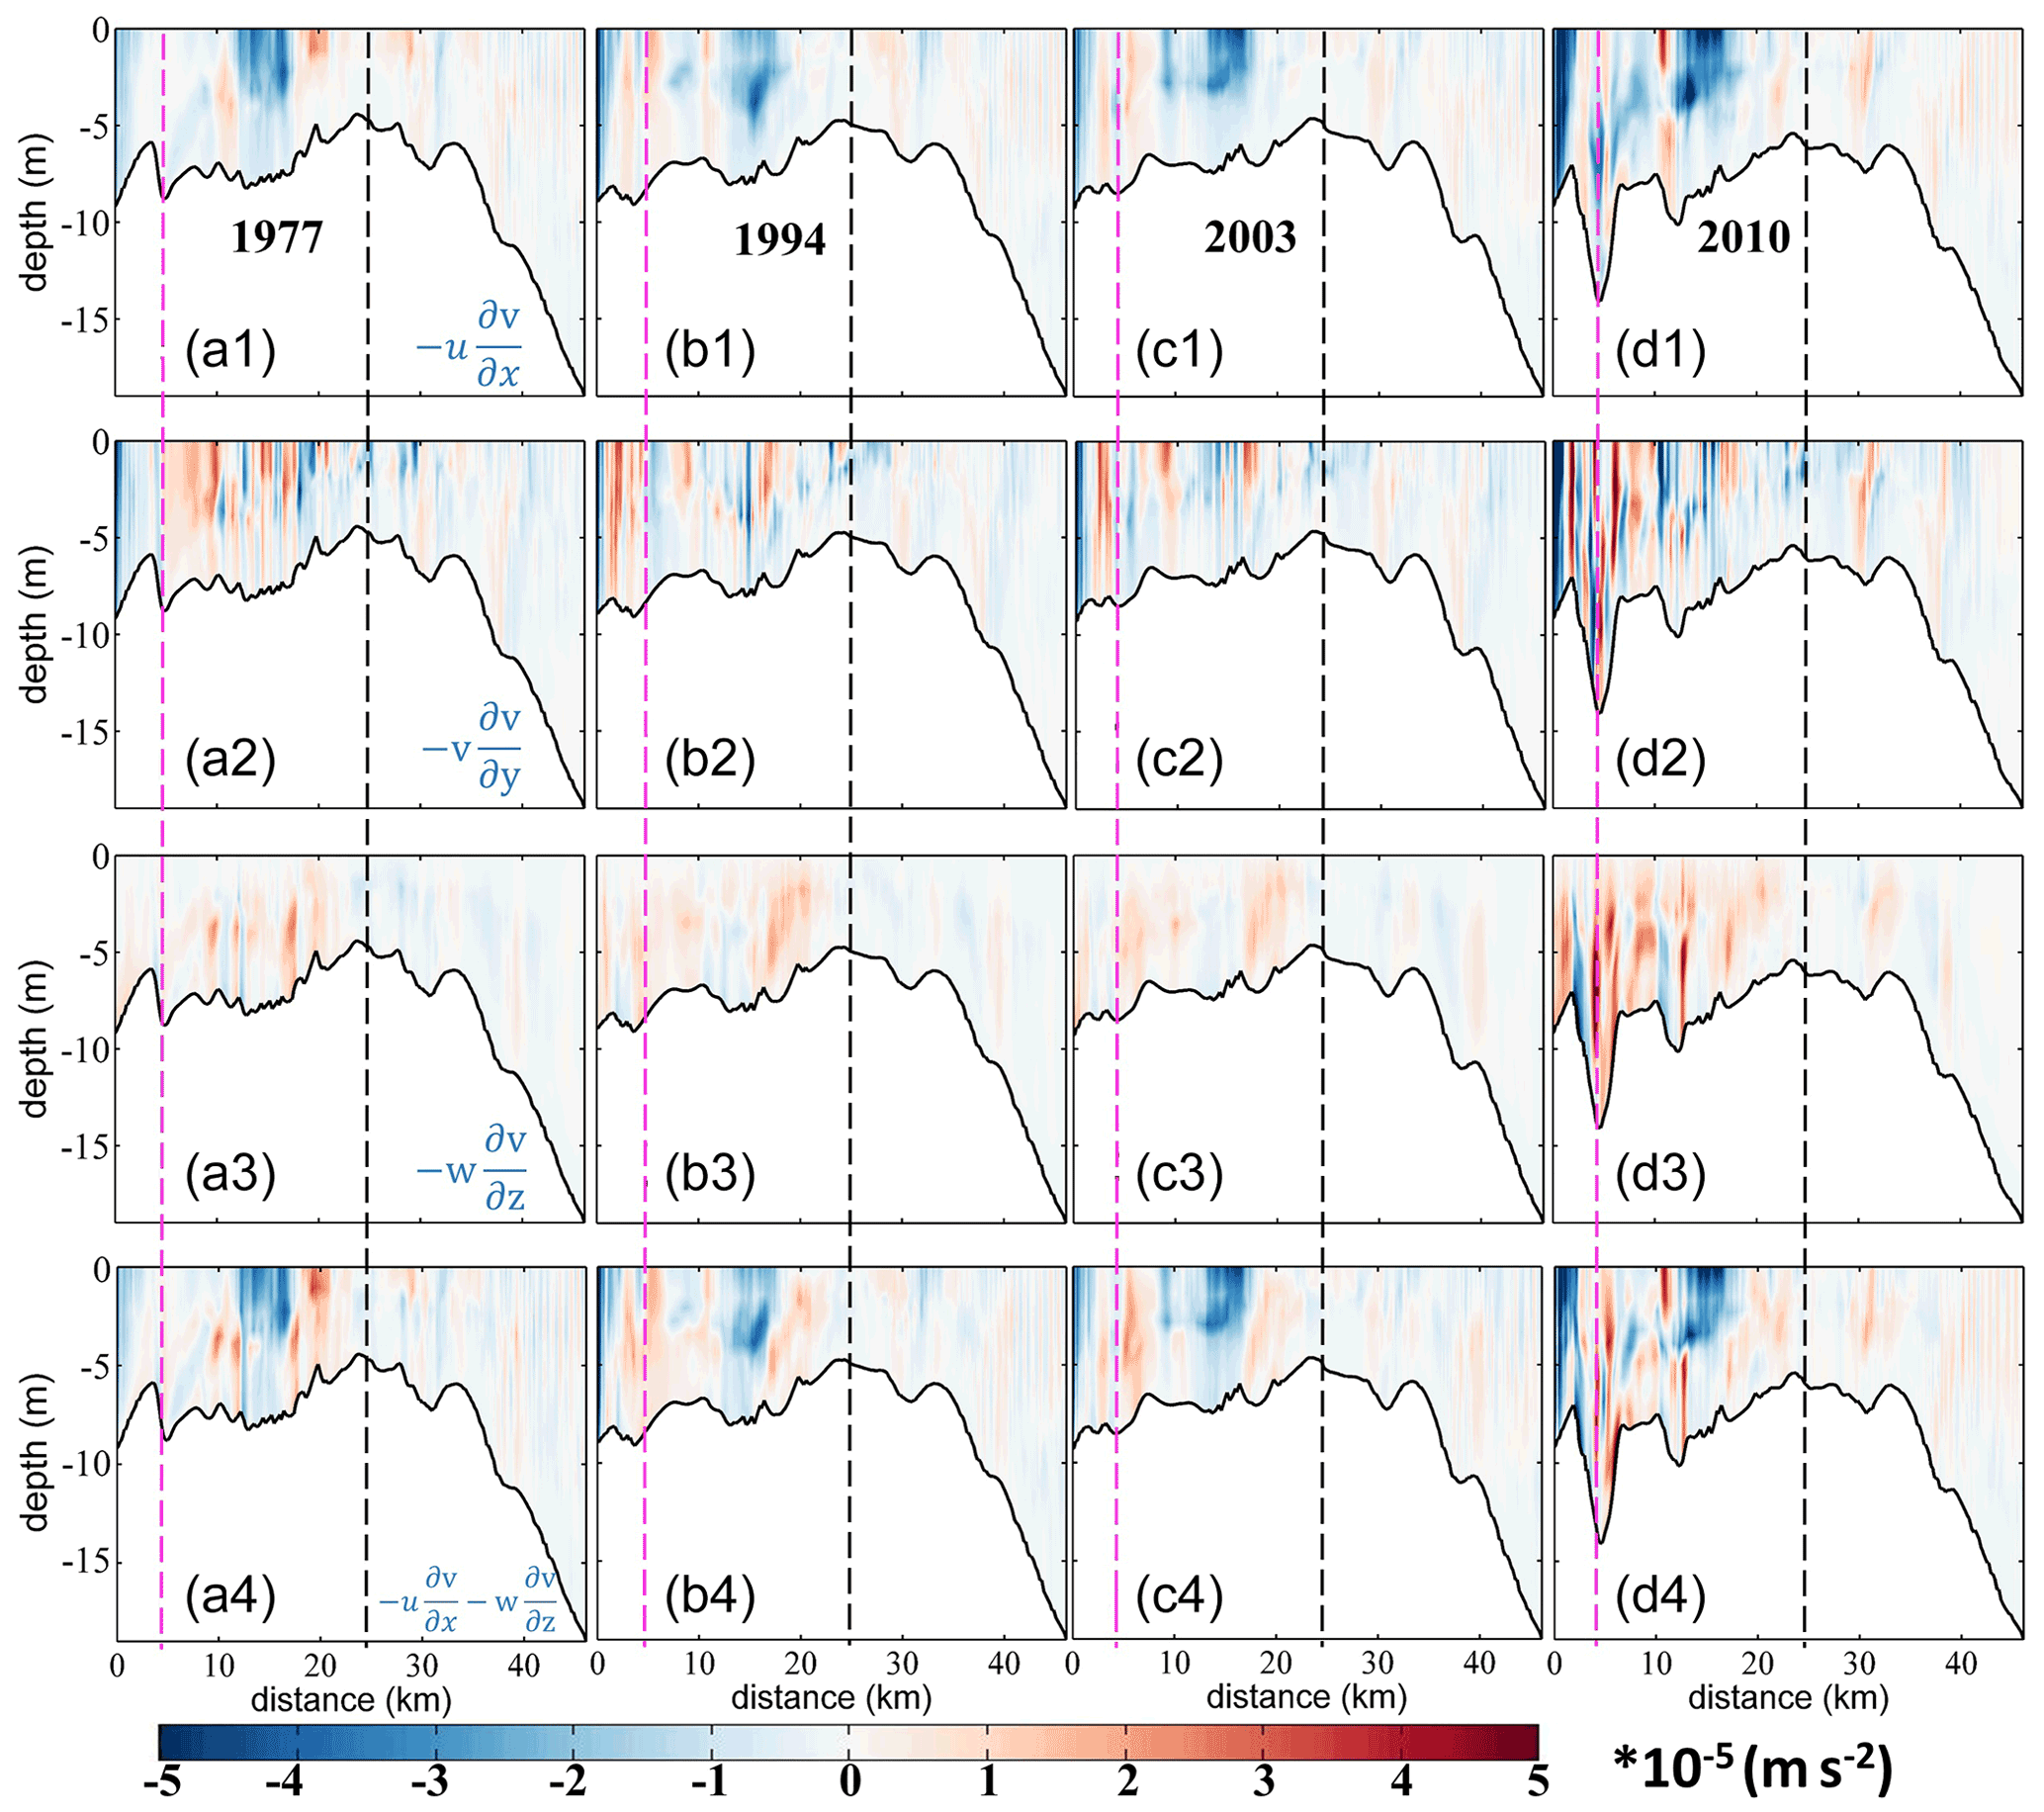
Figure 8Patterns of the tidally averaged longitudinal momentum terms during neap tide (from 10 March at 00:00 LT to 11 March at 00:00 LT (25 h)) in Sec. A. (a1–d1) The advection in the x direction, . (a2–d2) The advection in the y direction, . (a3–d3) The advection in the z direction, . (a4–d4) The sum of the advection terms in x and z directions. The 1977, 1994, 2003, and 2010 cases are in the first, second, third, and fourth columns, respectively. The dotted pink and black lines represent the locations of Secs. B1 and B2, respectively. The starting point of the x axis is point A in Fig. 1b.
Compared to the results in other years, the advection terms (in both longitudinal and lateral directions) increased significantly in 2010 (Fig. 8a1–d4), following the deepening and narrowing of the estuary. Generally, the lateral advection and vertical advection compete against each other, and their additive effect is to generate a circulation similar to the gravitational circulation. This effect was stronger in 2010 than in other years (Fig. 8a4–d4).
Overall, from 1977 to 2010, the baroclinic forcing, the friction, and the advection terms increased obviously along Sec. A. The maximum longitudinal estuarine circulation in 2010 was caused by the increase in the pressure gradient force and the advection term, especially the baroclinic forcing.
4.2 Analysis of the streamwise vorticity balance for the lateral flow
In order to reveal the contribution of the vertical shear of the along-channel flow, the lateral salinity gradient, and the vertical diffusion to changes in the lateral circulation, we examine the changes in terms of the streamwise vorticity transport equation (Li et al., 2014):
On the right side of Eq. 5, the first term represents the tilting of the planetary vorticity by vertical shear in the along-channel flow, the second term is the baroclinicity caused by the lateral salinity gradient, the third term is the vertical diffusion, and the fourth term is the horizontal diffusion, which is typically 2 orders of magnitude smaller than the vertical diffusion term. Therefore, we only show the acceleration and first three right-hand-side terms in Fig. 9.
Figure 9 shows that the changes of baroclinic term caused by the water depth change dominated the changes in the lateral circulation in Sec. B1. The baroclinic term in the deep channel was generally negative on the left side of the channel, and it increased significantly in 2010, about 2–3 times the value in 1977. The baroclinic term with positive values occurred at the West Shoal over the study period, but the areal extent occupied by the positive values decreased gradually, with its magnitude increasing obviously in 1994 when the narrowing rate was the largest. A negative baroclinic term appeared at the bottom of the West Shoal, indicating that the changes in water depth can lead to changes in the pattern and magnitude of the baroclinic term, which was mainly caused by the changes in the salt intrusion. The tilting of the planetary vorticity term increased with the estuary narrowing; the greater increase in 2010 was mostly caused by the depth change. The pattern of the vertical diffusion term changed significantly in 1977 and 1994, especially at the surface and the bottom layers of the West Shoal, indicating that it was the changes in width that altered the vertical diffusion term.
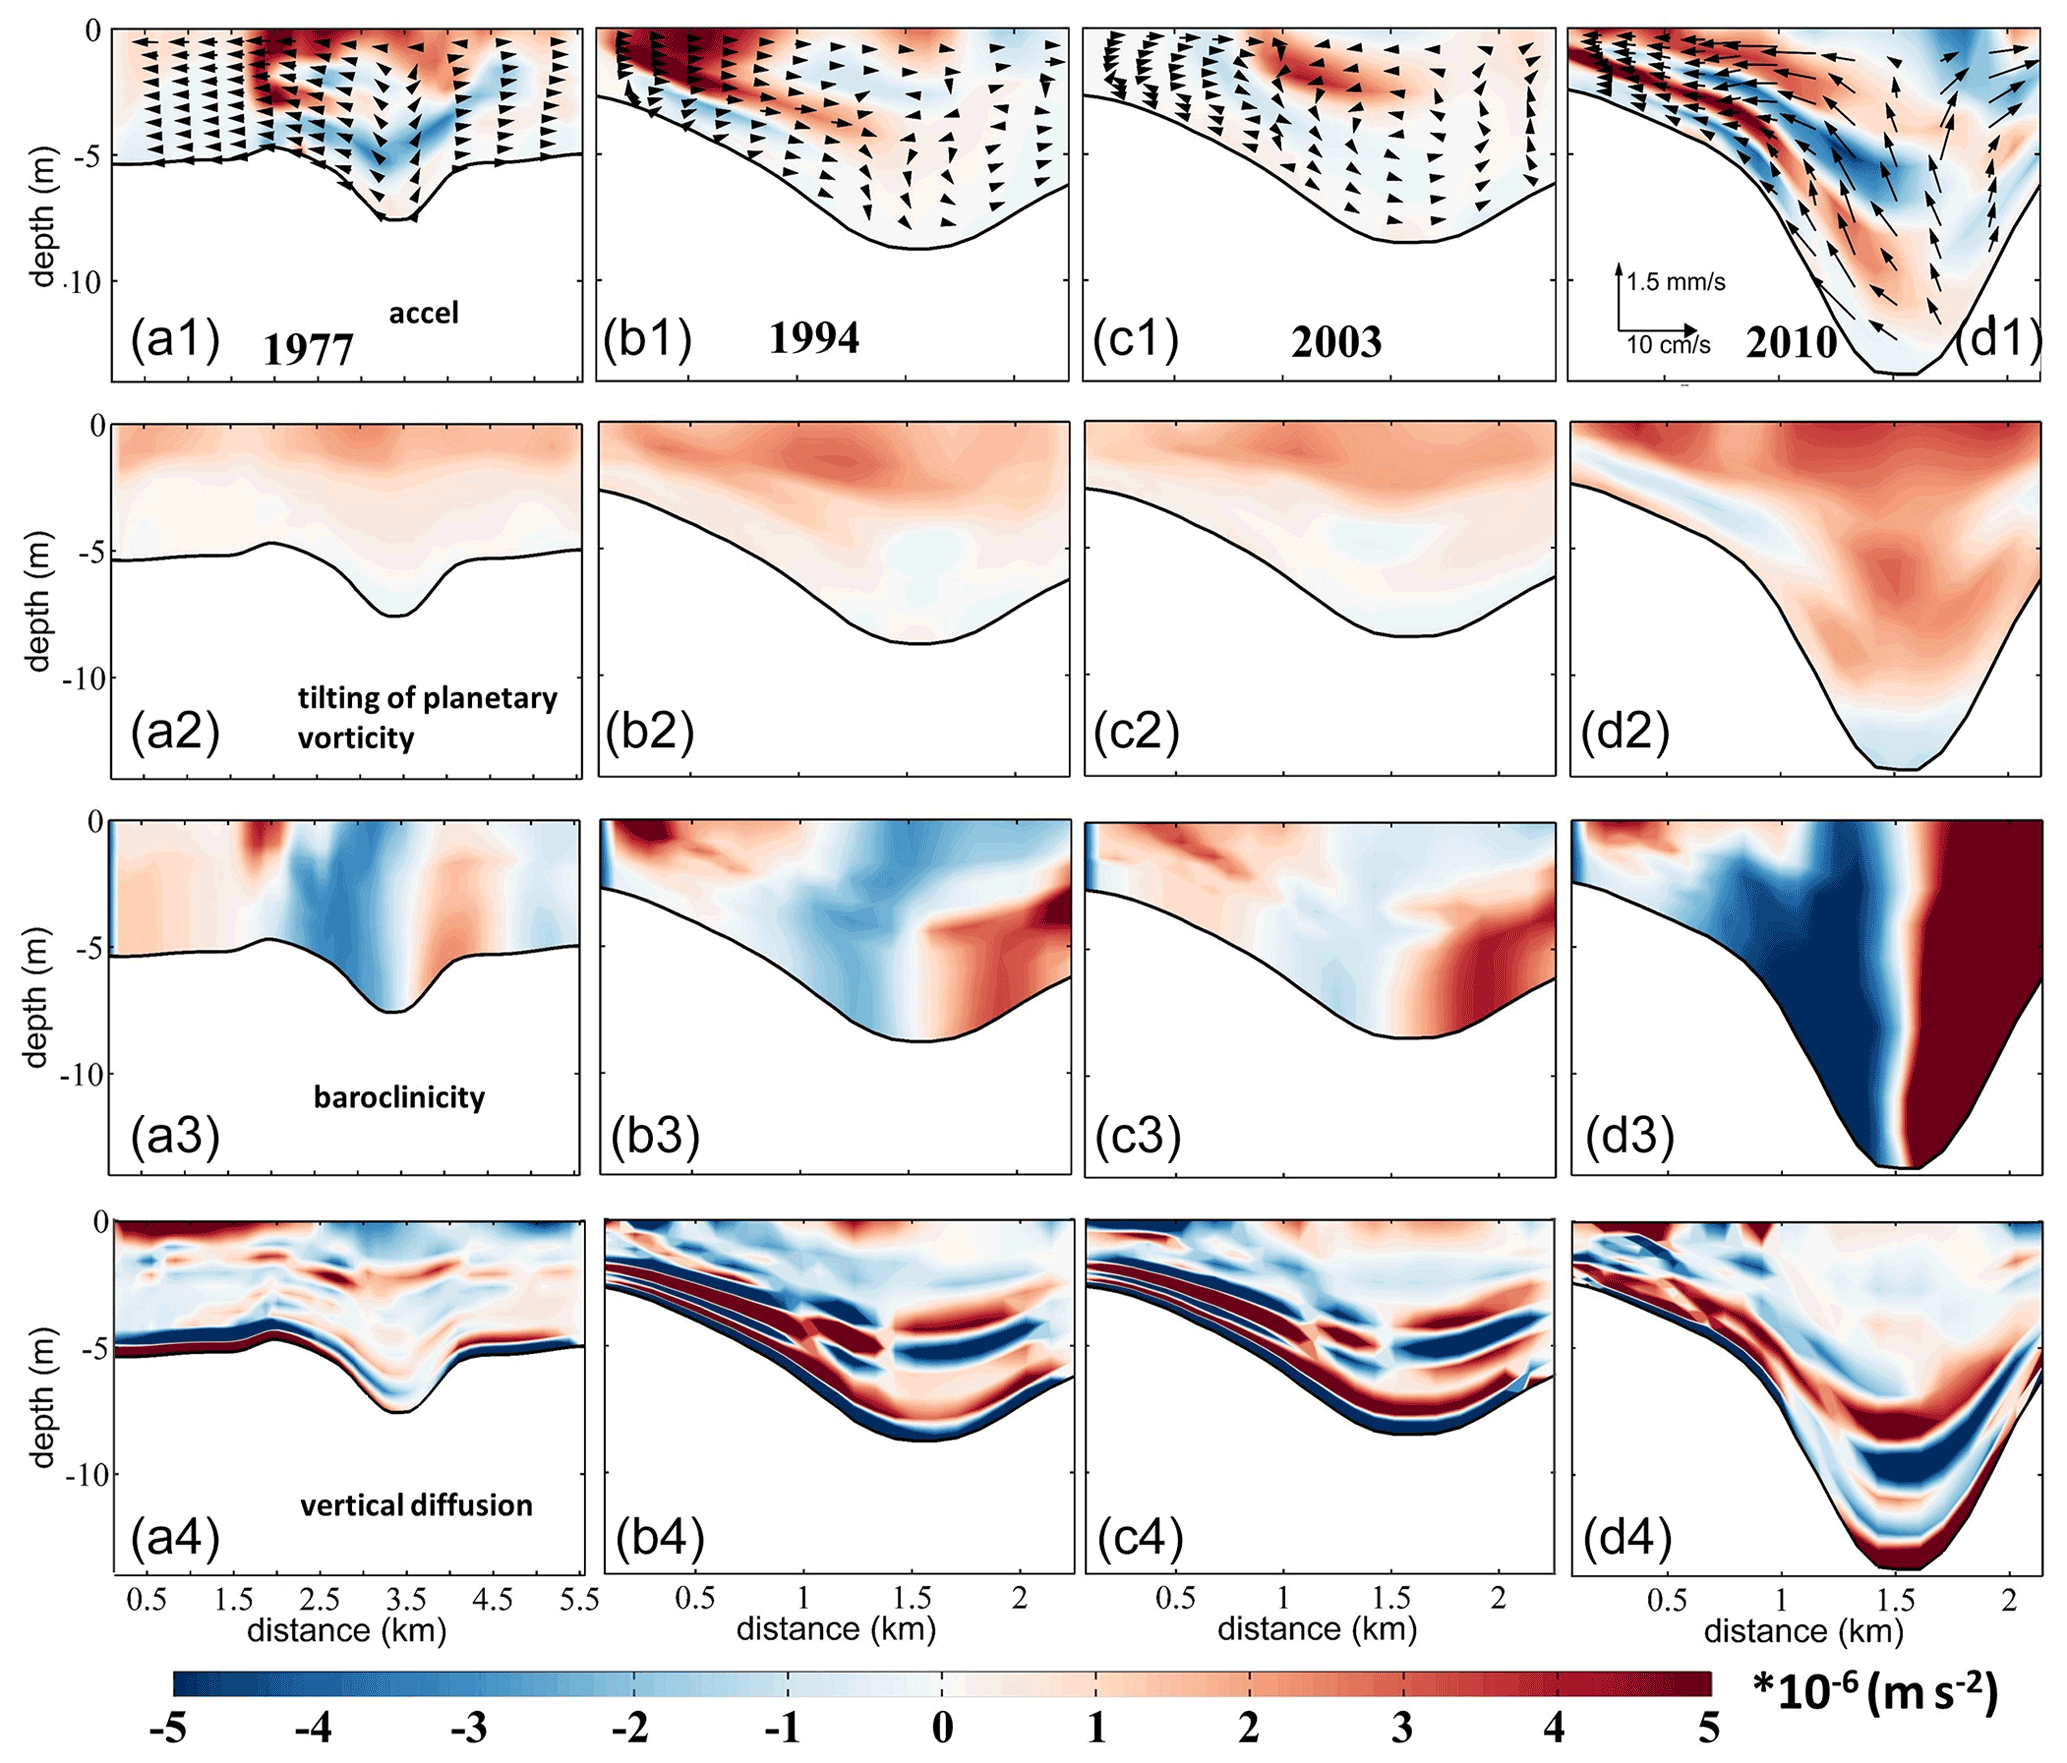
Figure 9Patterns of the tidally averaged streamwise vorticity equation terms during neap tide (from 10 March at 00:00 LT to 11 March at 00:00 LT (25 h)) in Sec. B1. (a1–d1) The local acceleration term (the 25 h average rate of change of the longitudinal vorticity). (a2–d2) The tilting of planetary vorticity term. (a3–d3) The baroclinic term. (a4–d4) The vertical diffusion term. The cases in 1977, 1994, 2003, and 2010 are in the first, second, third, and fourth columns, respectively. The starting point of the x axis is point C in Fig. 2d. For viewing purposes, the acceleration term is multiplied by 5. The block arrows in panels (a1)–(d1) represent the distribution of lateral circulation.

Figure 10Patterns of the tidally averaged streamwise vorticity equation terms during neap tide (from 10 March at 00:00 LT to 11 March at 00:00 LT (25 h)) in Sec. B2. (a1–d1) The local acceleration term (the 25 h average rate of change of the longitudinal vorticity). (a2–d2) The tilting of planetary vorticity term. (a3–d3) The baroclinic term. (a4–d4) The vertical diffusion term. The cases in 1977, 1994, 2003, and 2010 are in the first, second, third, and fourth columns, respectively. The starting point of the x axis is point E in Fig. 2d. For viewing purposes, the acceleration term is multiplied by 5. The block arrows in panels (a1)–(d1) represent the distribution of lateral circulation.
From Fig. 10, the change in the tilting of the planetary vorticity in Sec. B2 was analogous to that in Sec. B1. The baroclinic term did not change much, because the changes in water depth were smaller in this section. The clockwise circulation over the West Shoal increased as the estuary deepened in 2010, because the baroclinic term was larger with the increase of salt intrusion and vertical salinity gradient near Sec. B2. The vertical diffusion of the vorticity was overall negative, indicating its effect in dissipating the vorticity. The vertical diffusion term was larger than the baroclinic term, especially in the middle water, which was inconsistent with the conclusion that the baroclinic term is the most important one in the lateral circulation (Li et al., 2014). The reason may be that at our study site, the vertical mixing was strong as the estuary became shallow. However, the existence of a pycnocline greatly weakened the momentum exchange between the upper and lower layers: above the pycnocline, the tilting of the planetary vorticity was dominant, whereas, under the pycnocline, the baroclinic term was dominant. The decrease of the estuary width changed the magnitude and pattern of the vertical diffusion term: the area with a large positive value disappeared at the bottom of the East Shoal and the magnitude of the negative value decreased greatly at the eastern end of the section. It indicates that in a shallow estuary, the vertical diffusion term caused by the width change is also important.
In summary, the tilting of the planetary vorticity increased with the decrease of width or with the increase of water depth. The variation of estuary width was responsible for the changes in the vertical diffusion term, and the changes in water depth were responsible for the changes in the baroclinic term. The increase of the longitudinal estuary circulation can increase the baroclinic term at the cross sections by increasing the salinity gradient near the cross sections, as mainly occurred in the periods of the estuary deepening. The deepening rate of Sec. B1 was the fastest (61 %) in 2010, which led to the strongest lateral circulation in 2010. The lateral circulation intensity decreased when the estuary narrowed in 2003 due to the decreased baroclinic term. In addition, the shallowing was the main reason for the pattern change of the lateral circulation in Sec. B2. In Sec. B2, the narrowing rate was the fastest in 2003, and the adjustment of the vertical diffusion term resulted in an increased lateral circulation from 1994 to 2003. The decrease of the clockwise circulation at the East Shoal was mainly related to the adjustment of the vertical diffusion term to the baroclinic term.
4.3 Comparison to theoretical results and other estuaries influenced by human interventions
The longitudinal estuarine circulation is generated by the river discharge, Stokes return flow, longitudinal baroclinic pressure gradient force, tidal straining, and advection (Geyer and Maccready, 2014). The HE features a microtidal tidal regime (tidal range less than 1.5 m), and the component generated by the baroclinic pressure gradient, i.e., the gravitational circulation, would be a primary part of the longitudinal estuarine circulation. The convergent geometry makes it susceptible to the residual flow induced by the longitudinal advection (Burchard et al., 2014). However, as shown in Fig. 8, not only the longitudinal advection but also the lateral advection plays the important role in generating the estuarine circulation in the HE.
With channel deepening and width narrowing in the HE, the gravitational circulation was increased by the increased baroclinic pressure gradient force. Based on Geyer's research (2010), the gravitational circulation can be simplified to
in which w0 and h0 are the width and depth at the estuary mouth, respectively. It indicates that the gravitational circulation is inversely related to the water depth and width in the estuary, with a weaker dependence on the water depth. In Chant et al. (2018), the gravitational circulation is completely unrelated to the water depth in their Eq. (2), which is , in which the g′ is the reduced gravity acceleration. This seems to contradict the situations occurring in many estuaries, such as in the Coos Bay (Eidam et al., 2020), Tampa Bay (Zhu et al., 2015), Changjiang estuary (Zhu, 2018), Ems estuary (Van Maren et al., 2015), Hudson estuary (Ralston and Geyer, 2019), and Newark Bay of the Delaware estuary (Chant et al., 2018). In all these estuaries, the gravitational circulation demonstrated an increase with the deepening of the channel. It suggests that the changes in gravitational circulation vary in different parts of the estuary and the longitudinal salinity gradient may not catch up with the change in water depth in the analytical solution, as proposed by Chant et al. (2018) and Ralston and Geyer (2019). In our study site, the salinity gradient at the upstream part of the longitudinal section was increased due to an enhanced salt intrusion where water depth increased, which led to an increased gravitational circulation in the upper HE (Fig. 4).
The tidal straining-induced estuarine circulation is another important component of longitudinal estuarine circulation. The straining-induced circulation is the covariance of the eddy viscosity and the vertical shear of the longitudinal flow (ESCO) in a tidal cycle and is included in the term of internal friction. Cheng et al. (2010) have indicated that ESCO-induced flow dominates the gravitational circulation in periodically stratified estuaries with strong tides, having the same structure as the gravitational circulation. It has the same order of magnitude in weakly stratified estuaries as moderate tides and is less important in highly stratified estuaries with weak tides, even with a reversed structure with the gravitational circulation. As indicated by Becherer et al. (2015), the strength of the straining-induced circulation is dependent on the Simpson number (or the horizontal Richardson number). The Simpson number is expressed as
in which u∗ is the bottom friction velocity, represented by , where Cd is the bottom friction coefficient and Ut is the tidal velocity amplitude.
When Si is larger than 0.84, the water column is in a persistent stratified situation, and the straining-induced circulation becomes weaker. We calculated the Si values along the longitudinal section in different years and depict them in Fig. 11.
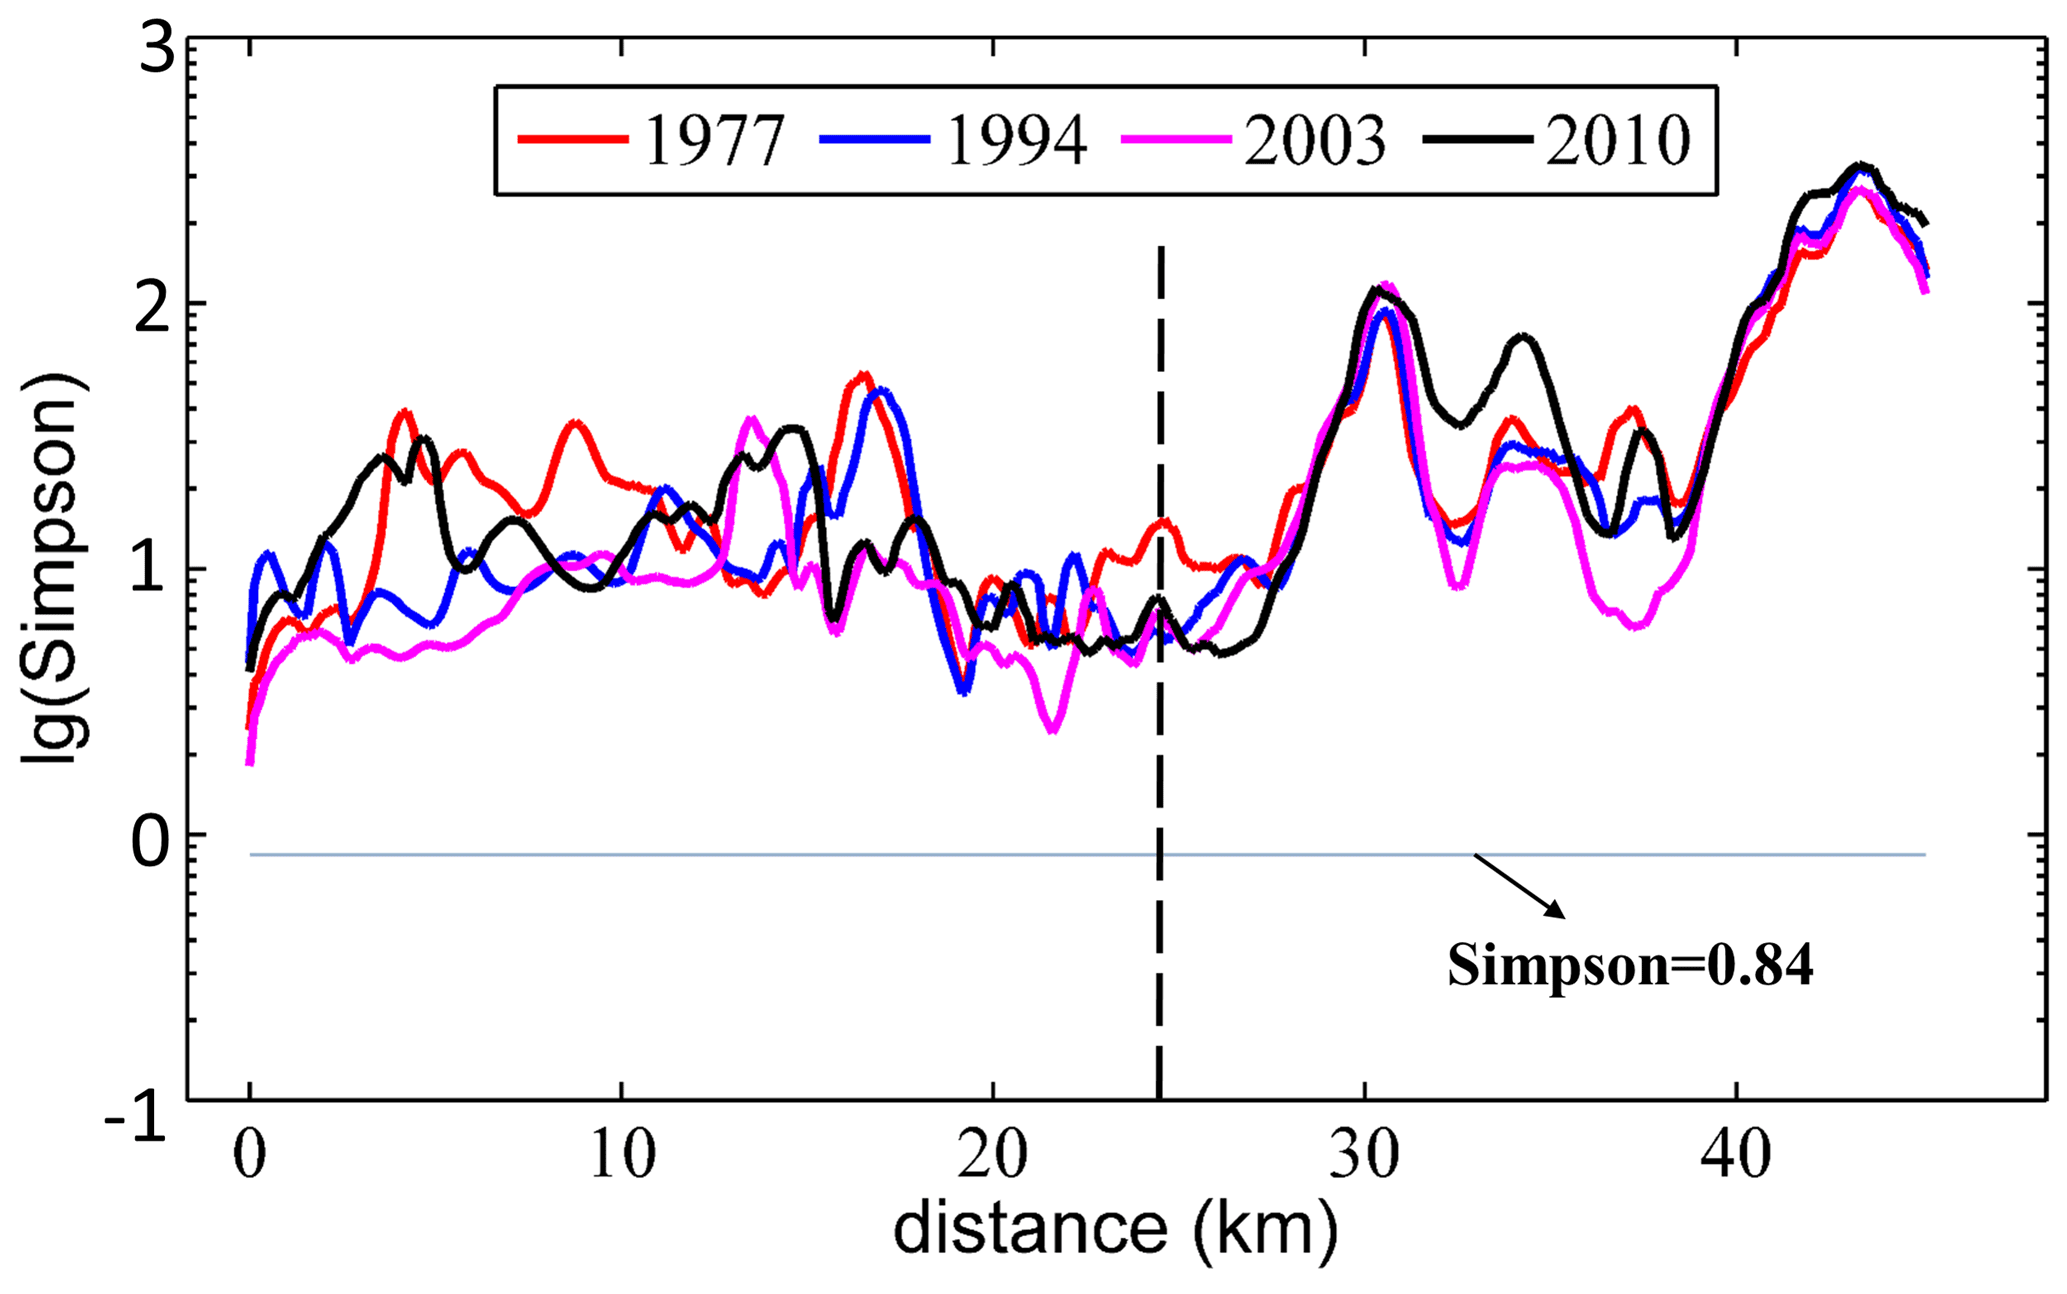
Figure 11Distribution of the Simpson number in different years along the longitudinal section. The y axis represents the logarithm of the Si. The dotted black line represents the location of the null point.
It indicates that along the longitudinal section, the Si number was mostly above the criterion of 0.84, showing that the straining-induced circulation is not significant. The Si number was the smallest in 2003 and the largest in 2010. It indicates that with the narrowing and deepening of the HE, the straining-induced circulation became weaker. This is consistent with Burchard et al. (2014) and Schulz et al. (2015). It indicates that with human interventions, the straining-induced circulation became less important in the longitudinal estuarine circulation.
For the advection-induced longitudinal estuarine circulation, we noted that the longitudinal and vertical advection terms were smaller than the lateral advection. Based on Cheng and Valle-Levinson (2009), the lateral advection-induced longitudinal circulation is proportional to the ratio of ), where w is the width, and Km is the eddy viscosity. It shows that in a narrower and deeper estuary, the lateral advection has a larger effect in influencing the longitudinal estuarine circulation. Lerczak and Geyer (2004) also showed that the effect of the lateral advection on longitudinal circulation is stronger for narrower estuaries. Our results show that with the narrowing and deepening of the estuary, not only the lateral advection but also the longitudinal advection has a great influence on the longitudinal estuarine circulation.
4.4 The possible future development of the estuarine circulation and its implications
The pattern of lateral circulation during the dry season in the HE experienced a dramatic change from 2003 to 2010 in the West Shoal in Sec. B2, from an underdeveloped circulation structure to a complete clockwise vortex in 2010. This transition was associated with the increase in lateral salinity gradient, the increase in longitudinal bottom landward flow, and a decrease of friction by the increased water depth and stratification.
The mechanisms for the lateral circulation during the wet season have been revealed by Chen et al. (2020b), who showed that it was primarily driven by the barotropic process, i.e., the water elevation gradient, and thus by the intensity of the ebb jet. Different from the wet season when the river discharge was higher, the lateral circulation in the dry season was more affected by the baroclinic effect. We speculate that, with the narrowing and deepening of the estuary, the lateral circulation will be enhanced even in the wet season accompanied by the strengthened ebb jet in the deep channel.
In the HE, the channel underwent siltation, and sediment was carried from the channels to side banks by the lateral circulation, making the estuary overall shallower in 2003. In 2005, dredging of the channel increased the channel depth (Luo, 2010) and increased the longitudinal estuarine circulation, though the lateral circulation decreased slightly by the smaller rate of convergence. If reclamation is less frequent than in the last century, and the channel dredging continues, then circulation in the HE will keep increasing as the water depth increases, and thus a positive feedback exists. However, as revealed in Eq. (6) in this paper and Eq. (2) in Chant et al. (2018), with the increase in salt intrusion, the longitudinal salinity gradient will decrease, showing negative feedback. Moreover, Schulz et al. (2015) noted that estuarine circulation exhibited a distinct maximum in medium-wide channels by comparing estuarine circulation under different width-to-depth ratios. In our study, as shown in Table 4, the width-to-depth ratio has been decreasing from 1977 to 2010, but the estuarine circulation has been increasing. The difference would be caused by the fact that at our study site, the tidal mixing is not strong enough to generate an effective tidal straining-induced circulation.
The changes in the estuarine circulation have important implications for sediment transport and morphological evolution in the HE. With the increase of longitudinal estuarine circulation, the sediment trapping effect is expected to be enhanced; thus, more riverine sediment would be trapped inside the estuary. In the meantime, a decrease in lateral circulation would decrease the sediment advection from the channel to the West Shoal, which occurred in the wet season and was favorable for the siltation in the West Shoal (Chen et al., 2020b).
Being a microtidal partially mixed estuary with standing tidal wave, the estuarine circulation in HE is stronger during the neap tide than during the spring tide. After analyzing the circulation during spring tide, we found the longitudinal circulation reached a maximum in 2010 when the water depth was the largest. Similar to the phenomenon during the neap tide, the longitudinal circulation was dominated by the increase in the baroclinicity. However, the changes in the lateral circulation were more complicated than that during the neap tide. In addition to the baroclinicity, the change in vertical diffusion caused by the width change also played an important role. The changes in lateral circulation at the upstream section (Sec. B1) were mostly controlled by the changes in the baroclinicity. On the other hand, the changes in lateral circulation at the downstream section (Sec. B2) were mainly controlled by the changes in the vertical diffusion.
In this study, the model used was only driven by river discharge and tides, without considering the effects of winds, waves, sea-level rise, and other upstream flows into the estuary. Future work could incorporate the above factors to improve the model's accuracy. Sea-level rise can increase the total water depth and inundate more intertidal areas. It has an effect similar to that of channel deepening to increase the salt intrusion and estuarine circulation. The river flow will be generally decreased in the PRD due to global warming and northward shift of the climate zone. With a decrease of the river discharge, the salt intrusion will be increased and thus the salinity gradient will be decreased, resulting in a weakened estuarine circulation in the HE. For the salinity at the offshore boundary, we are not certain whether it will be increased or decreased. It is influenced by the rain and evaporation, and the large-scale salt transport in the South China Sea. If it increases, the salinity gradient in the HE will be increased, and the estuarine circulation will therefore be enhanced, and vice versa.
Definitely, the estuary has undergone natural changes in 40+ years, such as the changes in river inflow and offshore boundary conditions. However, as our focus is on the impact of changes in bathymetry on the estuarine circulation, we leave the effect of other factors for future investigation. It should be noted that our model simulations are not used to reproduce exactly the historical evolution but to reveal the underlying dynamics.
This study investigated the morphological evolution of the HE from 1977 to 2010 using ArcGIS and remote sensing. It was noted that the West Channel of the HE disappeared, causing the morphological pattern to change from “two channels and three shoals” gradually to “one channel and two shoals” throughout the years. Due to the reclamation and development of salt marshes along the estuarine banks, the estuary has been experiencing continuous narrowing. Meanwhile, channel dredging has deepened the estuary over the study period. It had been revealed that the sediment transport pattern changes in response to the changes in river discharge and tidal mixing (Gong et al., 2014). Generally, there exists a sediment convergence zone in the middle of the estuary, and the riverine sediment is trapped inside the estuary to form a turbidity maximum. Our results indicate that the intensity of the longitudinal estuarine circulation kept increasing as the estuary width continued to decrease. The trend of the lateral circulation intensity was altered (decreased in Sec. B1 and increased in Sec. B2) when the estuary shallowed (from 1994 to 2003).
The changes in the longitudinal estuarine circulation were dominated by the changes in the baroclinic pressure gradient force and advection. As the estuary was narrowing and deepening, the pressure gradient force and advection term (especially the longitudinal advection term) increased, which increased the longitudinal circulation. The change in lateral circulation intensity was mainly caused by the change of the vertical shear of the longitudinal subtidal flow, the lateral salinity gradient, and the vertical dissipation term. The changes in water depth were the dominant factor affecting lateral circulation intensity. The increase of water depth enhanced the longitudinal circulation and the lateral circulation of the upstream cross section in 2010. The changes in the estuarine circulation have great implications for the sediment transport in the HE, which would be explored in the next step.
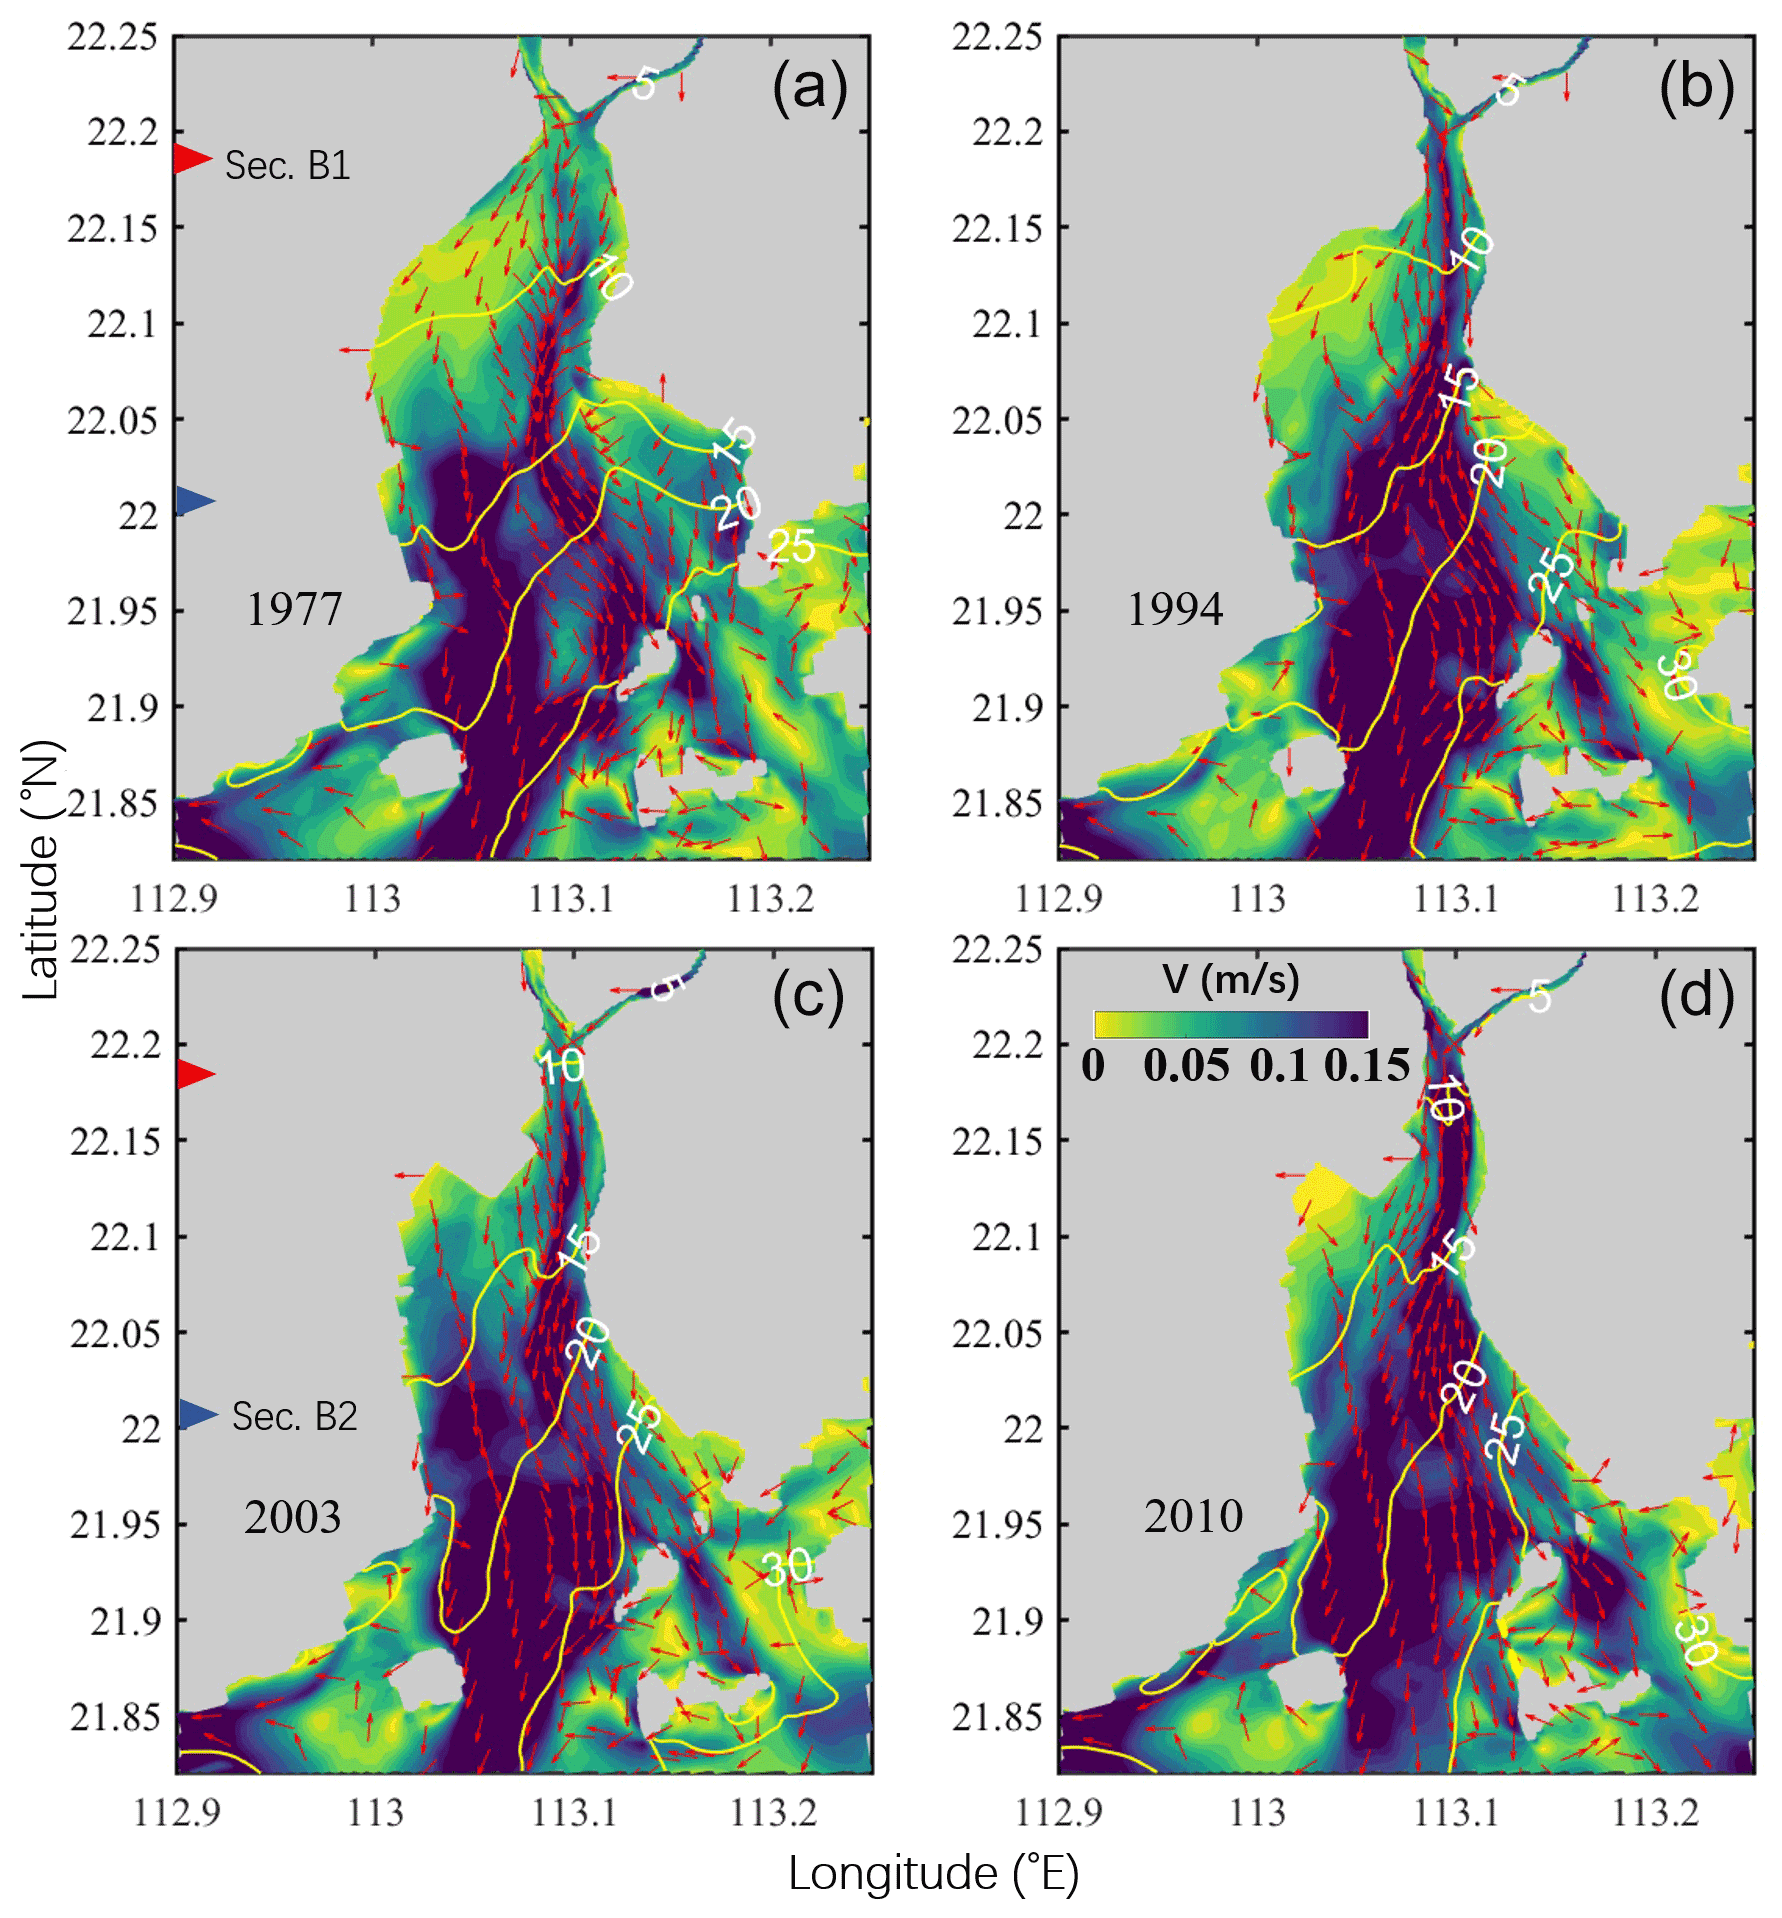
Figure A1Patterns of the tidally averaged horizontal circulation at the surface during neap tide (from 10 March at 00:00 LT to 11 March at 00:00 LT (25 h)) in 1977 (a), 1994 (b), 2003 (c), and 2010 (d). The magnitude of the current is represented by the color shading, while the current direction is shown by the arrows. The salinity is depicted by the contour lines. The red and blue triangles depict the positions of two cross sections (Secs. B1 and B2).
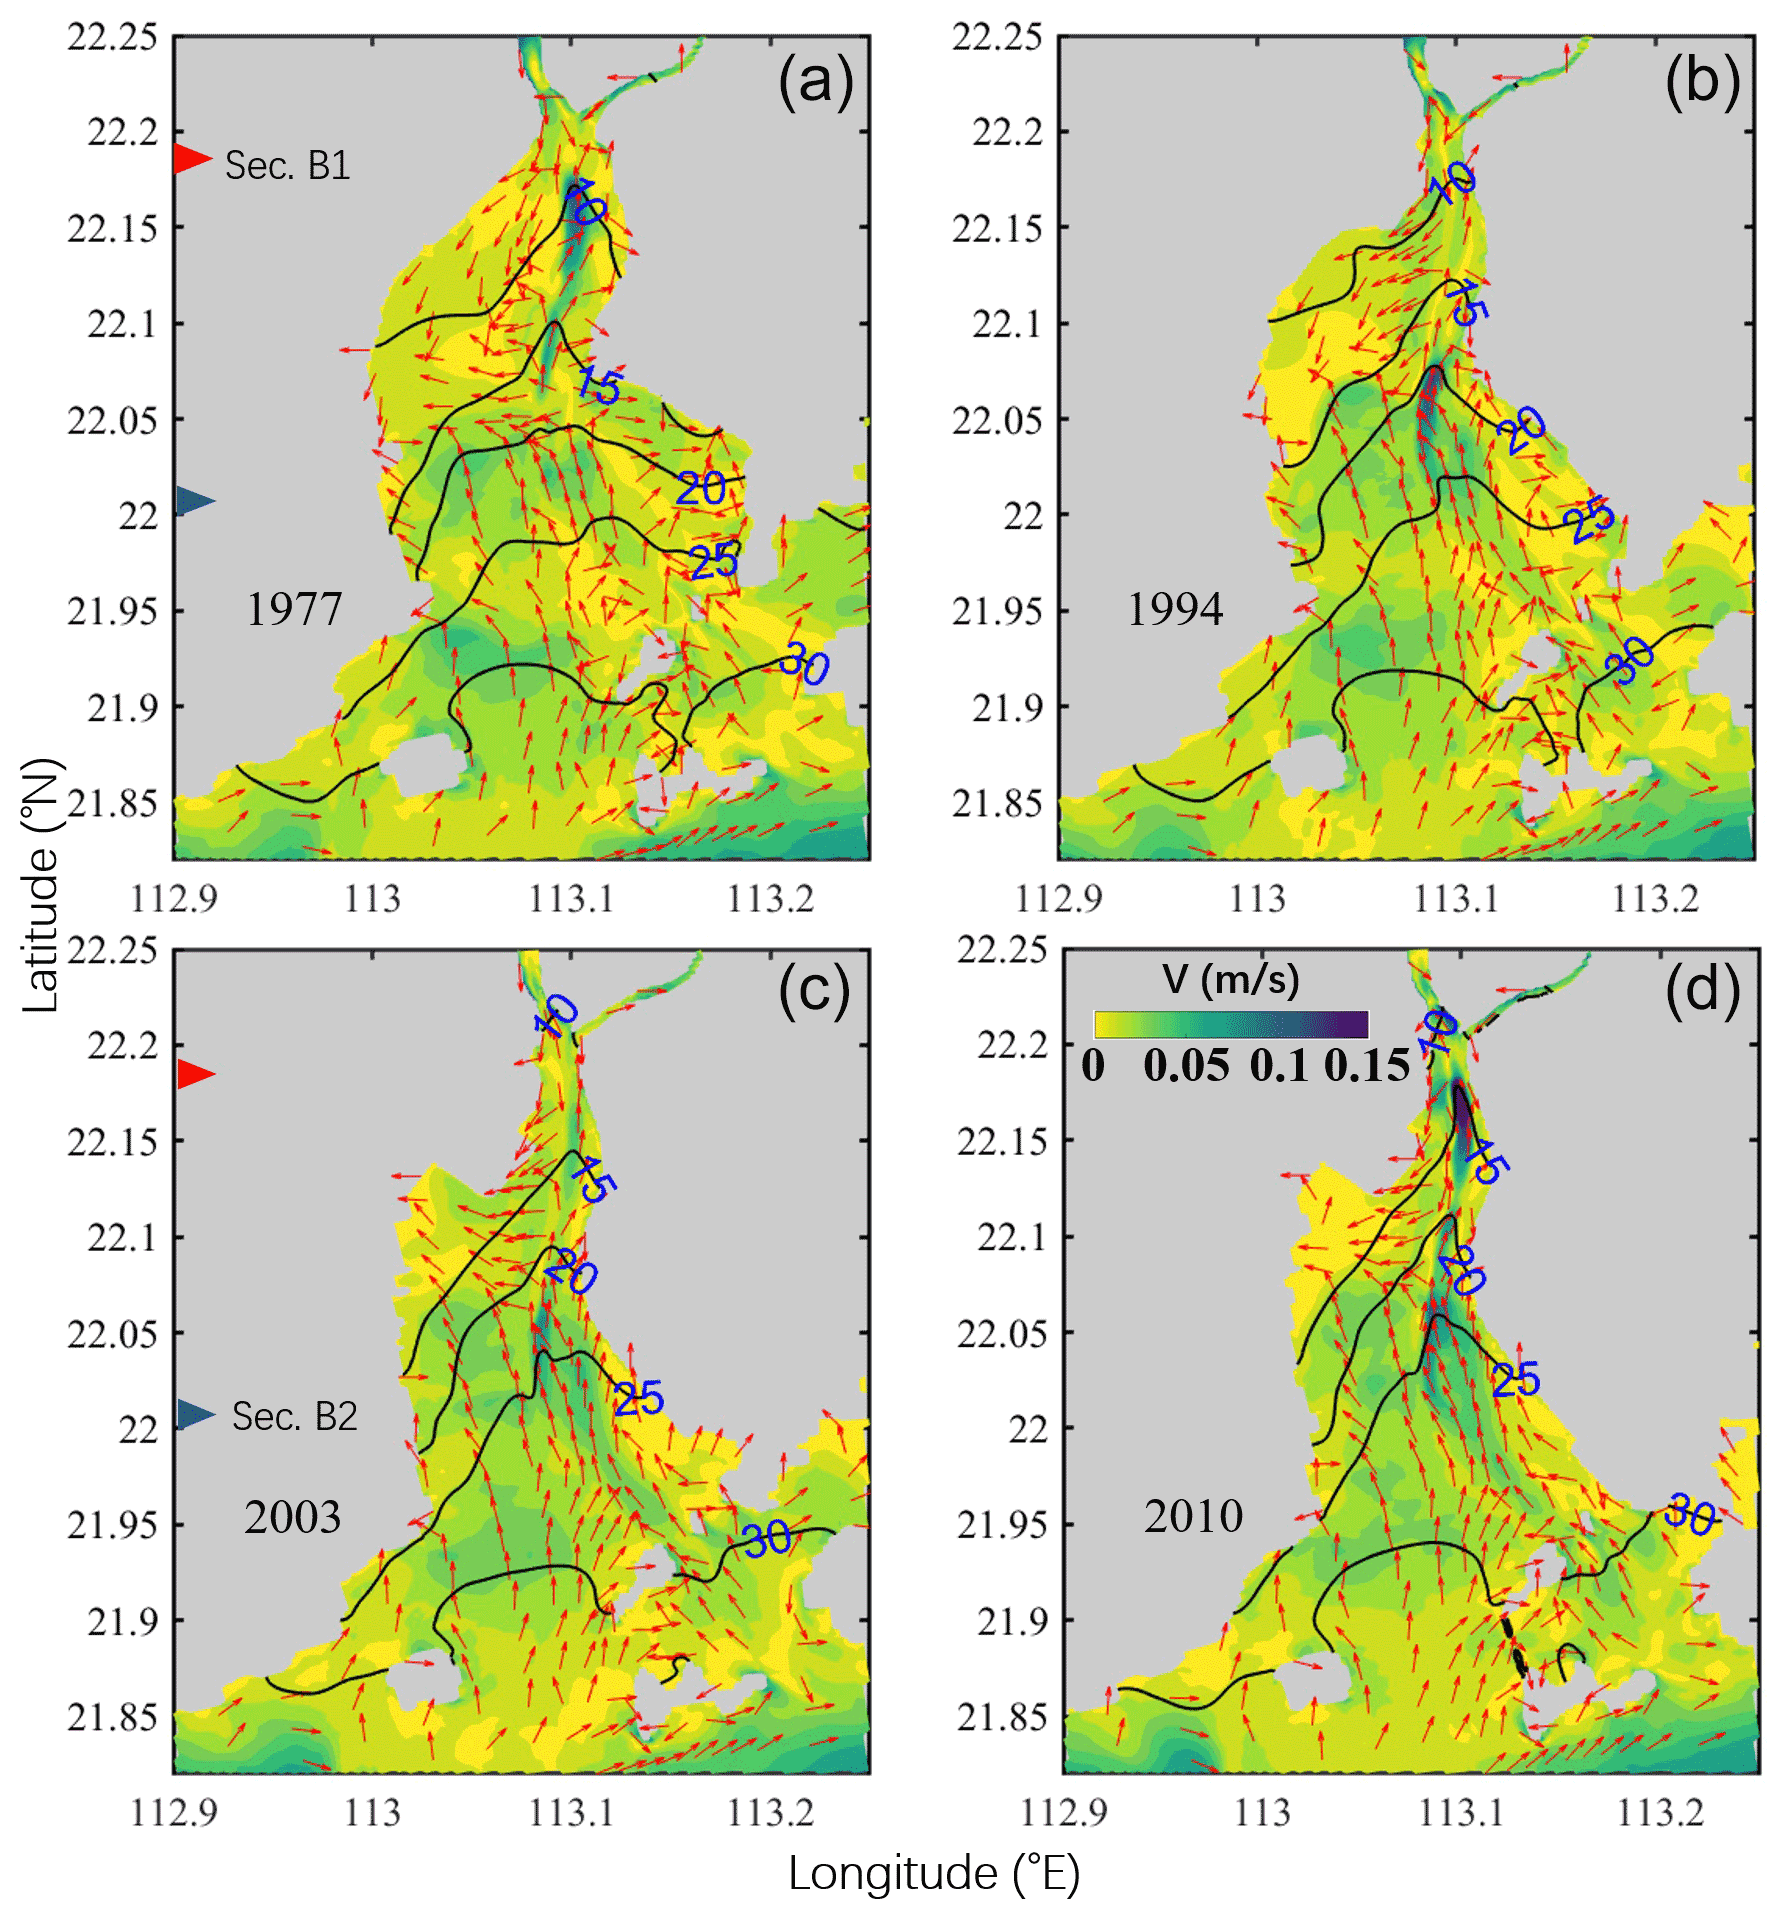
Figure A2Patterns of the tidally averaged horizontal circulation at the bottom during neap tide (from 10 March at 00:00 LT to 11 March at 00:00 LT (25 h)) in 1977 (a), 1994 (b), 2003 (c), and 2010 (d). The magnitude of the current is represented by the color shading, while the current direction is shown by the arrows. The salinity is depicted by the contour lines. The red and blue triangles denote the positions of two cross sections (Secs. B1 and B2).
A total of 142 GB data of 66 images (Table 1) covering the PRD during cloudless days in multiple years (from 1973 to 2018) were downloaded from http://www.gscloud.cn/ (Geospatial Data Cloud, 2021).
RZ was responsible for writing of the original draft and conducting the model runs and analyses. BH was responsible for writing of the review. LZ was responsible for writing of the review. WG was responsible for writing of review and the editing, conceptualization, and funding acquisition. HZ was responsible for visualization and funding acquisition.
The contact author has declared that neither they nor their co-authors have any competing interests.
Publisher's note: Copernicus Publications remains neutral with regard to jurisdictional claims in published maps and institutional affiliations.
We would like to thank the National Aeronautics and Space Administration (NASA) for providing the Landsat remote sensing data. We are very grateful to the graduate students on our team from Sun Yat-sen University for their help in fieldwork and sediment sample analysis at the indoor laboratory.
This research has been supported by the National Natural Science Foundation of China (grant nos. 41506102, 41890851, and 51761135021).
This paper was edited by John M. Huthnance and reviewed by Qian Yu and two anonymous referees.
Ai, B., Zhang, R., Zhang, H., Ma, C. L., and Gu, F. G.: Dynamic process and artificial mechanism of coastline change in the Pearl River Estuary, Regional Studies in Marine Science, 30, 100715, https://doi.org/10.1016/j.rsma.2019.100715, 2019.
Amin, M.: On perturbations of harmonic constants in the Thames Estuary, Geophys. J. Int., 73, 587–603, 1983.
Becherer, J., Stacey, M. T., Umlauf, L., and Burchard, H.: Lateral circulation generates flood tide stratification and estuarine exchange flow in a curved tidal inlet, J. Phys. Oceanogr., 45, 638–656, 2015.
Burchard, H., Hetland, R. D., Schulz, E., and Schuttelaars, H. M.: Drivers of Residual Estuarine Circulation in Tidally Energetic Estuaries: Straight and Irrotational Channels with Parabolic Cross Section, J. Phys. Oceanogr., 41, 548–570, 2010.
Burchard, H., Schulz, E., and Schuttelaars, H. M.: Impact of estuarine convergence on residual circulation in tidally energetic estuaries and inlets, Geophys. Res. Lett., 41, 913–919, 2014.
Chant, R. J., Sommerfield, C. K., and Talke, S. A.: Impact of channel deepening on tidal and gravitational circulation in a highly engineered estuarine basin, Estuar. Coasts, 41, 1587–1600, 2018.
Chen, L. H., Gong, W. P., Scully, M. E., Zhang, H., Cheng, W. C., and Li, W.: Axial wind effects on stratification and longitudinal sediment transport in a convergent estuary during wet season, J. Geophys. Res.-Oceans, 125, e2019JC015254, https://doi.org/10.1029/2019JC015254, 2020a.
Chen, L. H., Gong, W. P., Zhang, H., Zhu, L., and Cheng, W. C.: Lateral circulation and associated sediment transport in a convergent estuary, J. Geophys. Res.-Oceans, 125, e2019JC015926, https://doi.org/10.1029/2019JC015926, 2020b.
Chen, S. N. and Sanford, L. P.: Axial Wind Effects on Stratification and Longitudinal Salt Transport in an Idealized, Partially Mixed Estuary, J. Phys. Oceanogr., 39, 1905–1920, https://doi.org/10.1175/2009JPO4016.1, 2009.
Chen, S. N., Geyer, W. R., Ralston, D. K., and Lerczak, J. A.: Estuarine Exchange Flow Quantified with Isohaline Coordinates: Contrasting Long and Short Estuaries, J. Phys. Oceanogr., 42, 748–763, 2012.
Cheng, P.: Decomposition of Residual Circulation in Estuaries, J. Atmos. Ocean. Tech., 31, 698–713, 2013.
Cheng, P. and Valle-Levinson, A.: Influence of lateral advection on residual currents in microtidal estuaries, J. Phys. Oceanogr., 39, 3177–3190, 2009.
Cheng, P., Valle-Levinson, A., and De Swart, H. E.: Residual currents induced by asymmetric tidal mixing in weakly stratified narrow estuaries, J. Phys. Oceanogr., 40, 2135–2147, 2010.
Chernetsky, A. S., Schuttelaars, H. M., and Talke, S. A.: The Effect of Tidal Asymmetry and Temporal Settling Lag on Sediment Trapping in Tidal Estuaries, Ocean Dynam., 60, 1219–1241, 2010.
Dyer, K. R.: Lateral circulation effects in estuaries, National Academy of Sciences, Washington DC, 22–29, 1977.
Eidam, E. F., Sutherland, D. A., Ralston, D. K., Dye, B., Conroy, T., Schmitt, J., Ruggiero, P., and Wood, J.: Impacts of 150 Years of Shoreline and Bathymetric Change in the Coos Estuary, Oregon, USA, Estuar. Coasts, 1–19, https://doi.org/10.1007/s12237-020-00732-1, 2020.
Fischer, H. B.: Mixing and Dispersion in Estuaries, Annu. Rev. Fluid Mech., 8, 107–133, https://doi.org/10.1146/annurev.fl.08.010176.000543, 1976.
Geospatial Data Cloud: Remote sensing images, Landsat, Geospatial Data Cloud [data set], http://www.gscloud.cn/, last access: 4 November 2021.
Geyer, W. R.: Estuarine salinity structure and circulation, in: Contemporary issues in estuarine, edited by: Arnoldo, V. L., Cambridge University Press, 12–26, https://doi.org/10.1017/CBO9780511676567.003, 2010.
Geyer, W. R. and Maccready, P.: The Estuarine Circulation, Annu. Rev. Fluid Mech., 46, 175–197, 2014.
Geyer, W. R. and Nepf, H.: Tidal pumping of salt in a moderately stratified estuary, Coast. Estuar. Stud., 53, 213–226, 1996.
Gong, W. P., Liu, H., Ren, J., and Yu, H. B.: The study of tidal propagation in the Huangmaohai estuary and its underlying mechanisms, Acta Oceanol. Sin., 34, 41–54, 2012.
Gong, W. P., Jia, L. W., Shen, J., and Liu, J. T.: Sediment transport in response to changes in river discharge and tidal mixing in a funnel-shaped micro-tidal estuary, Cont. Shelf Res., 76, 89–107, 2014.
Huang, T.: Study on abnormal changes of tidal range in the huangmaohai estuary, MS thesis, Guangdong Water Resources and Hydropower, Guangzhou, China, 2011.
Jia, L. W., Luo, J., and Ren, J.: The analysis of the evolution of a sand bar and its formation in the Huangmao Bay in the Pearl River Delta, Acta Oceanol. Sin., 34, 120–127, 2012.
Kjerfve, B., Stevenson, L. H., Proehl, J. A., Chrzanowski, T. H., and Kitchens, W. M.: Estimation of material fluxes in an estuarine cross section: A critical analysis of spatial measurement density and errors 1, Limnol. Oceanogr., 26, 325–335, 1981.
Lacy, J. R., Stacey, M. T., Burau, J. R., and Monismith, S. G.: Interaction of lateral baroclinic forcing and turbulence in an estuary, J. Geophys. Res.-Oceans, 108, 1–34, https://doi.org/10.1029/2002JC001392, 2003.
Lerczak, J. A. and Rockwell Geyer, W.: Modeling the Lateral Circulation in Straight, Stratified Estuaries*, J. Phys. Oceanogr., 34, 1410–1428, 2004.
Lesser, G. R., Roelvink, J. V., Van Kester, J., and Stelling, G. S.: Development and validation of a three-dimensional morphological model, Coast. Eng., 51, 883–915, 2004.
Li, C. Y. and O'Donnell, J.: Tidally driven residual circulation in shallow estuaries with lateral depth variation, J. Geophys. Res.-Oceans, 102, 27915–27929, 1997.
Li, M., Cheng, P., Chant, R. J., Valle-Levinson, A., and Arnott, K.: Analysis of vortex dynamics of lateral circulation in a straight tidal estuary, J. Phys. Oceanogr., 44, 2779–2795, 2014.
Li, W., Shi, J. Z., Pu, X., and Hu, G. D.: Circulation within curved channel of the north passage in the changjiang river estuary: a vorticity approach, Oceanologia et Limnologia Sinica, 48, 682–694, 2017.
Li, Y. B.: Numerical simulation of the formation and evolution of the geomorphic characteristics of Huangmao Sea, MS thesis, Dalian University of Technology, Dalian, China, 2019.
Luo, J.: Cause Analysis of Morphological evolution of Huangmao sea Estuary in the Decade to Century-scale, MS thesis, Sun Yat-sen university, Guangzhou, China, 2010.
Pritchard, D. W.: Salinity distribution and circulation in the Chesapeake Bay estuarine system. 1, Mar. Res., 11, 106–123, 1952.
Pritchard, D. W.: The dynamic structure of a coastal plain estuary, J. Marine Res., 15, 33–42, 1956.
Ralston, D. K. and Geyer, W. R.: Response to channel deepening of the salinity intrusion, estuarine circulation, and stratification in an urbanized estuary, J. Geophys. Res.-Oceans, 124, 4784–4802, 2019.
Salles, P., Valle-Levinson, A., Sottolichio, A., and Senechal, N.: Wind-driven modifications to the residual circulation in an ebb-tidal delta: Arcachon Lagoon, Southwestern France, J. Geophys. Res.-Oceans, 120, 728–740, 2015.
Schulz, E., Schuttelaars, H. M., Gräwe, U., and Burchard, H.: Impact of the depth-to-width ratio of periodically stratified tidal channels on the estuarine circulation, J. Phys. Oceanogr., 45, 411804097, https://doi.org/10.1175/JPO-D-14-0084.1, 2015.
Scully, M., Friedrichs, C., and Brubaker, J.: Control of estuarine stratification and mixing by wind-induced straining of the estuarine density field, Estuaries, 28, 321–326, https://doi.org/10.1007/BF02693915, 2005.
Scully, M. E., Geyer, W. R., and Lerczak, J. A.: The Influence of Lateral Advection on the Residual Estuarine Circulation: A Numerical Modeling Study of the Hudson River Estuary, J. Phys. Oceanogr., 39, 107–124, https://doi.org/10.1175/2008JPO3952.1, 2009.
Simpson, J. H., Brown, J., Matthews, J., and Allen, G.: Tidal straining, density currents, and stirring in the control of estuarine stratification, Estuaries, 13, 125–132, https://doi.org/10.2307/1351581, 1990.
Van Maren, D. S., van Kessel, T., Cronin, K., and Sittoni, L.: The impact of channel deepening and dredging on estuarine sediment concentration, Cont. Shelf Res., 95, 1–14, 2015.
Wang, T., Geyer, W. R., Engel, P., Jiang, W. S., and Feng, S. Z.: Mechanisms of Tidal Oscillatory Salt Transport in a Partially Stratified Estuary, J. Phys. Oceanogr., 45, 2773–2789, 2015.
Waterhouse, A., Tutak, B., Valle-Levinson, A., and Sheng, Y.: Influence of Two Tropical Storms on the Residual Flow in a Subtropical Tidal Inlet, Estuar. Coasts, 36, 1037–1053, https://doi.org/10.1007/s12237-013-9606-3, 2013.
Willmott, C. J.: On the validation of models, Phys. Geogr., 2, 184–194, 1981.
Wilson, R. and Filadelfo, R.: Subtidal Current Variability in the Lower Hudson Estuary, Physics of Shallow Estuaries and Bays, 16, 131–142, https://doi.org/10.1029/LN016p0132, 1986.
Winterwerp, J. C.: Fine sediment transport by tidal asymmetry in the high-concentrated Ems River: indications for a regime shift in response to channel deepening, Ocean Dynam., 61, 203–215, 2011.
Zhang, R., Chen, L. H., Liu, S. S., Zhang, H., and Lin, G. Y.: Shoreline evolution in an embayed beach adjacent to tidal inlet: The impact of anthropogenic activities, Geomorphology, 346, 106856, https://doi.org/10.1016/j.geomorph.2019.106856, 2019.
Zhu, J., Weisberg, R. H., Zheng, L. Y., and Han, S. Z.: Influences of Channel Deepening and Widening on the Tidal and Nontidal Circulations of Tampa Bay, Estuar. Coasts, 38, 132–150, 2015.
Zhu, L.: Alteration of estuarine circulation under the inference of morphological evolution, PhD thesis, East China Normal University, Shanghai, China, 2018.