the Creative Commons Attribution 4.0 License.
the Creative Commons Attribution 4.0 License.
 | 20 Jul 2022
Mechanism of generation and propagation characteristics of coastal trapped waves in the Black Sea
Müjdat Aydın
Şükrü Turan Beşiktepe
Coastal trapped waves (CTW) are a major mechanism to distribute energy from the atmosphere in the ocean and play a significant role in large-scale, low-frequency sea-level and current variability in continental shelf and slope areas. Despite their significance for coastal dynamics, observational evidence of the influence of CTWs on the large-scale circulation is rather limited. In this study, mode-1 coastal trapped waves that were captured at sea-level stations at five locations along the southern coast of the Black Sea are examined together with sea surface height reanalysis from the Copernicus Marine Service to reveal their generation mechanisms and role in the coastal dynamics. It is found that the CTWs were formed when water accumulated on the western shelf after gale-force alongshore winds in the western Black Sea. Excited waves propagate along the Black Sea coast from west to east with a speed of 2.3–2.6 m s−1 and transport the atmospherically induced energy all over the Black Sea. The coastal current generated by the CTWs (on the order of 1 m s−1 in magnitude) and the main Black Sea current merge and flow eastward as a single structure, resulting in intensification of the Black Sea circulation during winter. Hence, we present evidence of the influence of CTWs on the large-scale circulation.
- Article
(11622 KB) - Full-text XML
- BibTeX
- EndNote


It is well known that the margins of the ocean act as an efficient waveguide for the propagation of CTWs from the region of their excitation. Typically, mode-1 CTWs have their maximum amplitude on the shore, and their amplitude decays exponentially offshore with the scale of the Rossby radius of deformation. They can freely propagate very long distances from their formation area with the coast on their right (left) in the Northern (Southern) Hemisphere, doing so with periods ranging from a few days to weeks and without changing their character. Hence, CTWs are a major mechanism to distribute energy from the atmosphere in the ocean. It was shown theoretically and observationally that CTWs play a significant role in large-scale, low-frequency sea-level and current variability in continental shelf and slope areas (Brink, 1991; Huthnance, 1995). Although CTWs are produced by different mechanisms, those that are in Kelvin mode are formed by winds blowing parallel to the coast, which cause the accumulation of water at the shore through Ekman transport (Adams and Buchwald, 1969; Gill and Schumann, 1974). Observational evidence of CTWs forced by longshore wind has been documented all around the margins of the ocean since they were first observed in the 1960s (Shoji, 1961; Hamon, 1962). Examples of observations of CTWs at sub-inertial frequencies induced by storms include those from the west coast of South America (Zamudio, 2002; Romea and Smith, 1983), the west coast of North America (Beckenbach and Washburn, 2004), the coast of South Africa (Schumann and Brink, 1990), the Japanese coast (Kitade, 2000; Igeta et al., 2007), around Australia and New Zealand (Maiwa et al., 2010; Stanton, 1995), the west coast of India (Amol et al., 2012), the East China Sea (Yin et al., 2014), and so on. It has been shown using these observations that CTWs typically have 8–16 d periods, 2–4 m s−1 phase speeds, and O(10 cm) amplitudes on the coast.
Despite the significant role of low-frequency CTWs in coastal dynamics, observational studies on CTWs in the Black Sea are limited in that they are confined to the northern coast (Fig. 1). Besides, those studies were based on short-duration measurements carried out during spring–summer periods (Ivanov et al., 2015). To our knowledge, the generation mechanism of mode-1 CTWs propagating along the coast of the Black Sea and their role in the dynamics of the large-scale circulation have not been studied.
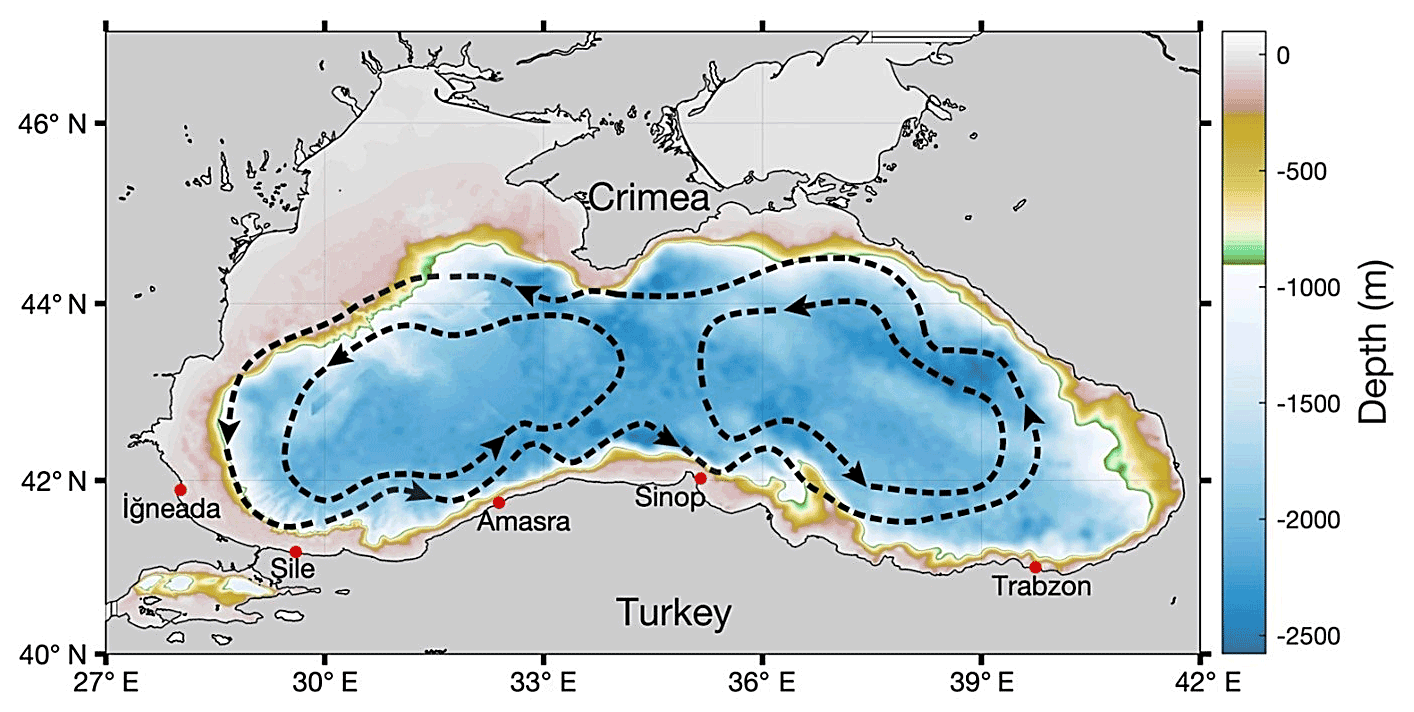
Figure 1Locations of tide gauge stations and the bathymetry (m) of the Black Sea with an overlaid schematic of the circulation (after Korotaev et al., 2003).
Ivanov and Bagaiev (2014) used a 3-D regional model of this area to investigate a wide range of oscillations in sea level and temperature. Ivanov and Bagaiev (2014) noted that oscillations with 5, 10.8, and 15 d periods in the sea level at the coast have statistically significant spectral energy. They explained these oscillations as Kelvin waves or a response of the shelf water to synoptic winds. Yankovsky and Chapman (1995, 1997) studied the scattering of these Kelvin waves into higher wave modes at the southernmost tip of the Crimean Peninsula using numerical models.
Basin-scale modelling studies of the Black Sea current system have also shown the presence of coastal trapped waves and their possible effects on the current. Rachev and Stanev (1997) performed numerical experiments using a primitive equation model and found that a general cyclonic circulation in the Black Sea can be formed, even in conditions of weak cyclonic wind vorticity, due to the propagation of coastal trapped waves. Stanev and Beckers (1999) studied basin-wide barotropic and baroclinic oscillations in the Black Sea using a three-dimensional primitive equation model. At low frequencies, they found energetic oscillations in temperature with periods of 11.7 and 14.7 d in the southeastern part. Staneva et al. (2001) detected eastward-propagating CTWs along the southern boundary in modelling results.
The Black Sea is a deep basin shaped like a bent ellipse. Its major axis extends 1180 km in the east–west direction and its minor axis extends 264 km north–south. The shelf in the western part of the sea constitutes approximately 20 % of the whole sea. The width of the shelf gradually narrows toward the southwestern corner of the basin and terminates to the east at 31∘ E. on the southern boundary. The coastal regions of the rest of the basin have a narrow continental shelf (approximately 20 km) connected to a deep abyss with a steep slope.
The large-scale circulation of the Black Sea is cyclonic, with a strong current over the continental slope around the basin (Fig. 1). The well-defined Black Sea cyclonic boundary current (Rim Current) flows over the continental slope with a mean velocity of 30 cm s−1 (Oğuz and Beşiktepe, 1999). This Black Sea boundary current intensifies during winter due to strong atmospheric forcing (Stanev et al., 2000; Korotaev et al., 2003). Classically, cyclonic wind patterns (positive wind stress curl) and the inflows of freshwater that originate from the large rivers that flow into the northwestern part of the Black Sea are postulated as the main forces for cyclonic surface circulation. The Rim Current, which flows cyclonically, is expected to be modified by long waves propagating in the same direction.
The objective of this study is firstly to provide observational evidence for CTWs in the Black Sea using a series of sea level data along the southern coast, and then to identify their generation mechanism and demonstrate their impact on the Rim Current.
The paper is structured as follows: the observational data set and Copernicus Marine Environment Monitoring Services (CMEMS) reanalysis products used in this study are described in Sect. 2. Section 3 introduces the identification of CTWs from sea level records along the Turkish coast. In Sect. 4, generation mechanisms of the observed CTWs are identified, and impacts of the CTWs on the coastal current are evaluated in Sect. 5 using CMEMS reanalysis products.
In situ sea-level data were obtained from the Turkish National Sea Level Monitoring System (TUDES) operated by the Turkish General Directorate of Mapping along the Black Sea coast of Turkey. There are five stations along the Black Sea coast of Turkey: İğneada, Şile, Amasra, Sinop, and Trabzon, respectively, from west to east (Fig. 1). The data were collected at 15 min intervals at local datum. The raw data were processed to remove outliers, and then cleaned data were binned into hourly sea levels. Afterwards, the data were smoothed by robust linear regression using the MATLAB smoothdata function with the rlowess option.
Sea-level and surface currents from the Black Sea Reanalysis of Physical Fields (BS-Currents) from the Copernicus Marine Environment Monitoring Service (http://marine.copernicus.eu, last access: 17 July 2022) were used to reveal the spatial extent of the observed CTWs and the role of the CTWs in the Rim Current. The model used in CMEMS is based on the Nucleus for European Modelling of the Ocean (NEMO, v3.4) with a horizontal grid resolution of ∘ zonally and ∘ meridionally (ca. 3 km) and 31 unevenly spaced vertical levels. The observations assimilated in BS-Currents using variational assimilation include in situ profiles, along-track sea level anomalies, and gridded sea surface temperatures provided by Copernicus' Thematic Data Assembly Centers (TACs; Lima et al., 2020).
Hourly wind data were obtained from the Turkish State Meteorological Service in proximity to sea level stations. Wind fields were also provided by the Copernicus Marine Environment Monitoring Services. They were estimated from ASCAT and OSCAT scatterometer retrievals and from ECMWF operational wind analysis with a spatial resolution of 0.25∘ and a temporal resolution of 6 h, and were available for synoptic times of 00:00, 06:00, 12:00, and 18:00 (Bentamy and Fillon, 2012).
Because the amplitude of mode-1 CTWs is greatest at the coast, these waves can be inferred from coastal sea level measurements. The sea levels obtained between January 2012 and January 2017 from the stations of the TUDES network in the Black Sea after the mean and trend have been removed are shown in Fig. 2. Sea levels at all stations synchronously vary over different timescales ranging from a few days (meteorological scale) to seasonally and annually due to different physical processes acting on different timescales. Changes in sea level in the Black Sea show an obvious seasonal cycle; the highest sea level occurs between spring and summer, while the lowest is seen in fall. This seasonal cycle is in accordance with the seasonal change in freshwater entering the Black Sea. Increasing river inflows increase the sea level of the Black Sea in the spring, and the lowest sea level occurs in autumn, when river flows are at their minima. The outflow from the Black Sea is controlled by the flow through the Turkish Straits, and changes in river influxes can be seen in the sea level. Moreover, interannual variability of the sea level is also evident, which can be attributed to nonseasonal changes in freshwater influxes (Volkov and Landerer, 2015). In addition to these variations on long time scales, energetic variations in sea level at shorter than monthly timescales are visible. These energetic events, which are of interest in this study, can be attributed to atmospheric forcing, as will be demonstrated in Sect. 4.
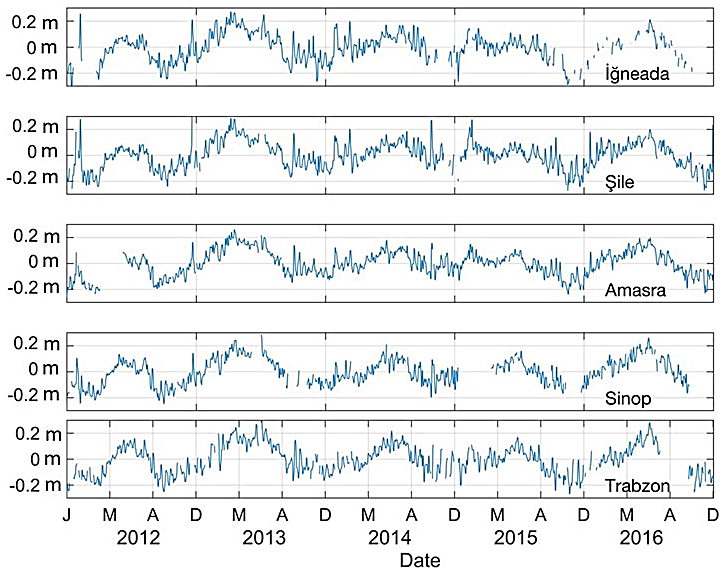
Figure 2Time series of hourly sea level in meters from İğneada, Şile, Amasra, Sinop, and Trabzon from 2012 to 2017. The data have been smoothed using the robust linear regression method of the MATLAB smoothdata function with the rlowess option.
To detect the dominant frequencies of the variability in the sea-level time series, variance-preserving spectra of sea levels were calculated for all stations (Fig. 3). Spectral analysis using the Welch method was conducted on the hourly binned sea-level data.
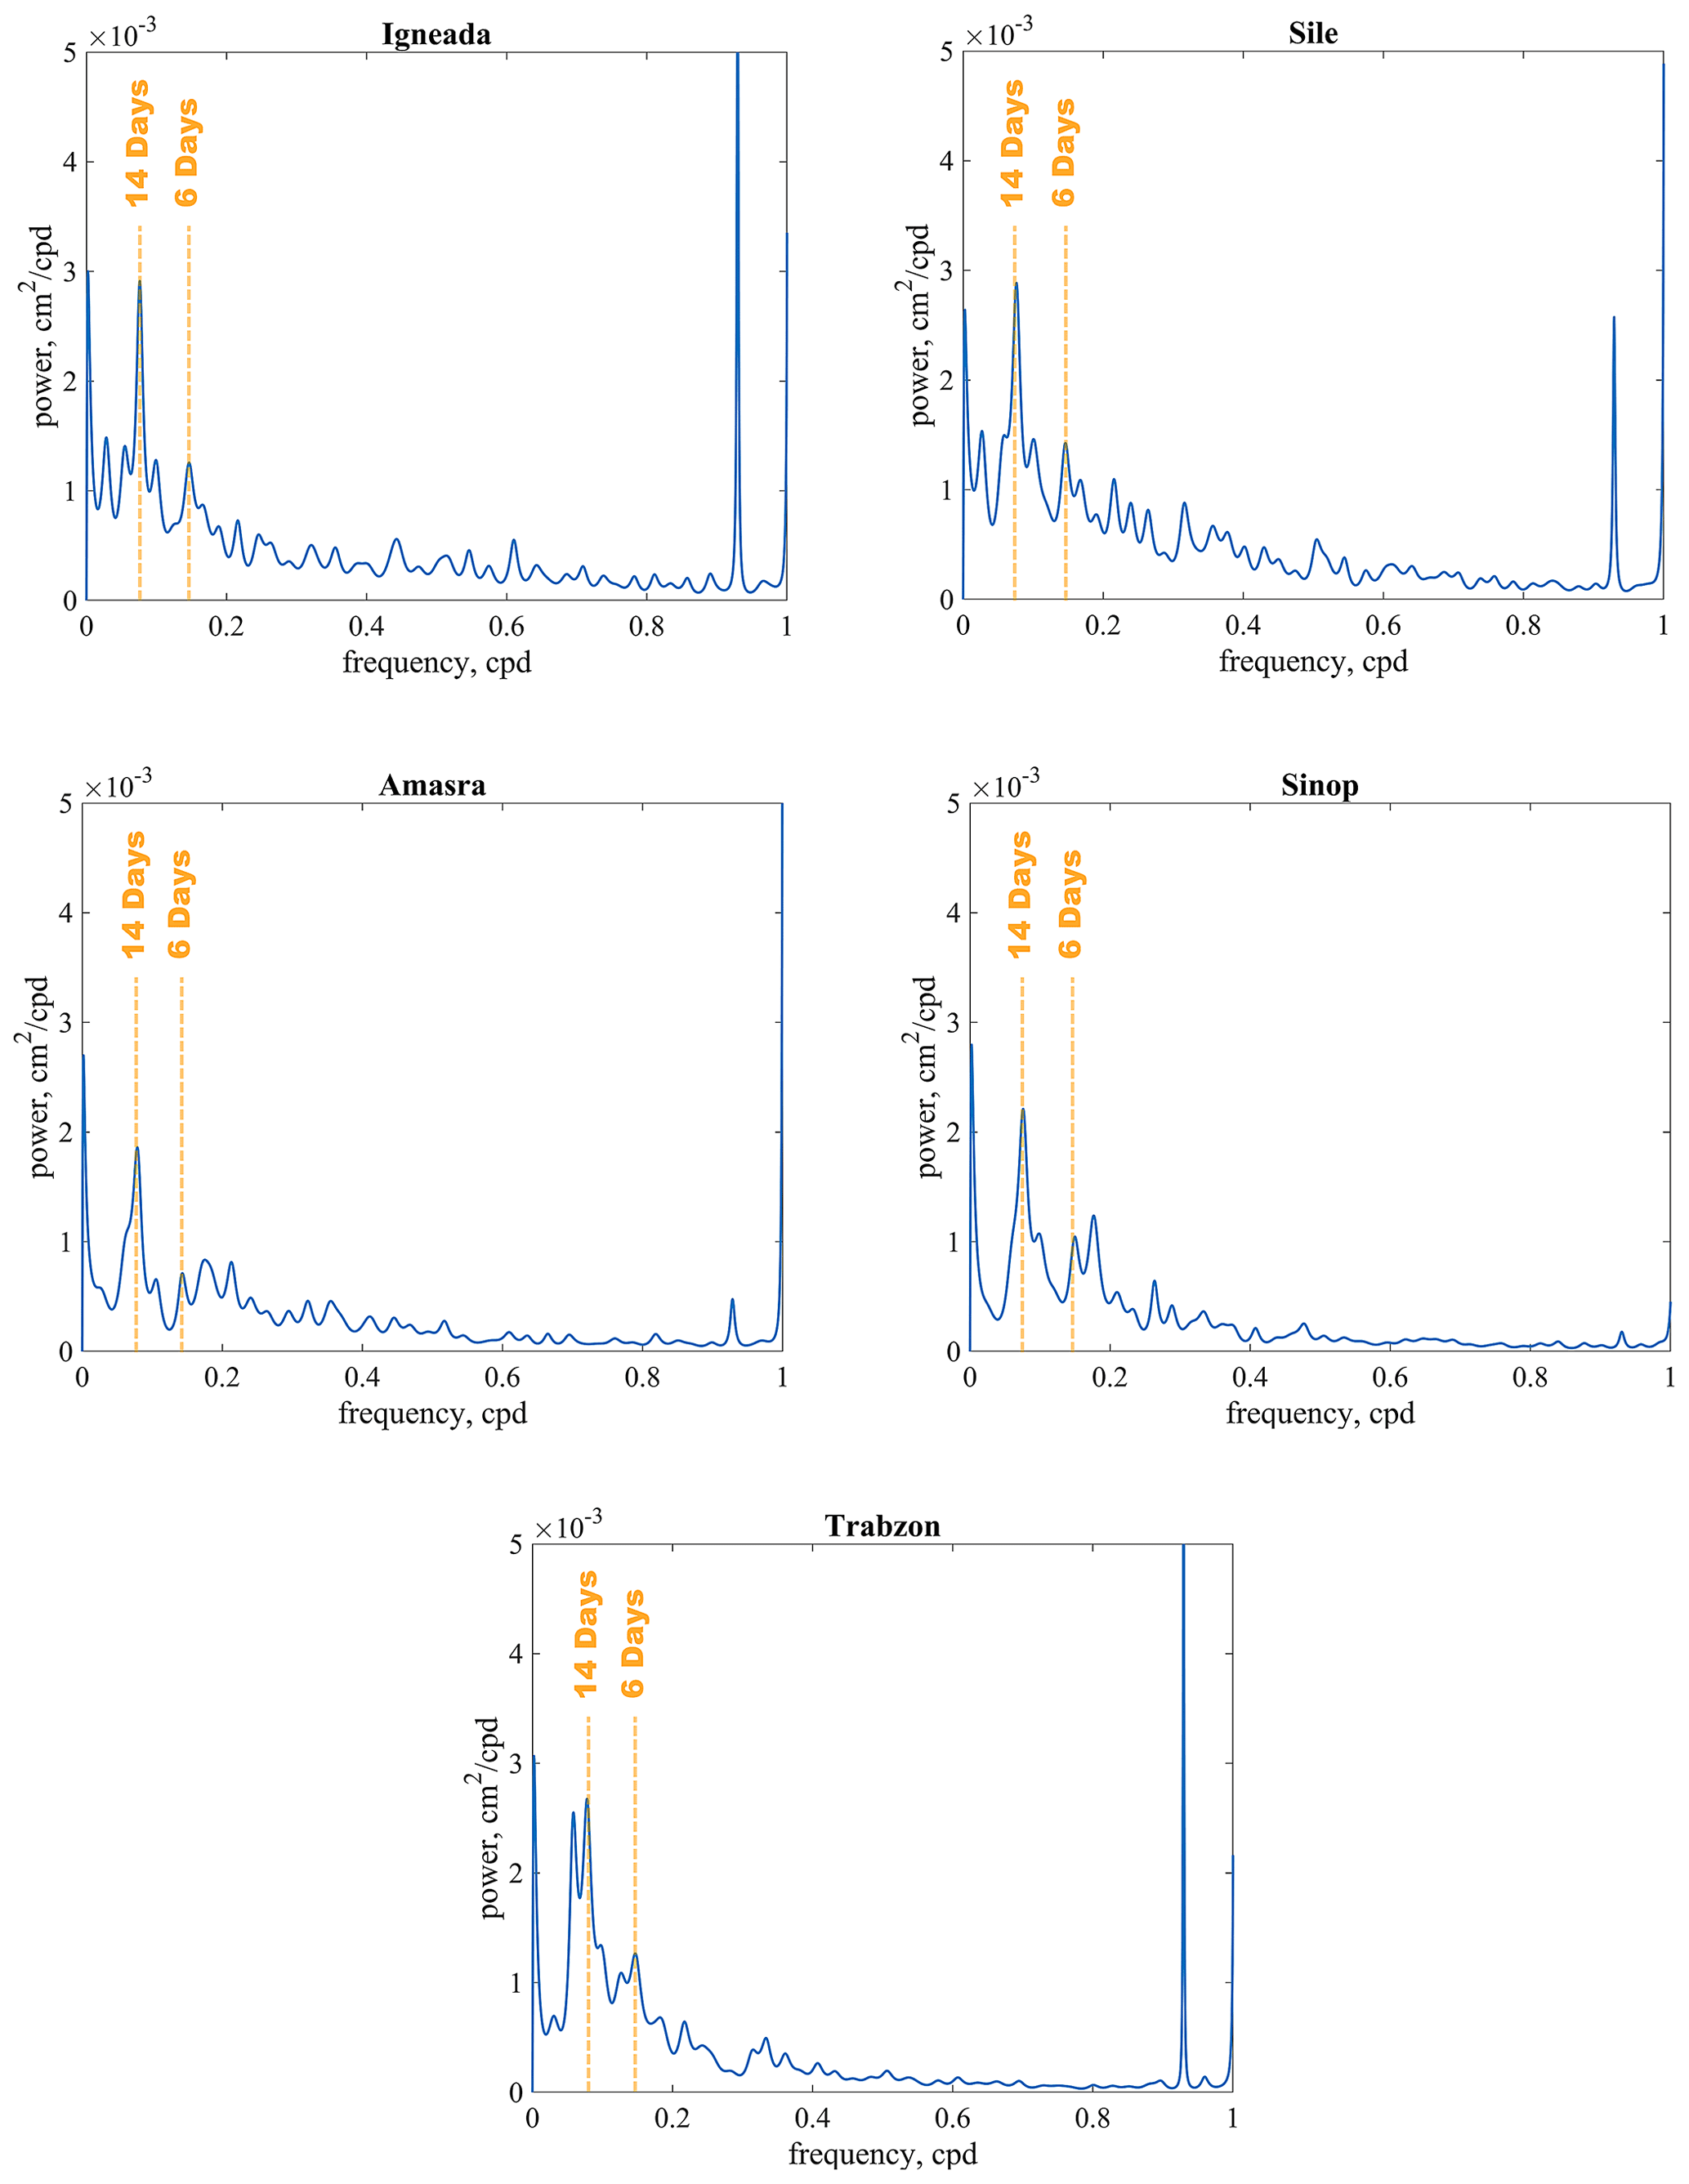
Figure 3Variance-preserving spectra of the sea levels for İğneada, Şile, Amasra, Sinop, and Trabzon; frequency is in cycles per day (cpd).
Although tidal amplitudes are small in the Black Sea, diurnal and semidiurnal (not shown in this figure) tidal frequencies were found to be evident in sea level spectra at all stations. As we move to lower frequencies, i.e. longer periods, clear peaks in the low-frequency region (0.07–0.16 cpd or periods of 5–14 d) of the spectrum are visible. A sharp peak occurs in low-frequency spectra at 14.2 d (0.07 cpd), followed by 5–6 d (0.15 to 0.19 cpd). These values are in good agreement with numerical calculations of wave properties in the Black Sea (Stanev and Beckers, 1999; Ivanov and Bagaiev, 2014; Ivanov et al., 2015). These numerical modelling studies have shown that oscillations with a period of 14.7 d have the maximum energy and can occurr as a response of the basin to synoptic wind forcing. It has also been shown that these oscillations have properties of coastal trapped waves in mode 1.
The spectral analysis results given above reveal that periods of 5–15 d were predominant in the sea-level time series at all stations in the southern Black Sea. The spectral analysis assumes that processes are stationary in time and hence does not give information on the nonstationary parts of the signal. However, due to the seasonal variation in atmospheric forcing, nonstationarity in sea level changes should be expected, particularly in the weather band. To identify the time-dependent characteristics of sea level oscillations, we employed wavelet analysis which expands time series into time-frequency space. In this study, the continuous wavelet transform is based on the Morlet wavelet function applied to the sea level using the wavelet toolbox (MATLAB) developed by Grinsted et al. (2004). The results are presented in Fig. 4.
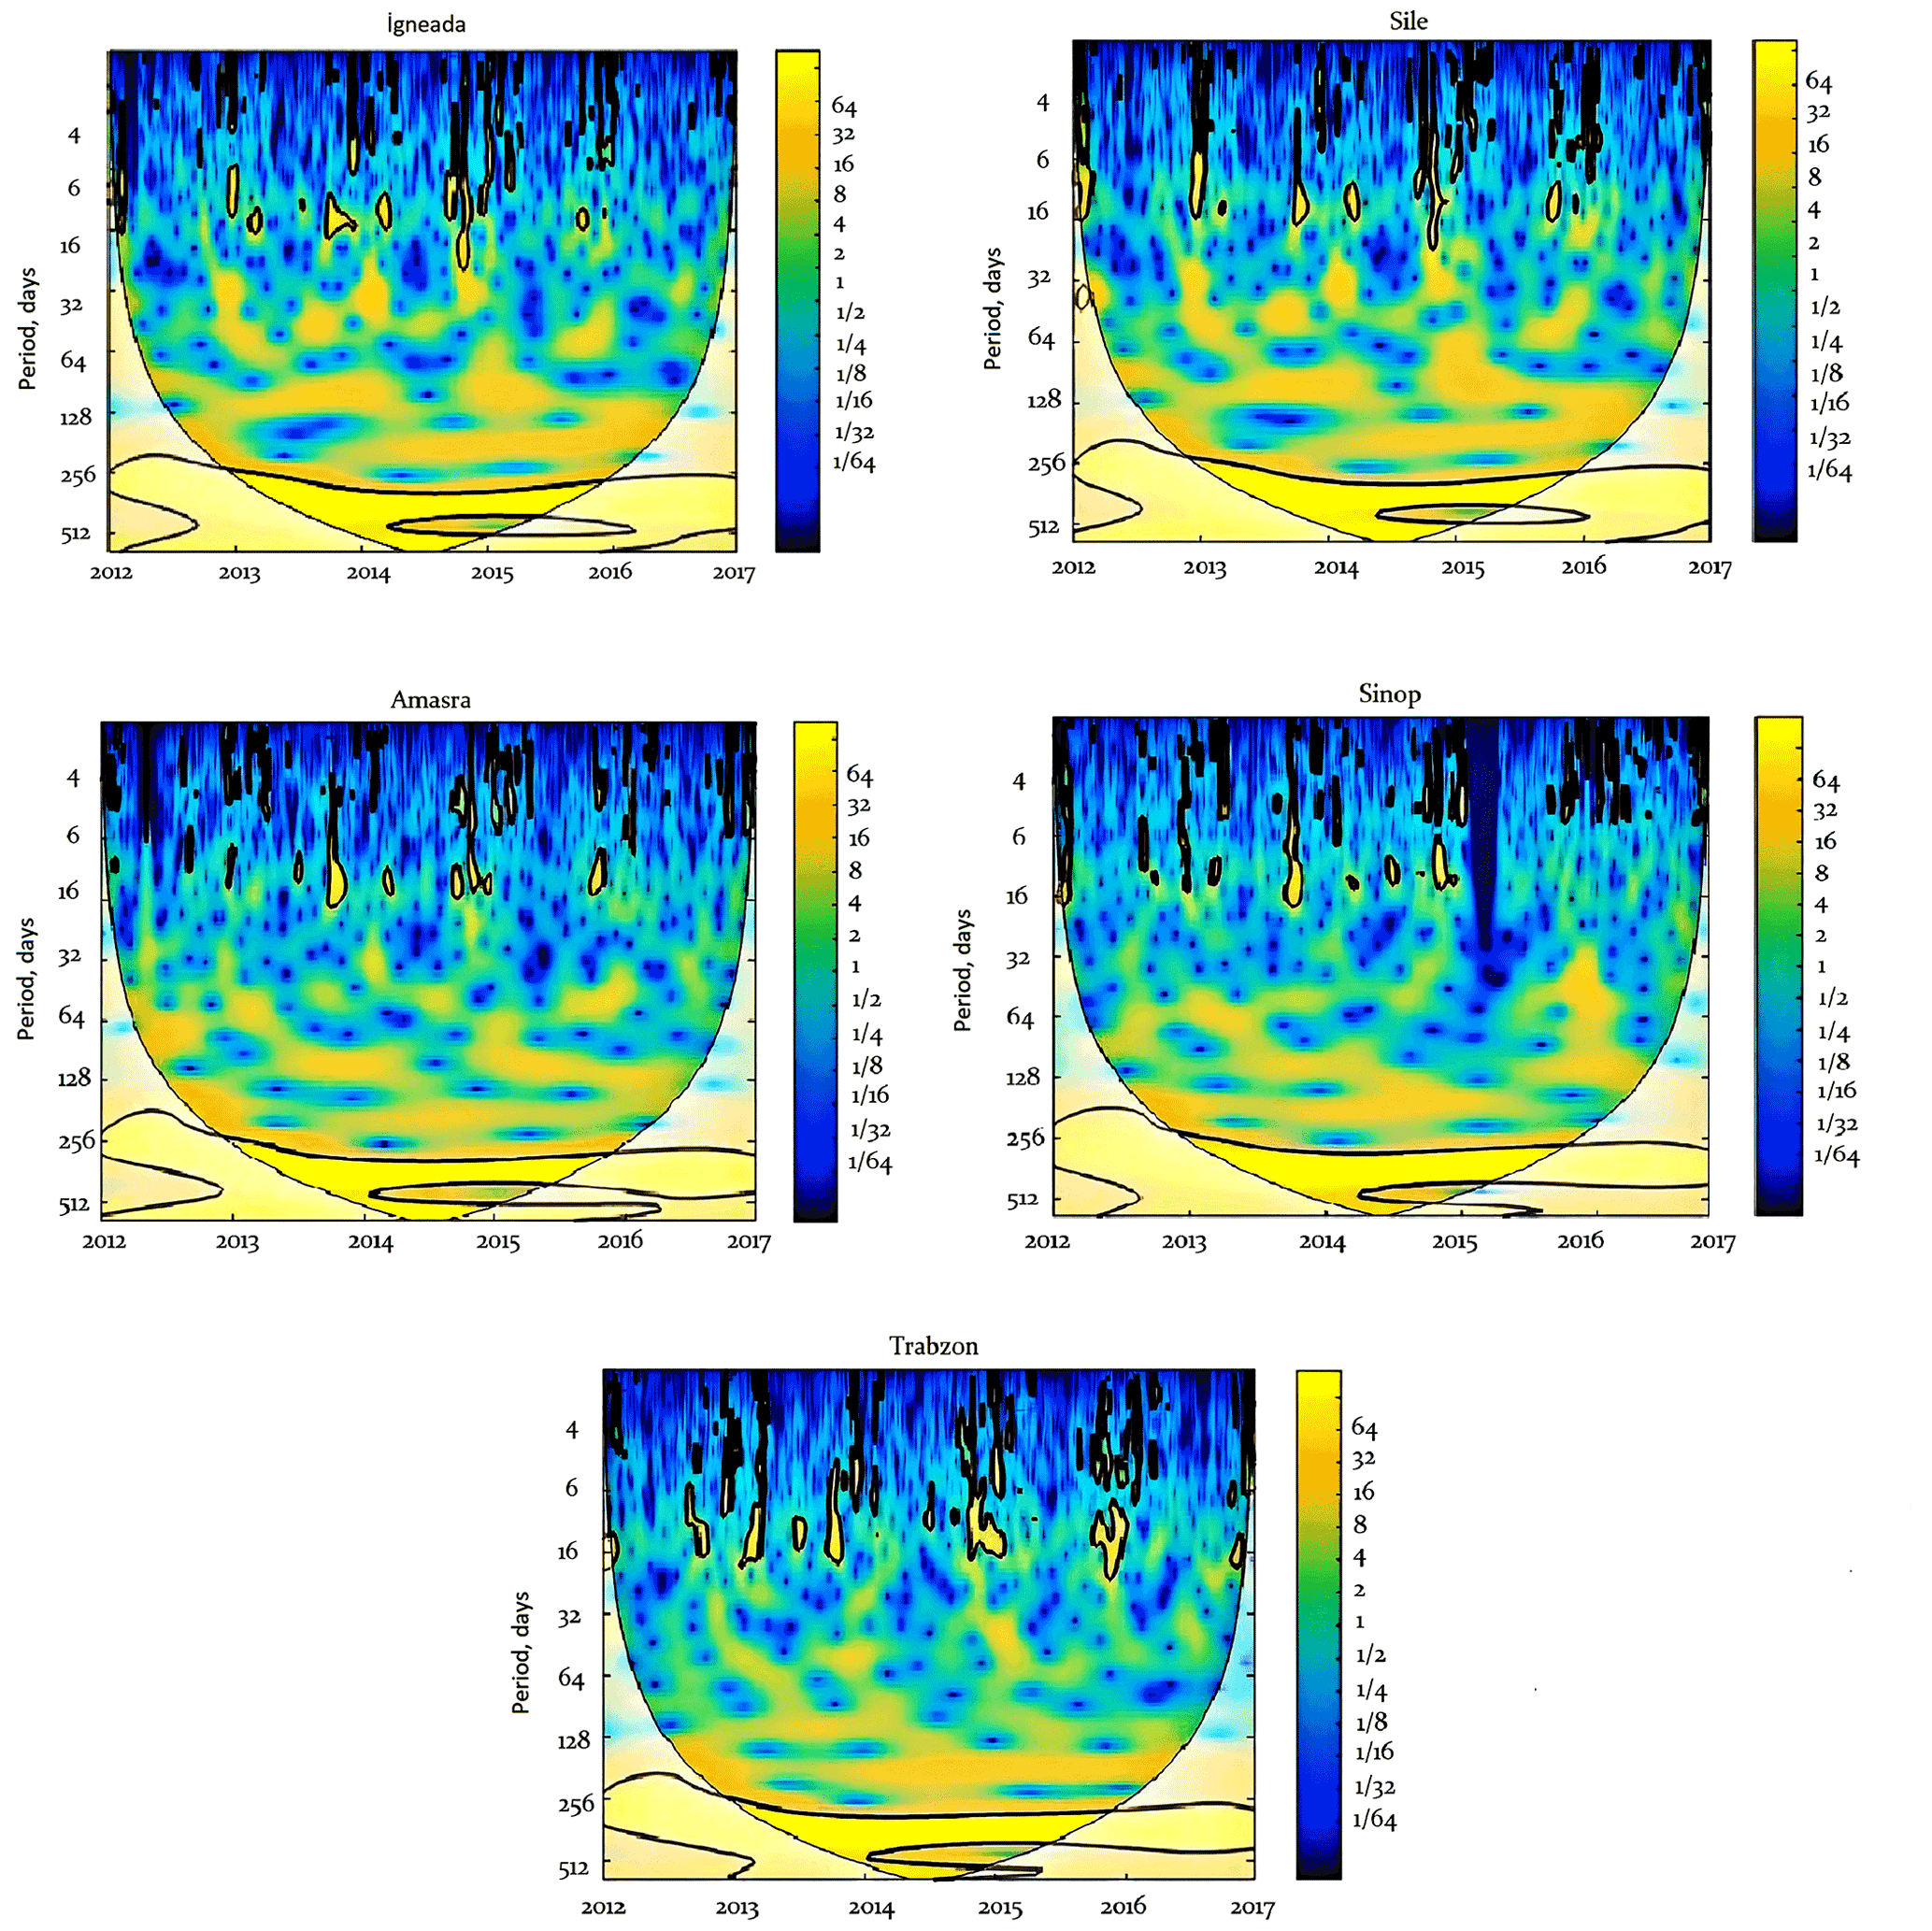
Figure 4Wavelet power spectra of the sea levels for İğneada, Şile, Amasra, Sinop, and Trabzon, obtained using the Morlet wavelet. Time is indicated on the x axis (years), and the timescale (period) is shown on the y axis. The colour scale of the variance (power), shown on the z axis, ranges from blue to yellow with increasing power (variance). The areas enclosed by the black contour lines indicate the periods with a significance of above 95 %.
Power is seen to reach a maximum at low frequencies with 10 to 15 d periods between the autumn–winter months at all sites. These periods are well matched with the results obtained from the spectral analysis presented above. The years 2015 and 2016 in Sinop and 2012 in Amasra are exceptions due to missing data (see Fig. 2). However, this portion of the missing data does not prevent us from seeing the overall structure.
The wavelet analysis presented above allowed us to detect the low-frequency variations at specific time periods. At least three very similar events were identified through visual inspection of those periods, and their characteristics are documented (Aydın, 2019). One of these low-frequency sea level variations occurred during October–November 2014, and we selected this period as a representative example to reveal the characteristics of low-frequency waves and their impact on the Black Sea circulation.
Figure 5 shows variations of the sea level with time during 1 month between 15 October and 15 November 2014. Due to problems with the measurements, data from İğneada station are not shown. At all stations, the sea level first evidently decreased and then attained a maximum of 20 cm. Characteristically, the sea level reached its peak level 2 d after the minimum sea level. This 2 d lag is the same for all stations. The wave crest observed in Şile on 26 October 2014 emerged in Amasra on 28 October, in Sinop on 30 October, and in Trabzon on 1 November. This visual inspection of the time series of sea levels shows that the sea level fluctuation propagates eastward, and the sea level signal is not modified during this propagation. There are clear time lags between the sea level responses at each station. In this case, we can say that a wave has progressed from west to east and reached Trabzon from Şile in about 5–6 d.
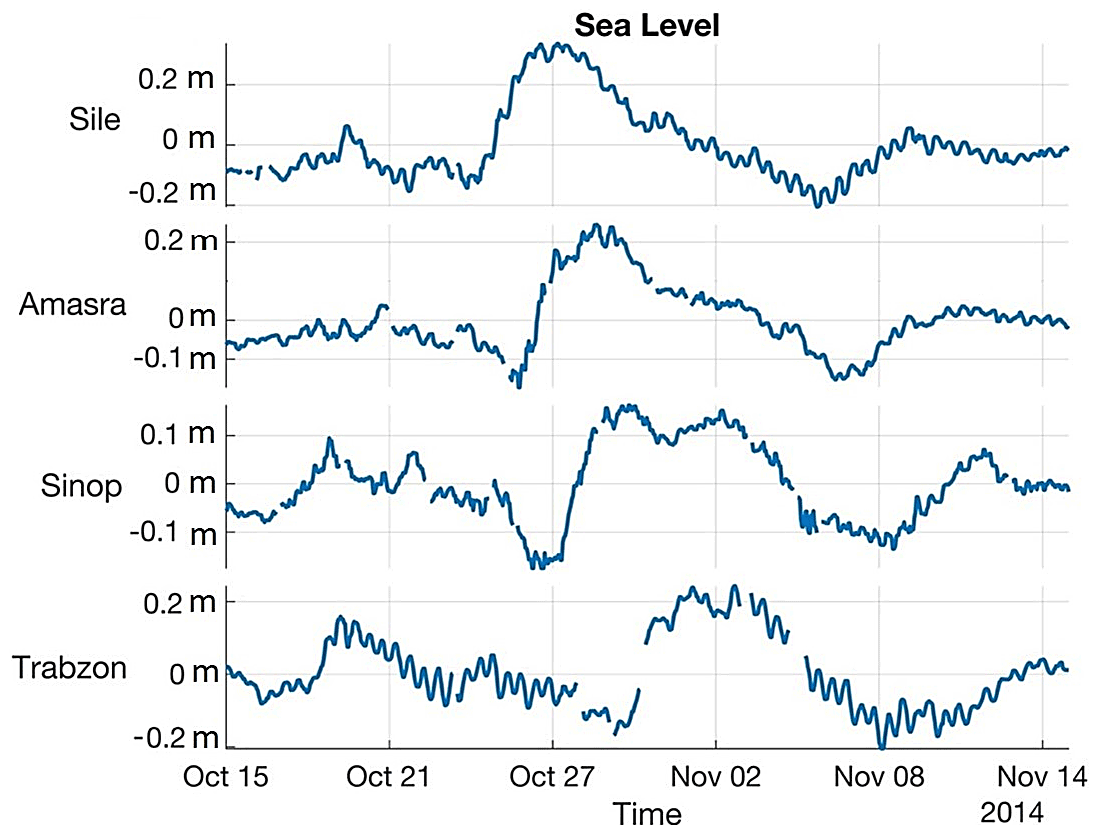
Figure 5Time series of the sea level variations from 15 October to 15 November 2014. The data were subsampled from Fig. 2. The data have been smoothed using the robust linear regression method of the MATLAB smoothdata function with the rlowess option.
Lagged cross-correlation of the sea levels between the first station in the west (Sile) and stations towards the east demonstrate the propagating nature of the observed oscillations (Fig. 6). The maximum lagged correlations between the westernmost station (Şile) and the other stations towards the east (Amasra, Sinop, Trabzon) occur at days 1.4, 2.5, and 5.2, respectively. The Şile–Amasra, Şile–Sinop, and Şile–Trabzon distances are 280, 510, and 1010 km, respectively. By using time-delayed correlations and inter-station distances, the phase velocity of the wave was calculated as approximately 2.3 m s−1 and did not change much during its inter-station journey. Our calculations for periods other than October–November 2014 gave phase velocities of sub-inertial CTWs in the Black Sea in the range of 2–3 m s−1 (see Aydın, 2019). These values are indicative of mode 1 CTWs (Hughes et al., 2019) and are comparable with the phase velocities of 11–12 d oscillations in the Black Sea estimated by Ivanov and Yankovsky (1993).
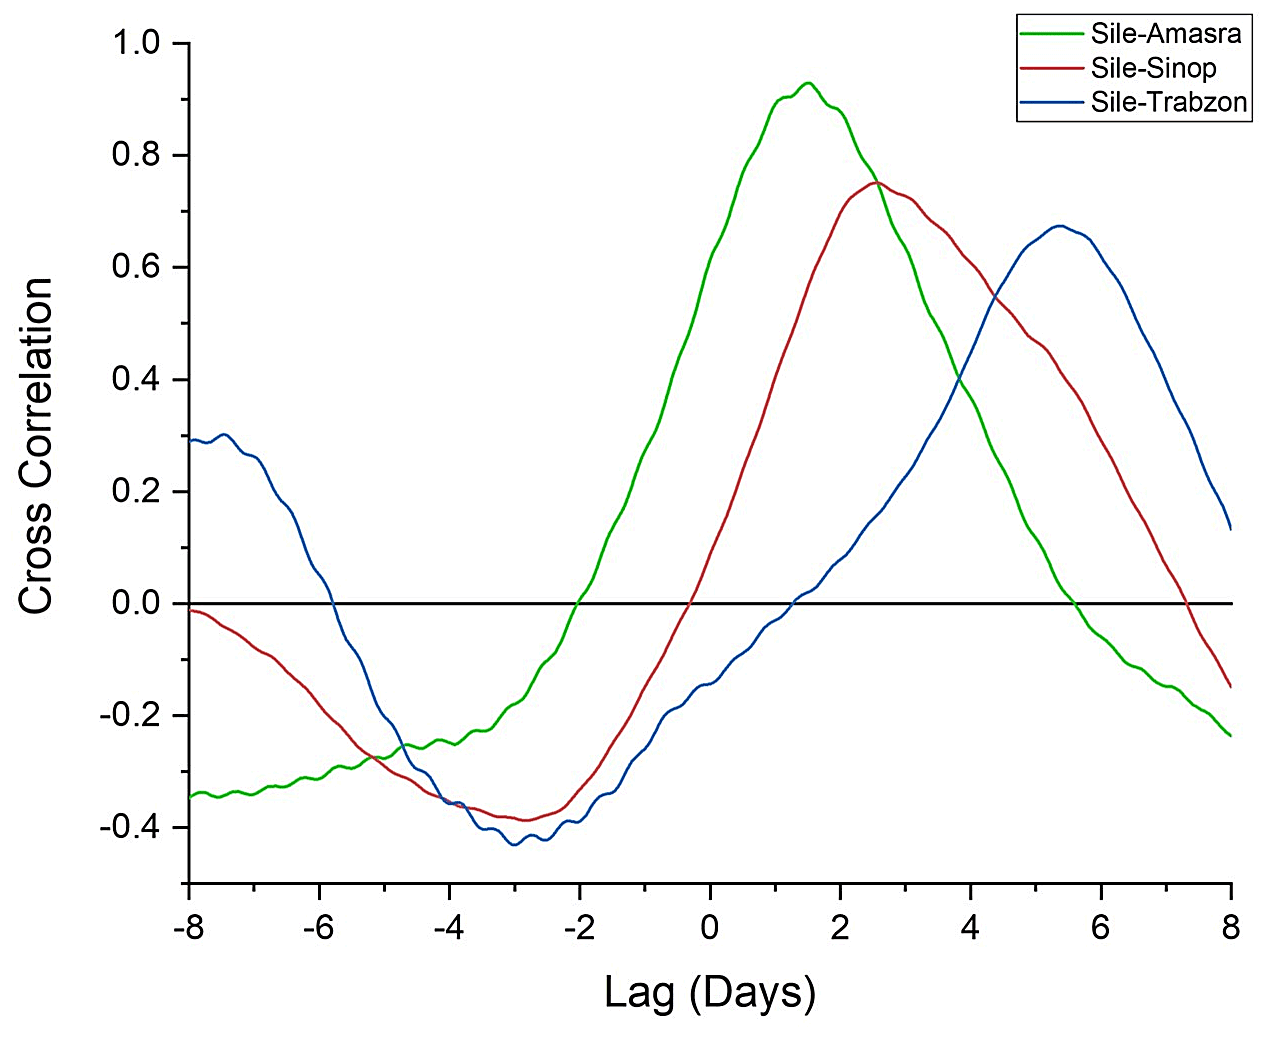
Figure 6Time-lagged correlations between the sea level at the westernmost station (Sile) and those at other stations towards the east for October–November 2014.
To understand the mechanisms for generating the observed CTWs as described above, wind data coinciding with the same period were examined. The temporal variation of the hourly wind at the westernmost station (İğneada) from 15 October to 15 November 2014 is shown in Fig. 7.
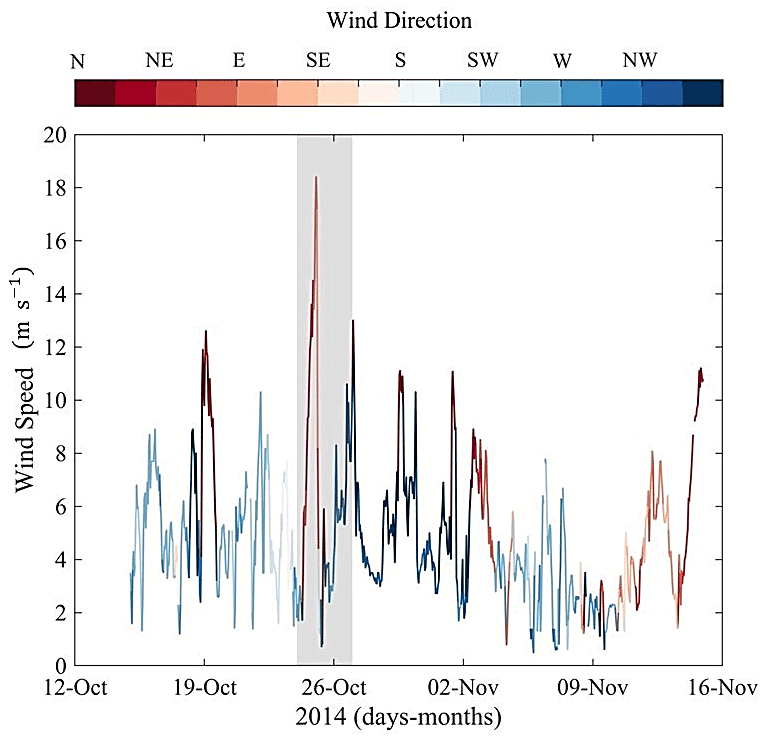
Figure 7Wind speeds and directions at İğneada for the October 2014 event. Shaded area highlights the CTW excitation period.
The wind speed varied periodically on timescales of 3–4 d, changing direction 180∘ after each relaxation. This region is mainly dominated by the recurrence of northerly winds that alternate with weak wind periods. The frequent changes in direction indicate the passage of fronts over the area. A strong wind with a speed of more than 8 m s−1 often occurred, and the wind speed attained its maximum (>18 m s−1) on 25 October from the northeastern direction. This gale-force wind parallel to the coastline from the northeast was favourable to downwelling and piled up the water at the shore. Before and after this gale-force wind from the northeast, two wind patterns are visible. Before, the wind over the area fluctuated a few times from being downwelling favourable (northeasterly) to being upwelling favourable (southwesterly), with each phase lasting approx. 2 d. After the storm, the wind changed direction to northwesterly. This peak in wind speed corresponds to the peak in the sea level at İğneada.
Spatial distributions of the wind field in the Black Sea obtained from CMEMS for the period of 24 October to 1 November 2014 are presented in Fig. 8. These span the duration of southerly winds that change direction to strong northeasterly winds that reach 18 m s−1. The wind field obtained from CMEMS is in good agreement with the corresponding time series recorded at the coastal station. It should be noted that the coastal station is located at the southern end of the core of the storms.
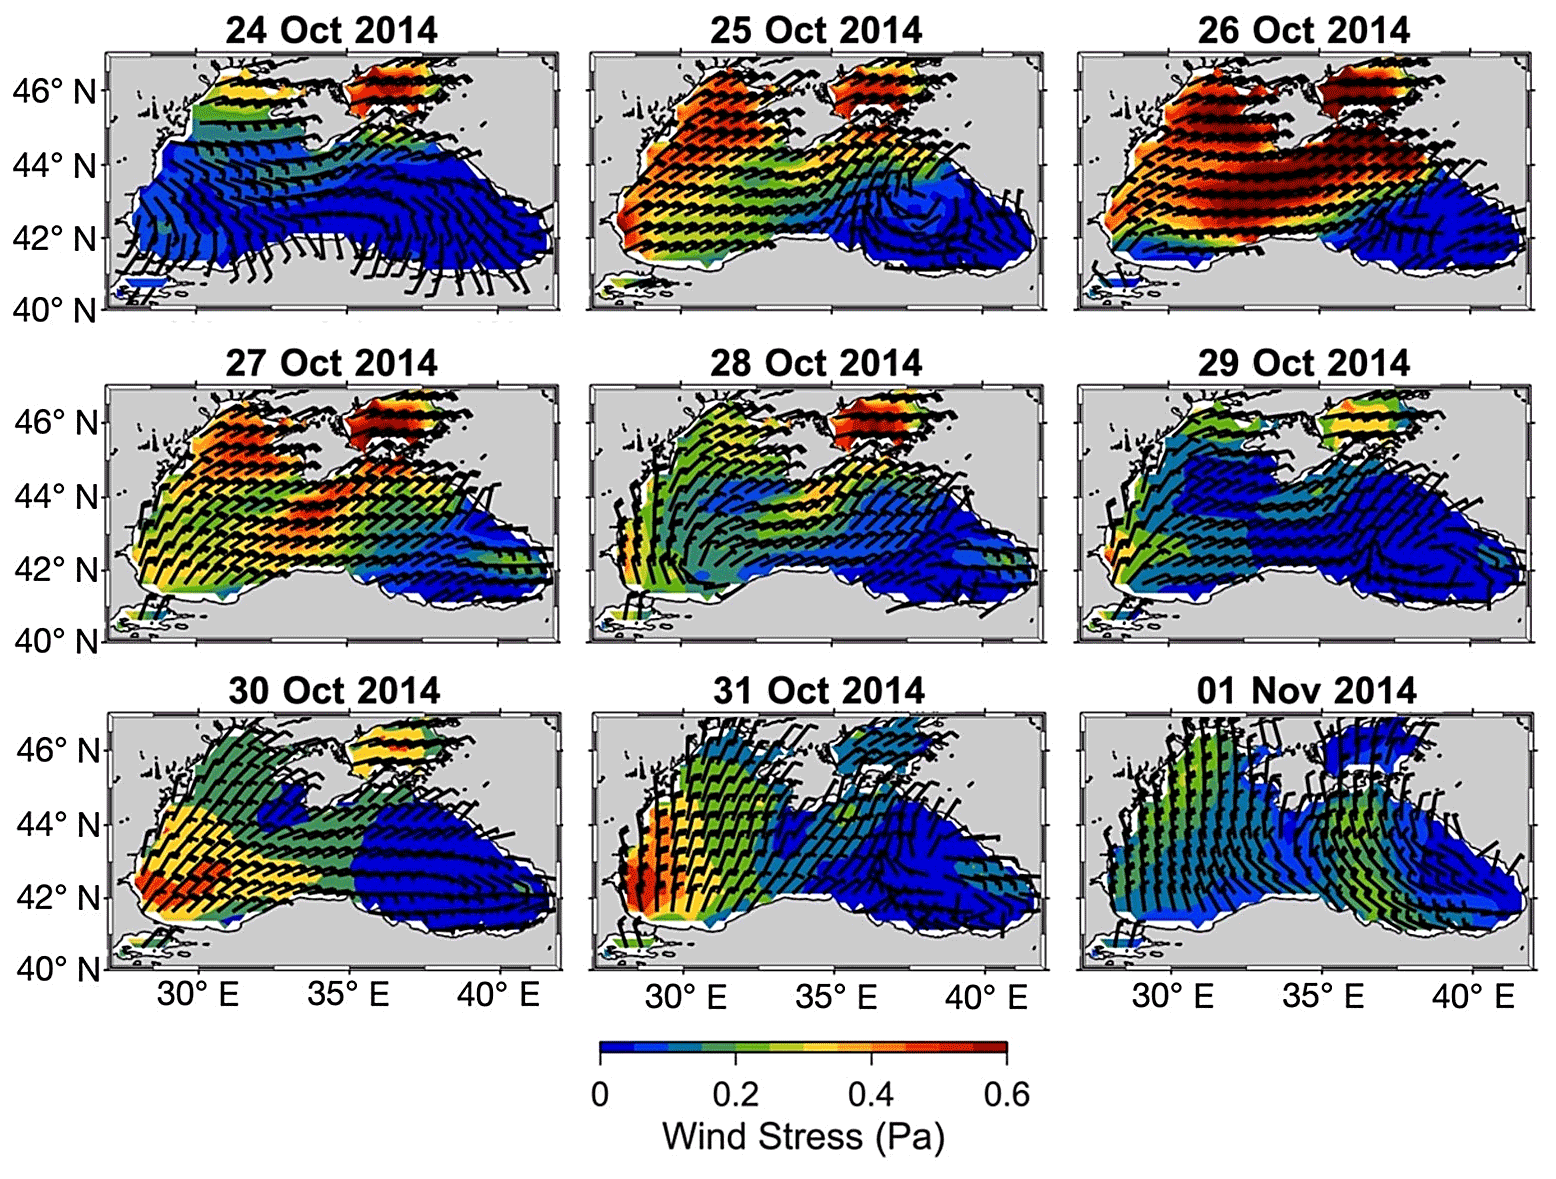
Figure 8Sequence of wind stress (colour scale) and direction (wind barbs) distributions from 24 October to 1 November 2014 at 00:00 UTC.
The winds were rather weak and directed E–S across the whole Black Sea basin on 24 October 2014. On 25 October 2014, the wind suddenly changed direction and increased in intensity, blowing at gale force from the northeast in the western part of the basin. The intensity of the wind increased on 26 October, showing an intensity maximum in the northwestern and central parts of the Black Sea. On 27 October 2014, the intensity of the wind gradually decreased while keeping its direction. Note that the wind direction was oriented along the coastline during the storm.
Figure 9 shows the evolution of the sea surface height (SSH) during the event presented above. The strongest storm occurred on 25 October, and the sea level responded quickly. On 25 October, surface waters started to accumulate along the western boundary of the Black Sea with strong northeasterly winds, resulting in Ekman transport toward the coast. On the following day, this layer became wider and extended toward the southwestern boundary. Joint analysis of the winds (see Figs. 7 and 8) and sea level data showed that the accumulation of water at the coast began when the wind speed exceeded 8 m s−1.
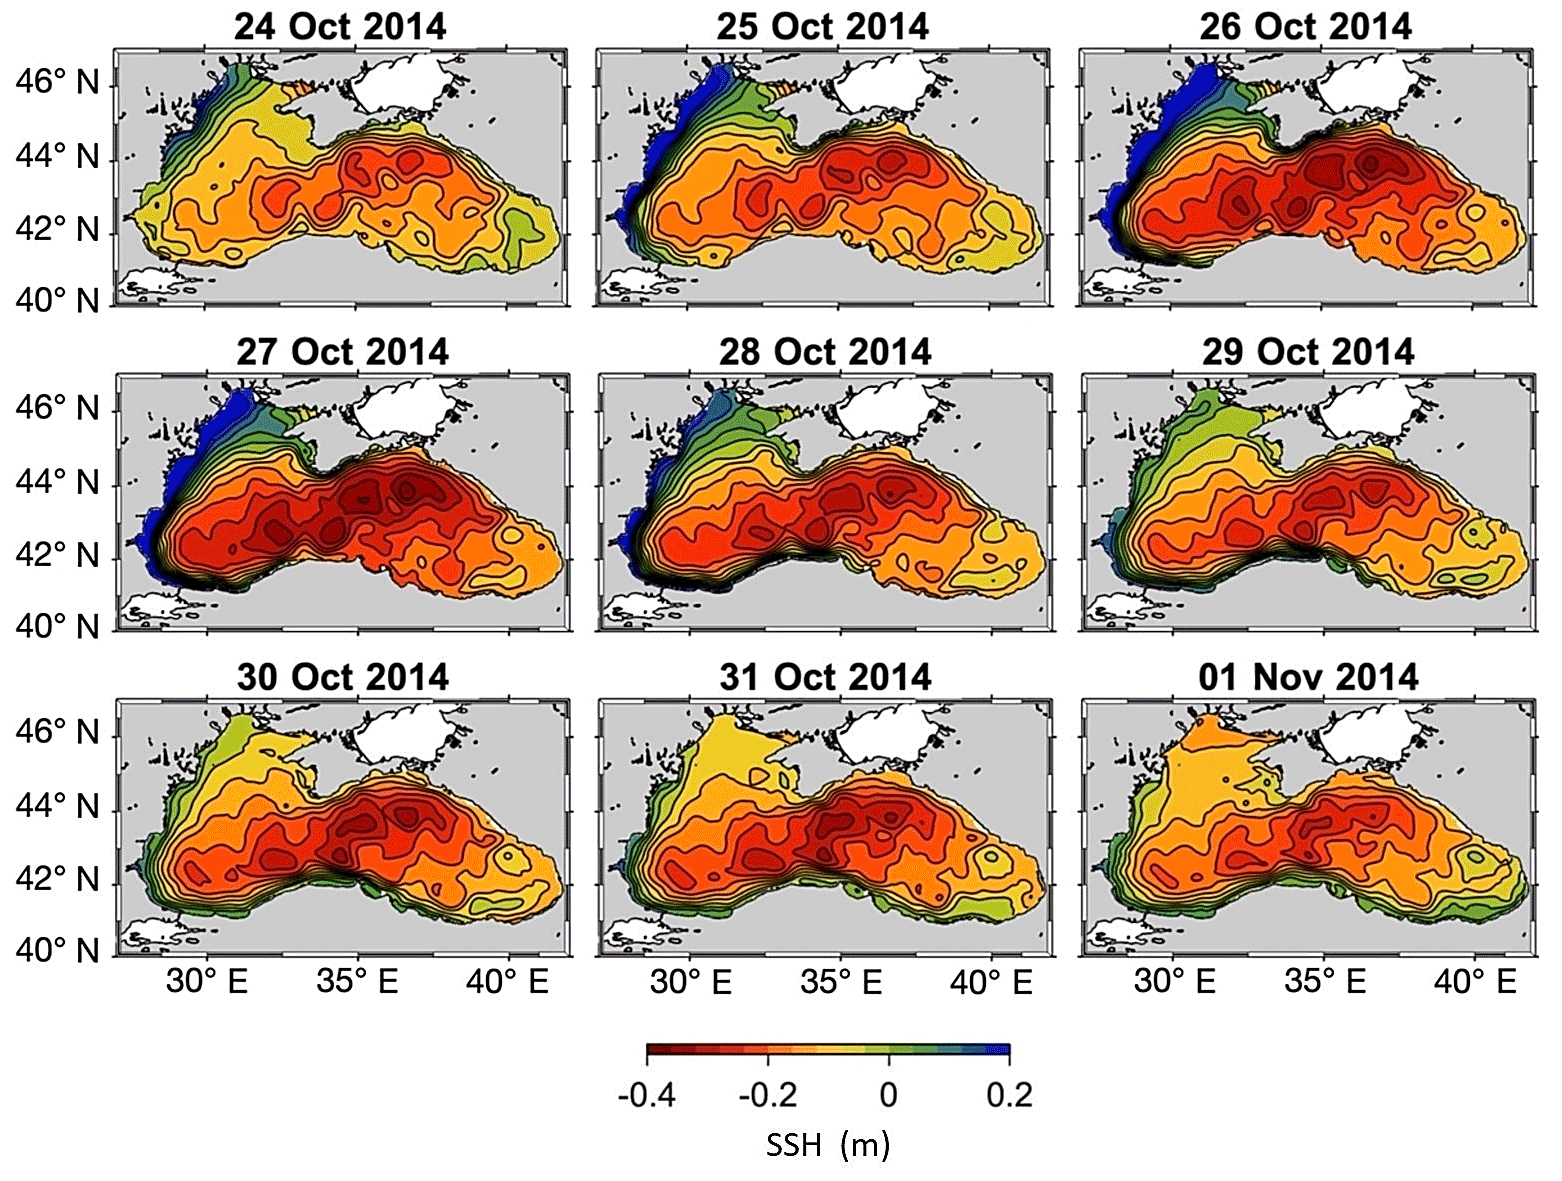
Figure 9Sequence of daily mean sea surface height (SSH) distributions from 24 October to 1 November 2014, obtained from the Black Sea reanalysis product of CMEMS.
The event was preceded by moderate wind conditions. The coastal sea level reached an anomaly of 0.3 m due to Ekman transport. The accumulated waters consistently propagated south through 27 October after the winds had weakened and changed direction toward the NW.
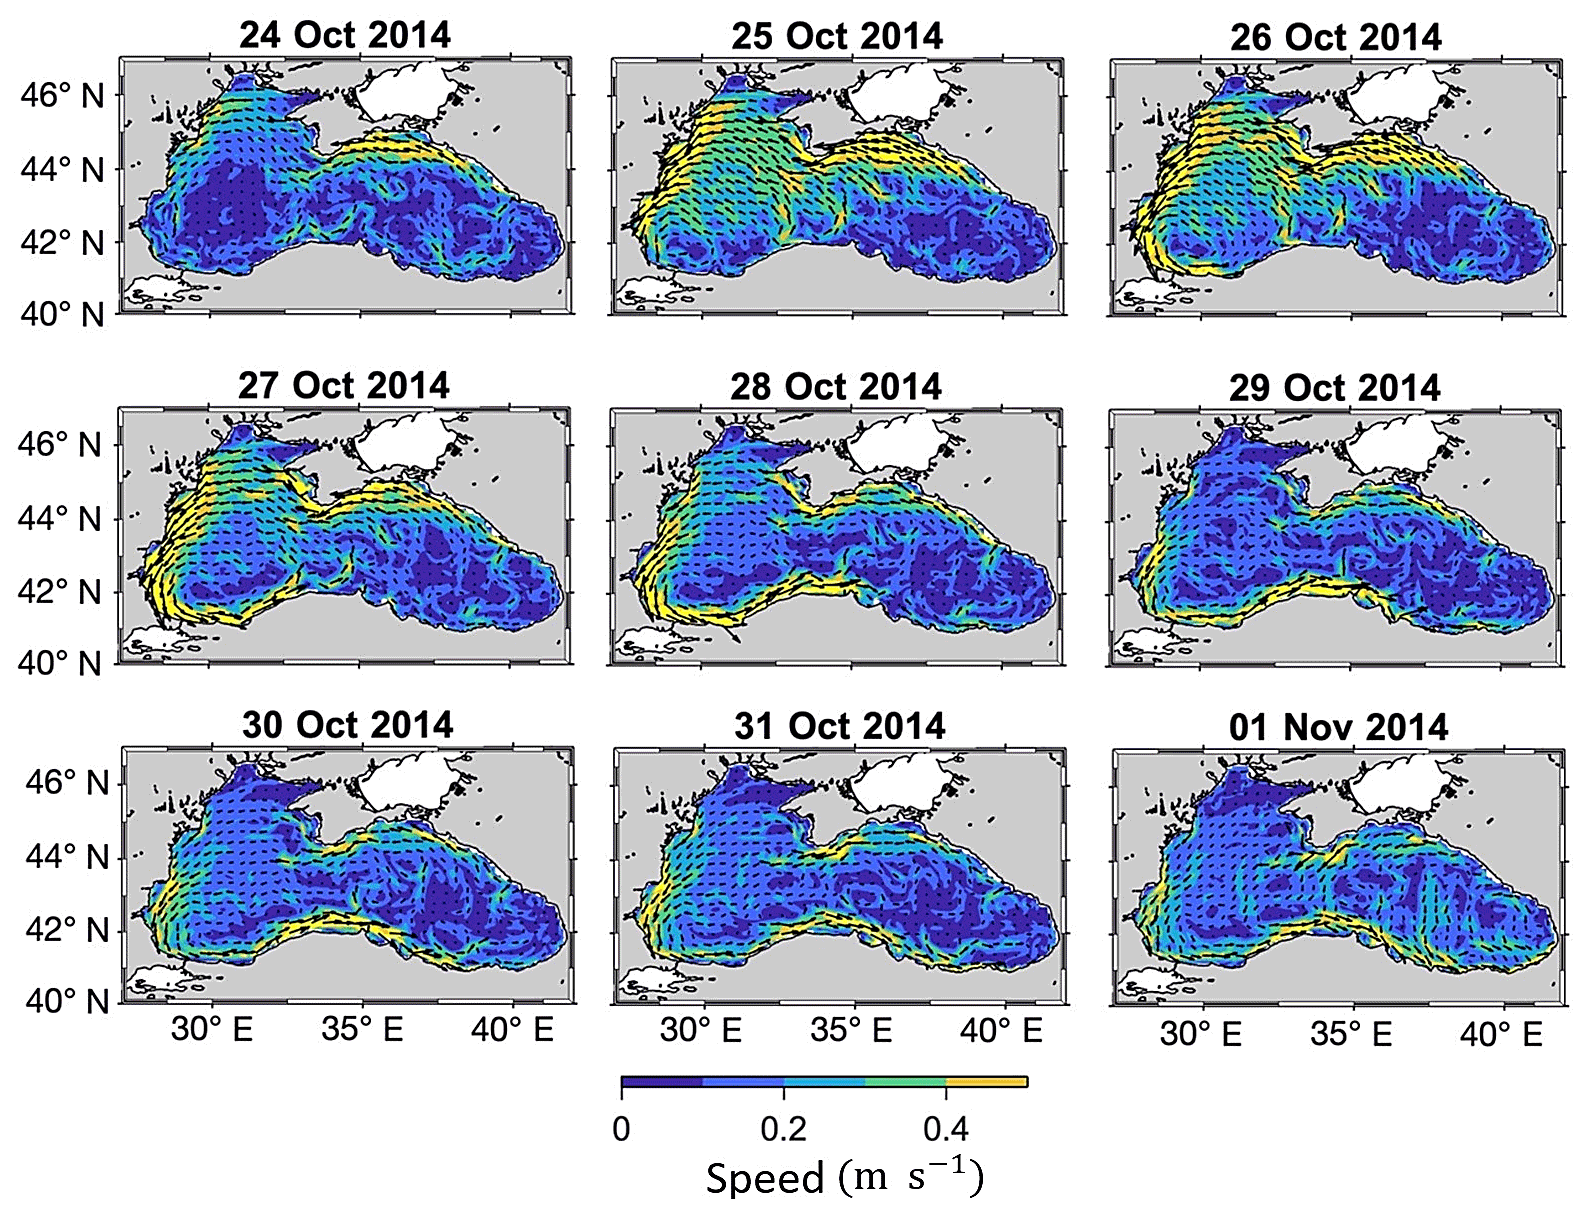
Figure 10Sequence of daily mean horizontal velocity distributions at 2.5 m from 24 October to 1 November 2014, obtained from the Black Sea reanalysis product of CMEMS. For clarity of presentation, only 1 of every 10 vectors is plotted.
Figure 10 shows horizontal distributions of the current vector at the surface from CMEMS, coinciding with Figs. 8 and 9. On 24 October, the surface current in the Black Sea was weak except in some parts near the northern boundary. On 25 October, surface currents in the western Black Sea started to increase and southwestward velocities of about 0.5 m s−1 occurred near the coast of the western boundary, which were associated with a 0.3 m rise in the mean water level. The accumulated water at the coast, coinciding with the change in wind direction on 25 October, created a pressure gradient directed offshore, and longshore currents were generated toward the south. On 26 October, this current reached the southern boundary. This strong current progressively moved along the southern boundary of the basin, reaching central parts on 27 October. On 1 November, the strong flow was visible all the way to the southeast corner of the basin. The maximum alongshore velocity reached up to 1 m s−1, and the cross-shore scale was about 40 km. The strongest velocities were observed near the coast where the sea level anomaly reached its local maxima. Theory indicates that the waves formed have their maximum amplitude at the coast and decay exponentially offshore with the scale of the Rossby radius of deformation. After 30∘ E, along the southern boundary, the shelf is narrow (<20 km) and the continental slope is steep. The core of the Rim Current is closer to the coast at less than the Rossby radius in this region. Eventually the Rim Current and the coastal current generated by CTWs merge and flow eastward as a single structure. Hence, the main cyclonic circulation of the Black Sea is intensified. Intensification of the main circulation during winter is well known through modelling and altimeter data analysis for the Black Sea (Korotaev et al., 2003; Stanev, 2005). Stanev et al. (2003) estimated from numerical simulations and altimeter data that the horizontal transport almost doubles in winter. Our results indicate that one of the dynamical reasons for the intensification of the Rim Current during winter is the coastal current generated by the CTWs.
In their study based on an analysis of current measurements made on the Crimean shelf, Ivanov and Yankovsky (1993) found that 11–12 d oscillations of coastal currents have the largest amplitude and lead to a 15–20 cm s−1 increase in the alongshore component of the velocity. As a result of their analysis, it was postulated that these oscillations were produced by distant winds on a spatial scale comparable to the length of the Black Sea, and were trapped on the shore with a phase velocity of greater than 2 m s−1. Although we do not have data for their observation period, comparison of the characteristics of the waves they found with our results indicates that the CTWs observed on the northern boundary of the Black Sea were possibly generated on the western boundary of the Black Sea and propagated cyclonically around the southern and eastern boundaries of the Black Sea to reach the Crimean coast. Furthermore, considering the shelf width and the wind direction, the only favourable location for the generation of mode-1 CTWs is the western boundary of the Black Sea.
Sea level measurements from five coastal stations situated in the southern Black Sea revealed low-frequency oscillations in the basin. The generation of coastal trapped waves along the western coast of the Black Sea and their propagation along the southern boundary were demonstrated using CMEMS reanalysis products. The sea level oscillations had a 10–20 cm range in the frequency band along with 14 d periodicity. These waves propagated from west to east with a speed of 2.3–2.6 m s−1.
During the October to March period, eastward-travelling depressions produce gale-force winds from the north (Özsoy and Ünlüata, 1997). These gale-force winds trigger a persistent downwelling along the western boundary of the Black Sea and the accumulation of water at the coast. Following the relaxation of the wind, coastal trapped waves at sub-inertial frequencies propagated eastward along the southern boundary, keeping the coast on their right. These waves are produced in the western part of the basin during the winter, when the wind speeds exceed 12 m s−1. This phenomenon occurs a few times a year.
The internal Rossby radius of deformation (20–30 km) is larger than the width of the continental shelf (20–25 km) along the southern and eastern boundaries of the Black Sea. When the shelf scale is comparable with the internal Rossby radius, as it is in the southern and eastern Black Sea, the margins of the Black Sea act as a vertical wall and become an efficient waveguide for the propagation of coastal trapped waves in mode 1.
The coastal trapped waves produce currents of up to 1 m s−1 in magnitude along the western and southern boundaries of the Black Sea. The Rim Current flowing over the continental slope comes closer to the coast because of the narrowing shelf along the southern boundary. Hence, the transient strong currents generated by CTWs interact with the Rim Current. Since both are cyclonic, the Rim Current is intensified. This suggests that the intensification of the Black Sea mean circulation during winter is associated with the coastal trapped waves generated by the alongshore winds on the western boundary.
In situ sea level data used in this study are available upon request from Turkish General Directorate of Mapping (https://tudes.harita.gov.tr, last access: 17 July 2022). The CMEMS data can be obtained from E.U. Copernicus Marine Service Information (https://doi.org/10.25423/CMCC/BLKSEA_REANALYSIS_PHYS_007_004, Lima et al., 2020) Wind data to produce Fig. 7 can be obtained from Turkish State Meteorological Service upon request using Meteorological Data Information System (https://mevbis.mgm.gov.tr/mevbis/ui/index.html#/Workspace, last access: 17 July 2022).
MA conducted the research as a part of his master's thesis, supervised by STB. STB wrote the paper with input from MA.
The contact author has declared that none of the authors has any competing interests.
Publisher’s note: Copernicus Publications remains neutral with regard to jurisdictional claims in published maps and institutional affiliations.
We thank the editor, John M. Huthnance, for his comments and suggestions which helped us to clarify some important aspects of the paper. We would also like to thank our reviewers, Emil Stanev and an anonymous reviewer, for their constructive comments on our paper.
This research has been supported by the European Union's Horizon 2020 DOORS project (grant no. 101000518).
This paper was edited by John M. Huthnance and reviewed by Emil Stanev and one anonymous referee.
Adams, J. K. and Buchwald, V. T.: The generation of continental shelf waves, J. Fluid Mech., 35, 815–826, https://doi.org/10.1017/S0022112069001455, 1969.
Amol, P., Shankar, D., Aparna, S. G., Shenoi, S. S. C., Fernando, V., Shetye, S. R., Mukherjee, A., Agarvadekar, Y., Khalap, S., and Satelkar, N. P.: Observational evidence from direct current measurements for propagation of remotely forced waves on the shelf off the west coast of India, J. Geophys. Res., 117, C05017, https://doi.org/10.1029/2011JC007606, 2012.
Aydın, M.: Generation mechanisms and propagation properties of the coastal trapped waves in the Black Sea, MSc Thesis, Dokuz Eylül University, 52 pp., http://panel.fbe.deu.edu.tr/ALL_FILES/Tez_Arsivi/2019/10228581.pdf (last access: 17 July 2022), 2019 (in Turkish with English abstract).
Beckenbach, E. and Washburn, L.: Low-frequency waves in the Santa Barbara Channel observed by high frequency radar, J. Geophys. Res., 109, C02010, https://doi.org/10.1029/2003JC001999, 2004.
Bentamy, A. and Fillon, D. C.: Gridded surface wind fields from Metop/ASCAT measurements, Int. J. Remote Sens., 33, 1729–1754, https://doi.org/10.1080/01431161.2011.600348, 2012.
Brink, K. H.: Coastal-trapped waves and wind-driven currents over the continental-shelf, Annu. Rev. Fluid Mech., 23, 389–412, 1991,
Gill, A. E. and Schumann, E. H.: The generation of long shelf waves by the wind, J. Phys. Oceanogr., 4, 83–90, https://doi.org/10.1175/1520-0485(1974)004,0083:TGOLSW.2.0.CO;2, 1974.
Grinsted, A. and Moorel, J. C.: Application of the cross wavelet transform and wavelet coherence to geophysical time series, Nonlinear Process. Geophys., 11, 561–566, 2004.
Hamon, B. V.: The spectrums of mean sea level at Sydney, Coff's Harbour, and Lord Howe Island, J. Geophys. Res., 67, 5147–5155, https://doi.org/10.1029/JZ067i013p05147, 1962.
Hughes, C. W., Fukumori, I., Griffies, S. M., and Huthnance, J. M.: Sea Level and the Role of Coastal Trapped Waves in Mediating the Influence of the Open Ocean on the Coast, Surv. Geophys., 40, 1467–1492, https://doi.org/10.1007/s10712-019-09535-x, 2019.
Huthnance, J. M.: Circulation, exchange, and water masses at the ocean margin: the role of physical processes at the shelf edge, Prog. Oceanogr, 35, 353–431, 1995.
Igeta, Y., Kitade, Y., and Matsuyama, M.: Characteristics of coastal-trapped waves induced by typhoon along the southeast coast of Honshu, Japan, J. Oceanogr., 63, 745–760, 2007.
Ivanov, V. A. and Yankovsky, A. E.: Local Dynamics experiment in the shelf zone Southern Crimean coast, Okenologiya, 33, 49–56, 1993.
Ivanov V. A. and Bagaiev, A. V.: Oscillation of Hydrophysical Fields on the Shelf and Continental Slope Caused by Nonstationary Wind, Izvestiya, Atmospheric and Oceanic Physics, 50, 648–656, 2014.
Ivanov, V. A., Bagaev, A. V., Dymova, O. A., and Plastun, T. V.: Oscillations of the Marine Hydrodynamic Parameters in Subinertial Range: Statistical Analysis and Numerical Modeling for the Crimean Shelf, Phys. Oceanogr., 6, 55–68, 2015.
Kitade, Y.: Coastal-Trapped Waves with Several-Day Period Caused by Wind along the Southeast Coast of Honshu, J. Oceanogr., 56, 727–744, 2000.
Korotaev, G., Oguz, T., Nikiforov, A., and Koblinsky, C.: Seasonal, interannual, and mesoscale variability of the Black Sea upper layer circulation derived from altimeter data, J. Geophys. Res., 108, 3122, https://doi.org/10.1029/2002JC001508, 2003.
Lima, L., Masina, S., Ciliberti, S. A., Peneva, E. L., Cretí, S., Stefanizzi, L., Lecci, R., Palermo, F., Coppini, G., Pinardi, N., and Palazov, A.: Black Sea Physical Reanalysis (CMEMS BS-Currents) (Version 1), Copernicus Monitoring Environment Marine Service (CMEMS) [data set], https://doi.org/10.25423/CMCC/BLKSEA_REANALYSIS_PHYS_007_004, 2020.
Maiwa, K., Masumoto, Y., and Yamagata, T.: Characteristics of coastal trapped waves along the southern and eastern coasts of Australia, J. Oceanogr., 66, 243–258, https://doi.org/10.1007/ s10872-010-0022-z, 2010.
Oğuz T. and Beşiktepe Ş.: Observations on The Rim Current Structure, CIW formation and transport in western Black Sea, Deep-Sea Res., 10, 1733–1751, 1999.
Özsoy, E. and Ünlüata, Ü.: Oceanography of black Sea A Review of Some Recent Results, Earth Sci. Rev, 42, 231–272, 1997.
Rachev, N. H. and Stanev, E. V.: Eddy processes in semi-enclosed seas. A case study for the Black Sea, J. Phys. Oceanogr., 27, 1581–1601, 1997.
Romea, R. D. and Smith, R. L.: Further evidence for coastal trapped waves along the Peru coast, J. Phys. Oceanogr., 13, 1341–1356, 1983.
Schumann, E. H. and Brink, K. H.: Coastal-trapped waves off the coast of South Africa: Generation, Propagation, and current structures, J. Phys. Oceanogr., 20, 1206–1218, 1990.
Shoji, D.: On the variations of the daily mean sea levels along the Japanese Islands, J. Oceanogr. Soc. Jap., 17, 21–32, 1961.
Staneva, J. V., Dietrich, D. E., Stanev, E. V., and Bowman, M. J.: Rim current and coastal eddy mechanisms in an eddy-resolving Black Sea general circulation model, J. Mar. Syst., 31, 137–157, 2001.
Stanev, E. V.: Understanding Black Sea dynamics: Overview of recent numerical modeling, Oceanography, 18, 56–75, https://doi.org/10.5670/oceanog.2005.42, 2005.
Stanev, E. V. and Beckers, J. M.: Barotropic and baroclinic oscillations in strongly stratified ocean basins: Numerical study of the Black Sea, J. Mar. Syst., 19, 65–112, 1999.
Stanev, E. V., Le Traon, P. Y., and Peneva, E. L.: Sea level variations and their dependency on meteorological and hydrological forcing: Analysis of altimeter and surface data for the Black Sea, J. Geoph. Res., 105, 17203–17216, 2000.
Stanev, E. V., Bowman, M. J., Peneva, E. L., and Staneva, J. V.: Control of Black Sea inter- mediate water mass formation by dynamics and topography: Comparisons of numerical simulations, survey and satellite data, J. Mar. Res., 61, 59–99, 2003.
Stanton, B. R.: Sea Level Variability on the West Coast of New Zealand, J. Phys. Oceanogr., 25, 1265–1272, 1995.
Volkov, D. L. and Landerer, F. W.: Internal and external forcing of sea level variability in the Black Sea, Clim Dyn., 45, 2633–2646, https://doi.org/10.1007/s00382-015-2498-0, 2015.
Yankovsky, A. E. and Chapman, D. C.: Generation of mesoscale flows over the shelf and slope by shelf wave scattering in the presence of a stable, sheared mean current, J. Geophys. Res., 100, 6725–6742, https://doi.org/10.1029/94JC03339, 1995.
Yankovsky, A. E. and Chapman, D. C.: Anticyclonic eddies trapped on the continental shelf by topographic irregularities, J. Geophys. Res., 102, 5625–5639, https://doi.org/10.1029/96JC03452, 1997.
Yin, L., Qiao, F., and Zheng, Q.: Coastal-Trapped Waves in the East China Sea Observed by a Mooring Array in Winter 2006, J. Phys. Oceanogr., 44, 576–590, 2014.
Zamudio, L., Hurlburt, H. E., Metzger, E. J., and Smedstad, O. M.: On the evolution of coastally trapped waves generated by Hurricane Juliette along the Mexican west Coast, Geophys. Res. Lett., 29, 561–564, 2002.
- Abstract
- Introduction
- Data
- Identification of CTWs in the southern Black Sea
- Mechanism for the generation of the observed CTWs in the Black Sea
- Impact of CTWs on the Black Sea general circulation
- Summary and concluding remarks
- Data availability
- Author contributions
- Competing interests
- Disclaimer
- Acknowledgements
- Financial support
- Review statement
- References