the Creative Commons Attribution 4.0 License.
the Creative Commons Attribution 4.0 License.
 | 06 Oct 2021
Interannual variability in contributions of the Equatorial Undercurrent (EUC) to Peruvian upwelling source water
Gandy Maria Rosales Quintana
Robert Marsh
Luis Alfredo Icochea Salas
Time-varying sources of upwelling waters off the coast of northern Peru are analyzed in a Lagrangian framework, tracking virtual particles backwards in time for 12 months. Particle trajectories are calculated with temperature, salinity and velocity fields from a hindcast spanning 1988–2007, obtained with an eddy-resolving (∘) global configuration of the Nucleus for European Modelling of the Ocean (NEMO) ocean model. At 30 and 100 m, where coastal upwelling rates exceed 50 m month−1, particles are seeded at monthly intervals in proportion to the upwelling rate. Ensemble maps of particle concentration, age, depth, temperature, salinity and density reveal that a substantial but variable fraction of the particles upwelling off Peru arrives via the Equatorial Undercurrent (EUC). Particles follow the EUC core within the depth range 125–175 m, characterized by temperatures <17 ∘C, salinities in the range 34.9–35.2 and densities of σθ=25.5–26.5. Additional inflows are via two slightly deeper branches further south from the main system, at around ≈3 and ≈8∘ S. Averaged across the hindcast, annual-mean percentages of particles upwelling at 30 m (100 m) associated with the EUC vary from 57.4 % (52 %) at 92∘ W to 19.2 % (17.9 %) at 165∘ W. Considerable interannual variability in these percentages reveals that more of the Peruvian upwelling can be traced back to the EUC during warm events, such as El Niño. In contrast, upwelling waters are of more local origin during cold events such as La Niña. Despite weaker EUC transport during El Niño, relative flattening of the equatorial thermocline brings the EUC upwelling waters much closer to the Peruvian coast than under neutral or La Niña conditions. Annually averaging EUC transport at specific longitudes, a notable negative-to-positive transition is evident during the major El Niño/La Niña events of 1997/99. On short timescales, a degree of longitudinal coherence is evident in EUC transport, with transport anomalies at 160∘ W evident at the Galápagos Islands (92∘ W) around 30–35 d later. It is concluded that the Peruvian upwelling system is subject to a variable EUC influence, on a wide range of timescales, most notably the interannual timescale of El Niño–Southern Oscillation (ENSO). Identifying this variability as a driver of shifts in population and catch data for several key species, during the study period, these new findings might inform sustainable management of commercially important fisheries off northern Peru.
- Article
(19865 KB) - Full-text XML
- BibTeX
- EndNote


A key feature of the tropical Pacific circulation is the Equatorial Undercurrent (EUC) (Cromwell et al., 1954; Knauss, 1959; Lukas, 1986). The EUC originates in the western equatorial Pacific, just north of Papua New Guinea, as an eastward thermocline flow in the depth range 180–280 m at 147∘ E. The EUC strengthens eastward (Bryden and Brady, 1985; Tsuchiya et al., 1989; Johnson et al., 2002), reaching peak velocity and transport at around 140∘ W (Knauss, 1958, 1959), in a core located within ≈3∘ N and 3∘ S of the Equator (Blanke and Raynaud, 1997; Johnson et al., 2002; Brown et al., 2007). Near the Galápagos Islands, the EUC core shifts to around 0.5∘ S (Kessler, 2006; Karnauskas et al., 2010, 2020) before strengthening again towards the eastern boundary (Lukas, 1986; Johnson et al., 2002), where it feeds major currents along the western South American coastlines of Ecuador, Peru and Chile (Lukas, 1986; Karnauskas et al., 2010; Montes et al., 2010). The EUC is located at the depth of the equatorial thermocline, which varies seasonally across the Pacific (Johnson et al., 2002), leading to seasonality in EUC core velocity. This subsurface flow plays a crucial role in regional climate and biogeochemistry, through substantial transport of nutrient and carbon-rich cold water to the surface, feeding the so-called “cold tongue” upwelling region (Chavez et al., 1998; Pennington et al., 2006; Chavez and Messié, 2009; Qin et al., 2015; Wang et al., 2019).
Around the global coastline, wind-driven upwelling results in high nutrient supply to the surface layer, enhancing primary production where light and nutrient levels are optimal. At the eastern boundary of the Atlantic and Pacific basins in each hemisphere, the “big four” upwelling systems – Benguela, California, Iberia/Canary and Chile/Peru – are the most active in the world, accounting for approximately 12 out of 17 million metric tons of marine fish catch between 2000 and 2007 (representing 20 % of the global catch taken over an area of less than 1 % of the global ocean) according to FAO (Chavez and Messié, 2009). Of the big four, the Peruvian part of the Peru/Chile system presents the highest average volume of upwelled waters (1.6 Sv), even though upwelling-favorable winds are the weakest on average (5.7 m s−1) (Chavez and Messié, 2009; Kämpf and Chapman, 2016).
Peruvian upwelling is dynamically linked to the EUC, itself a subsurface consequence of equatorial surface flows that are driven by easterly trade winds, pushing surface water to the west along the Equator in the South Equatorial Current and creating a pressure head in the western Pacific. Beneath this wind-dominated surface layer, where the Coriolis effect disappears at the Equator, an eastward pressure gradient drives water back to the east within the EUC, which shoals across the basin from around 250 m in the west to reach the surface in the east (Knauss, 1959; Johnson et al., 2002).
This equilibrium is interrupted as the trade winds weaken or reverse (specially west to 155∘ W) under El Niño along with considerable flattening of the thermocline (McPhaden, 1999), seen in historical model simulations (Terada et al., 2020) and moored buoys (Kessler and McPhaden, 1995). Associated with El Niño are changes in the quantity and properties of upwelled waters off Peru. For instance, in the 1982–1983 and 1997–1998 El Niño events, principal fisheries such as the Peruvian anchovy, Peruvian hake and others collapsed, due to migration and dispersion of the biomass in the region (Ñiquen and Bouchon, 2004; Tam et al., 2006; Wolff et al., 2007). Total pelagic fish landings decreased from 3.3 million tons in 1982 to 1.4 million tons in 1983 and to almost zero in 1984, as catch species transitioned to sardine (Wolf and Tarazona, 1989) and others such as Jack mackerel and Pacific mackerel (Ñiquen and Bouchon, 2004).
In the present study, we address the origin and nature of the upwelled waters of one of the most productive upwelling systems in the world. We specifically address the role of the EUC in Peruvian upwelling, relative to local wind-driven coastal upwelling in the zone at 5–10∘ S. We aim to quantify absolute and relative changes in the provenance of waters upwelling off northern Peru, to establish the extent of interannual variability and links to El Niño–Southern Oscillation (ENSO) events. We investigate how El Niño and La Niña conditions thus modulate the Peruvian upwelling system. Central to our analysis is an ocean model hindcast spanning 1988–2007. We use a combination of Eulerian and Lagrangian diagnostics, the latter to track upwelling water backwards through time on annual timescales.
In the following, Sect. 2 describes the methodology used along with brief specifications of the numerical model and hindcast, and details of our diagnostics. In Sect. 3, we present a range of results, to illustrate variability in the source of upwelling waters and in the EUC itself. In Sect. 4, we summarize and discuss our findings in relation to previous studies. In conclusion, in Sect. 5, we emphasize the consequences of El Niño and La Niña for the EUC, Peruvian upwelling and associated marine ecosystems.
We first describe the model that provides the hindcast data needed for the Lagrangian analysis, EUC transport calculations and diagnostics of coastal upwelling, which are subsequently outlined.
2.1 Model description
We sample 5 d averages of temperature, salinity and velocity from a hindcast spanning 1988–2007, previously obtained with the Nucleus for European Modelling of the Ocean (NEMO) ocean model (Madec, 2008) in eddy-resolving global configuration (ORCA12), henceforth NEMO-ORCA12. For details of parameterization, initialization and forcing of this hindcast, see Blaker et al. (2015). The model has a horizontal resolution at the Equator of ∘ (9.277 km), with 75 vertical levels from the surface up to 5902 m depth, alongside finer grid spacing near the surface (38 levels from 0 to 411 m). The region of focus in this study is the eastern tropical Pacific, extracted as the region from 170 to 75∘ W and from 5∘ N to 10∘ S, for the purposes of particle trajectory calculations. An advantage of using fields from a fully global model is that remote influences on the region of interest are fully represented rather than prescribed at the boundaries in a regional model, which can be problematic. The high-resolution NEMO-ORCA12 hindcast is evaluated with observations from three moored NOAA buoys from the surface up to 400 m depth along the equatorial Pacific.

Figure 1Representation of particles “seeded” (initial positions) off Peru and Ecuador at 30 m depth (red dots) and 100 m depth (blue dots) for upwelling rates exceeding m s−1 (50 m month−1) in the region bounded by 10∘ S, 82.5∘ W, and the Equator, in this particular case for 1997 and 1998. Particles were released at the end of each month in December–January, for each year, over the period 1988 to 2007. Consider that the initial particles here represented as blue and red dots are overlapping each other, although 30 m released depth is in the front, while 100 m released depth is in the background, respectively.
2.2 Lagrangian analysis
To efficiently analyze the provenance of water upwelling off the Peruvian coast of NEMO-ORCA12, we use the ARIANE Lagrangian code, based on the original method of Blanke and Raynaud (1997). This mass-preserving numerical Lagrangian approach has proved to be an appropriate method for studying the origin and fate of water masses in a wide range of studies (Doos, 1995; Blanke et al., 2002). Ensembles of particles are “seeded” in the coastal upwelling zone off Peru, defined here east of 82.5∘ W, from 10∘ S to the Equator. These particles are then tracked in “backward” mode, reversing in time the analytical calculation of particle progress through grid cells, to reveal a range of pathways.
We allocate particles in proportion to upward vertical velocity where this exceeds a threshold of 50 m month−1 ( m s−1). We specifically allocate one particle per 10 m month−1 of upwelling in excess of the threshold, per grid cell. For example, in the simple case that upwelling is 90 m month−1, the excess upwelling rate is 40 m month−1, so we allocate four particles to this grid cell. Initial locations were evenly located within grid cells on the 5 d ORCA12 mesh.
A variable number of particles are released at three “release depths”, model levels closest to 30, 50 and 100 m, at monthly intervals throughout 1989–2007. Note that for releases during a given year, particles sample currents over 2 years, across a calendar-year boundary. For instance, if we backtrack particles throughout 1997, particles sample currents throughout 1996 and 1997. In analyzing Lagrangian data for releases through a given year (e.g., 1997), we aggregate the data across all 12 months of releases and refer to the experiment accordingly (e.g., 1996/97). The number of backtracked particles ranges from 38 292 (at 30 m in 1998) up to 98 951 (at 30 m in 2005). Calculations based on initial upwelling at 50 m release depth were relatively similar to those at 30 m release depth, so we show results for 30 and 100 m release depths only. For examples of the initial positions of particles at both release depths, in Fig. 1 we illustrate seeded particles for the cases of 1997 and 1998.
Particles were released on the last day of each month (December–January) for each year and followed back in time, to sample interannual changes in 3-D pathways and water properties (temperature, salinity, potential density) of consequence for Peruvian upwelling. Particle data were statistically analyzed on a grid of resolution to quantify particle “concentration” as a fractional particle presence in log−10 scale, dividing the number of particle occurrences passing through each grid cell by the total number of particles occurrences during the course of the year.
For an average representation of main pathways in the study region, we computed a “grand ensemble” for the entire data set of 1989–2007 (for the 30 and 100 m release depths). Alongside particle concentration, we also average particle age, depth, salinity, temperature and potential density on the grid, providing further context for interannual variability of inflow to the Peruvian upwelling system. Then, given the initial (total) number of upwelled particles off Peru (where upwelling exceeds 50 m month−1) and the total number of particles crossing specific locations along the equatorial Pacific, we calculate a percentage recruitment from the EUC (3∘ N–3∘ S) west to east for further yearly comparisons.
2.3 Pathways and transport
Informed by the Lagrangian analysis, we also compute EUC volume transport by integrating eastward flow between 3∘ N to 3∘ S, encompassing most particle trajectories, and in agreement with previous studies (Blanke and Raynaud, 1997; Johnson et al., 2002; Brown et al., 2007), at selected longitudes from 165 to 92∘ W, every 5∘ from 165–95∘ W, and at 92∘ W, respectively. Naturally accommodating EUC flow along shoaling isopycnals, we specifically compute transport binned in potential density, σθ, in the range σθ=23.0–27.0, at intervals of σθ=0.1, using the NEMO “CDFTOOLS” diagnostic routine “cdfsigtrp” (see https://github.com/meom-group/CDFTOOLS, last access: 30 November 2020). We thus assemble time series of 5 d averaged EUC transport in density space at the selected longitudes to get time series of monthly averages and anomalies.
2.4 Diagnostics of coastal upwelling
Finally, to evaluate the contribution of local winds to the coastal upwelling, Ekman flux and upwelling flux were calculated. We sample 5 d averages of vertical velocity east of 82.5∘ W longitude and between 5 to 10∘ S (avoiding the near-Equator zone) at 30 m, where this exceeds 50 m month−1. With the area integration, we thus obtain the upwelling flux in units of Sv. Then, to estimate the wind-driven component of coastal upwelling, we calculate zonal Ekman transport (Mx) associated with the meridional component of wind stress (τy) at each coastal grid point, per ∘ of latitude, as , where f is the Coriolis parameter and ρ is a representative density for seawater (1026 kg m−3). Multiplied by meridional grid-cell length ( km), we obtain offshore transport in units of Sv that is proportional to coastal upwelling, satisfying continuity of volume. Summed in the same latitudinal range (avoiding low values of f equatorward of 5∘ S), we thus obtain a monthly index of wind-driven coastal upwelling by averaging the 5-daily index.
We begin with a brief evaluation of the NEMO-ORCA12 hindcast in our study region. We then provide an overview of the Lagrangian calculations before we focus on the pathways followed by water upwelling off Peru and variation in the source and transport of these waters. We then consider variability in the wind-driven component of upwelling, concluding with analysis of EUC transport anomalies along the Equator.
3.1 Evaluation of NEMO-ORCA12 hindcast in the equatorial Pacific
To establish whether the NEMO-ORCA12 hindcast realistically simulates the equatorial Pacific circulation, we extract vertical profiles of the monthly mean velocities from the model at longitudes along the Equator (170, 140 and 110∘ W) corresponding to observational data from NOAA acoustic Doppler current profilers (ADCPs), as shown in Fig. 2. The principal eastward subsurface (e.g., EUC) and westward surface currents (e.g., South Equatorial Current – SEC), as described in previous studies (Cromwell et al., 1954; Knauss, 1959; Lukas, 1986; Johnson et al., 2002), are clearly reproduced by NEMO-ORCA12. Shoaling of eastward-flowing core of the EUC towards the Galápagos Islands can be well identified between 50 and 200 m depths with velocities higher than 0.5 m s−1 in most of the sections shown in Fig. 2. At 140 and 110∘ W, the EUC core is seen at around 50 to 150 m, with values notably higher than 1 m s−1. The highest core velocity along the Equator is found at 140∘ W longitude in this comparison.
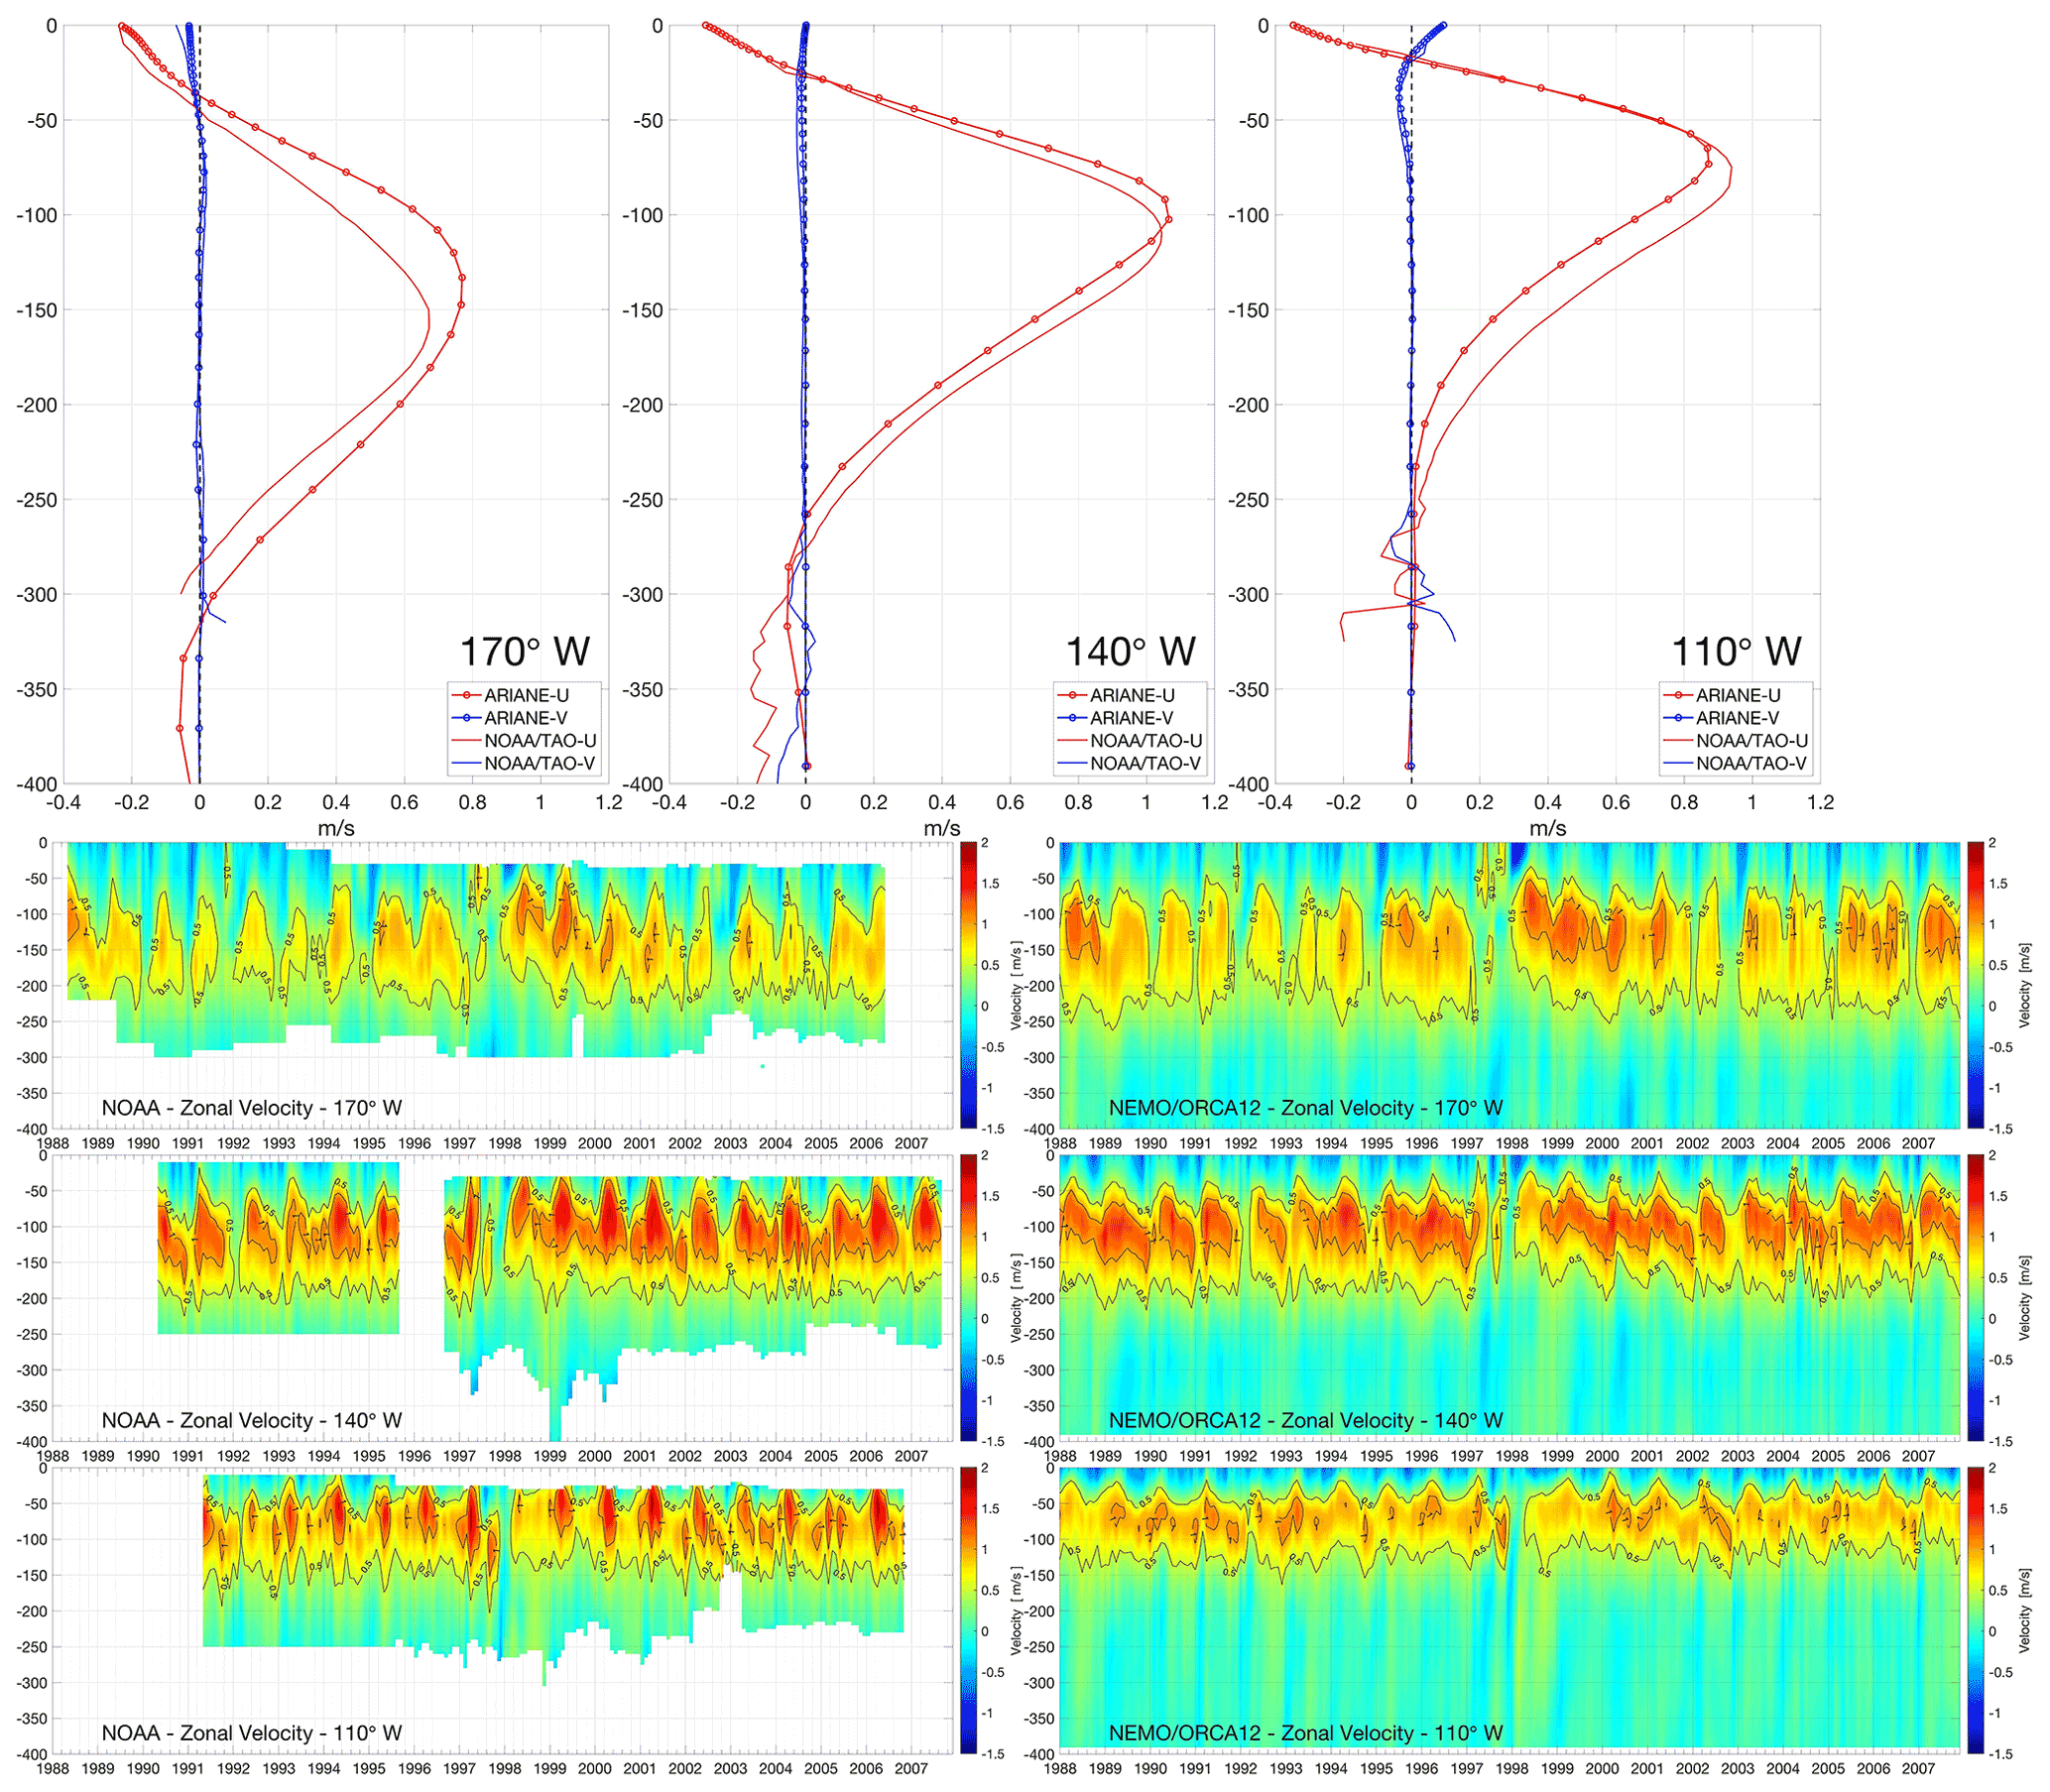
Figure 2Vertical profiles for zonal and meridional velocity components (red and blue, respectively) averaged over 1988–2007 (first top panel), and monthly vertical sections for zonal velocity component (bottom panels, contour lines highlight 0.5 and 1.0 m s−1) in the NEMO-ORCA12 hindcast and NOAA mooring at 170, 140 and 110∘ W longitudes, respectively.
3.2 Upwelling rates and backtracking at annual timescales
We define the upwelling off the northern Peruvian coast where upward advection exceeds m s−1 (50 m month−1), for each release depth in the water column, chosen to sample upwelling over a depth range typical of the Peruvian upwelling system (Kämpf and Chapman, 2016). To illustrate vertical velocities at two of our chosen depths, monthly NEMO-ORCA12 climatologies (1988–2007) at 33 and 100 m are presented in Figs. 3 and 4, respectively (we have used here 33 m, as the model level closest to 30 m).
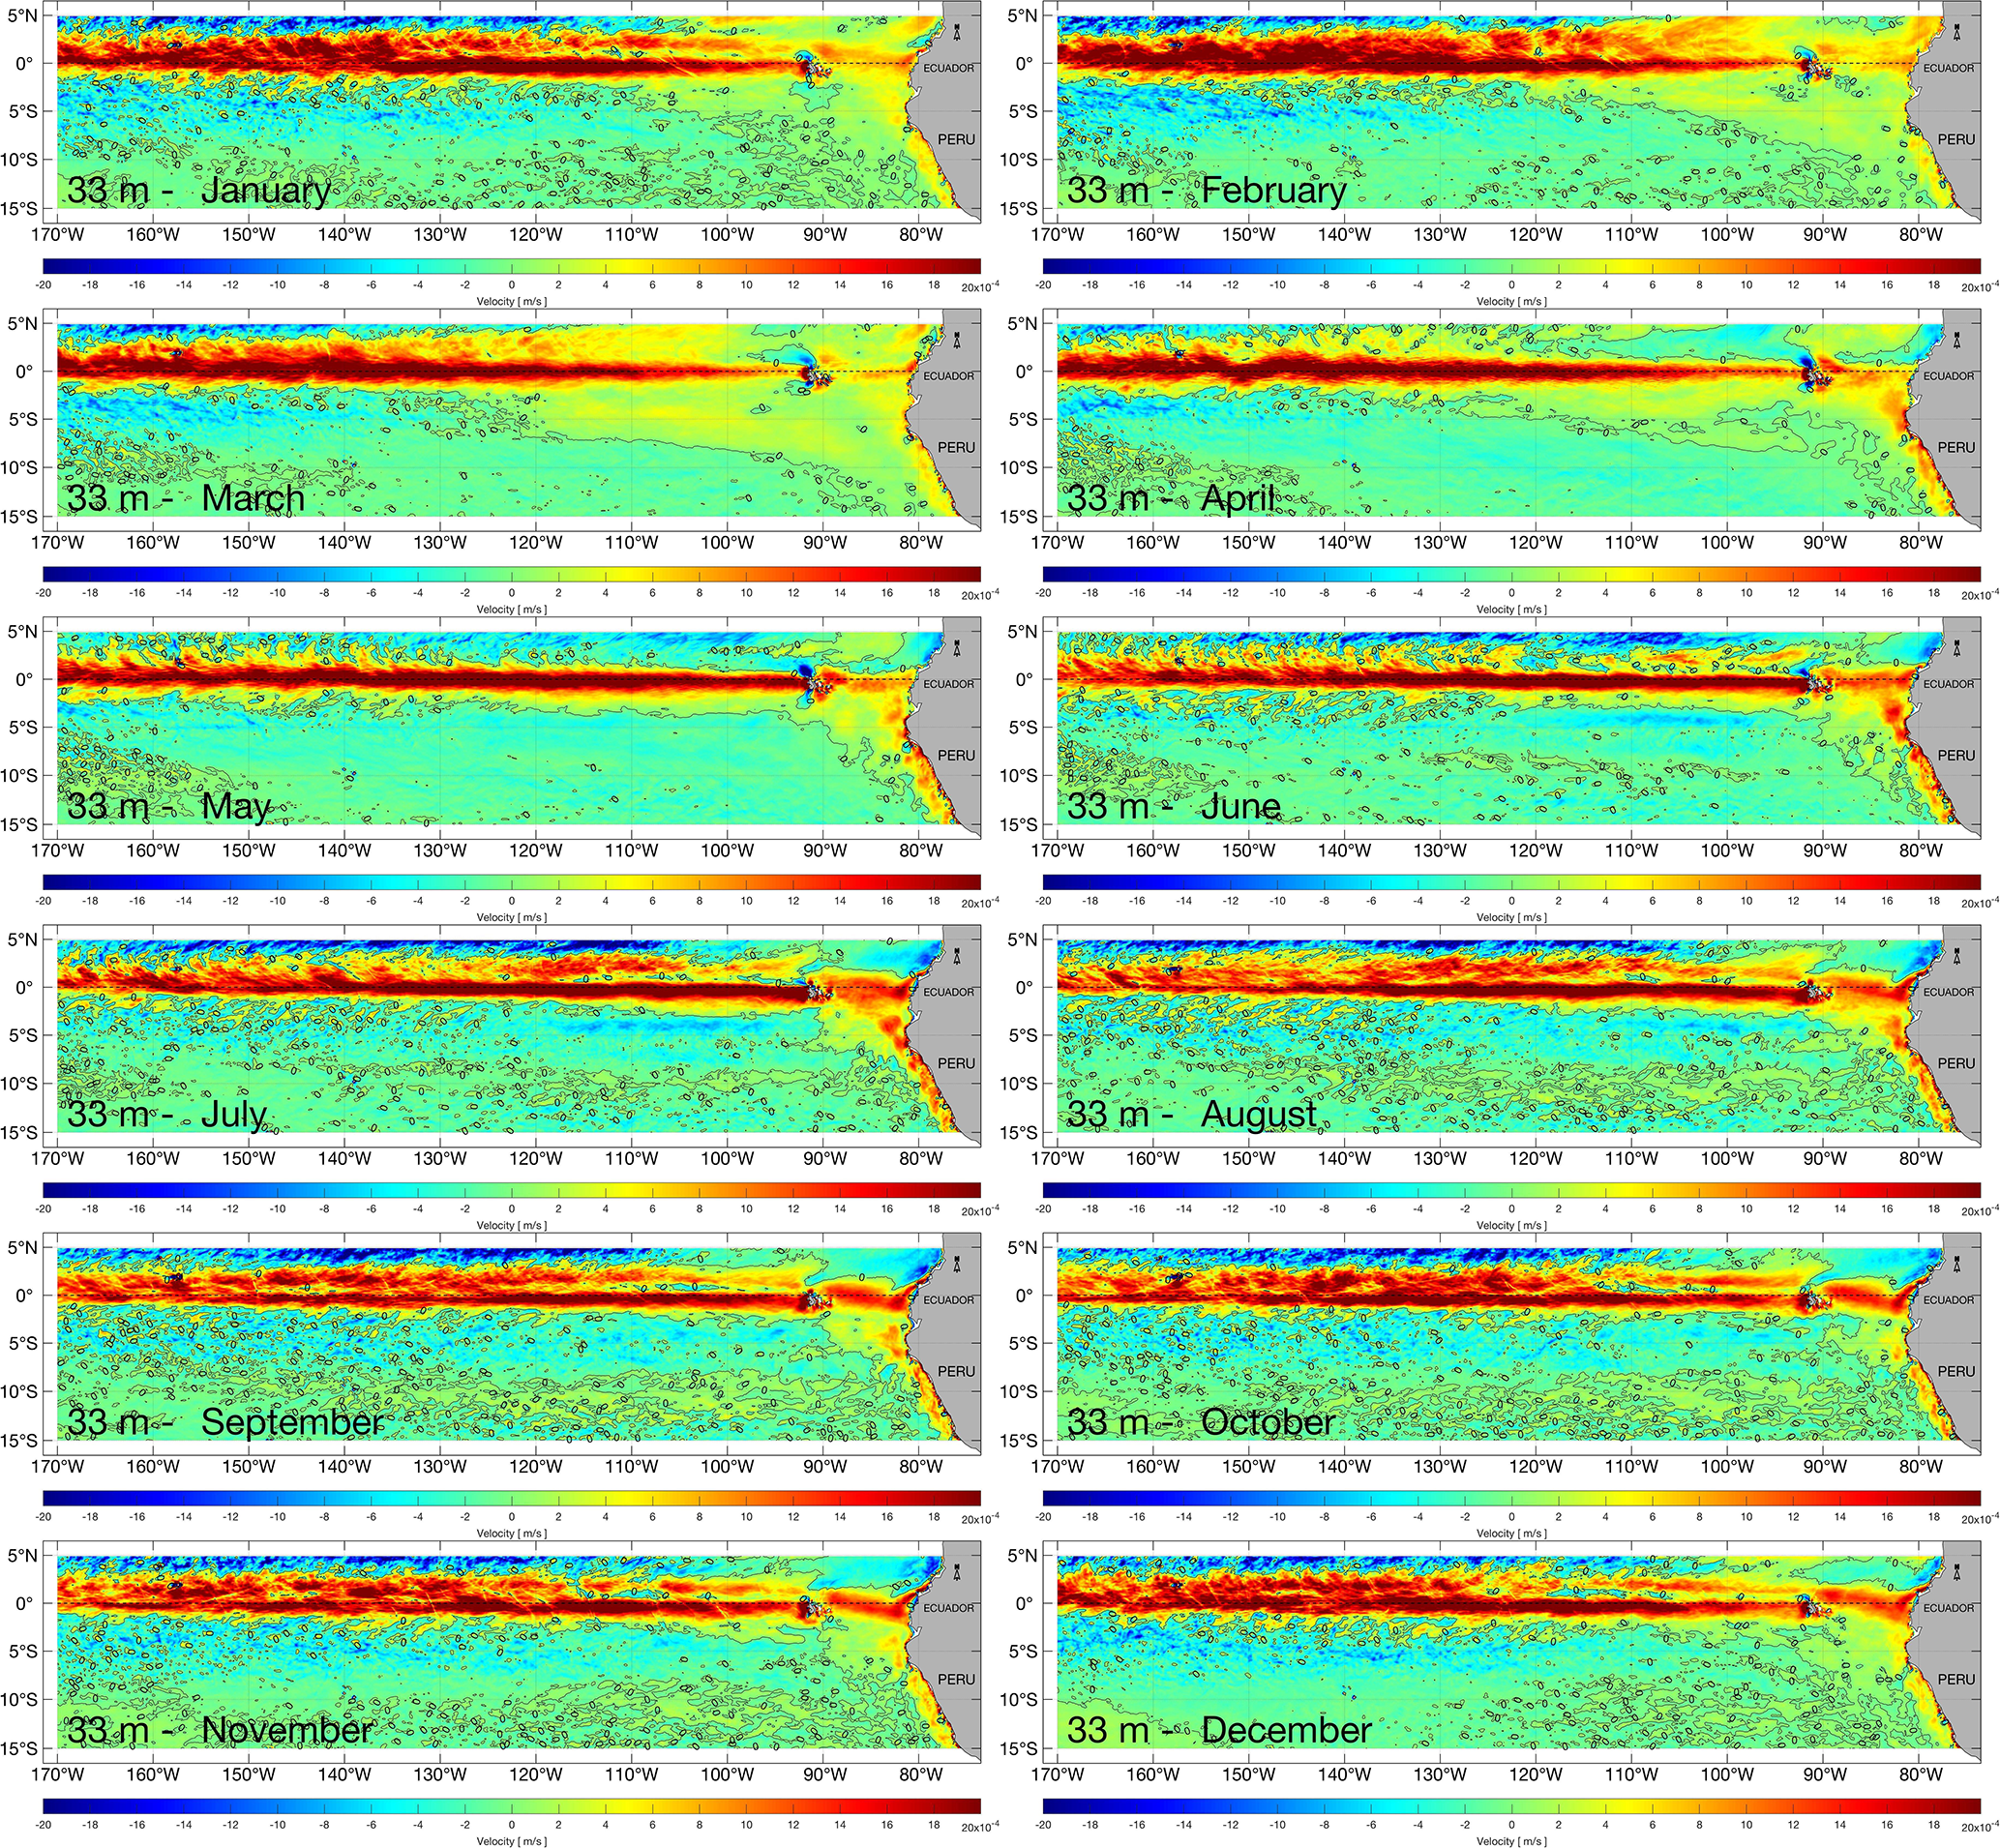
Figure 3Monthly climatology (averaged over 1988–2007) of vertical velocity at a depth of 33 m in the eastern Pacific from the NEMO-ORCA12 hindcast.
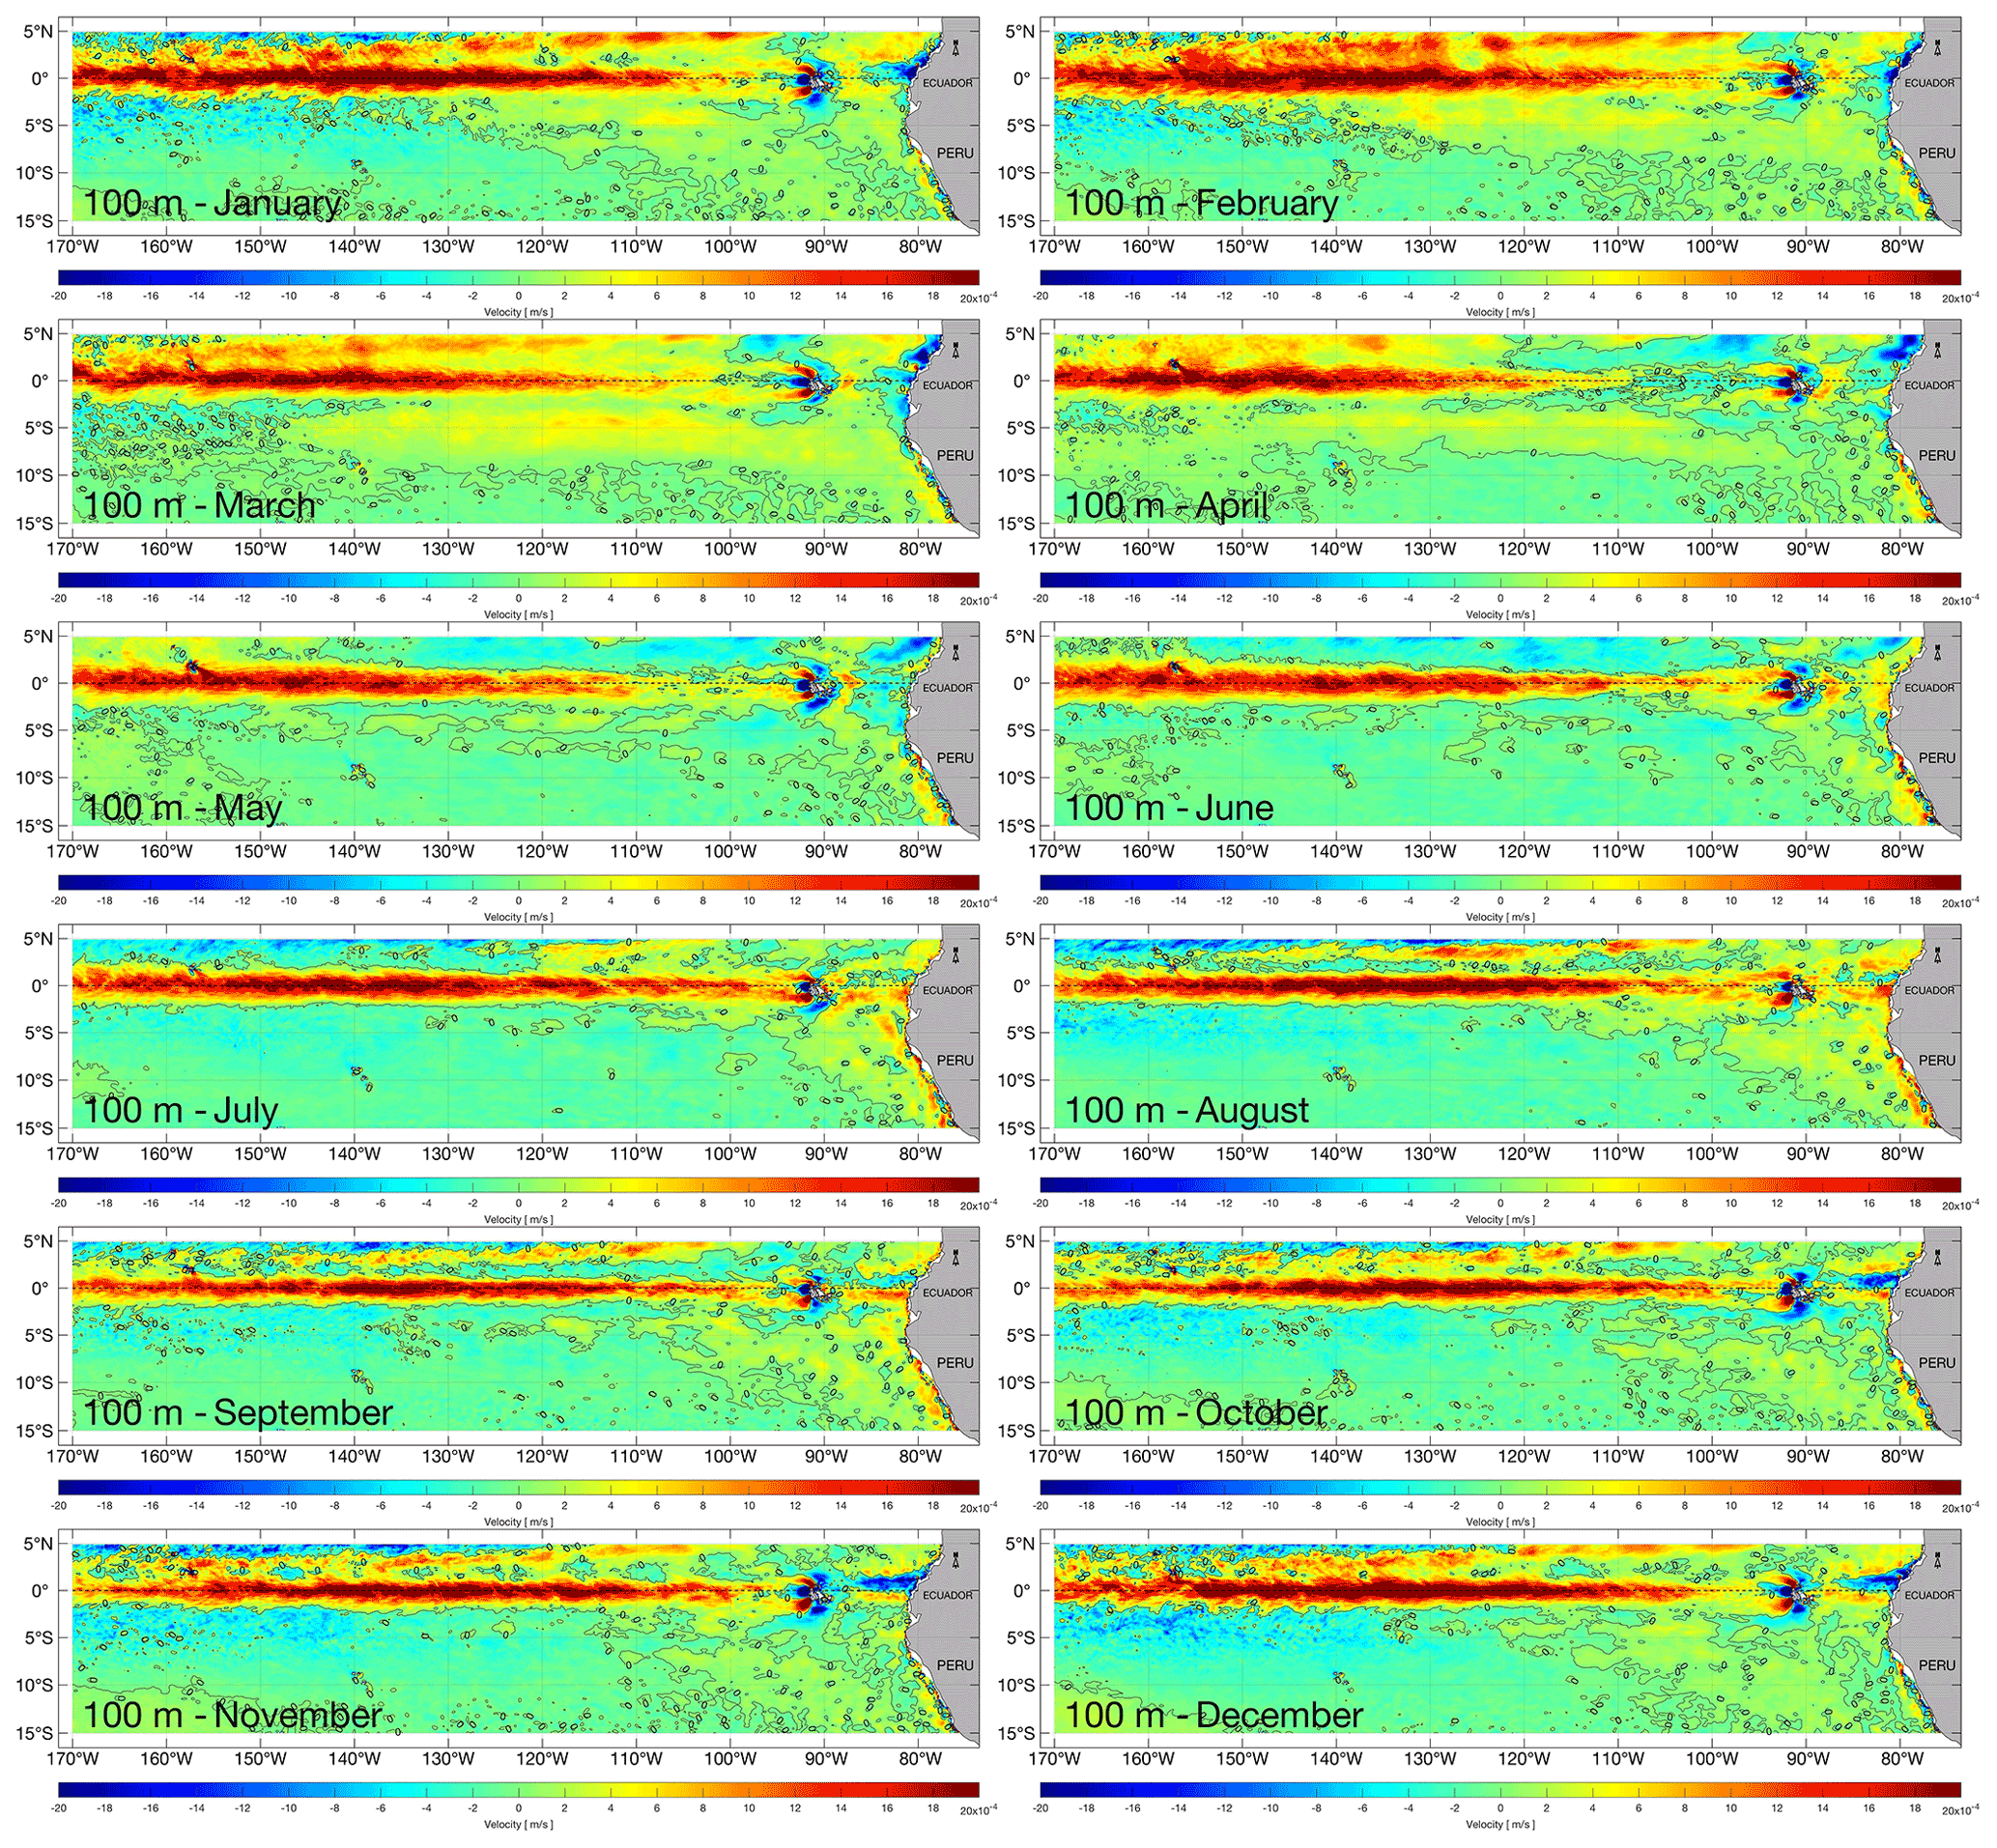
Figure 4Monthly climatologies (averaged over 1988–2007) of vertical velocity at a depth of 100 m in the eastern Pacific from the NEMO-ORCA12 hindcast.
Monthly upward velocities are elevated along both the equatorial upwelling region and off the Peruvian coast, with clear seasonal variability. During austral summer (December–January–February), upwelling is stronger and more widespread north and south of the Equator and slightly weaker off Peru. During austral autumn (March–April–May), equatorial upwelling is characterized as a narrower zone (restricted equatorward of 3∘), with higher values towards the east; off Peru, stronger upwelling is evident, compared to summer. During austral winter (June–July–August), strong upwelling extends across the easternmost equatorial region (140∘ W to the Galápagos Islands) and off Peru, when southeast trade winds are seasonally stronger.
A notable difference is evident in the 100 m analysis, with downwelling stronger around the Galápagos Islands and near the Ecuadorian coast. This is also consistent with the climatology rates calculated for the upwelling and Ekman coastal fluxes, peaking during austral autumn and winter seasons and reduced during austral summer season (when also winds are weakest), as forced by the meridional component of the wind stress along the north-central Peruvian coast.
Returning to particles released off Peru, for most years (notably 1991, 1997 and 2004 – not shown), we observe a westward origin for some particles, from the Galápagos Islands via the Equator. This is consistent with eastward shoaling of the EUC (around 75 m). However, in other years, particles originate from a northern shallower region, in the vicinity of the Ecuadorian coast (e.g., 1988, 1989 and 1990 – not shown). For particles initialized at 100 m, we observe a similar pattern of inflow at greater depths (around 125 m), although with a clearer origin from the equatorial band and Southern Hemisphere, this can also be observed in the grand ensemble.
3.3 Mean pathways at annual timescale
As outlined in Sect. 2.2, particle concentration and mean age maps are obtained on a mesh for each year from 1989 to 2007, further averaged to obtain the “grand ensemble” results for 30 and 100 m release depths that are shown in Fig. 5, right and left panels, respectively. Tracking backwards, Fig. 5a–f show the corresponding particle concentration, age, depth, temperature, salinity and potential density (σθ) distributions, for flows feeding the upwelling source water off Peru.
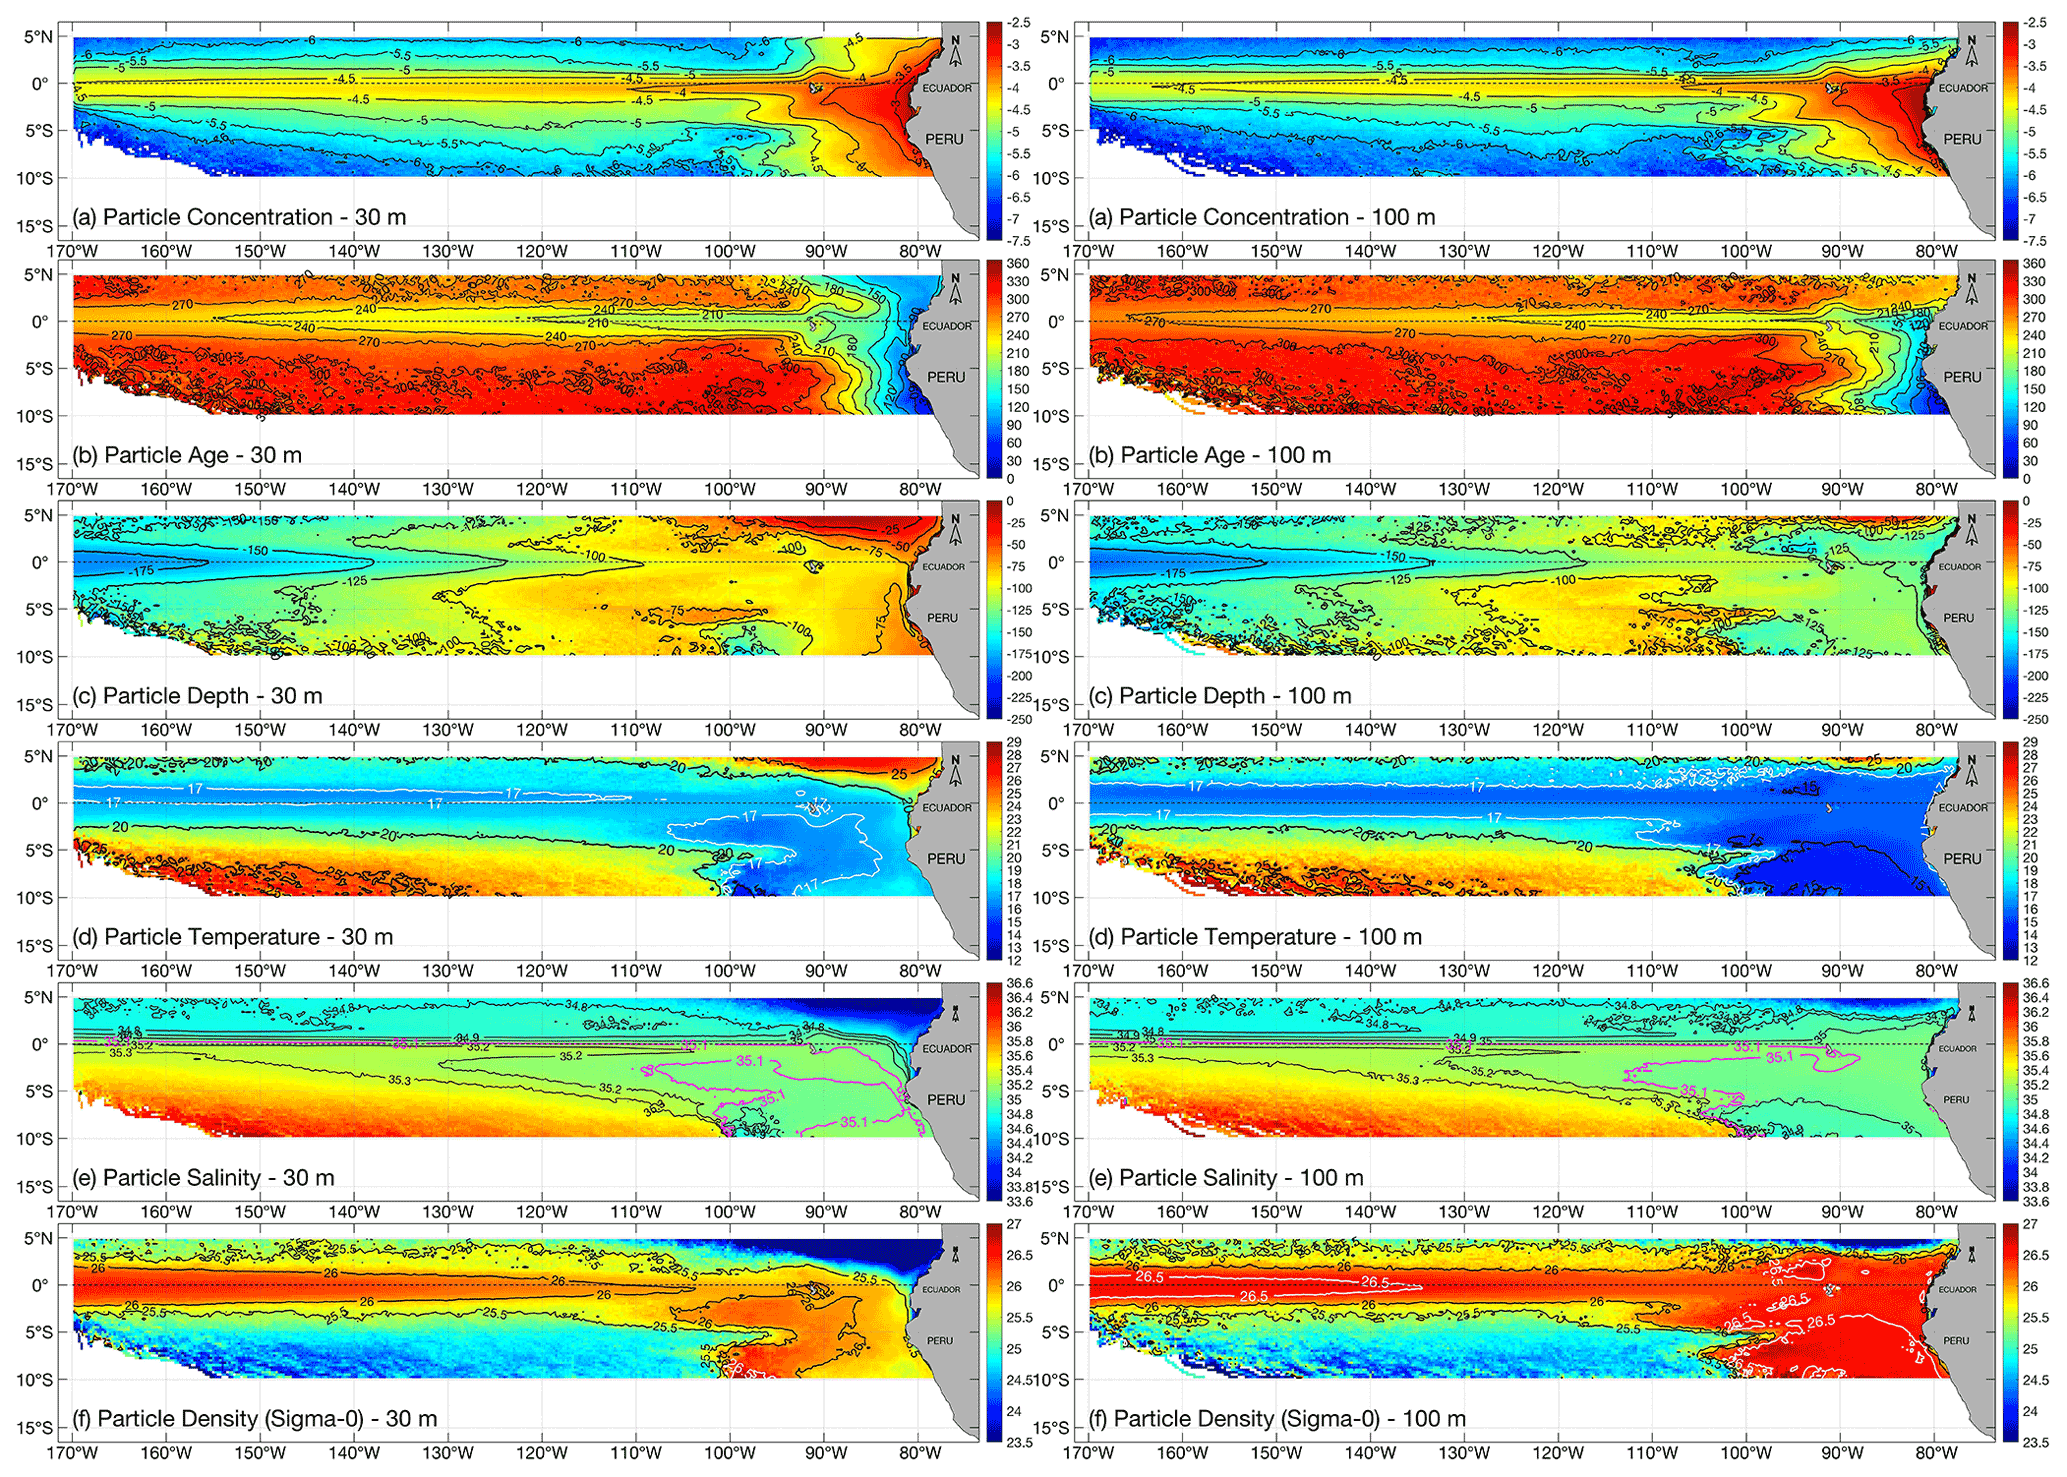
Figure 5Grand ensemble of back-trajectory data (averaging the 1989–2007 ensembles), for particles backtracked at the end of each month (December–January) at 30 m depth (left panel) and 100 m depth (right panel) respectively, binning at resolution: (a) particle concentration (calculated as a fractional particle presence in log-10 scale, by dividing the number of particle occurrence passing through each grid cell by the total number of particles occurrences during the course of the year); (b) particle age (color bar represents days from 0 to 365 prior to upwelling); (c) particle depth (m); (d) particle temperature (∘C); (e) particle salinity (psu); (f) particle potential density (σθ, kg m−3).
We use a logarithmic scale for particle concentration to emphasize a particularly wide range of this diagnostic (in Fig. 5a, red represents high concentration, while blue colors indicate low concentration on average). Mean particle age (Fig. 5b) is expressed in days backtracked, so for end-of-December releases, day 0 to day 365 runs from 31 December back to 1 January.
In Fig. 5a and b (left and right), highest particle concentration and youngest age (transit time range between 0 and 120 d) are naturally located near the release points in both experiments. Backtracked particles are located near the Galápagos Islands 2 months prior to arrival at the outer limit of coastal upwelling (noting mean age increases from 120 to 180 d), with relative higher concentrations before further back conveyance along the equatorial band. As particles are traced westward, high concentrations along ≈3∘ N to 3∘ S are associated with subsurface eastward flow of the EUC, widening slightly west of the Galápagos Islands. Particle concentration rapidly declines further south and north of 3∘ to the west of 110∘ W, although we note patches of relatively higher concentrations forming two branches in the southeast of our region.
Inflows from 30 m release depth remain at a relatively shallow depth (above ≈75 m) during the first 150–180 d (Fig. 5c, left panel) described by the isotherms of 17–20 ∘C and isohalines between 34.9 and 35.1 along σθ=25.5–26.0 isopycnals (Fig. 5d and e, left panels). Near the eastern boundary particles upwelling across 100 m are traced to depths below 125 m, around 60–90 d prior to upwelling, but particles backtracked into the EUC remain in the mean depth range 100–125 m from the Galápagos Islands to around 120∘ W. In this region, particles were characterized with temperatures in the range 15–17 ∘C and salinities around 35–35.1 along isopycnals σθ=26.0–26.5 (Fig. 5f, right panel).
West of the Galápagos Islands, after 210 d of backtracking in both experiments, particles lie at greater depth (below 125 m) where particle concentration is the highest. Along the EUC core, between ≈2∘ N to ≈2∘ S, temperatures fall below 17 ∘C (Fig. 5d, left and right panels) and salinities lie in the range 34.9–35.2 (Fig. 5e, left and right panels), combining for a σθ>26.0 isopycnal (Fig. 5f, left and right panels) and populating the isopycnal surface around σθ=26.5 for the deeper release depth.
As previously mentioned, two relatively deep branches (Fig. 5a, left and right panels), in agreement with previous studies (Lukas, 1986; Johnson and Moore, 1997; Donohue et al., 2002; Montes et al., 2010; Kuntz and Schrag, 2018), are identified further south of the main equatorial system. Along ≈3 and ≈8∘ S (Fig. 5a, left and right panels), more clearly distinguished with potential density (Fig. 5f) for the deeper release depth experiment. From both release depths, these southern branches are associated with higher density (e.g., in the case of 100 m release depth), with the southernmost branch (≈8∘ S) carrying the densest inflow and the northern branch (≈3∘ S) at somewhat lower density (i.e., Fig. 5f, left panel).
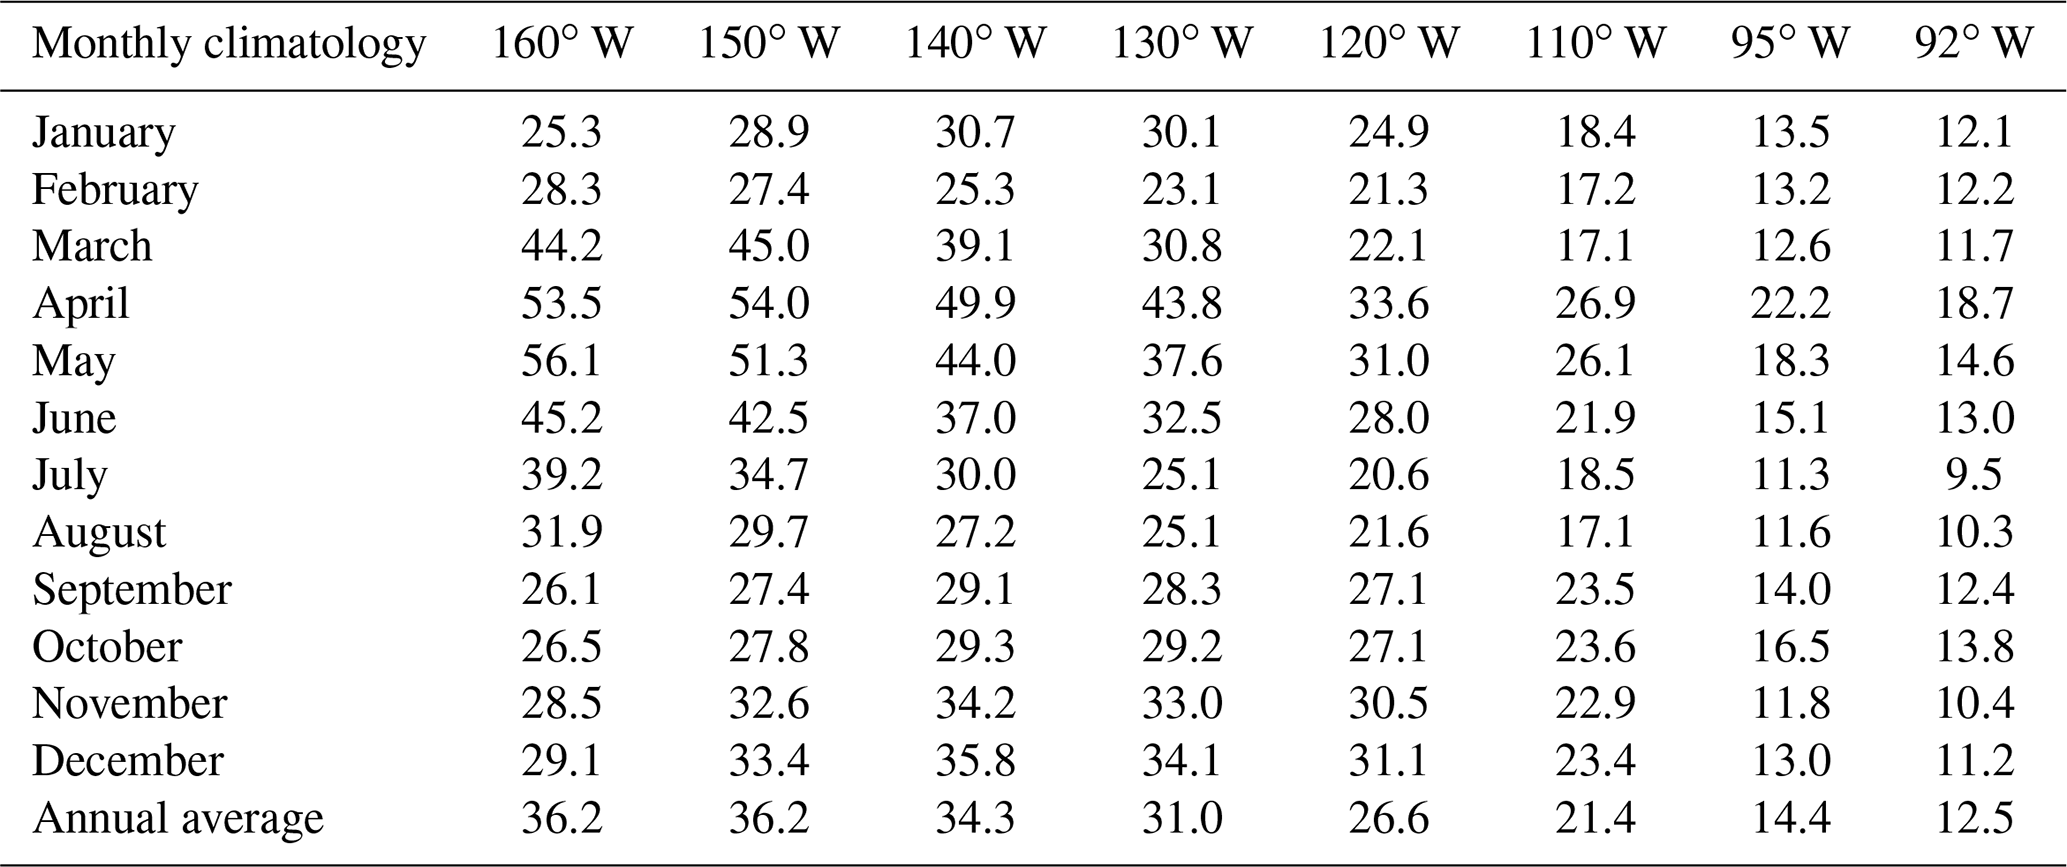
Our results suggest that these branches are likely associated with a bifurcation of the EUC, to the west of the Galápagos Islands as previous studies have highlighted (Johnson et al., 2002; Karnauskas et al., 2010; Jakoboski et al., 2020). This source of Peruvian water masses in the upwelling region is thus directly modulated by the EUC, when the latter is at its strongest; this may be particularly the case from April to June, when EUC transport processes reach maxima (Table 1). We will return to this point in the following section.
Table 1Monthly climatology (from 5 d averaged data from 1988 to 2007) and annual average for the EUC transport (Sv) at 160, 150, 140, 130, 120, 110, 95 and 92∘ W.
Regarding the denser southern branch (≈8∘ S, left panels for Fig. 5d–f) traced by those particles released at 30 m, our experiments indicate that the high density is coincident with high salinity rather than low temperature (>35.1, 17 ∘C or less, and σθ=25.5–26.5). Somewhat different characteristics were found for particles released at 100 m (right panels for Fig. 5c–f), for which temperature is a more dominant influence on density.
3.4 EUC transport across the eastern Pacific and the variable EUC contribution to Peruvian upwelling
Backtracked trajectories from the released particles off Peru revealed that a substantial proportion of water masses are recruited from the main EUC system, traveling along the equatorial Pacific for around 10 000 km (from 170 to 80∘ W) before reaching the Peruvian upwelling region. Integrated positive transport across density classes shows a longitudinal–seasonal EUC flow variability when averaging over 20 years from 1988 to 2007 (Table 1 and Fig. 6). In the first half of the study region between 160 and 135∘ W, EUC transport peaks from March to June with average values >36.2 Sv. Maximum values during April–May are almost double the annual average of 36.3 Sv. East of 135∘ W, EUC transport tends to peak during April–June (see Table 1), consistent with observational data (Johnson et al., 2002). Climatological EUC transport tends to decrease from August to December across the whole region.
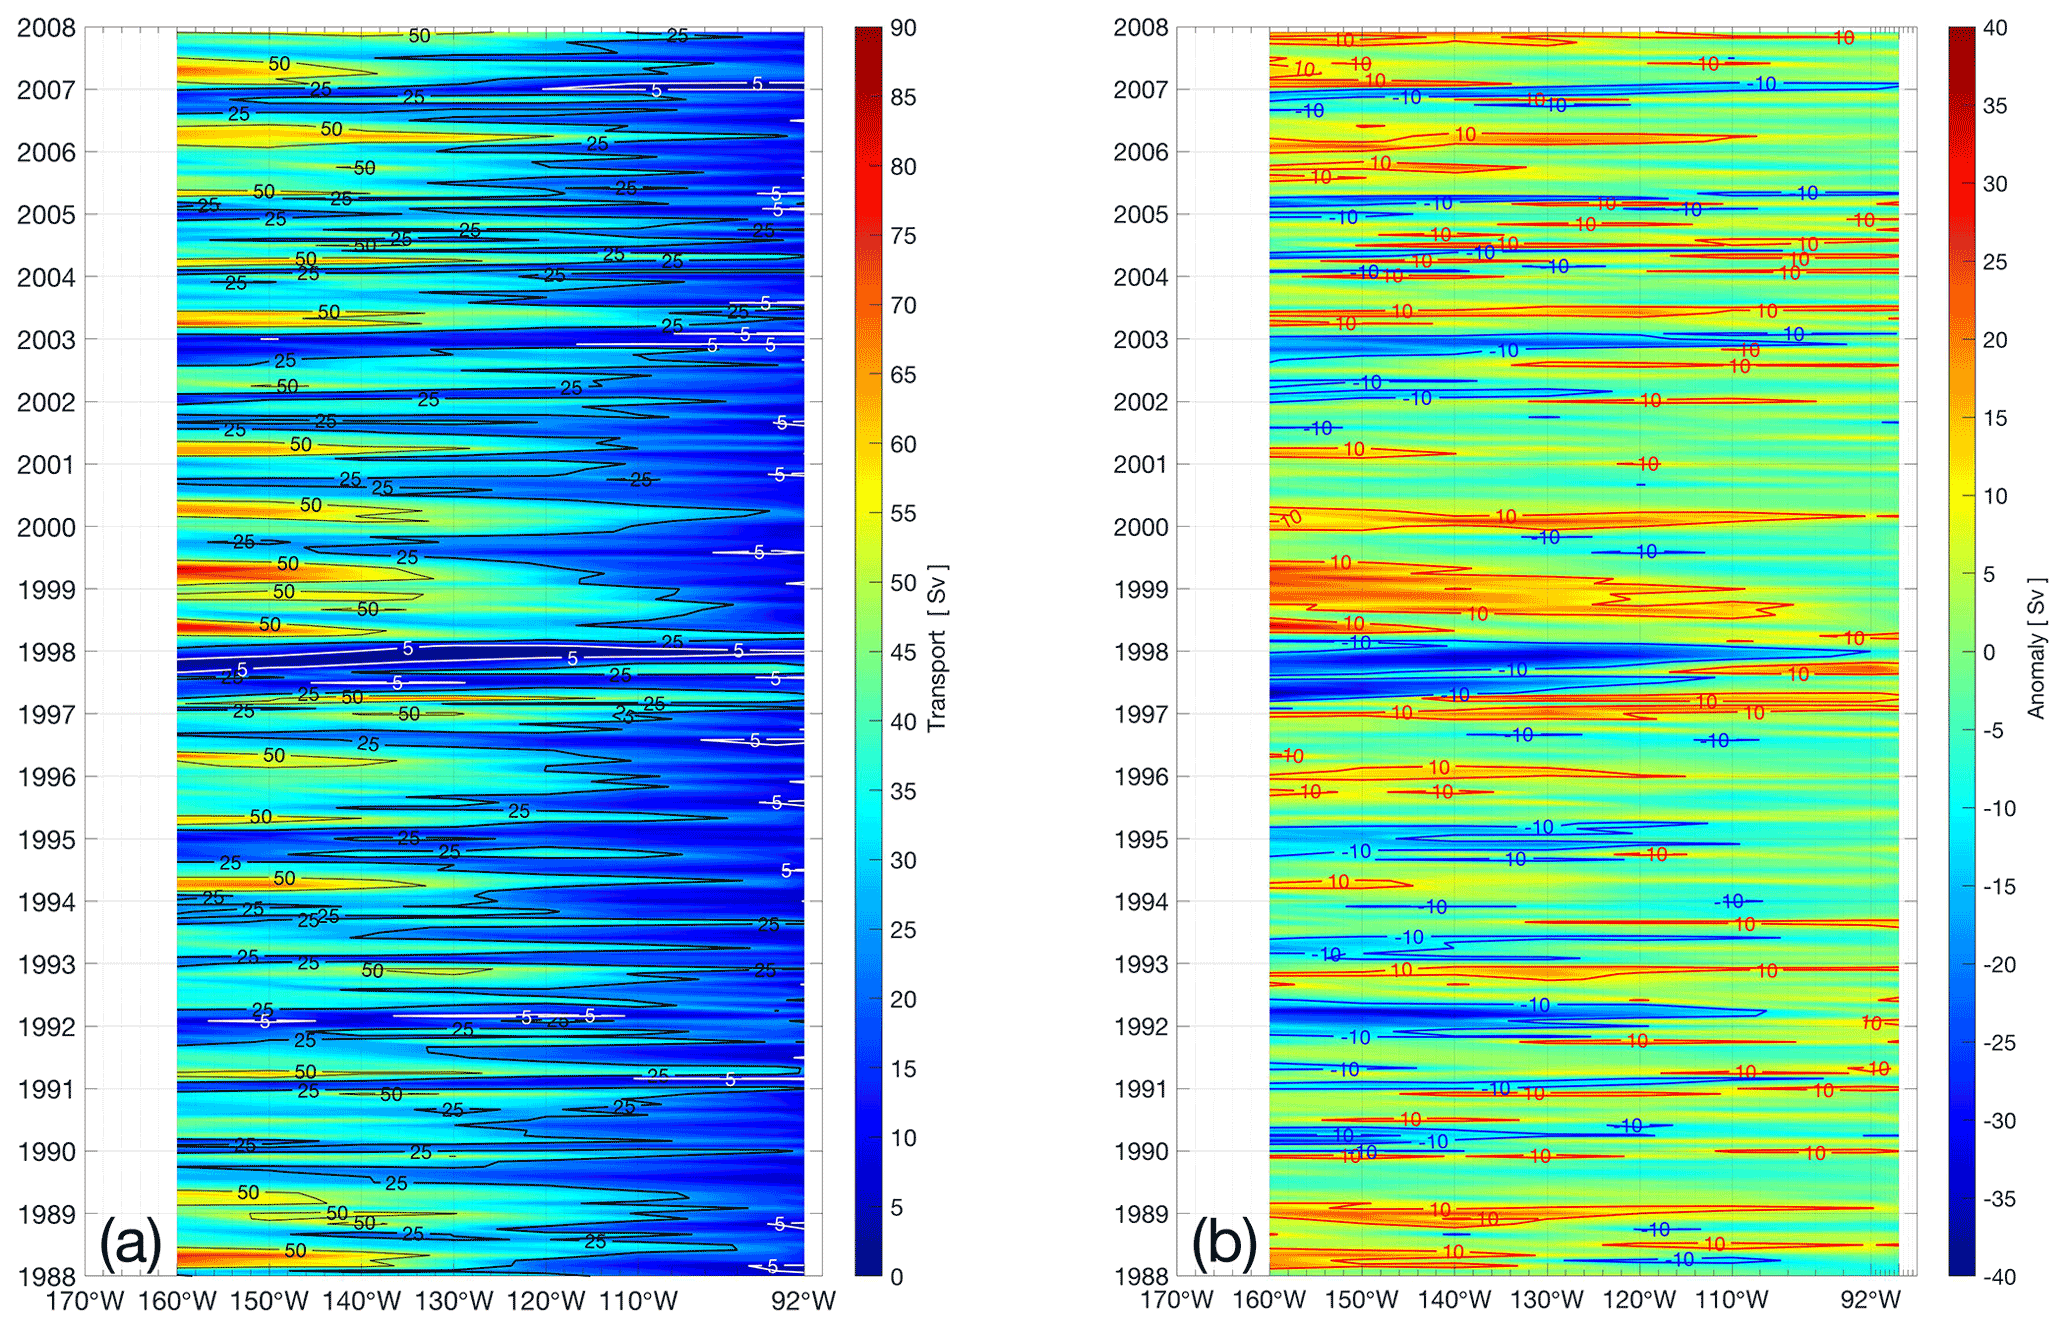
Figure 6Integrated EUC transport based on calculations at 160, 150, 140, 130, 120, 110, 95 and 92∘ W (Galápagos Islands), in the latitude range 3∘ N–3∘ S where the concentration of particles backtracked is the highest: (a) monthly averages; (b) monthly anomalies.
This variability underpins transport of energy and other properties from the western Pacific to the Peruvian upwelling region. For instance, using Lagrangian trajectories, Qin et al. (2016) found that an elevated iron injection associated with the 1997/98 El Niño showed 30 % higher total dissolved iron concentrations in the eastern equatorial Pacific around 13 months later, consistent with suppressed productivity responses in the central, eastern Pacific and off Peru, from models and observations (Ryan et al., 2006; Slemons et al., 2009; Chever et al., 2015). Moreover, eastward transport along the EUC is higher in the western part of the study region than close to the Galápagos Islands (e.g., 36.2 Sv at 160∘ W and 12.5 Sv at 92∘ W, on average), consistent with loss of transport to progressive upwelling along the Equator.
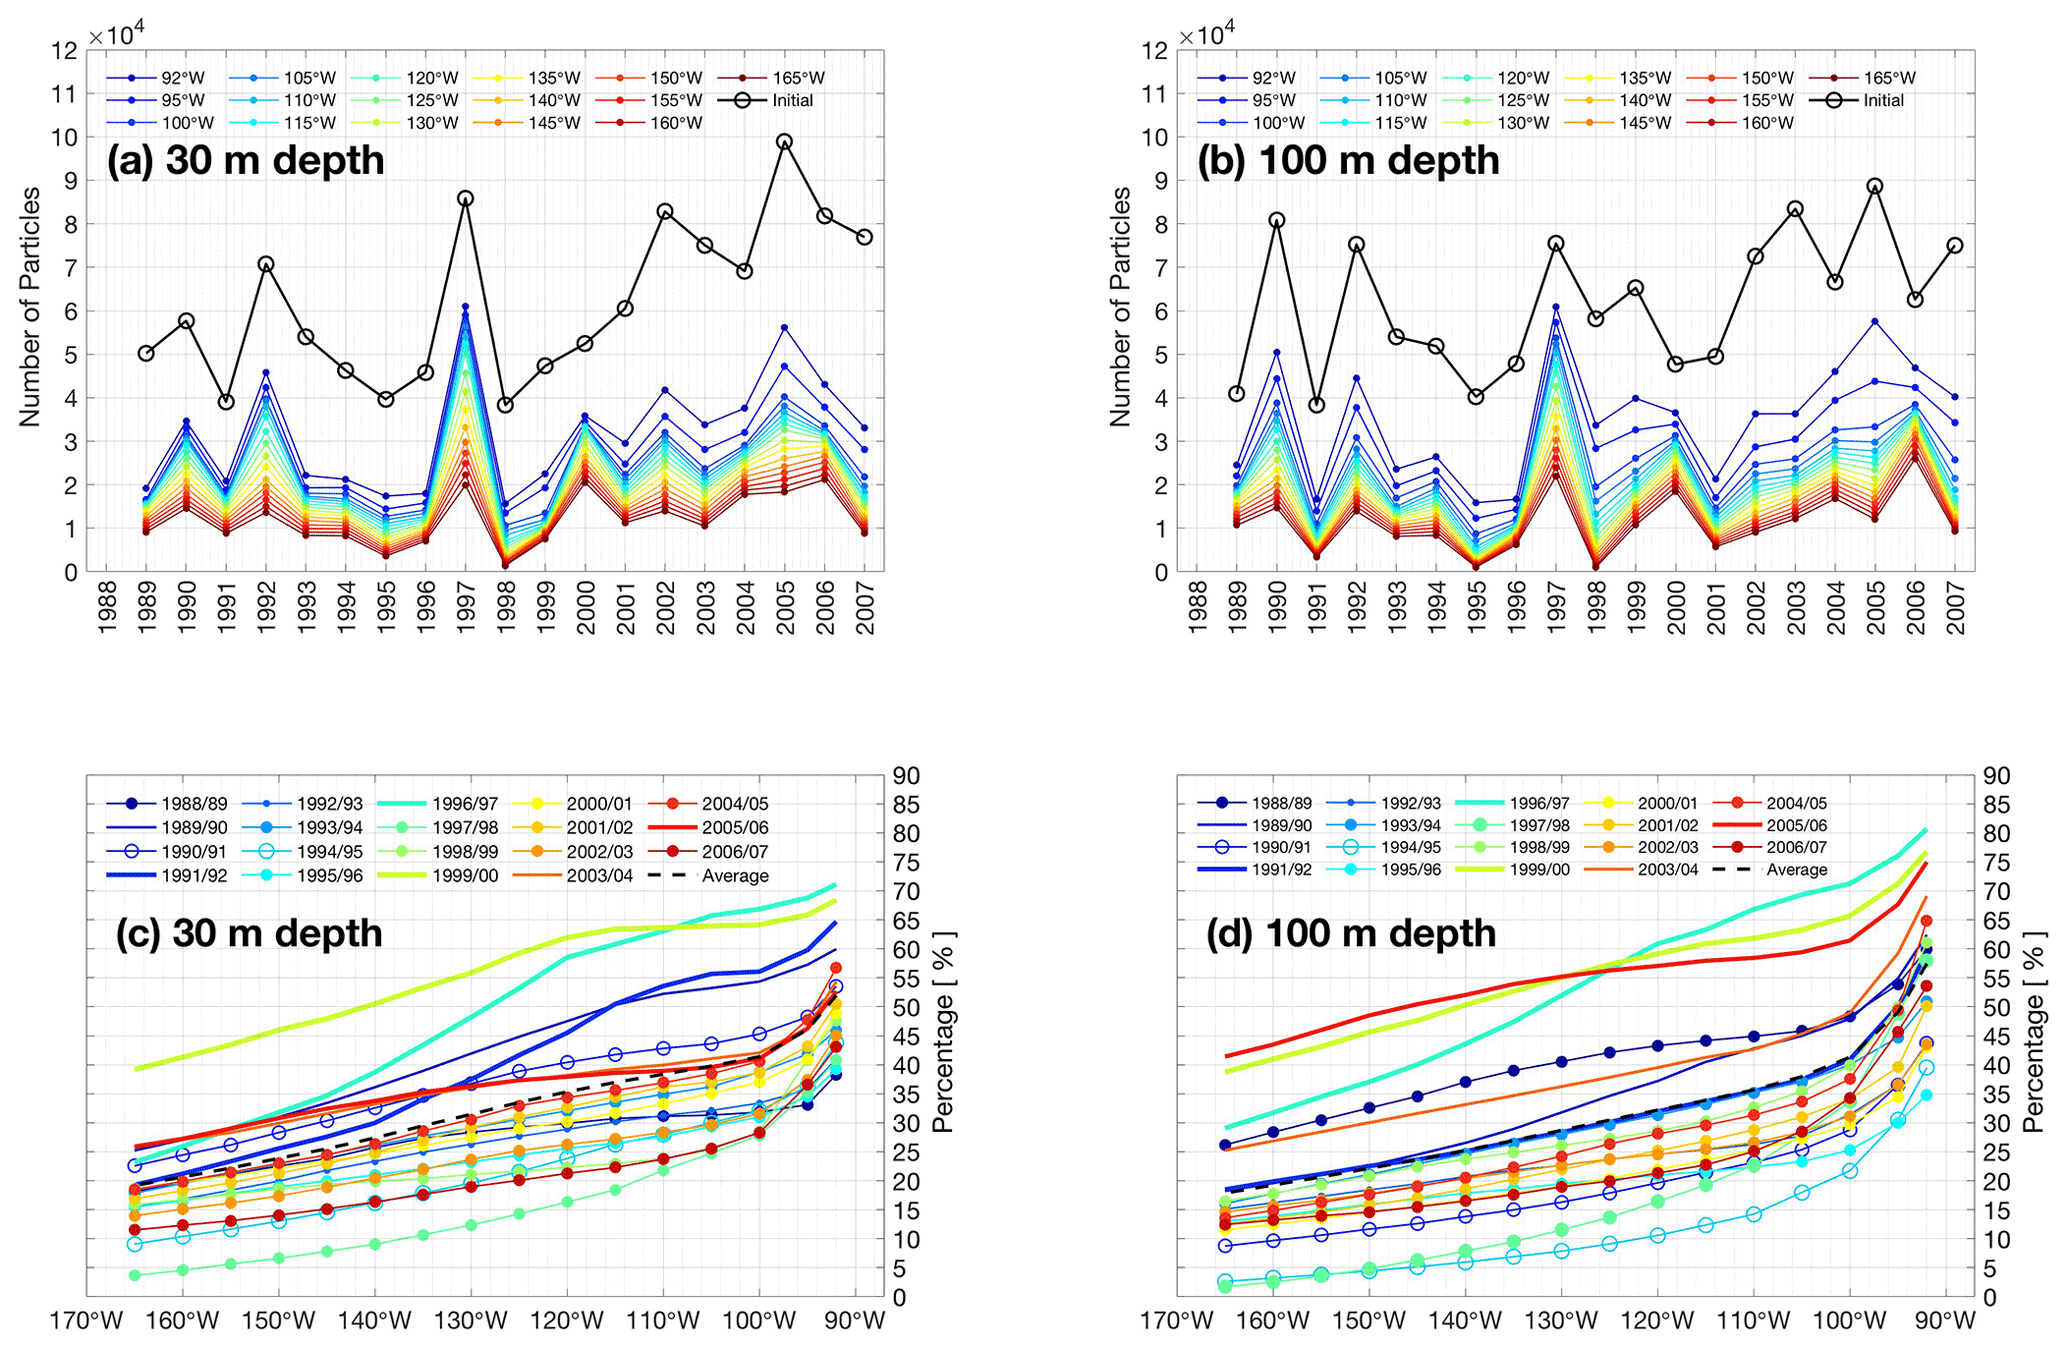
Figure 7Annual-integrated number (from December–January, monthly releases) of particles and percentage experiments associated to the EUC (3∘ N–3∘ S) every 5∘ from 165 to 95∘ W and at 92∘ W, for 30 m releases in panels (a) and (b), and for 100 m releases in panels (c) and (d). In panels (a) and (b), the number of particles per experiment is plotted at calendar-year boundaries. In panels (c) and (d), particle percentages are labeled by the two calendar years across which currents are sampled.
Seasonality is evident for most years of the hindcast, as shown in the monthly average and anomalies of Fig. 6. To emphasize seasonal cycles, we add contour lines for transport of 25 and 50 Sv in Fig. 6a. We note that the lowest values of <5 Sv coincide with major El Niño events, such as 1997/98 and 1991/92, and other warm events such as 2002/03 in the western region (≈160–140∘ W). At these times, the West Pacific Warm Pool expands across the central Pacific, the thermocline largely flattens, and the EUC quasi-disappears for a short period (McPhaden, 1999).
During strong La Niña events in 1988/89 and 1998/99, positive anomalies in transport coincide with restoration of an eastward-shoaling thermocline after strong El Niños the year before, associated with “peaks” of the >50 Sv isoline in Fig. 6a, displaced westward from 140 to 160∘ W. West–east displacement can be also seen following isolines for anomalies (Fig. 6b) during El Niños. For instance, in late 1996 and early 1997, the warm pool with anomalies Sv was rapidly transported from 160 to 92∘ W, next to the Galápagos Islands – in less than a year – before reaching the Peruvian coast. A similar transient occurrence is observed for smaller events (e.g., 2002/03 and 2006/07), although it is less intense than during strong El Niño events. We identify other strong displacements, such as during 2000/01 and 2004/05, when ENSO variability is not so clearly implicated.
This EUC transport variability is consistent with our Lagrangian trajectory analysis, most clearly during major events, when the signal is clear. Figure 7 shows 365 d integrated variations of the number of particles (a and b for 30 and 100 m, respectively) and its percentage (d and c for 30 and 100 m, respectively) after a year of tracking. In general, our results suggest that particles originating in the western basin cross the Pacific mainly within the EUC, at different intensities varying between 19.2 % and 52.0 % for 30 m (17.9 %–57.4 % for 100 m) and between 165 and 92∘ W (see dashed lines in Fig. 7c and d).
We found that during strong El Niño and La Niña events, the percentage of particles feeding the eastern basin changes dramatically. Highest and lowest percentages of particles are observed during the major ENSO of 1997/98. Particles recruited by the EUC in 1997 rapidly crossed the Pacific, showing in the easternmost region (92∘ W) the highest record of 71.1 % (80.7 % for 100 m), consistent with a enhancement of volume transport in Qin et al. (2016). However, during a following cold La Niña phase, in the same longitude range, smaller percentages arrived via the EUC (3.7 % for 30 m and 1.7 % for 100 m in Fig. 7c and d). This reduced contribution of the EUC to Peruvian upwelling coincides with a western displacement of transport in mid-1998, which persists into 1999 (see anomalies in Fig. 6). Following the major La Niña of 1998/99, notably into 2000, positive transport anomalies (>10 Sv) prevailed across the Pacific (Fig. 6), consistent with a high percentage of particles coming from the EUC (with 68.4 %–76.7 % to 39.2 %–38.7 % at 160 and 92∘ W for 30–100 m respectively, see Fig. 7).
Another major event categorized as a “moderate eastern event” (Yu et al., 2011), unfolded over 1991/92 in the Pacific. For the 1991–1992 warm event, our trajectories in percentage showed that above-average numbers of particles are recruited by the EUC close to the Galápagos (up to 53.5 % for 30 m and 43.7 % for 100 m, in 1991 at 165∘ W). In the case of a 2002/03 event, we observed the same tendency for warm and cold phases of the event, although it was less intense compared to that of 1991/92. Conversely, for the 2006/07 “moderate eastern” El Niño, we can differentiate between the warm and cold phases, with higher particles recruited by the EUC in 2006 at 165∘ W (52.7 % for 30 m and 74.9 % for 100 m) than during the 2007 La Niña (43.1 % for 30 m and 53.6 % for 100 m). Evidently, the EUC contribution to Peruvian upwelling is most dominant before and/or during major El Niño or anomalously warm events compared to cold or major La Niña conditions.
3.5 The coastal wind-driven contribution to Peruvian upwelling
Upwelling off Peru is augmented by equatorward winds that induce offshore transport in a surface layer, supplied by “rapid upwelling” in a relatively narrow coastal zone. Further offshore, “slow upwelling” is induced by negative wind stress curl that induces large-scale Ekman suction (Rykaczewski and Checkley, 2008). Variability in wind-driven upwelling has been often linked to the biological decadal variability in upwelling systems such as those off Peru (Rykaczewski and Checkley, 2008; Espinoza-Morriberón et al., 2019).
Here, we focus on variability in coastal upwelling associated with the meridional component of wind stress (Fig. 8a), used to compute Ekman offshore transport which we term the Ekman flux (Fig. 8b), compared to the full upwelling flux, obtained from the vertical velocity component at 30 m (Fig. 8c). The three time series in Fig. 8 all trend towards positive anomalies after 2000, most obviously for the Ekman flux, that is a direct consequence of strengthening in the equatorward wind stress. This may be part of a wider strengthening trend in the trade wind system of the Pacific that has been identified as a driver of the early 2000s hiatus in global warming (England et al., 2014). We further observe that, during strong and moderate La Niña events such as those in 1988–1989, 1998–1999 and 1993–1994, equatorward wind stress decreases drastically during austral summer with values ≤0.01 N m−2, and a further minimum during the relatively warm event of summer 2000. From the turn of the millennium, anomalies are generally positive (exceeding climatology), peaking in late 2005 at ≈0.07 N m−2.
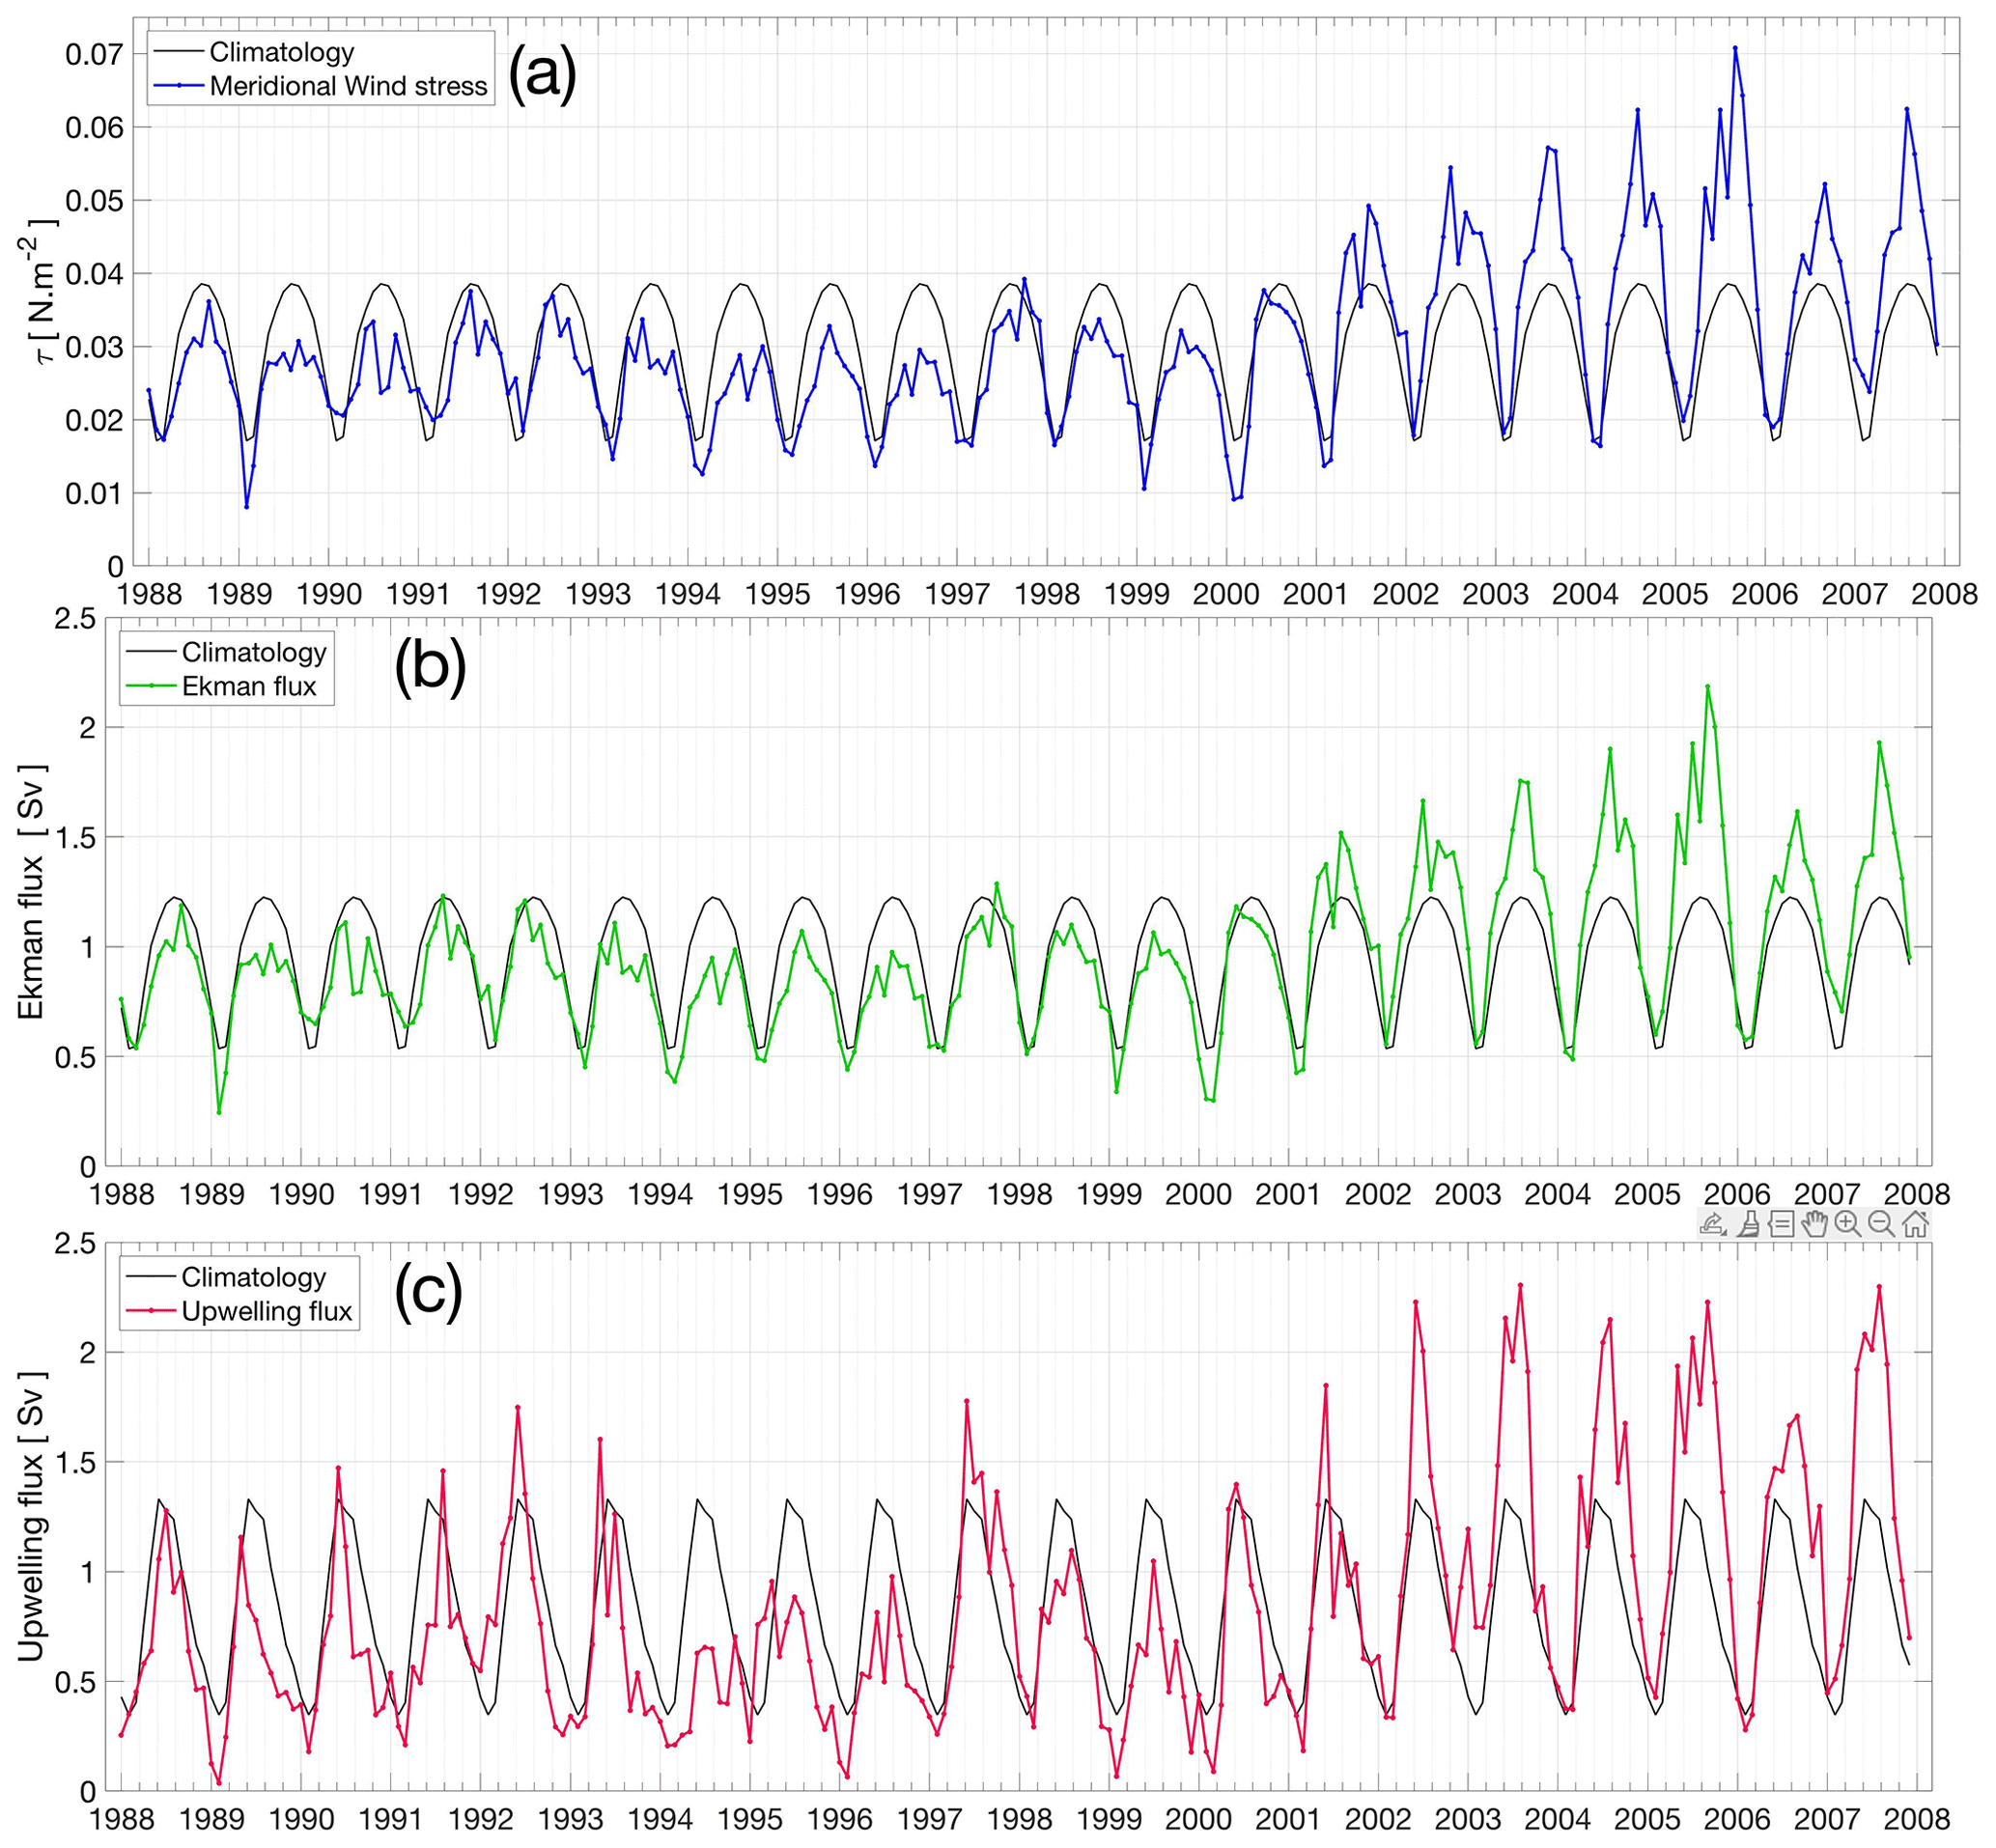
Figure 8Diagnostics of upwelling in the north Peruvian upwelling system, spanning the latitude range 5–10∘ S: (a) equatorward wind stress (N m−2): (b) Ekman flux (Sv); (c) upwelling flux (Sv). Climatologies are obtained by averaging across the 1988–2007 time series.
During the 1997/98 El Niño, wind stress was not completely shut down in the northern part off Peru, although it presented negative anomalies (reduction) in the first quarter or the year. This is consistent with the high percentage of particles appearing off Peru during extreme El Niños that arrived via the EUC, rather than being locally sourced via coastal Ekman dynamics. An alternative source for upwelled waters is further evidenced in the upwelling flux (Fig. 8), where positive anomalies coincide with a developing El Niño (e.g., second half of 1997).
3.6 Longitudinal coherence of EUC transport anomalies
To the extent that EUC transport anomalies are coherent across the equatorial Pacific, variability of upwelling via the EUC may be predictable. To examine the longitudinal coherence of EUC transport anomalies, we compute correlation between EUC transport at each selected longitude (Table 2). Despite generally low values, we find significant (p value <0.01, 99 % confidence interval) positive correlations at zero lag. This is consistent with rapid and near-simultaneous variations in EUC transport across the eastern Pacific, although weakening of correlation with separation (in longitude) indicates that transport anomalies may advect eastward, associated with inertial terms in the momentum balance and eastward propagation of Kelvin waves.
Table 2Correlation coefficient (R) matrix at zero lag for the EUC transport at the selected longitudes, for R values with p values <0.01 (99 % confidence interval). Non-significant R values are indicated as NS.
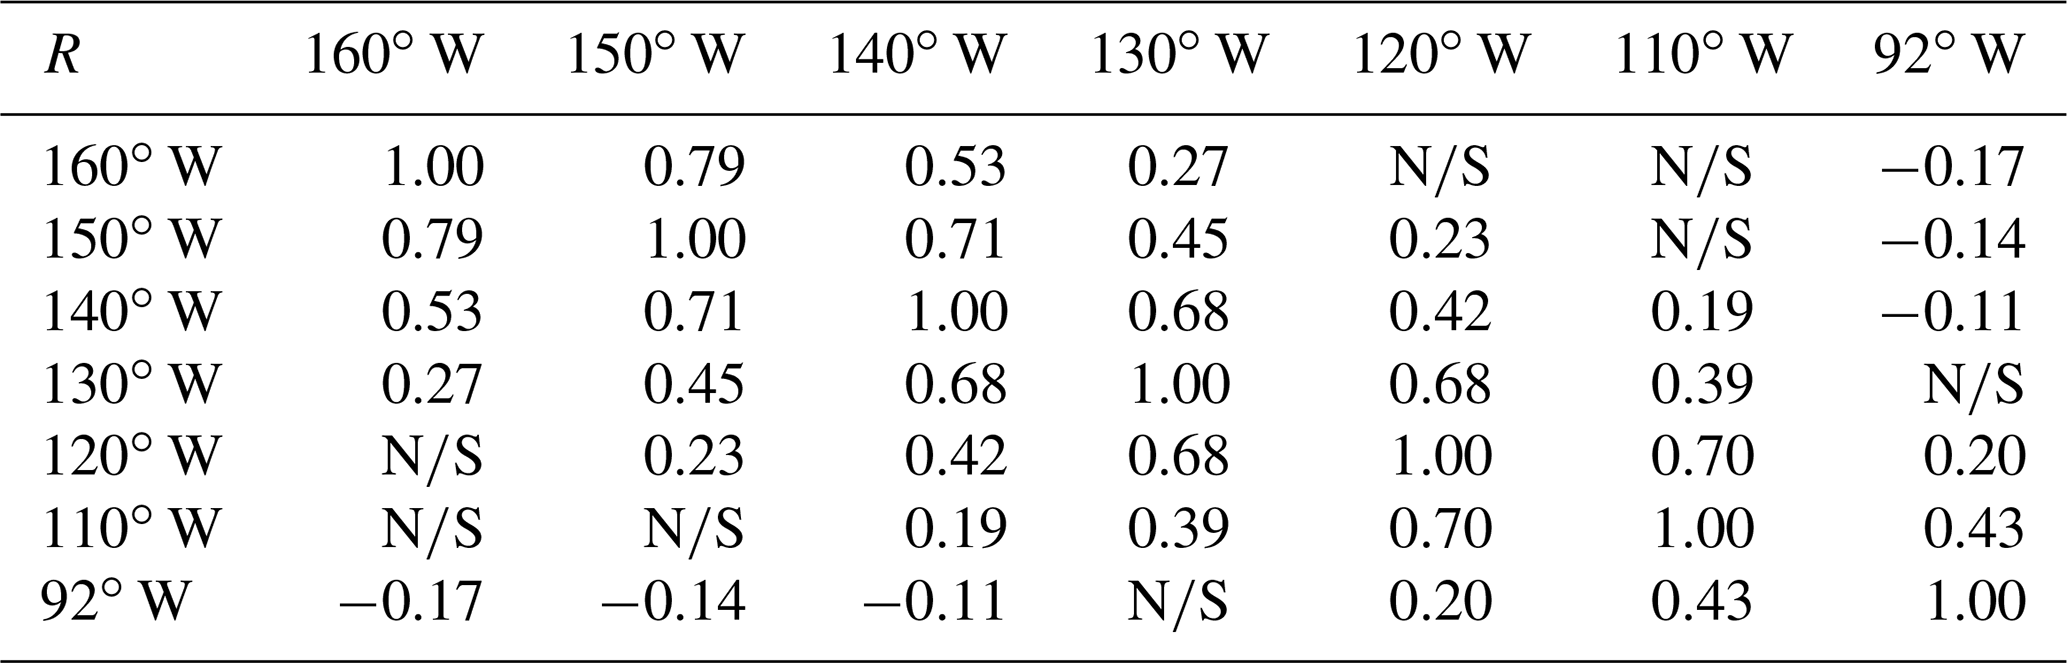
The development of an anomalous EUC flow to the east may thus be predictable for an appropriate time lag. Experimenting with lagged cross correlations of transport at 160 and 92∘ W, we obtain highly significant (p-value <0.01) between transport at 160∘ W and transport 30–35 d later at 92∘ W. With further investigation, beyond scope here, more skillful EUC predictability may provide useful advance warning of substantial changes in the Peruvian upwelling system, and subsequent impacts on important marine resources. A further step would be assess the variability and predictability of year-round inflows to the Peruvian upwelling system, also beyond the scope of this investigation.
With a range of diagnostics, we have evaluated variability of the Peruvian upwelling system in an eddy-resolving model hindcast spanning 1988–2007. Wind-driven coastal upwelling is associated with alongshore winds, complemented by shoaling of the Equatorial Undercurrent. Local and remote drivers of upwelling are highly variable on seasonal to interannual timescales. Contrasting scenarios are shown in Fig. 9. In Fig. 9a, we highlight upwelling dominated by local winds, when the EUC shoals well to the west of the Galápagos Islands. In Fig. 9b, the EUC shoals more gradually to the east, reaching the coastal upwelling zone, where weakened winds otherwise limit local upwelling.
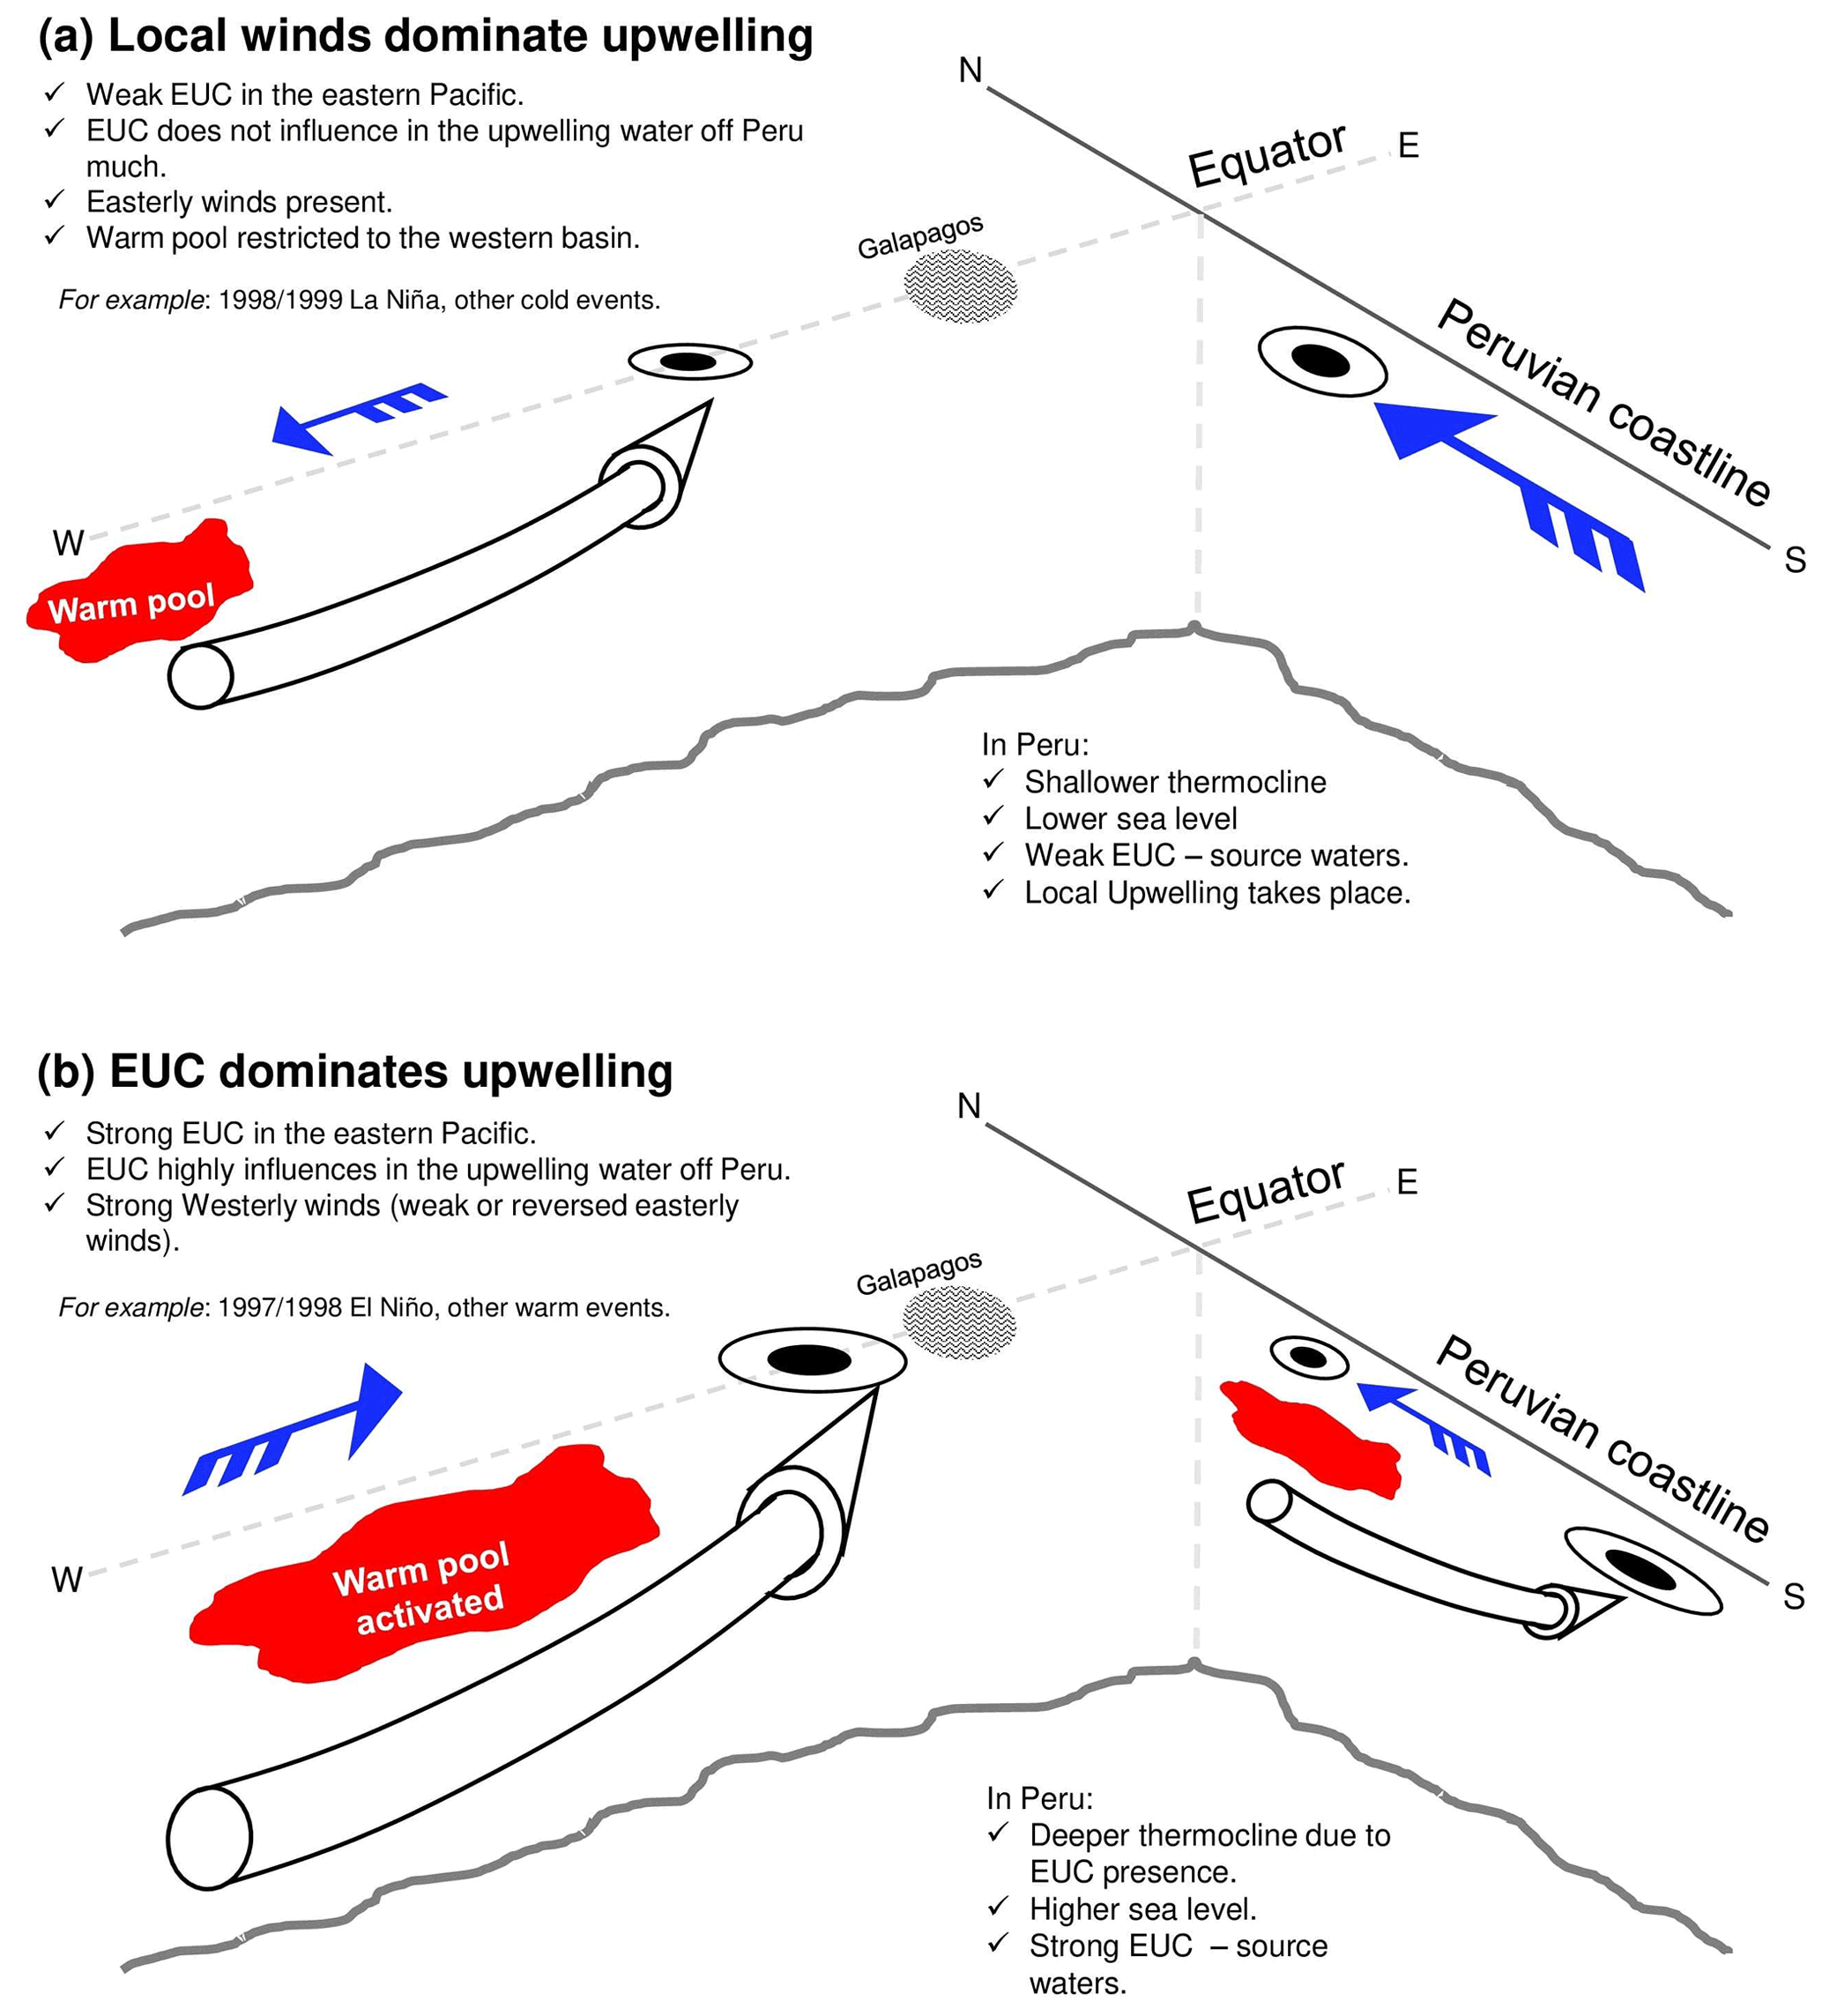
Figure 9Schematic drivers and processes associated with the Peruvian upwelling system: (a) dominated by local winds; (b) dominated by EUC source waters.
We now consider impacts on Peruvian upwelling that are linked to variable EUC contributions. Both the 1997/98 and 2000/01 events had important effects in fisheries. The May–June 1997 fieldwork conducted by the Peruvian Sea Institute (IMARPE) revealed an unusual southern and deeper (>150–200 m) migration of Peruvian hake (Merluccius gayi peruanus; generally distributed between 0∘ N and 8∘ S), easily reaching 12∘ S and even more southern areas along the Peruvian coast (Castillo et al., 1997). Conversely, hake tended to migrate northward and sometimes closer to the surface (pelagic behavior, considering that hake is a demersal species), due to bottom oxygen deficiency, during the La Niña of 1998/99. This is consistent with the physical–biogeochemical character of the EUC. Where a southward branch of the EUC reaches the northern Peruvian coast (Fig. 5), it refreshes the subsurface layer with high concentrations of dissolved oxygen (Echevin et al., 2020) and other vital nutrients (Qin et al., 2016; Espinoza-Morriberón et al., 2019).
A similar impact afflicts the second most abundant demersal species in Peruvian coastal waters, the Conger eel (Ophichthus remiger). During El Niño events (December 1997 to May 1998; March–July 1992) and subsequent La Niña events (November 1993 to March 1994; April–August 1998), significant increased and reduced catch per unit effort (CPUE) was reported, respectively (Castillo et al., 2000; Martina, 2004). The oceanographic and fisheries evidence together suggest crucial links between demersal species and the EUC. More recently, Martina (2018) also highlighted dramatic reduction in biomass during 2004/05, followed by significant increase in 2007. The latter increase coincides with positive EUC transport anomalies taking place during early 2007 (see Fig. 6b).
During the moderate eastern Pacific El Niño of 1991/92, an alternative transition is observed. A relatively high percentage of upwelling particles is traced back to the EUC, amounting to 48.2 % (36.5 %) and 22.6 % (8.7 %) at 160 and 92∘ W during 1991, for 30 m (100 m) release depths respectively (Fig. 7c and d). These enhanced percentages of EUC origin, at 160∘ W from 1991 to 1992, coincide with relatively high anomalies in transport (Fig. 7b). From the second half of 1991, east of 140∘ W, positive anomalies Sv were found, while at the end of 1991 to the first half of 1992, high negative anomalies were observed from 160 to 110∘ W. This is consistent with eastward transport of warm pool waters and the relatively high percentage of EUC particles found in 1992 near the Galápagos (92∘ W), associated with deepening of the thermocline followed by relaxation shoaling, in the eastern Pacific (Kessler and Mcphaden, 1995).
Related to 1991/92 El Niño, a dramatic size–age and biomass reduction of the Peruvian hake happened. This was first attributed to overfishing (Castillo, 1996), although observations indicated an enhanced EUC at this time. This likely led to drastic relocation of species farther south, causing high mortality for adults and leaving young species in the northern region of Peru, compounded by suboptimal oceanographic conditions when the EUC weakened after its peaks passed. Species are often slow to recover in size–age–abundance indicators. Even after the major El Niño of 1997/98, hake has shown signs of recovery in CPUE data as wider size structure and higher catch numbers (Ballón et al., 2008; Lassen et al., 2009).
Furthermore, it has been suggested that some species also use the EUC as a migration conveyor, such as the Pacific giant squid (Dosidicus gigas). Largely absent from east Pacific coastal waters over 1950–1990, catches of this species increased from the beginning of 1991 through 1992. During 1995–1996, overfishing impacted this population (on the northern US coast), primarily due to the high catch effort of foreign fishing vessels (Contreras Paya, 2017). Subsequent to the El Niño of 1997/98, a denser nearshore migration of the squid, more accessible for fishing, was reported off the North American coast (CALCOFI, 2000). Changes in coastal squid populations may be linked to the equatorially and then coastally trapped Kelvin waves (e.g., Shaffer et al., 1997), which may favor southward (northward) migration when the EUC is stronger (weaker) around the Galápagos Islands, as the squid seek out optimal conditions (Cheung et al., 2018).
We identify less intense events at other times, such as late 2002/03 (Figs. 6 and 7), when Peruvian hake almost collapsed off northern Peru, leading to a moratorium on fishing until March 2004 (Lassen et al., 2009; Benites and Barriga, 2011). This followed the moderate eastern El Niño of 2006/07, with positive transport anomalies ( Sv) during the first half of 2006, transporting water masses to the east. Then, from the end of 2006 to early 2007, negative anomalies were observed in the west, indicating that water masses reached the east. This is consistent with a higher percentage of particles in 2006 and a reduction of those in 2007 (Fig. 7) from both experiments.
In summary, the EUC contribution to upwelling region along the northern Peruvian coast is sometimes substantial, depending on the type of event (strong, moderate or weak), altering environmental conditions of consequence for many marine species. Changes in the EUC in the Pacific, as a first stage before El Niño happens off Peru, can have positive and negative effects in fisheries regarding the species (Icochea et al., 1989; Castillo et al., 1997; Contreras Paya, 2017; Tam et al., 2008; Taylor et al., 2008). Identifying this variability as a driver of shifts in population for several key species might efficiently inform sustainable management of fisheries in Peru.
We have systematically quantified the origin of waters upwelling in one of the most productive regions in the global ocean, based on a high-resolution NEMO-ORCA12 eddy-resolving model hindcast spanning 1988–2007, which includes major warm and cold events associated with El Niño and La Niña, respectively. Through Lagrangian analysis of virtual particle ensembles, we identified an interannually variable fraction of upwelled water that is recruited via the Equatorial Undercurrent (EUC), flowing between ≈3∘ N and 3∘ S at depths ranging 125 to 175 m. A key finding is that the northern Peruvian upwelling system is sensitive to highly variable EUC inflow. Particle back-trajectories – sampling the upwelling at depths of 30 and 100 m off Peru – trace the EUC as far west as 170∘ W on an annual timescale, moving at depths, temperatures, salinities and densities that are consistent with observations (Johnson et al., 2002). Back-trajectories further identified two relatively deep branches south of the main equatorial system, along ≈3∘ S and ≈8∘ S, in agreement with previous studies (Lukas, 1986; Johnson and Moore, 1997; Donohue et al., 2002; Montes et al., 2010). Only a small percentage of particles otherwise originate from latitudes poleward of 3∘, as far west as 170∘ W.
Over 1989–2007, we quantified the variable contribution of EUC waters to Peruvian upwelling. At 92∘ W, we identify highest and lowest percentages of EUC-sourced particles during the strong El Niño of 1997/98 and the subsequent strong La Niña of 1998/99, respectively. The EUC is thus most influential – in relative terms – when the equatorial thermocline deepens across the eastern Pacific, during early El Niño, allowing the EUC to extend as far as the eastern boundary and upwelling to the east of the Galápagos. During a strong La Niña, EUC waters conversely upwell with a strongly shoaling thermocline to reach the surface layer in the central Pacific, with weaker EUC upwelling further to the east. In this scenario, the waters upwelling off Peru are of local provenance (see Fig. 9).
Variable provenance of oxygenated, nutrient-rich EUC waters in the 1990s can be linked to substantial changes in Peruvian coastal fisheries. Further variability in the 2000s is associated with a range of El Niño and La Niña events. On subannual timescales, particles most rapidly cross the eastern Pacific with the EUC during peak transport around March and April, consistent with previous studies (Flores et al., 2009). Correlations between 5 d averaged EUC transport at selected longitudes in the range 92–160∘ W indicate a high degree of longitudinal coherence, with evidence of a time lag of 30–35 d for transport anomalies at 160∘ W to reach the Galápagos Islands at 92∘ W.
In highlighting the impact of variable EUC influences on regional biogeochemistry, ecosystems and fisheries, this study provides the basis for informed analysis and prediction of an unfolding El Niño or La Niña for a sustainable approach to management of marine resources in the Peruvian upwelling system. A next step would be to include biogeochemical analyses, using models and observations, to better understand the consequences of variable nutrient supply for primary productivity at the base of the food chain.
The NEMO-ORCA12 data analyzed here are archived at the National Oceanography Centre, Southampton. The original version of ARIANE software used here, available from http://stockage.univ-brest.fr/~grima/Ariane/ariane.html (Blanke and Grima, 2018), was adapted at the National Oceanography Centre and the University of Southampton. Specific trajectory data and NEMO-ORCA12 diagnostics presented here are available from the authors on request. Equatorial current data from the TAO/TRITON array are available from NOAA via https://www.pmel.noaa.gov/gtmba/pmel-theme/pacific-ocean-tao (GTMBA Project Office of NOAA, 1982).
GR carried out all analyses, prepared the figures and wrote the main manuscript. RM performed the data processing in the model. LI provided guidance and ideas specifically for the fisheries' oceanography part of the discussions and output validation. RM and LI participated in writing, and commented on and reviewed the manuscript.
The authors declare that they have no conflict of interest.
Publisher's note: Copernicus Publications remains neutral with regard to jurisdictional claims in published maps and institutional affiliations.
We are grateful to the European Mundus Joint Master Degree (Erasmus Mundus scholarship) and the Marine Environment and Resources program (MER+) for the financial support provided during this 2-year project. We acknowledge the National Oceanographic Centre Southampton (NOCS) for undertaking the NEMO-ORCA12 simulation (using the NEMO framework developed by a consortium of European institutions) and Jeff Blundell at the University of Southampton for development and installation of a local version of the ARIANE software that is central to this study. We thank the KAKENHI (20K20634, 19H01965) Japanese project for financially supporting this publication. We also thank the three reviewers for the careful scrutiny of our manuscript and many constructive comments that helped us to clarify several aspects of analysis and interpretation.
This research has been supported by the Marine Environment and Resources program (MER+ EMJMD (2017–2022)) and KAKENHI (grant nos. 20K20634, 19H01965).
This paper was edited by Neil Wells and reviewed by David Webb and two anonymous referees.
Ballón, M., Wosnitza-Mendo, C., Guevara-Carrasco, R., and Bertrand, A.: The impact of overfishing and El Niño on the condition factor and reproductive success of Peruvian hake, Merluccius gayi peruanus, Prog. Oceanogr., 79, 300–307, https://doi.org/10.1016/j.pocean.2008.10.016, 2008. a
Benites, C. and Barriga, E.: La Poblacion de la merluza durante el verano 2004, Crucero BIC Olaya 0401-02, Tech. rep., Instituto del Mar del Peru, Callao, ISSN 0378-7702, 2011. a
Blaker, A. T., Hirschi, J. J., McCarthy, G., Sinha, B., Taws, S., Marsh, R., Coward, A., and de Cuevas, B.: Historical analogues of the recent extreme minima observed in the Atlantic meridional overturning circulation at 26∘ N, Clim. Dynam., 44, 457–473, https://doi.org/10.1007/s00382-014-2274-6, 2015. a
Blanke, B. and Grima, N.: ARIANE software for tracking particles [code], available at: http://stockage.univ-brest.fr/~grima/Ariane/ariane.html (last access: 20 February 2021), 2018. a
Blanke, B. and Raynaud, S.: Kinematics of the Pacific Equatorial Undercurrent: An Eulerian and Lagrangian approach from GCM results, J. Phys. Oceanogr., 27, 1038–1053, https://doi.org/10.1175/1520-0485(1997)027<1038:KOTPEU>2.0.CO;2, 1997. a, b, c
Blanke, B., Arhan, M., Lazar, A., and Prévost, G.: A Lagrangian numerical investigation of the origins and fates of the salinity maximum water in the Atlantic, J. Geophys. Res.-Oceans, 107, 21–27, https://doi.org/10.1029/2002jc001318, 2002. a
Brown, J. N., Godfrey, J. S., and Fiedler, R.: A zonal momentum balance on density layers for the central and eastern equatorial Pacific, J. Phys. Oceanogr., 37, 1939–1955, https://doi.org/10.1175/JPO3090.1, 2007. a, b
Bryden, H. L. and Brady, E. C.: Diagnostic Model of the Three-Dimensional Circulation in the Upper Equatorial Pacific Ocean, J. Phys. Oceanogr., 15, 1255–1273, 1985. a
CALCOFI: California Cooperative Oceanic Fisheries Investigations, Tech. Rep. 5, National Oceanic and Atmospheric administration, National Marine Fisheries service, La Jolla CA, https://doi.org/10.1163/156851801511873, 2000. a
Castillo, R.: Informe técnico sobre la situacióon de la merluza 1990–1995, Tech. rep., Instituto del Mar del Peru, Callao, available at: https://hdl.handle.net/20.500.12958/899 (last access: 23 January 2021), 1996. a
Castillo, R., Ganoza, F., Aliaga, A., Gutiérrez, M., and Guevara-Carrasco, R.: Distribución, concentración y biomasa de la merluza peruana en otoño 1997 con el método hidroacústico, Crucero BIC Humboldt 9705-06, Tech. rep., Instituto del Mar del Peru, Callao, available at: https://hdl.handle.net/20.500.12958/1486 (last access: 23 January 2021), 1997. a, b
Castillo, R., Gomez, E., and Paredes, F.: Pesqueria y biologia de la Anguila comun Ophichthus pacifici (Gunther)* en el Peru, Tech. rep., Instituto del Mar del Peru, Callao, available at: https://hdl.handle.net/20.500.12958/1168 (last access: 20 February 2021), 2000. a
Chavez, F. P. and Messié, M.: A comparison of Eastern Boundary Upwelling Ecosystems, Prog. Oceanogr., 83, 80–96, https://doi.org/10.1016/j.pocean.2009.07.032, 2009. a, b, c
Chavez, F. P., Strutton, P. G., and McPhaden, M. J.: Biological-physical coupling in the central equatorial Pacific during the onset of the 1997–98 El Niño, Geophys. Res. Lett., 25, 3543–3546, https://doi.org/10.1029/98GL02729, 1998. a
Cheung W. L., W., Bruggeman, J., and Butenschön, M.: Chapter 4: Projected changes in global and national potential marine fisheries catch under climate change scenarios in the twenty-first century, in: Impacts of climate change on fisheries and aquaculture. Synthesis of current knowledge, adaptation and mitigation options, edited by: Barange, M., Bahri, T., Beveridge C. M., M., Cochrane L., K., Funge-Smith, S., and Poulain, F., vol. 627, chap. 4, Food and Agriculture Organization of the United Nations, Rome, 113–138, 2018. a
Chever, F., Rouxel, O. J., Croot, P. L., Ponzevera, E., Wuttig, K., and Auro, M.: Total dissolvable and dissolved iron isotopes in the water column of the Peru upwelling regime, Geochim. Cosmochim. Ac., 162, 66–82, https://doi.org/10.1016/j.gca.2015.04.031, 2015. a
Contreras Paya, I.: DOCUMENTO CONSOLIDADO, Convenio de desempeño 2016. Estatus y posibilidades de explotacion biologicamente sustentable de los principales recursos nacionales del 2017: Jibia, 2017, Tech. rep., Instituto de Fomento Pesquero, https://doi.org/10.13140/RG.2.2.20164.63365, 2017. a, b
Cromwell, T., Montgomery, R., and Stroup, E.: Equatorial Undercurrent in Pacific Ocean Revealed by New Methods, Science, 119, 648–649, https://doi.org/10.1126/science.119.3097.648, 1954. a, b
Donohue, K. A., Firing, E., Rowe, G. D., Ishida, A., and Mitsudera, H.: Equatorial pacific subsurface countercurrents: A model-data comparison in stream coordinates, J. Phys. Oceanogr., 32, 1252–1264, https://doi.org/10.1175/1520-0485(2002)032<1252:EPSCAM>2.0.CO;2, 2002. a, b
Doos, K.: Interocean exchange of water masses, J. Geophys. Res., 100, 499–514, 1995. a
Echevin, V., Gévaudan, M., Espinoza-Morriberón, D., Tam, J., Aumont, O., Gutierrez, D., and Colas, F.: Physical and biogeochemical impacts of RCP8.5 scenario in the Peru upwelling system, Biogeosciences, 17, 3317–3341, https://doi.org/10.5194/bg-17-3317-2020, 2020. a
England, M. H., Mcgregor, S., Spence, P., Meehl, G. A., Timmermann, A., Cai, W., Gupta, A. S., Mcphaden, M. J., Purich, A., and Santoso, A.: Recent intensification of wind-driven circulation in the Pacific and the ongoing warming hiatus, Nat. Clim. Change, 4, 222–227, https://doi.org/10.1038/nclimate2106, 2014. a
Espinoza-Morriberón, D., Echevin, V., Colas, F., Tam, J., Gutierrez, D., Graco, M., Ledesma, J., and Quispe-Ccalluari, C.: Oxygen variability during ENSO in the Tropical South Eastern Pacific, Frontiers in Marine Science, 5, 1–20, https://doi.org/10.3389/fmars.2018.00526, 2019. a, b
Flores, R., Tenorio, J., and Dominguez, N.: Variaciones de la Extension Sur de la Corriente Cromwell frente al Peru entre los 3 y 14∘ S, Tech. rep., Instituto del Mar del Peru, Callao, available at: https://hdl.handle.net/20.500.12958/1091 (last access: 22 January 2021), 2009. a
GTMBA Project Office of NOAA: Pacific Ocean – TAO [data set], available at: https://www.pmel.noaa.gov/gtmba/pmel-theme/pacific-ocean-tao (last access: 20 February 2021), 1982. a
Icochea, L., Chipollini, A., and Ñiquen, M.: Analisis de la pesqueria de arrastre pelagica en la costa peruana durante 1983–1987 y su relacion con el medio ambiente, in: Memorias del Simposio Internacional de los Recursos Vivos y las Pesquerias en el Pacifico Sudeste, Instituto del Mar del Peru, Viña del Mar, 455–465, available at: https://www.researchgate.net/publication/304717388_Analisis_de_la_Pesqueria_de_Arrastre_pelagica_en_la_costa_peruana_durante_1983-1987_y_su_relacion_con_el_medio_ambiente (last access: 23 January 2021), 1989. a
Jakoboski, J., Todd, R. E., Brechner Owens, W., Karnauskas, K. B., and Rudnick, D. L.: Bifurcation and upwelling of the equatorial undercurrent west of the galápagos archipelago, J. Phys. Oceanogr., 50, 887–905, https://doi.org/10.1175/JPO-D-19-0110.1, 2020. a
Johnson, G. C. and Moore, D. W.: The pacific subsurface countercurrents and an inertial model, J. Phys. Oceanogr., 27, 2448–2459, https://doi.org/10.1175/1520-0485(1997)027<2448:TPSCAA>2.0.CO;2, 1997. a, b
Johnson, G. C., Sloyan, B. M., Kessler, W. S., and McTaggart, K. E.: Direct measurements of upper ocean currents and water properties across the tropical Pacific during the 1990s, Prog. Oceanogr., 52, 31–61, https://doi.org/10.1016/S0079-6611(02)00021-6, 2002. a, b, c, d, e, f, g, h, i, j
Kämpf, J. and Chapman, P.: Upwelling Systems of the World. A Scientific Journey to the Most Productive Marine Ecosystems, Springer Nature, Switzerland, https://doi.org/10.1007/978-3-319-42524-5, 2016. a, b
Karnauskas, K. B., Murtugudde, R., and Busalacchi, A. J.: Observing the Galápagos-EUC interaction: Insights and challenges, J. Phys. Oceanogr., 40, 2768–2777, https://doi.org/10.1175/2010JPO4461.1, 2010. a, b, c
Karnauskas, K. B., Jakoboski, J., Johnston, T. M., Owens, W. B., Rudnick, D. L., and Todd, R. E.: The Pacific Equatorial Undercurrent in Three Generations of Global Climate Models and Glider Observations, J. Geophys. Res.-Oceans, 125, 1–12, https://doi.org/10.1029/2020JC016609, 2020. a
Kessler, S. and Mcphaden, J.: The 1991–1993 El Nifio in the central Pacific, Deep-Sea Res. Pt. II, 42, 295–333, https://doi.org/10.1016/0967-0645(95)00041-N, 1995. a
Kessler, W. S.: The circulation of the eastern tropical Pacific: A review, Prog. Oceanogr., 69, 181–217, https://doi.org/10.1016/j.pocean.2006.03.009, 2006. a
Kessler, W. S. and McPhaden, M. J.: The 1991–1993 El Niño in the central Pacific, Deep-Sea Res. Pt. II, 42, 295–333, https://doi.org/10.1016/0967-0645(95)00041-N, 1995. a
Knauss, J. A.: Observations of the Pacific Equatorial Undercurrent, Nature, 182, 601–602, https://doi.org/10.1038/182601a0, 1958. a
Knauss, J. A.: Measurements of the Cromwell current, Deep-Sea Res. (1953), 6, 265–286, https://doi.org/10.1016/0146-6313(59)90086-3, 1959. a, b, c, d
Kuntz, L. B. and Schrag, D. P.: Hemispheric asymmetry in the ventilated thermocline of the tropical pacific, J. Climate, 31, 1281–1288, https://doi.org/10.1175/JCLI-D-17-0686.1, 2018. a
Lassen, H., Barriga, E., Palacios, J., Vargas, N., Díaz, E., and Argüelles, J.: Evaluación del estado del stock de merluza (Merluccius gayi peruanus Ginsburg) en el mar peruano. 2008, Tech. Rep. 1-2, Instituto del Mar del Peru, Callao, available at: https://hdl.handle.net/20.500.12958/1016 (last access: 15 January 2021), 2009. a, b
Lukas, R.: The termination of the Equatorial Undercurrent in the eastern Pacific, Prog. Oceanogr., 16, 63–90, https://doi.org/10.1016/0079-6611(86)90007-8, 1986. a, b, c, d, e, f
Madec, G.: NEMO ocean engine, Note du Pôle de modélisation, Institut Pierre-Simon Laplace (IPSL), France, No 27, 2008. a
Martina, J.: Analisis de la captura por unidad de esfuerzo (CPUE) de la anguila comun (Ophichthus pacifici) y su relacion con la Corriente Cromwell, PhD thesis, Universidad Nacional Agraria La Molina, available at: http://ban.lamolina.edu.pe/search~S1*spi?/cM11+M37+-+T/cm++++11+m37+t/-3%2C-1%2C0%2CB/frameset&FF=cm++++11+m37+t&1%2C1%2C (last access: 15 January 2021), 2004. a
Martina, J.: Estimación del coeficiente de capturabilidad (q) y de la biomasa de anguila común (Ophichthus remiger) del norte de Perú mediante análisis geoestadístico de las densidades de captura using likelihood-based geostatistical method on fish density, Anales Cientificos, 79, 168–177, https://doi.org/10.21704/ac.v79i1.1159, ISSN 2519-7398 (Versión electrónica), 2018. a
McPhaden, M. J.: Genesis and Evolution of the 1997–98 El Niño, Science, 283, 950–954, https://doi.org/10.1126/science.283.5404.950, 1999. a, b
Montes, I., Colas, F., Capet, X., and Schneider, W.: On the pathways of the equatorial subsurface currents in the eastern equatorial Pacific and their contributions to the Peru-Chile Undercurrent, J. Geophys. Res.-Oceans, 115, 1–16, https://doi.org/10.1029/2009JC005710, 2010. a, b, c
Ñiquen, M. and Bouchon, M.: Impact of El Niño events on pelagic fisheries in Peruvian waters, Deep-Sea Res. Pt. II, 51, 563–574, https://doi.org/10.1016/j.dsr2.2004.03.001, 2004. a, b
Pennington, J. T., Mahoney, K. L., Kuwahara, V. S., Kolber, D. D., Calienes, R., and Chavez, F. P.: Primary production in the eastern tropical Pacific: A review, Prog. Oceanogr., 69, 285–317, https://doi.org/10.1016/j.pocean.2006.03.012, 2006. a
Qin, X., Gupta, A. S., and van Sebille, E.: Variability in the origins and pathways of Pacific Equatorial Undercurrent, J. Geophys. Res.-Oceans, 120, 3113–3128, https://doi.org/10.1002/2014JC010549, 2015. a
Qin, X., Menviel, L., Sen Gupta, A., and van Sebille, E.: Iron sources and pathways into the Pacific Equatorial Undercurrent, Geophys. Res. Lett., 43, 9843–9851, https://doi.org/10.1002/2016GL070501, 2016. a, b, c
Ryan, J. P., Ueki, I., Chao, Y., Zhang, H., Polito, P. S., and Chavez, F. P.: Western Pacific modulation of large phytoplankton blooms in the central and eastern equatorial Pacific, J. Geophys. Res.-Biogeo., 111, 1–14, https://doi.org/10.1029/2005JG000084, 2006. a
Rykaczewski, R. R. and Checkley, D. M.: Influence of ocean winds on the pelagic ecosystem in upwelling regions, P. Natl. Acad. Sci. USA, 105, 1965–1970, https://doi.org/10.1073/pnas.0711777105, 2008. a, b
Shaffer, G., Pizarro, O., Djurfeldt, L., Salinas, S., and Rutllant, J.: Circulation and low-frequency variability near the Chilean coast: Remotely forced fluctuations during the 1991–92 El Niño, J. Phys. Oceanogr., 27, 217–235, https://doi.org/10.1175/1520-0485(1997)027<0217:CALFVN>2.0.CO;2, 1997. a
Slemons, L., Gorgues, T., Aumont, O., Menkes, C., and Murray, J. W.: Biogeochemical impact of a model western iron source in the Pacific Equatorial Undercurrent, Deep-Sea Res. Pt. I, 56, 2115–2128, https://doi.org/10.1016/j.dsr.2009.08.005, 2009. a
Tam, J., Purca, S., Duarte, L. O., Blaskovic, V., and Espinoza, P.: Changes in the diet of hake associated with El Niño 1997–1998 in the northern Humboldt Current ecosystem, Adv. Geosci., 6, 63–67, https://doi.org/10.5194/adgeo-6-63-2006, 2006. a
Tam, J., Taylor, M. H., Blaskovic, V., Espinoza, P., Michael Ballón, R., Díaz, E., Wosnitza-Mendo, C., Argüelles, J., Purca, S., Ayón, P., Quipuzcoa, L., Gutiérrez, D., Goya, E., Ochoa, N., and Wolff, M.: Trophic modeling of the Northern Humboldt Current Ecosystem, Part I: Comparing trophic linkages under La Niña and El Niño conditions, Prog. Oceanogr., 79, 352–365, https://doi.org/10.1016/j.pocean.2008.10.007, 2008. a
Taylor, M. H., Tam, J., Blaskovic, V., Espinoza, P., Michael Ballón, R., Wosnitza-Mendo, C., Argüelles, J., Díaz, E., Purca, S., Ochoa, N., Ayón, P., Goya, E., Gutiérrez, D., Quipuzcoa, L., and Wolff, M.: Trophic modeling of the Northern Humboldt Current Ecosystem, Part II: Elucidating ecosystem dynamics from 1995 to 2004 with a focus on the impact of ENSO, Prog. Oceanogr., 79, 366–378, https://doi.org/10.1016/j.pocean.2008.10.008, 2008. a
Terada, M., Minobe, S., and Deutsch, C.: Mechanisms of future changes in equatorial upwelling: CMIP5 intermodel analysis, J. Climate, 33, 497–510, https://doi.org/10.1175/JCLI-D-19-0128.1, 2020. a
Tsuchiya, M., Lukas, R., Fine, R. A., Firing, E., and Lindstrom, E.: Source waters of the Pacific Equatorial Undercurrent, Prog. Oceanogr., 23, 101–147, https://doi.org/10.1016/0079-6611(89)90012-8, 1989. a
Wang, Q., Wang, F., Feng, J., Hu, S., Zhang, L., Jia, F., and Hu, D.: The Equatorial Undercurrent and Its Origin in the Region Between Mindanao and New Guinea, J. Geophys. Res.-Oceans, 124, 2313–2330, https://doi.org/10.1029/2018JC014842, 2019. a
Wolf, A. E. and Tarazona, J.: Summary for Policymakers, in: Climate Change 2013 – The Physical Science Basis, edited by: Intergovernmental Panel on Climate Change, vol. 52, Cambridge University Press, Cambridge, https://doi.org/10.1017/CBO9781107415324.004, 1–30, 1989. a
Wolff, M., Taylor, M., Mendo, J., and Yamashiro, C.: A catch forecast model for the Peruvian scallop (Argopecten purpuratus) based on estimators of spawning stock and settlement rate, Ecol. Model., 209, 333–341, https://doi.org/10.1016/j.ecolmodel.2007.07.013, 2007. a
Yu, J. Y., Kao, H. Y., Lee, T., and Kim, S. T.: Subsurface ocean temperature indices for Central-Pacific and Eastern-Pacific types of El Niño and La Niña events, Theor. Appl. Climatol., 103, 337–344, https://doi.org/10.1007/s00704-010-0307-6, 2011. a
localupwelling is associated with coastal winds, coincident with major key population shifts.