the Creative Commons Attribution 4.0 License.
the Creative Commons Attribution 4.0 License.
 | 18 Dec 2020
Coastal gradients in False Bay, south of Cape Town: what insights can be gained from mesoscale reanalysis?
Mark R. Jury
Mesoscale datasets are used to study coastal gradients in the marine climate and oceanography in False Bay, south of Cape Town. Building on past work, satellite and ocean–atmosphere reanalyses are used to gain new insights into the mean structure, circulation and meteorological features. HYCOM v3 hindcasts represent a coastward reduction of mixing that enhances stratification and productivity inshore. The mean summer currents are westward 0.4 m s−1 along the shelf edge and weakly clockwise within False Bay. The marine climate is dominated by southeasterly winds that accelerate over the mountains south of Cape Town and fan out producing dry weather. Virtual buoy time series in December 2012–February 2013 exhibit weather-pulsed upwelling in early summer interspersed with quiescent spells in late summer. Intercomparisons between model, satellite and station data build confidence that coupled reanalyses yield opportunities to study air–sea interactions in coastal zones with complex topography. The 0.083∘ HYCOM reanalysis has 16 data points in False Bay, just adequate to resolve the coastal gradient and its impacts on ocean productivity.
- Article
(6132 KB) - Full-text XML
- BibTeX
- EndNote


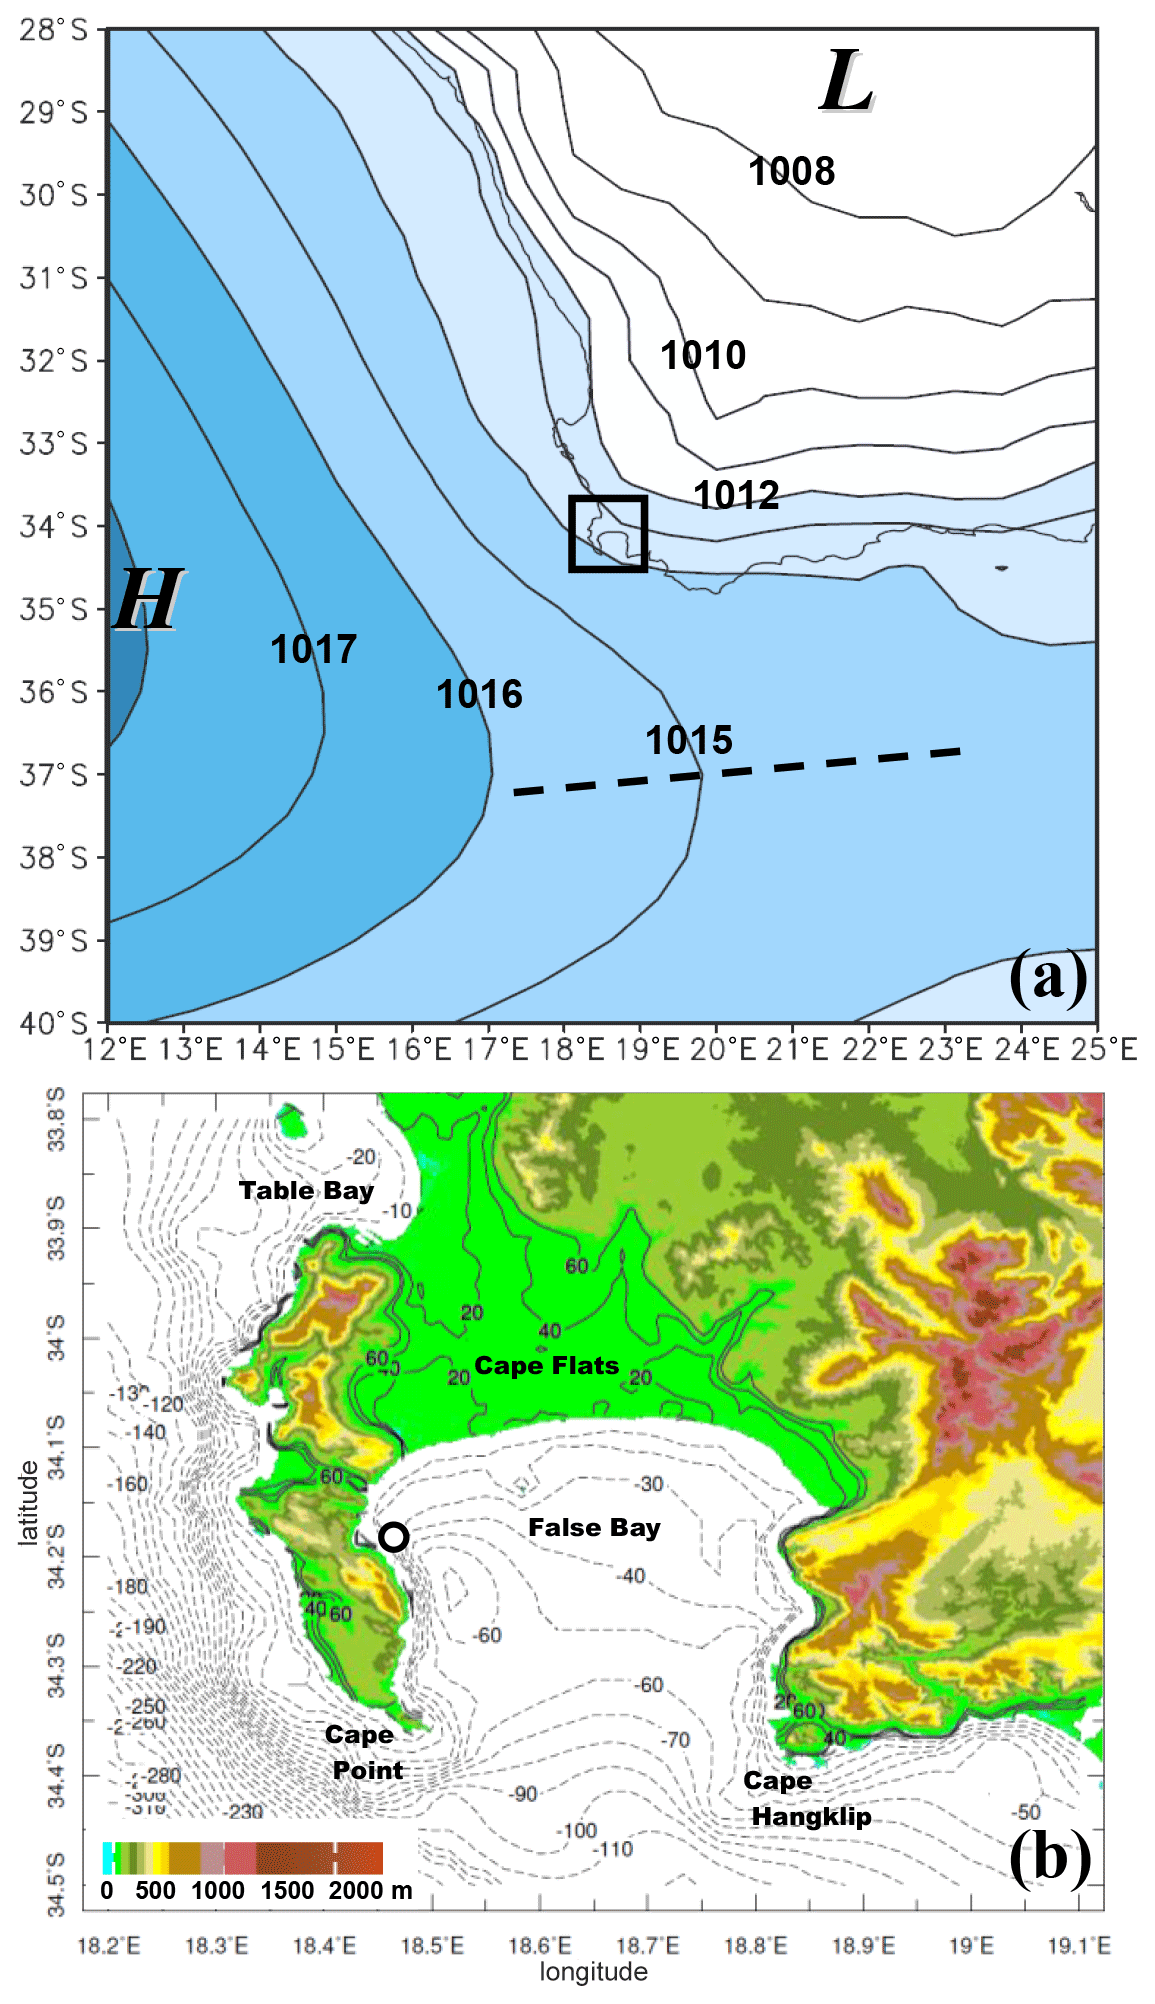
Figure 1(a) Mean sea level air pressure in summer December 2012 to February 2013. The box denotes the False Bay area and the dashed line the subtropical ridge. (b) Topography (shading) and bathymetry contours; place names are labelled; dot is the IMT buoy–tide gauge–weather station off Simonstown.
The coastal zone south of Cape Town, South Africa, is comprised of linear sandy beaches and a semi-enclosed bay surrounded by mountains (Fig. 1a, b). False Bay is southward facing and about 103 km2, with the Cape Peninsula to the west and Cape Hangklip to the east. The shelf oceanography exhibits a range of conditions from seasonally pulsed upwelling events (Shannon and Field, 1985; Lutjeharms and Stockton, 1991; Largier et al., 1992; Dufois and Rouault, 2012) to warm-water intrusions from the Agulhas Current, creating great biological diversity (Shannon et al., 1985; Griffiths et al., 2010). The upper ocean circulation tends to be northwestward and pulsed at subseasonal timescales by passing weather, shelf waves, warm rings and tides (Grundlingh and Larger, 1991; Nelson et al., 1991). Coastal winds and temperatures exhibit sharp gradients (Bang, 1971; Jury, 1991; Van Ballegooyen, 1991) depending on excursions of the subtropical anticyclone.
The high-pressure cells of the South Atlantic and South Indian Ocean tend to join in summer and produce dry weather and upwelling-favourable winds from the southeast that are shallow and diverted around the > 1000 m mountains of Cape Hangklip and the Cape Peninsula (Fig. 1a, b). The winds accelerate off the capes and form shadow zones over leeward bays, creating cyclonic vorticity that enhances upwelling (Wainman et al., 1987; Grundlingh and Largier, 1991; Jacobson et al., 2014). Winds entering False Bay become channelled N–S and tend to induce standing clockwise rotors in the upper ocean (deVos et al., 2014), which are pulsed by geostrophic currents across the mouth.
With the passage of eastward-moving atmospheric Rossby waves across the southern tip of Africa at 3–20 d intervals (Jury and Brundrit, 1992), the subtropical ridge is replaced by coastal lows followed by downwelling-favourable northwesterly winds and frontal troughs that bring rainfall, stormy seas, onshore transport and mixing – most often in winter: May–September (Engelbrecht et al., 2011; Schilperoort et al., 2013; deVos et al., 2014; Rautenbach, 2014).
The city of Cape Town, its 4 million residents and associated infrastructure have intensified anthropogenic pressure on the coastal zone. Sandy beaches there are vulnerable to sediment loss from rising seas, huge swell events and recreational use (Hughes and Brundrit 1991; Brundrit, 2009; Mather et al., 2009; Theron et al., 2010; Roux and Toms, 2013; Theron et al., 2014a, b; Fourie et al., 2015). Climate change has become manifested in longer summers and a southeastward shift in wind-driven upwelling, marine ecosystems and fisheries (Rouault et al., 2010; Lloyd et al., 2012; Blamey et al., 2012; Schlegel et al., 2017).
Coastal embayments tend to be productive and False Bay is no exception. Brown et al. (1991) reported an average chlorophyll concentration of 4 mg m−3 in the euphotic layer, which varies from summer to winter: 5.5 vs. 2.1 mg m−3 (Giljam, 2002). Nutrients enter the southern coastal zone via runoff and municipal waste streams (Parsons, 2000; Taljaard et al., 2000). Although numerous small rivers drain into False Bay, the nutrients supplied by upwelling exceed those from terrestrial sources (Taljaard, 1991; Giljam, 2002). Coastal and offshore waters show healthy rates of exchange, particularly during stormy spells that induce surf-zone currents and a dissipation of the thermocline.
Our understanding of the physical oceanography south of Cape Town has benefited from studies of the upper ocean circulation (Botes, 1988), the wind field and the variability of sea temperatures (Dufois and Rouault, 2012). Yet many processes governing intra-seasonal variability remain obscure (Wainman et al., 1987). There is a lack of consensus on the mean seasonal circulation (Grundlingh et al., 1989; Taljaard et al., 2000), despite ample knowledge of the air–sea interactions. To overcome the limited scale and brevity of measurement campaigns, modelling efforts (e.g. Penven et al., 2001) have elucidated coastal features over a longer period. Hydrodynamic simulations with temporal forcing by Nicholson (2011) gave promising results, and Coleman (2019) recently modelled the circulation south of Cape Town forced with daily data from the HYbrid Coordinate Ocean Model (HYCOM; Cummings and Smedstad, 2013) and the Weather Research and Forecasting model (WRF; Skamarock et al., 2008). Coleman (2019) found sheared clockwise circulations during summer and favourable validations for mean currents and thermal stratification in False Bay.
Given the above history of scientific endeavours, the objective of this work is to embark on a new mission to utilize the global ocean data assimilation system to describe the spatial pattern and temporal variability of the marine environment. We demonstrate that mesoscale reanalysis offers valuable new insights into the coastal gradient in summer climate and physical oceanography south of Cape Town.
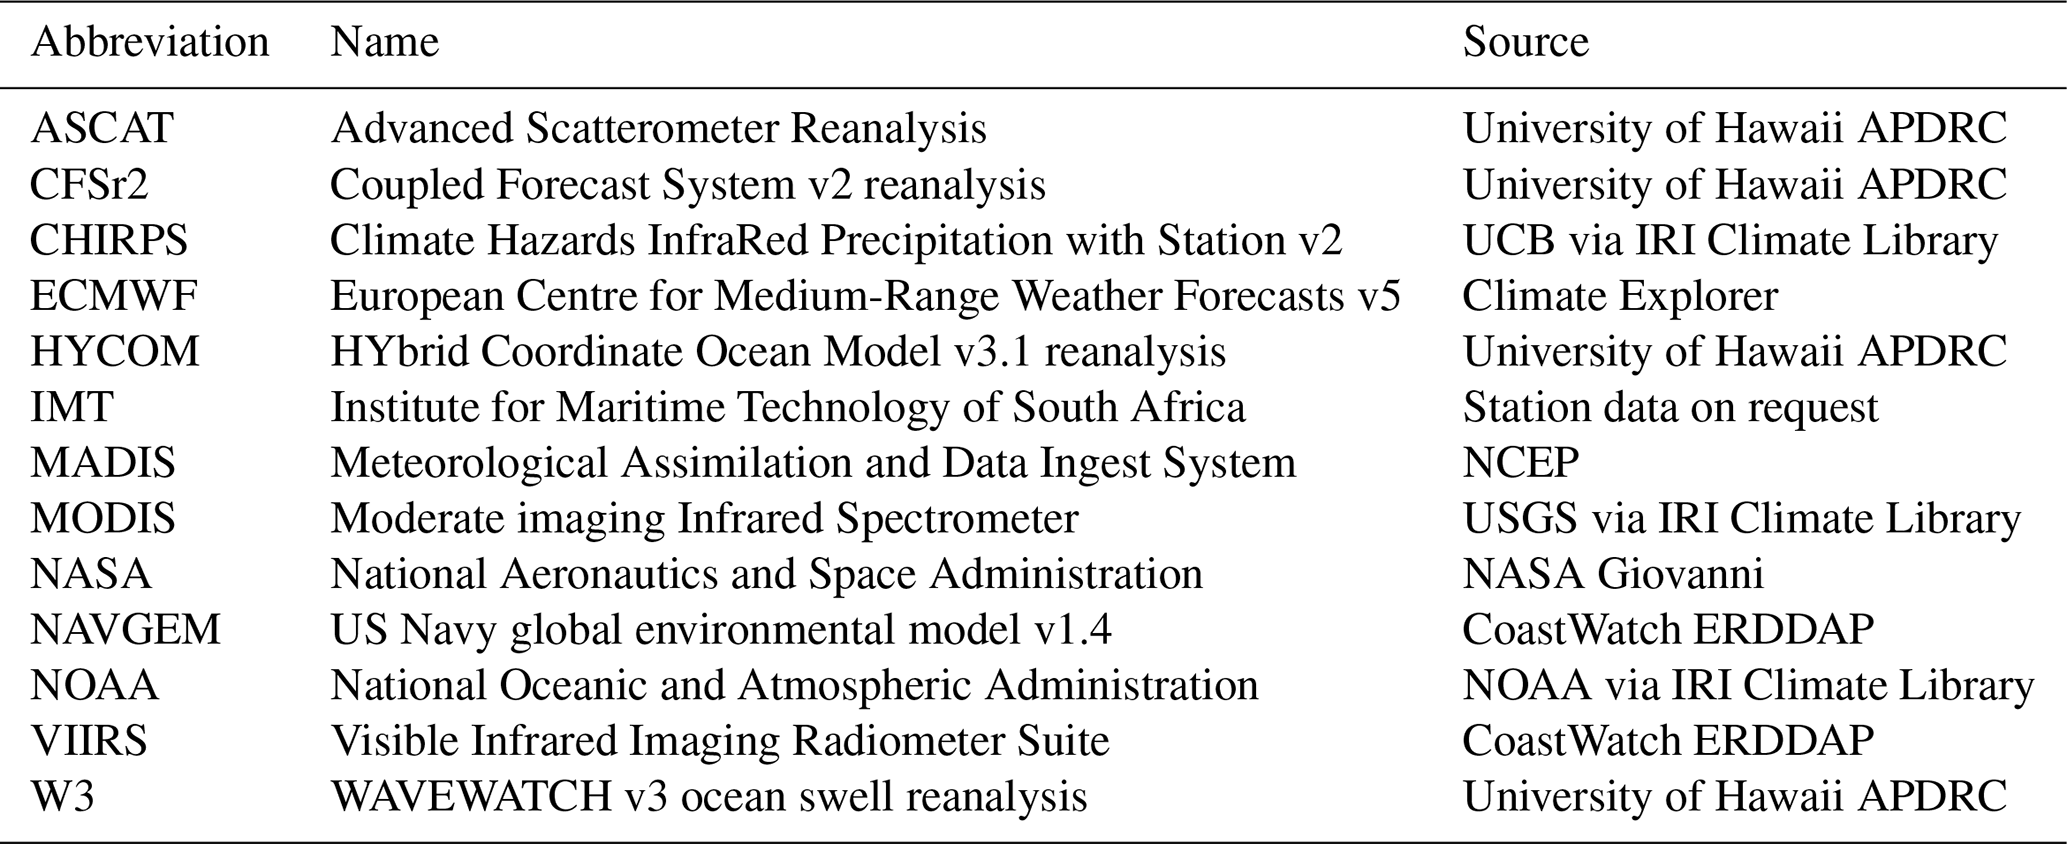
Table 1Abbreviations and dataset attributes.
HYCOM information: https://www.hycom.org/hycom/documentation (last access: 12 June 2020)
Satellite information:
http://www.wmo-sat.info/oscar/gapanalyses?mission=12 (last access: 12 June 2020)
http://www.wmo-sat.info/oscar/gapanalyses?mission=13 (last access: 12 June 2020)
http://www.wmo-sat.info/oscar/gapanalyses?variable=133 (last access: 12 June 2020)
http://www.wmo-sat.info/oscar/gapanalyses?variable=148 (last access: 12 June 2020)
Marine climate variability is described using weather and wave reanalysis products at 20–30 km resolution, namely CFSr2, ECMWF and WAVEWATCH III (Saha et al., 2014; Dee et al., 2011; Tolman, 2002; respectively). Coastal gradients are described using 4 km resolution satellite visible and infrared products (Reynolds et al., 2002) and IMT station observations in western False Bay. Table 1 lists abbreviations and dataset attributes.
The mesoscale oceanography of False Bay, south of Cape Town, is studied with HYCOM v3.1 reanalysis (Cummings and Smedstad, 2013; Metzger et al., 2014), which assimilates microwave, infrared and visible measurements from multiple satellites, calibrated with in situ observations. Climatology, persistence and model-calculated fields are used to quality control and nudge the incoming data, within static 0.033∘ resolution GIS fields that include bathymetry, surface roughness, etc. Running in parallel with the ocean model are operational atmosphere and land models that deliver coupled information on momentum, heat and water fluxes, and feedbacks (Table 1). In the 41-layer 0.083∘ HYCOM v3.1 hindcast employed here, NAVGEM v1.4 3-hourly 0.176∘ resolution atmospheric data provide background initialization for kinematic and thermodynamic fields derived from satellite and in situ measurements, continually assimilated over a rolling 5 d window (Hurlburt et al., 2009). A hydrological sub-model assimilates satellite rainfall–soil moisture and predicts runoff, which is blended with satellite salinity measurements (Table 1). Regional validations have been done for the HYCOM reanalysis, and errors for key variables are <10 % (Chassignet et al., 2009; Metzger et al., 2017). Local validations are reported here in Fig. A1. Hindcasts differ from operational forecast simulations in that the rate of change and evolution of spatial structure is known; the rolling 5 d analysis window has overlapping temporal information to ensure a close fit to environmental conditions. This is crucial for infrequent zenith altimeter data which prescribe the currents. Post-2008 reanalysis better represents the nearshore oceanography due to finer microwave footprints that reach the coast.
HYCOM reanalysis fields of near-surface sea temperature, salinity, currents and mixed layer depth (MLD) are analysed as mean maps and sections. We focus on the summer of December 2012 to February 2013, which coincides with VIIRS reflectance, Jason-1 and Jason-2 altimeter, and ASCAT-A and ASCAT-B scatterometer coverage that better constrains the physical oceanography. Cross-correlations between the various surface ocean and atmosphere parameters are studied in this 90 d period. Other motivations for our study period include summer's marine productivity (Pfaff et al., 2019) and the variety of conditions attributable to pulsed upwelling and shelf wave events.
In situ measurements over the coast and shelf south of Cape Town are made by numerous government agencies: South African (SA) Weather Service, Department of Environmental Affairs, Institute of Marine Technology (IMT), Council for Scientific and Industrial Research – Marine Division, SA Department of Water Affairs, and SA Hydrographic Department, with data operationally reported and subsequently archived at the SA Data Centre for Oceanography. The University of Cape Town Oceanography Department hosts short-term projects and regional ocean numerical modelling.
Table 2Relative influence of surface weather observations in model
assimilation, with grey land mask. Stations reporting (in 2020) land-based
private ![]() and official
and official ![]() and marine-based online
and marine-based online ![]() and offline
and offline ![]() . Curved line is routine aircraft wind–temperature profile. Sources: NASA, NOAA, MADIS, WunderMap.
. Curved line is routine aircraft wind–temperature profile. Sources: NASA, NOAA, MADIS, WunderMap.

Evaluating the “influence” of surface reports in operational data assimilation (Table 2), values of ∼ 24 % in False Bay contrast with ∼ 90 % inland. This trend continues for upper ocean T∕S observations that are nearly 4 times greater in Table Bay than False Bay (WOA, 2013). Hence our analysis of marine conditions over the shelf south of Cape Town relies more on satellite and model than in situ observations.
Comparisons of HYCOM reanalysis ocean data with daily gauge and radiometer measurements show reasonable agreement (cf. Fig. A1a, b) in the period 2008–2015. The sea surface height comparison has a 24 % fit with discrepancies attributable to coastal tide residuals and non-co-location. Sea temperatures have a 38 % fit and diverge in warm spells, the model tending to over-estimate. Comparisons of ECMWF-5 reanalysis and Simonstown station hourly weather data in the period December 2012–February 2013 (cf. Fig. A1c, d) are good for pressure (88 %) and wind speed (62 %) but lower for air temperature (21 %) presumably because the 0.3∘ reanalysis has contributions from land. Coleman (2019) reports similar validations for the summer of 2010.
The HYCOM reanalysis has limited atmospheric outputs, so to evaluate the wind circulation south of Cape Town, the WRFv3.8 model (Skamarock et al., 2008) is used to downscale ECMWF fields, as in the simulations of Coleman (2019). The WRF model resolution of 0.1 ‰ complies with the HYCOM reanalysis and uses default schemes for boundary layer, flux transport, radiative transfer and surface coupling. We focus on the nature of horizontal flow over False Bay during summer December 2012–February 2013, a period of “near-normal” climate (e.g. sea level air pressure anomaly ∼ 0 hPa).

Figure 2Mean conditions for summer December 2012–February 2013: (a) MODIS 1 km daytime land temperature and (b) vegetation fraction. WRF-downscaled wind vectors and speed (shaded m s−1) for December 2012–February 2013: (c) 08:00 morning and (d) 14:00 afternoon. Time series December 2012–February 2013 of 6-hourly CFSr2 data at shelf edge (blue, sea) and coast (red, land): (e) U wind, (f) V wind, (g) air temperature and (h) net heat flux. Arrows in (f) refer to coastal low/shelf wave passage noted in text.
3.1 Summer climate and weather
We first consider the coast and climate before analysing the shelf and ocean. Warm dry weather and sparse vegetation characterize summer (Fig. 2a, b). Satellite land surface temperatures exhibit sharp gradients from the Cape Flats (40 ∘C at 34∘ S) to cool southern coasts (25 ∘C at 34.4∘ S), similar to Tadross et al. (2012). Little rainfall occurs in summer, so terrestrial vegetation is depleted and ocean salinity is controlled by evaporation and currents, not terrestrial run-off.
Figure 2c and d illustrate the spatial pattern of ECMWF WRF-downscaled surface winds over the False Bay region in morning and afternoon. The mean southeasterly winds pass Cape Hangklip and reach 9 m s−1 in mid-bay. The flow acceleration is attributed to the following: (1) orographic channelling (Venturi effect), (2) vertical constraint by trade wind inversion, and (3) sinking motion from declining coriolis and sensible heat flux (cf. Jury and Reason, 1989). Summer winds are characterized by a low-level wind jet over False Bay, seen in earlier aircraft surveys (Jury, 1991), which is embedded in a shallow moist layer (cf. Fig. A2a). Diurnal variability is of high amplitude as evident below.
Time series of CFSr2 winds over the coast and shelf (Fig. 2e, f) show a meridional component that is positive and steady except for brief reversals at the end of December 2012 and February 2013. The zonal wind component is negative and fluctuating particularly in mid-January 2013. The coastal gradient is small for mean meridional flow: shelf of V=3 m s−1 vs. coast of 1.6 m s−1. However, the standard deviation of zonal winds is shelf of U=6.6 m s−1 vs. coast of 2 m s−1. During spells of strong easterlies from transient anticyclones, the wind vorticity contribution to coastal upwelling is dominated by the gradient of .
Time series of 6-hourly CFSr2 thermal variables (Fig. 2g, h) show large land–sea differences, as expected. Coastal air temperatures fluctuate diurnally from 15–35∘ C while shelf temperatures rise gradually from 18 to 21∘ C over the summer. Standard deviations vary from shelf 0.4∘ C to coast 5.7∘ C. The landward increase of temperature drives a sea breeze contribution to the mean meridional flow. The CFSr2 surface heat fluxes show diurnal amplitude 0–300 W m−2 over the coast but stay in the range 50–100 W m−2 at the shelf edge. Hence the 0.2∘ CFSr2 captures the coastal gradients that govern the shelf oceanography, with attributes consistent with NAVGEM v1.4 that underpin the HYCOM reanalysis.
Large swings in the meridional wind (cf. Fig. 2f) are accompanied by dips in air pressure <1005 hPa on 27 December, 29 January, and 9 and 17 February 2013, which identify coastal low passage associated with trapped shelf waves. In the 27 December and 17 February cases, the wind reversed from 15 m s−1 SE (before) to 12 m s−1 NW (after passage of the coastal low). CFSr2 wind vorticity and sub-surface vertical motions in False Bay (point 3) changed from s−1 / +0.7 m d−1 (before) to s−1 / -0.8 m d−1 (after passage of the coastal low) and sea temperatures dipped < 15∘ C. Yet much of the time environmental changes are inhibited in semi-enclosed False Bay, thus sustaining productivity.
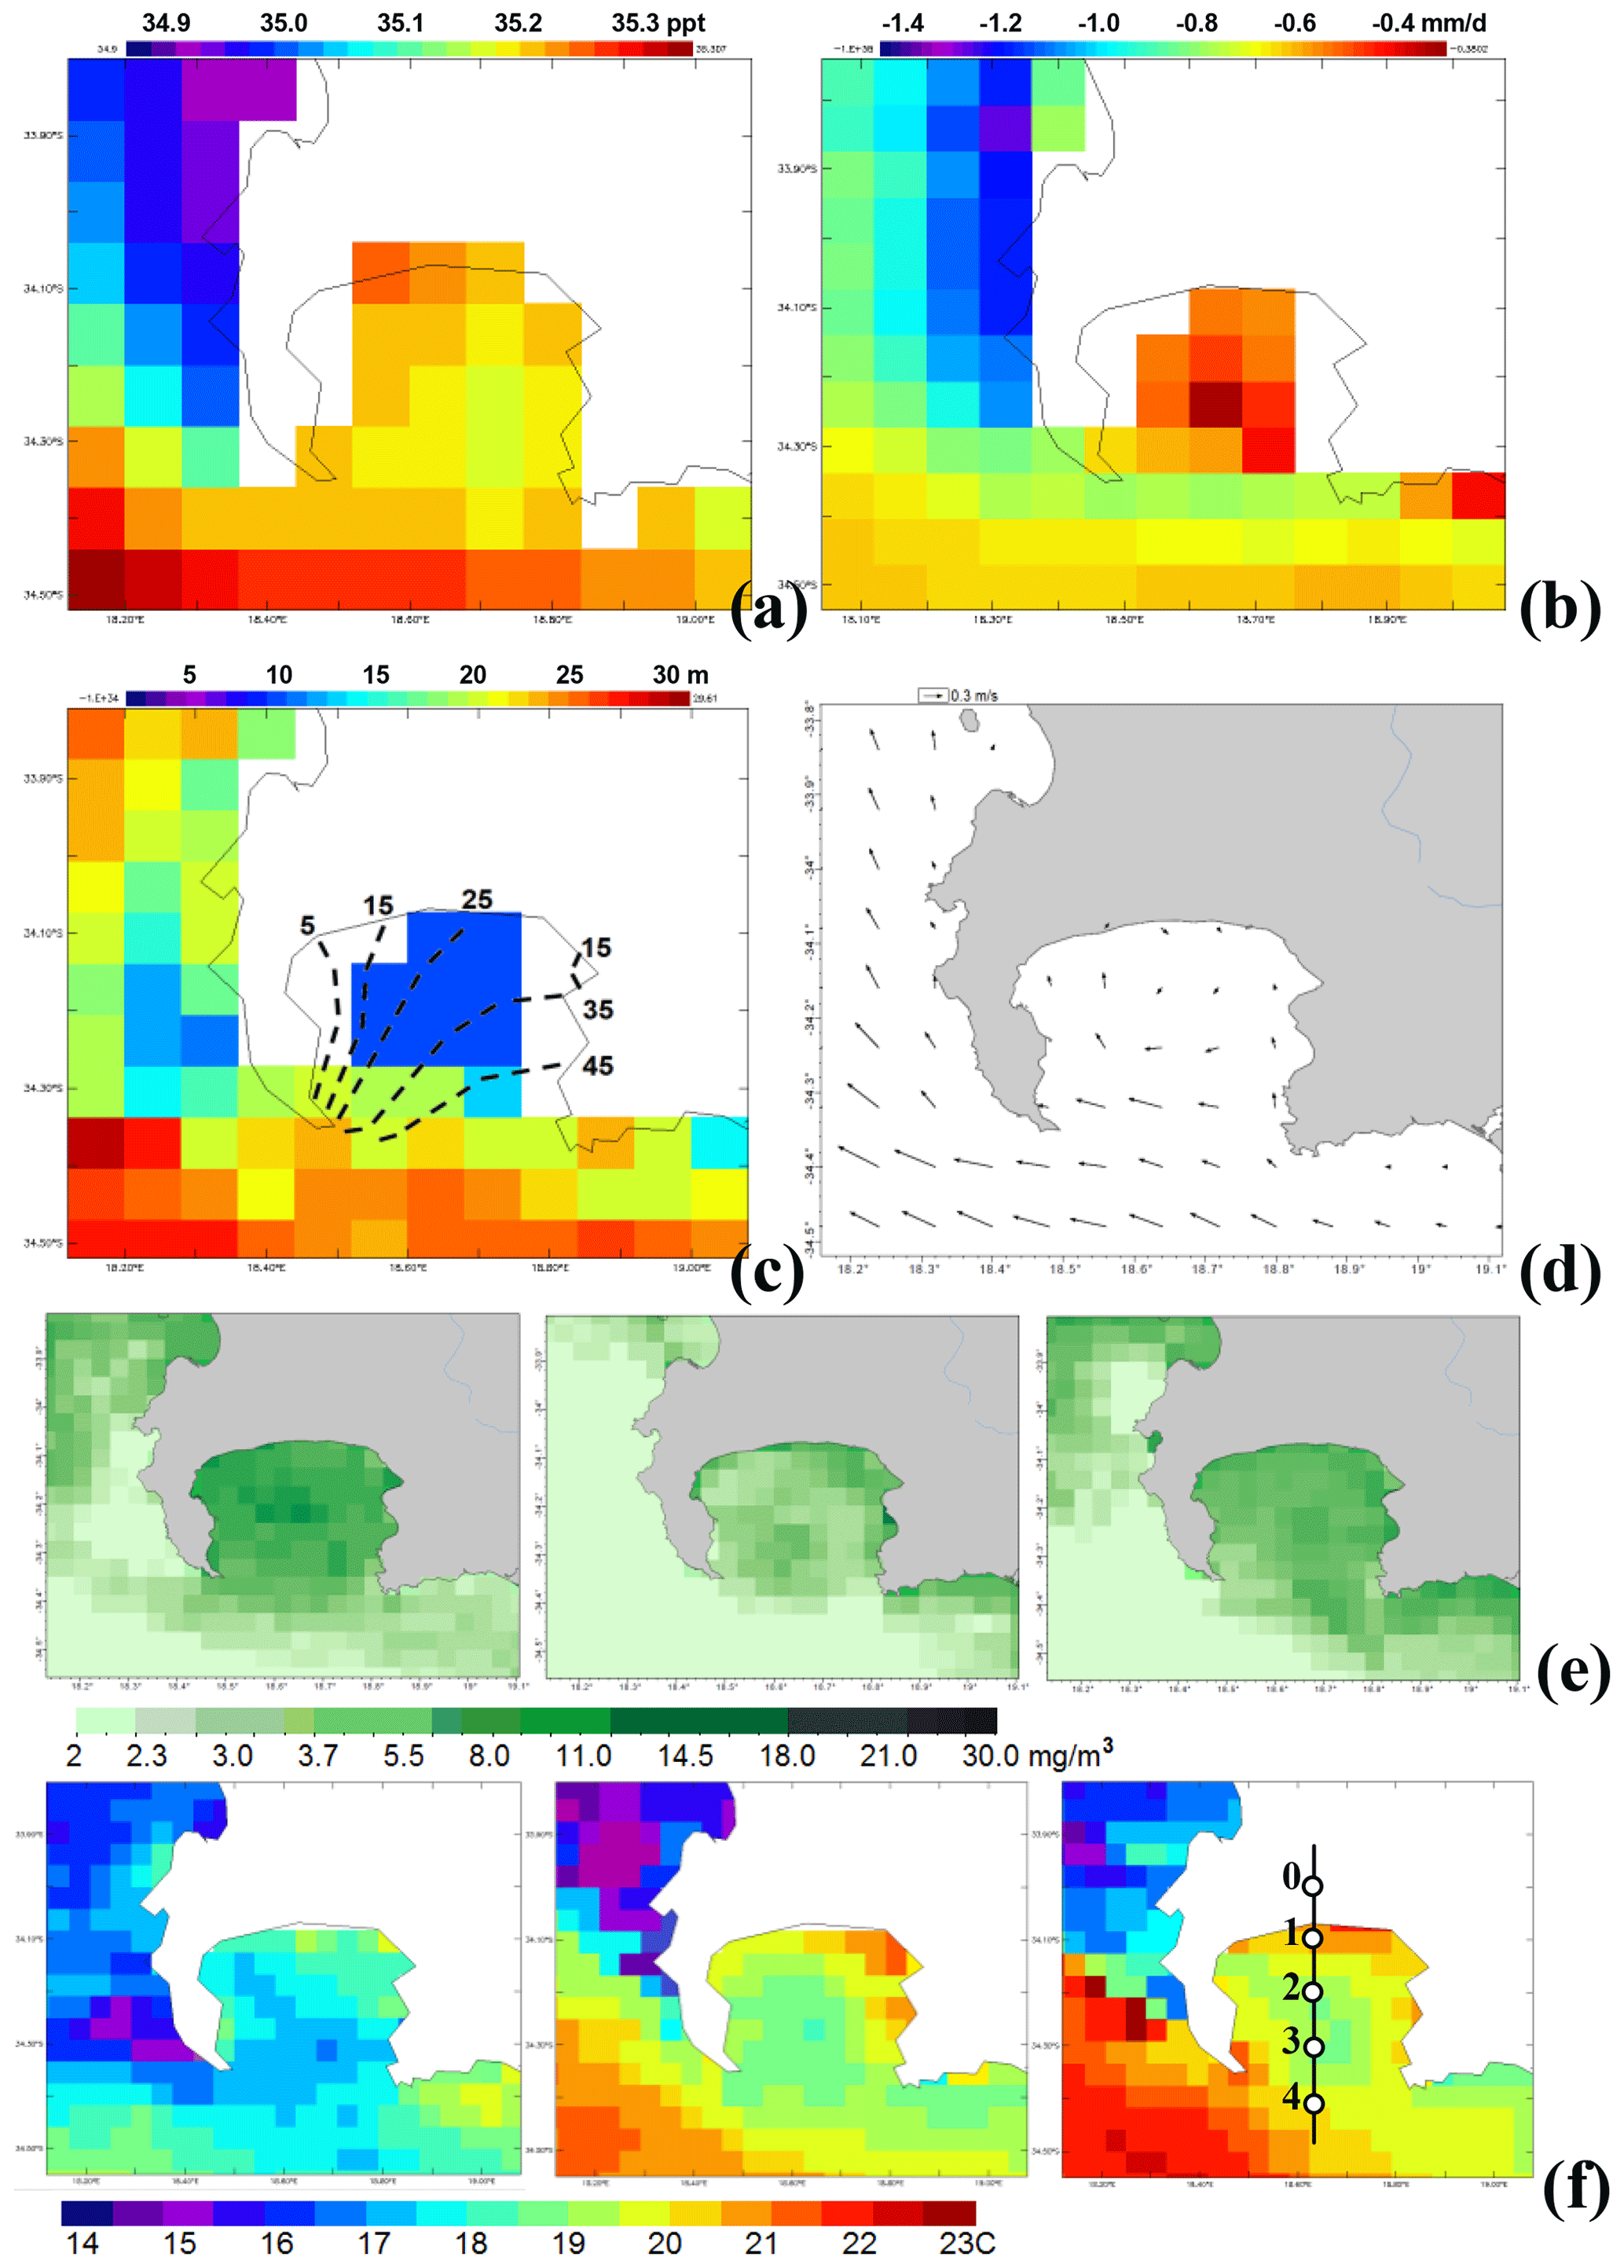
Figure 3Mean ocean conditions for summer December 2012–February 2013 from HYCOM hindcast: (a) 2 m salinity, (b) precipitation – evaporation balance, (c) mixed layer depth (m), and wave energy isolines (kW m−1, after Joubert and van Niekerk 2013) and (d) 6 m currents, with raster shading at native resolution. Sequences of December 2012 (left) to February 2013 monthly 4 km satellite: (e) VIIRS ocean colour (derived chlorophyll) and (f) MODIS sea surface temperature (C). Points in (f) indicate virtual stations for time series, Table 2 statistics and the depth section in Fig. 4a–d.
3.2 Shelf oceanography
In this section we characterize the shelf oceanography south of Cape Town. The shelf edge has cooler waters and lower salinity due to upwelling (Fig. 3a). Equatorward winds drive surface currents into False Bay, trapping a warm salty zone against the north coast > 35.3 g kg−1 (Fig. 3a), consistent with Dufois and Rouault (2012). The summer water flux is negative across the region during summer (Fig. 3b), as evaporation of 4–6 mm d−1 exceeds precipitation of 1–2 mm d−1. Fast and divergent winds desiccate the Cape Peninsula in contrast with orographic lifting over the eastern mountains. Hence the P–E field varies from neutral inside False Bay to strongly negative west of Cape Town.
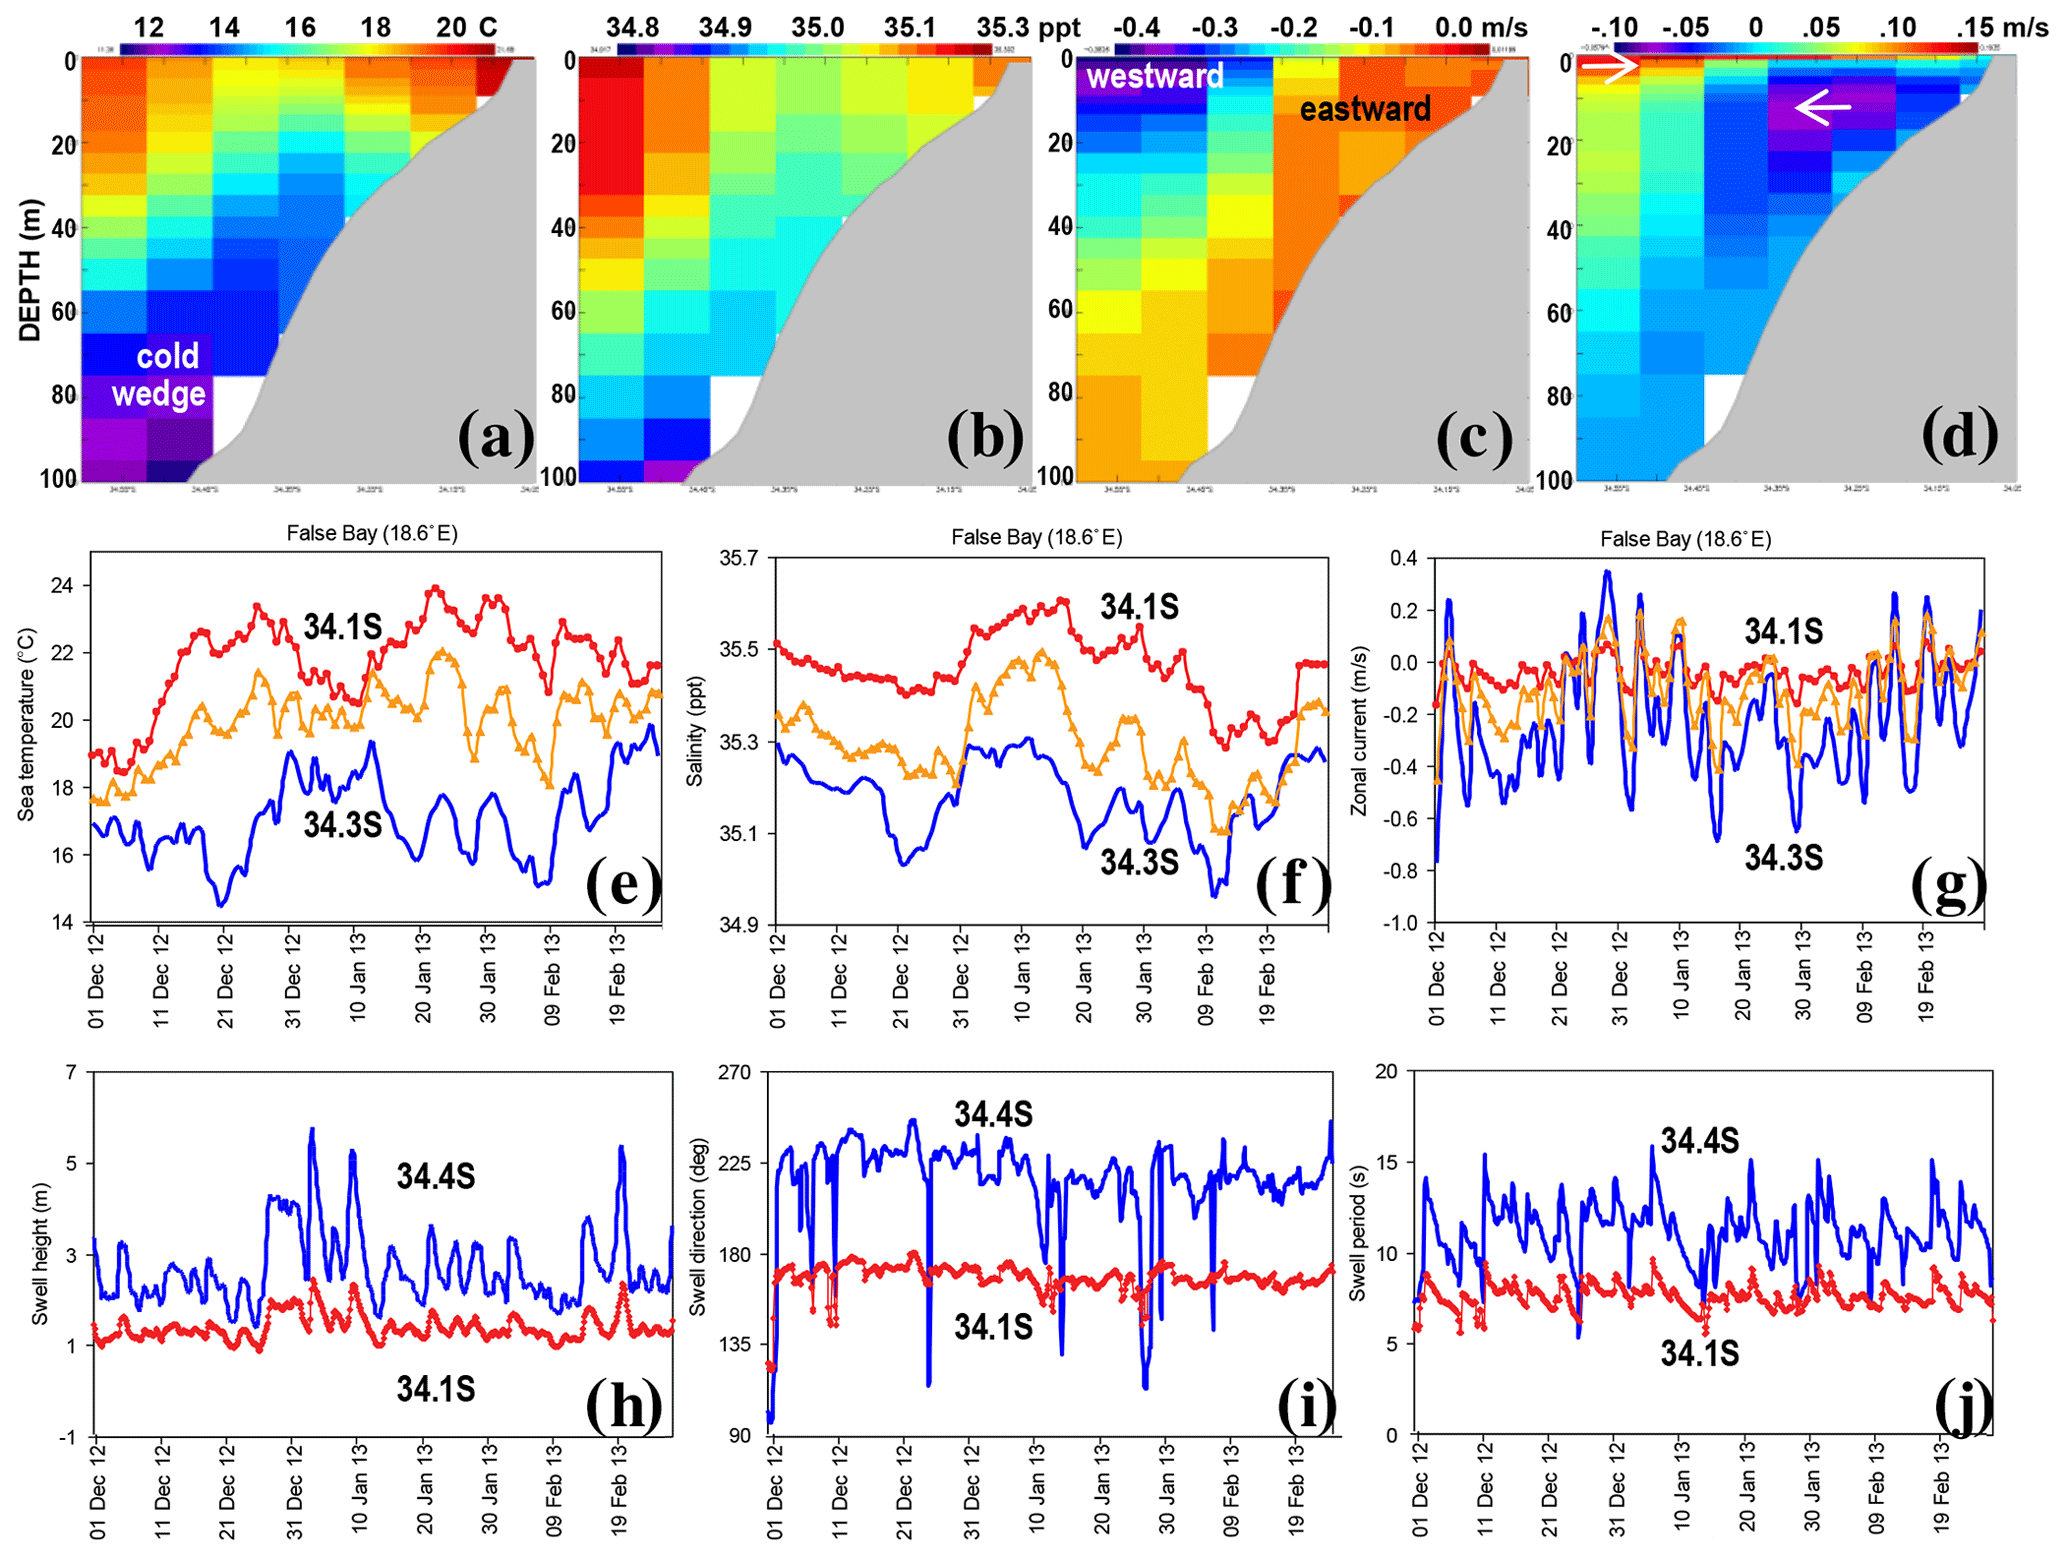
Figure 4HYCOM mean summer December 2012–February 2013 depth section along 18.6∘ E: (a) temperature, (b) salinity, (c) zonal current and (d) meridional current, with shelf profile. (e–g) Surface layer T, S and U time series at points 1–3. Ocean wave time series December 2012–February 2013 from W3 data at points 1 and 4: (h) swell height, (i) swell direction and (j) swell period. Shelf edge is plotted – blue, mid-bay – orange, coastal – red.
False Bay has a narrow exposure to the Southern Ocean. SW swells of ∼ 3 m tend to refract into the bay producing greater energy on the east side (Fig. 3c). The ocean mixed layer depth ranges from < 10 m inside False Bay to > 50 m outside, due to kinematic exposure and thermal stratification. Mean currents (Fig. 3d) are weak in the northern half of False Bay but westward at the shelf edge and drawn into the Benguela Current.
Winds and currents are sheared into clockwise gyres that increase water residence time enabling nutrient build-up and phytoplankton blooms within False Bay (satellite-derived chlorophyll > 10 mg m−3; Fig. 3e). Month-to-month changes in productivity relate to wind angle, intensity of pulsed upwelling (cf. Fig. A2b) and prevalence of rotary circulations.
Figure 3f presents the December 2012–February 2013 sequence of monthly sea surface temperature (SST) fields based on MODIS IR satellite. There is a cold upwelling plume west of Cape Town and warm waters off the shelf in January–February 2013. Yet within False Bay we find subtle structures: remnants of repeated upwelling off Cape Hangklip create a cold area in the middle of the bay, while warmer waters hug the northeastern coast, beneath the wind shadow from the eastern mountains. Sustained upwelling and widespread cold SSTs in December 2012 are replaced by warm intrusions and nearshore quiescent zones by February 2013.
Table 3Correlation of daily time series in the period December 2012 to February 2013: HYCOM surface layer temperature T, salinity S and zonal current Uc (points 1, 3; cf. Fig. 4a), ASCAT wind U V components (point 2) at 1 d lead and W3 swell height (point 4). Values > are significant at 90 % confidence (bold) with ∼ 40 degrees of freedom.
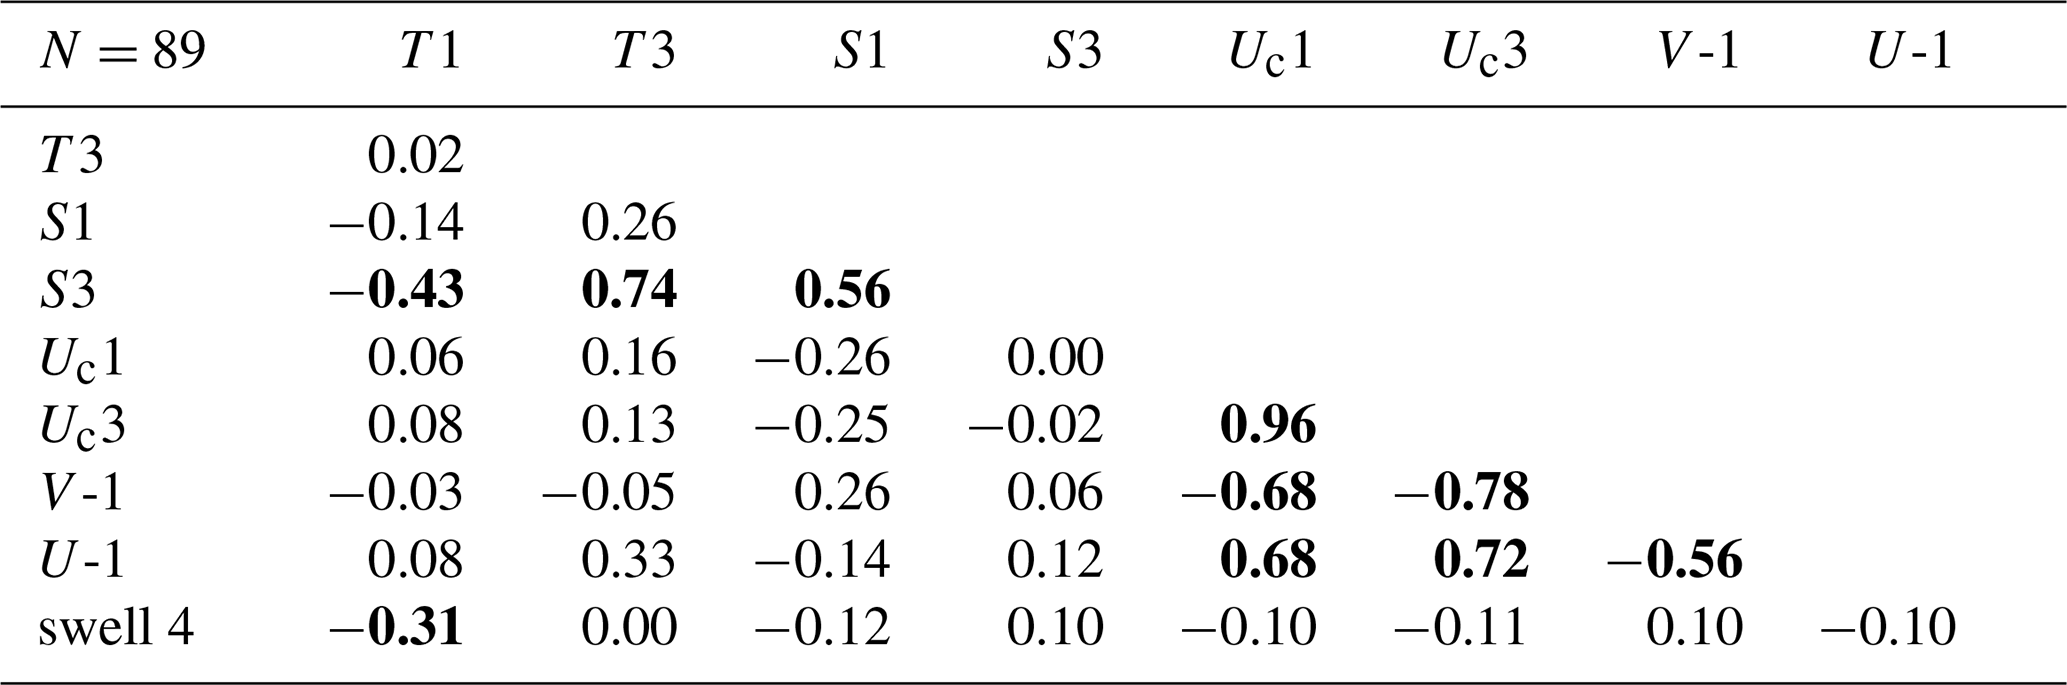
The December 2012–February 2013 mean HYCOM depth sections on 18.6∘ E in Fig. 4a–d illustrate an upper 20 m layer with temperatures and salinity of 20 ∘C and 35.4 g kg−1. Shelf-edge upwelling creates a wedge of 12 ∘C, 34.7 g kg−1 waters below 60 m. Zonal currents are weak inshore and strongly westward at shelf edge above 20 m. HYCOM meridional currents reveal an overturning circulation, with deeper offshore flow and very shallow onshore flow. HYCOM daily time series at three points along 18.6∘ E exhibit pulsing and cooler fresher conditions in the south compared with the north (Fig. 4e–g). There is a strong gradient in zonal currents from −5 m s−1 at shelf edge to zero at the coast.
Statistical analysis is given in Table 3 and reveals that inshore (point 1 at 34.1∘ S) sea temperatures are more sensitive to waves than winds, and offshore (point 3 at 34.3∘ S) sea temperatures follow zonal winds more than currents. We note that offshore and inshore temperatures are uncorrelated, and offshore salinity is negatively related to inshore temperature. Coastal and shelf-edge salinity are correlated, and inshore salinity responds to zonal currents (−r). HYCOM zonal currents inshore and offshore associate similarly with winds at 1 d lead and – being correlated with each other – suggest that Ekman transport frequently overrides the clockwise gyre.
Time series of WAVEWATCH III swell characteristics at coast and shelf-edge virtual buoys are given in Fig. 4h–j. Swell heights offshore (point 4 at 34.4∘ S) oscillate around 2 m except for a spell of stormy seas at the end of December 2012. Nearshore swell heights (point 1 at 34.1∘ S) remain near 1 m after attenuation. Southwest swell directions prevail offshore with an occasional swing to southeast. Inshore directions refract to southerly and show little change. Swell periods from 9 to 13 s tend to “bunch” inshore < 8 s. The 25 km W3 reanalysis captures the coastal gradient in swell properties (Johnson et al., 1999), but finer resolution or downscaling would be ideal.
This case study highlights the role played by False Bay at the interface between the Benguela and Agulhas ecosystems. Initially the bay is dominated by cool upwelling waters that are well mixed, but through the summer a warm surface layer forms near the coast – improving productivity (cf. Fig. 3e). The leakage of nutrient-rich upwelled waters back into False Bay is evident (cf. Fig. 4a). Stormy spells can disrupt the coastal gradient (in early January 2013; cf. Fig. 4e, h) that is typical of summer.
Mesoscale datasets were employed to study the marine climate and physical oceanography of False Bay near Cape Town during summer 2012–2013. The 0.083 ‰ HYCOM v3.1 reanalysis offers new insights into the spatial and temporal nature of air–sea interactions, and consistently represents a coastward reduction of mixing that enhances thermal stratification (cf. Figs. 3c, 4a, b). Cross-coast gradients are particularly strong for zonal wind and current, temperature and salinity, and wave height. The reanalysis circulation obtains westward flow across the mouth (−0.4 m s−1) and a weak clockwise gyre in mid-bay (cf. Fig. 3d) that sustains productivity (Fig. 3e). The mesoscale features seen here are consistent with Coleman (2019), whose high-resolution model assimilated the very same HYCOM and ECMWF-WRF data. Under summertime southeasterly winds, the clockwise gyre in False Bay was modelled to have inflow/outflow of ∼ 0.2 m s−1 on the upper-west/lower-east side, and a sea temperature increase of ∼ 5 ∘C from deep offshore to surface inshore. These features (, ) are reflected in the HYCOM reanalysis (cf. Fig. 4d, e) and in Coleman (2019, Figs. 6–22, 6–26 therein). Cool nutrient-rich Benguela waters enter False Bay from its southwest corner and infiltrate the bay via the clockwise circulation (cf. Figs. 3d, 4c). The cool wedge underlies a warm layer near the coast during summer (cf. Fig. 4a) that improves productivity.
Temporal variability during summer is dominated by SE winds that accelerate near Cape Hangklip and fan out across False Bay, promoting dry weather. Virtual buoy time series in December 2012–February 2013 exhibit weather-pulsed upwelling, and station intercomparisons build confidence that coupled reanalyses yield opportunities to study air–sea interactions in coastal zones with complex topography. Yet our 0.083∘ reanalysis has 16 data points in the embayment south of Cape Town. Finer downscaling could propagate ambiguities from microwave radiometers. Thus we propose that current technology allows many questions to be answered, from coastal processes to climate change. Longer summers in Cape Town could see a shift in resources from land to sea. This sentinel for global impacts on sustainable development needs ongoing scientific assessment in support of holistic management.

Figure A1Comparison of daily HYCOM model at nearest grid point and (a) sea surface height from tide gauge off Simonstown in western False Bay (cf. Fig. 1b) and (b) sea surface temperature from NOAA satellite; 2008–2015. Bottom: comparison of hourly ECMWF v5 reanalysis at nearest grid point and weather station observation off Simonstown in western False Bay, 1 December 2012–28 February 2013: (c) wind speed, (d) pressure, and (e) air temperature.
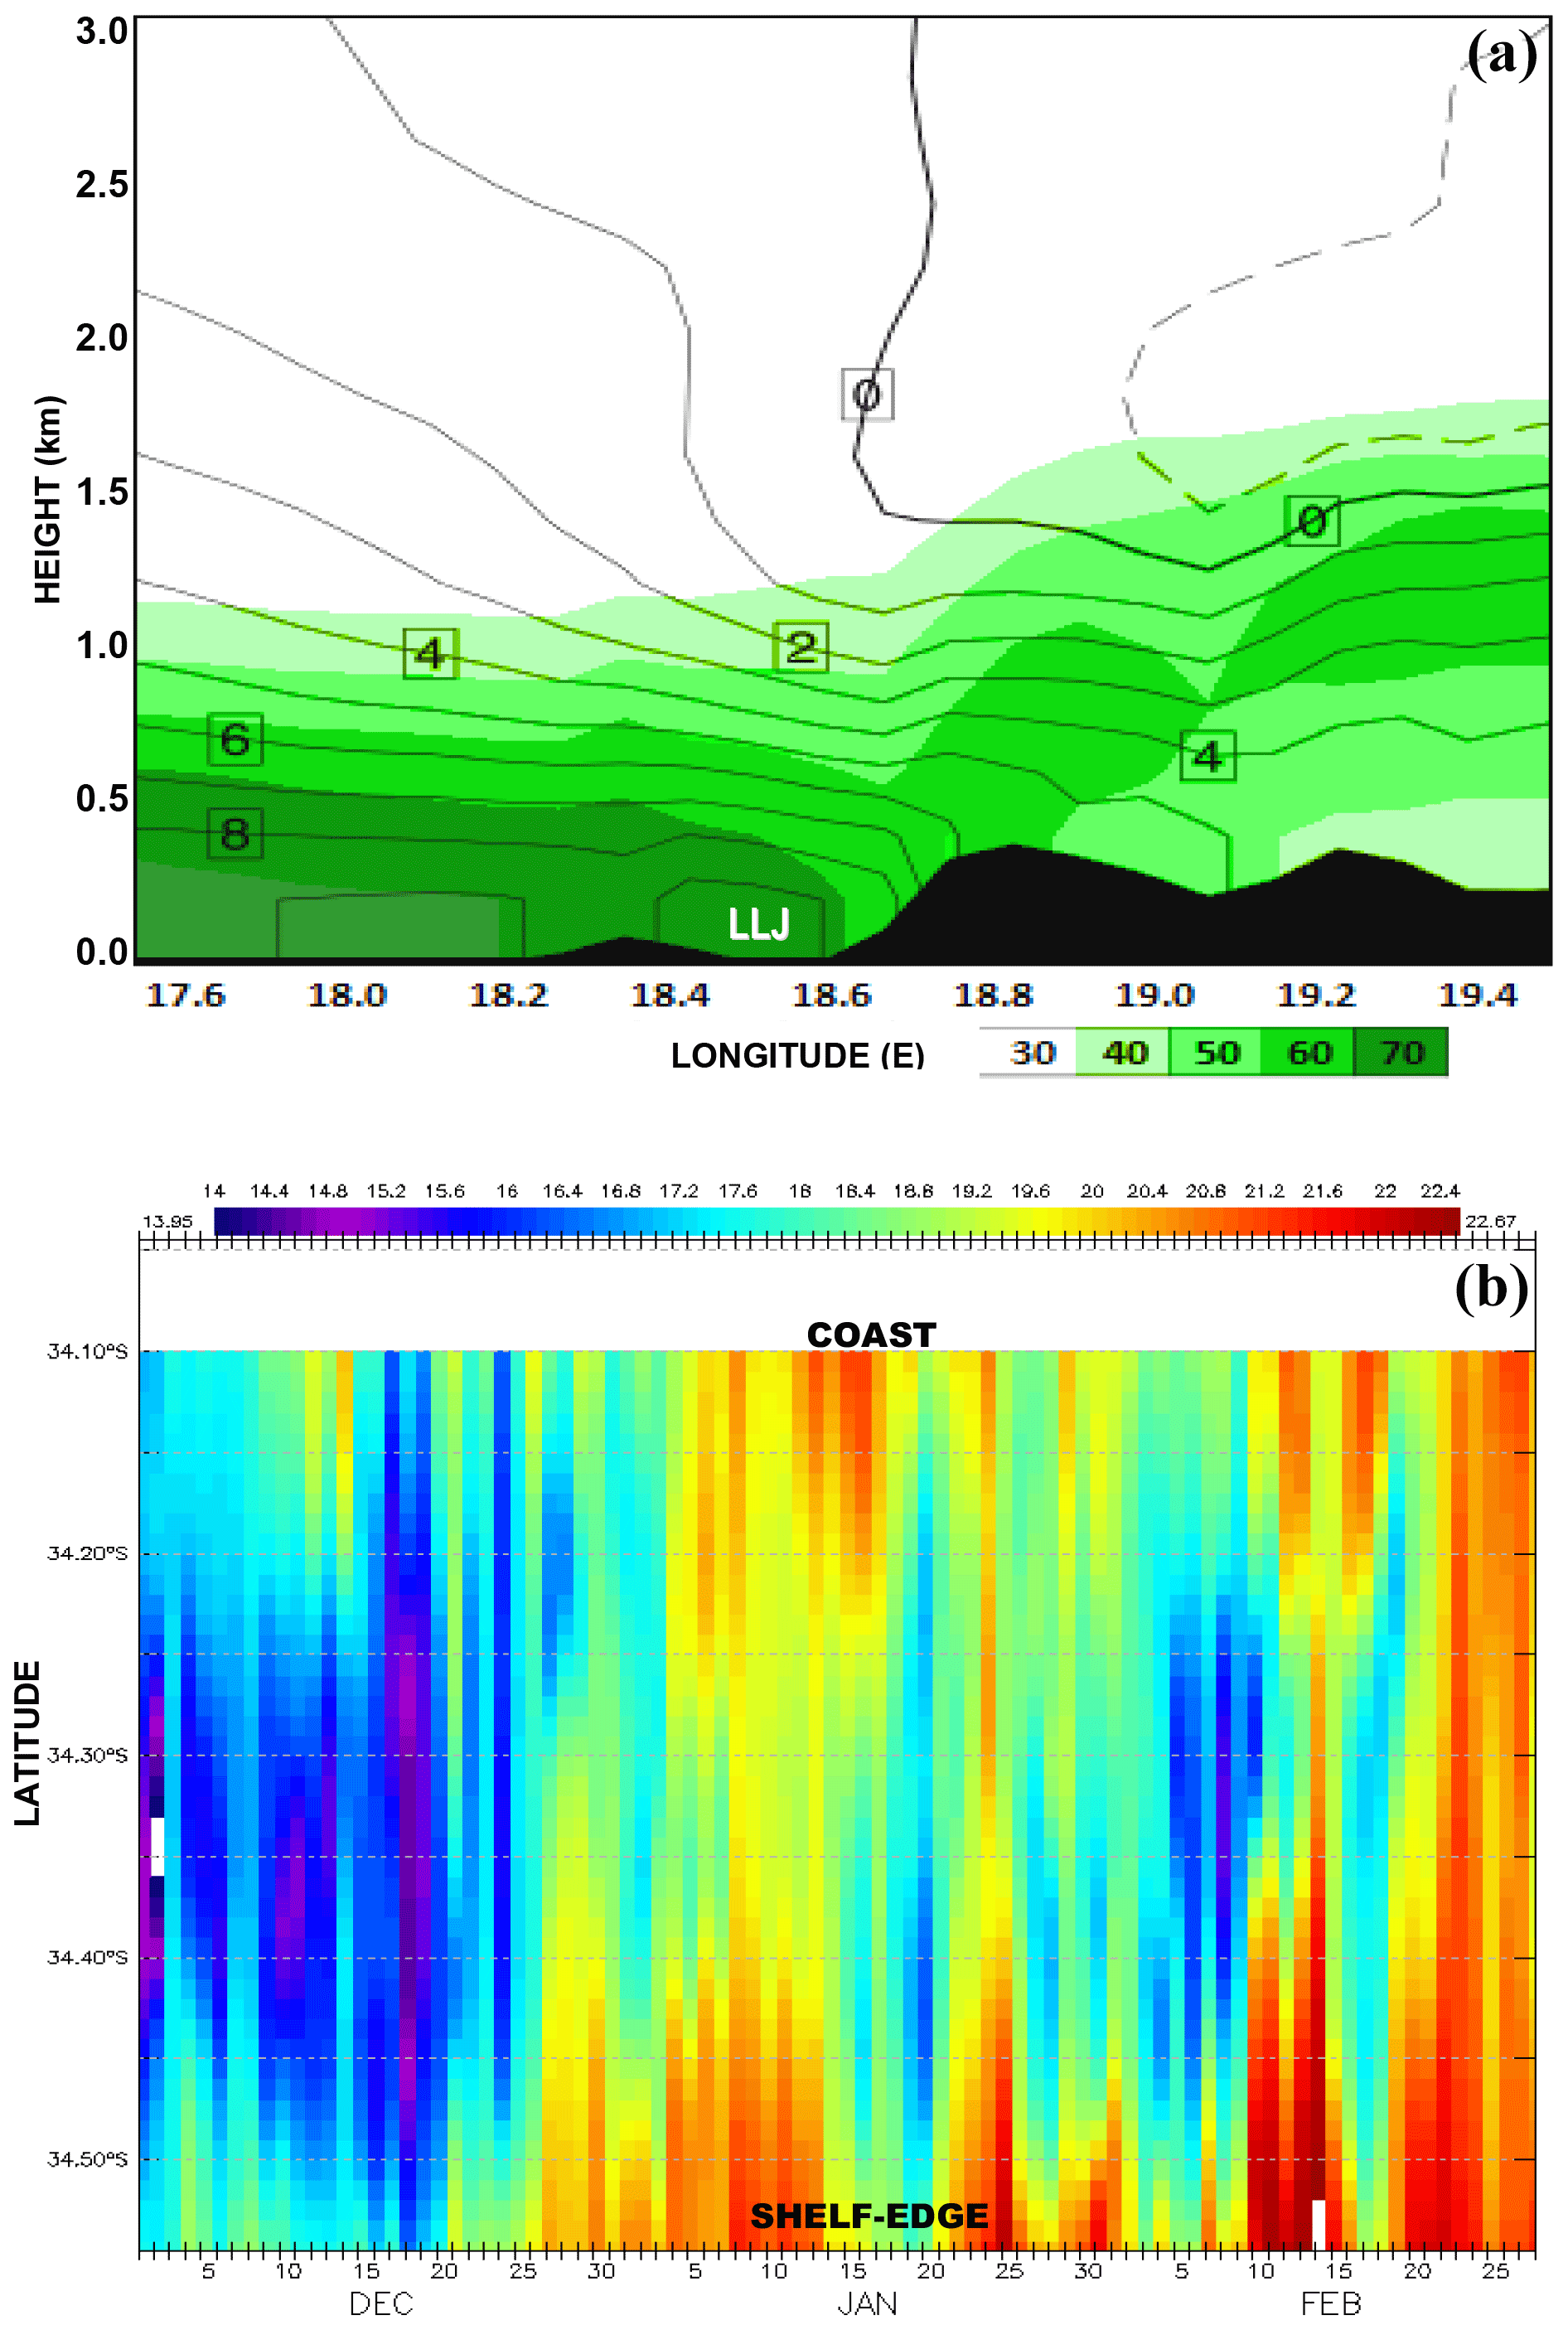
Figure A2(a) downscaled WRF meridional wind isotachs and humidity % (shaded) in December 2012–February 2013, plotted in vertical section on 34.1∘ S, identifying the shallowness of equatorward flow, corresponding with Fig. 2c and d. (b) Hovmöller plot of daily 1 km SST on 18.6∘ E, assimilated by GHR L4 satellite product, along the same line as Fig. 4.
A spreadsheet of data analysis is available on request to the author.
The author contributed all analyses and interpretive writing except Figs. 2c, d and A2a were contributed by Sen Chiao.
The authors declare that they have no conflict of interest.
We thank the SA Institute for Maritime Technology for provision of hourly weather station, tide gauge, and buoy data off Simonstown. The author recognizes ongoing support from the SA Department of Education. Sen Chiao of San José State University, CA, provided the WRF-downscaled wind fields.
This paper was edited by Piers Chapman and reviewed by Geoff Bailey and one anonymous referee.
Bang, N. D.: The southern Benguela current region in February, 1966, Part II. Bathythermography and air-sea interactions, Deep Sea Res., 18, 209–224, 1971.
Blamey, L. K., Howard, J. A. E., Agenbag, J., and Jarre, A.: Regime-shifts in the southern Benguela shelf and inshore region, Prog. Oceanogr. 106, 80–95, 2012.
Botes, W.: Shallow water current meters comparative study: False Bay, CSIR Report T/SEA 8803, 14, Stellenbosch, 1988.
Brown, A. C., Davies, B. R., Day, J. A., and Gardiner, A. J. C.: Chemical pollution loading of False Bay, in: False Bay 21 years on – an environmental assessment, edited by: Jackson, W. P. U., Proc. Symposium, Trans. R. Soc. S. Afr., 47, 703–716, 1991.
Brundrit, G.: Global Climate Change and Adaptation: City of Cape Town sea-level rise risk assessment, Phase 5 Full investigation of alongshore features, City of Cape Town, 2009.
Chassignet, E. P., Hurlburt, H. E., Metzger, E. J., Smedstad, O. M., Cummings, J. A., Halliwell, G. R., Bleck, R., Baraille, R., Wallcraft, A. J., Lozano, C., Tolman, H. L., Srinivasan, A., Hankin, S., Cornillon, P., Weisberg, R., Barth, A., He, R., Werner, F., and Wilkin, J.: US GODAE: Global ocean prediction with the Hybrid coordinate ocean model (HYCOM), Oceanography, 22, 64–75, 2009.
Coleman, F.: The development and validation of a hydrodynamic model of False Bay, MSc thesis, Univ. Stellenbosch, 166 pp, 2019.
Cummings, J. A. and Smedstad, O. M.: Variational data assimilation for the global ocean, in: Data Assimilation for Atmospheric, Oceanic and Hydrologic Applications Vol. 2, edited by: Park, S. K. and Xu, L., Springer-Verlag, 303–343, 2013.
Dee, D. P., Uppala, S. M., Simmons, A. J., Berrisford, P., Poli, P., Kobayashi, S., Andrae, U., Balmaseda, M. A., Balsamo, G., Bauer, P., Bechtold, P., Beljaars, A. C. M., van de Berg, L., Bidlot, J., Bormann, N., Delsol, C., Dragani, R., Fuentes, M., Geer, A. J., Haimberger, L., Healy, S. B., Hersbach, H., Hólm, E. V., Isaksen, L., Kållberg, P., Köhler, M., Matricardi, M., McNally, A. P., Monge‐Sanz, B. M., Morcrette, J.-J., Park, B.-K., Peubey, C., de Rosnay, P., Tavolato, C., Thépaut, J.-N., and Vitart, F.: The ERA-interim reanalysis: configuration and performance of the data assimilation system, Q. J. Roy. Meteor. Soc., 137, 553–597, 2011.
de Vos, M., Rautenbach, C., and Ansorge, I.: The inshore circulation at Fish Hoek, Department of Oceanography UCT, Internal report, Cape Town, 2014.
Dufois, F. and Rouault, M.: Sea surface temperature in False Bay (South Africa): towards a better understanding of its seasonal and inter-annual variability, Cont. Shelf Res., 43, 24–35, 2012.
Engelbrecht, F., Landman, W. A., Engelbrecht, C., Landman, S., Bopape, M. M., Roux, B., McGregor, J. L., and Thatcher, M.: Multi-scale climate modelling over Southern Africa using a variable-resolution global model, Water SA, 37, 647–658, 2011.
Fourie, J. P., Ansorge, I., Backeberg, B., Cawthra, H. C., MacHutchon, M. R., and van Zyl, F. W.: The influence of wave action on coastal erosion along Monwabisi Beach, Cape Town, S. Afr. J. Geometrics., 4, 96–109, 2015.
Giljam, R.: The effect of the Cape Flats aquifer on the water quality of False Bay, MSc Thesis, Univ. Cape Town, 2002.
Griffiths, C., Robinson, T., Lange, L., and Mead, A.: Marine biodiversity in South Africa – state of knowledge, spatial patterns and threats, PloS One, 5 e123008, https://doi.org/10.1371/journal.pone.0012008, 2010.
Grundlingh, M., Hunter, I., and Potgieter, E.: Bottom currents at the entrance to False Bay, Cont. Shelf Res., 9, 1029–1048, 1989.
Grundlingh, M. and Largier, J.: Physical oceanography of False Bay: a Review, Trans. Roy. Soc. S. Afr., 47, 387–400, 1991.
Hughes, P. and Brundrit, G. B.: The vulnerability of the False Bay coast line to the projected rise in sea level, Trans. Roy. Soc. S. Afr., 47, 519–534, 1991.
Hurlburt, H. E., Brassington, G. B., Drillet, Y., Kamachi, M., Benkiran, M., Bourdallé-Badie, R., Chassignet, E.P., Jacobs, G. A., LeGalloudec, O., Lellouche, J.-M., Metzger, E. J., Oke, P. R., Pugh, T. F., Schiller, A., Smedstad, O. M., Tranchant, B., Tsujino, H., Usui, N., and Wallcraft, A. J.: High resolution global and basin-scale ocean analyses and forecasts, Oceanography, 22, 110–127, 2009.
Jacobson, M., Hermes, J., Jackson-Veitch, J., and Halo, I.: The influence of a spatially varying wind field on the circulation and thermal structure of False Bay during summer: a numerical modelling study, Dept Oceanography, UCT Internal Report, 2014.
Johnson H. K., Vested, H. J., Hersbach, H., Højstrup, J., and Larsen, S. E.: The coupling between wind and waves in the WAM Model, J. Atmos. Ocean. Technol., 16, 1780–1790, 1999.
Joubert, J. R. and van Niekerk, J. L.: South African wave energy resource data, a case study, Stellenbosch, CRSES Internal Report, Stellenbosch, 2013.
Jury, M. R.: The weather of False Bay, Trans. Roy. Soc. S. Afr., 47, 401–427, 1991.
Jury, M. R. and Reason, C. J.: Extreme subsidence in the Agulhas-Benguela air mass transition, Bound.-Lay. Meteorol., 46, 35–51, 1989.
Jury, M. R. and Brundrit, G. B.: Temporal organisation of upwelling in the southern Benguela ecosystem by resonant coastal trapped waves in the ocean and atmosphere, S. Afr. J. Mar. Sci., 12, 219–224, 1992.
Largier, J. L., Chapman, P., Peterson, W. T., and Swart, V. P.: The Western Agulhas Bank — circulation, stratification and ecology, S. Afr. J. Mar. Sci. 12, 319–339, 1992.
Lloyd, P., Plaganyi, E. E., Weeks, S. J., Magno-Canto, M., and Plaganyi, G.: Ocean warming alters species abundance patterns and increases species diversity in an African subtropical reef-fish community, Fish Oceanogr., 21, 78–94, 2012.
Lutjeharms, J. R. E. and Stockton, P. L.: Aspects of the upwelling regime between Cape Point and Cape Agulhas South Africa, S. Afr. J. Mar. Sci., 10, 91–102, 1991.
Mather, A., Garland, G., and Stretch, D.: Southern African sea levels: corrections, influences and trends, Afr. J. Mar. Sci., 31, 145–156, 2009.
Metzger, E. J., Smedstad, O. M., Thoppil, P. G., Hurlburt, H. E., Cummings, J. A., Wallcraft, A. J., Zamudio, L., Franklin, D. S., Posey, P. G., Phelps, M. W., Hogan, P. J., Bub, F. L., and DeHaan, C. J.: US Navy operational global ocean and Arctic ice prediction systems, Oceanography, 27, 32–43, 2014.
Metzger, E. J., Helber, R. W., Hogan, P. J., Posey, P. G., Thoppil, P. G., Townsend, T. L., Wallcraft, A. J., Smedstad, O. M., Franklin, D. S., Zamudio-Lopez, L., and Phelps, M. W.: (HYCOM-NCODA) Global Ocean Forecast System 3.1 validation testing, NRL/MR/7320-17-9722, 2017.
Nelson, G., Cooper, R. M., and Cruickshank, S.: Time series from a current meter array near Cape Point, Trans. Roy. Soc. S. Afr., 47, 471–482, 1991.
Nicholson, S. A.: The circulation and thermal structure of False Bay: a process-oriented numerical modelling and observational study, MSc Thesis. Dept. Oceanography, Univ. Cape Town, 2011.
Parsons, R. P.: Assessment of the impact of the Cape Flats on surrounding water bodies, S. Peninsula Municipal Report 074/SPM-1, Somerset West, 2000.
Penven, P., Brundrit, G. B., deVerdiere, C. A., Freon, P., Johnson, A. S., and Shillington, F. A.: A regional hydrodynamic model of upwelling in the Southern Benguela, S. Afr. J. Sci., 97, 472–475, 2001.
Pfaff, M. C., Logston, R. C., Raemaekers, S. J. P. N., Hermes, J. C., Blamey, L. K., Cawthra, H. C., Colenbrander, D. R., Crawford, R. J. M., Day, E., duPlessis, N., Elwen, S. H., Fawcett, S. E., Jury, M. R., Karenyi, N., Kerwath, S. E., Kirkman, S. P., Kock, A. A., Krug, M., Lamberth, S. J., Omardien, A., Pitcher, G. C., Rautenbach, C., Robinson, T. B., Rouault, M., Ryan, P. G., Shillington, F. A., Sowman, M., Sparks, C. C., Turpie, J. K., vanNiekerk, L., Waldron, H. N., and Yeld, E. M.: A synthesis of three decades of socio-ecological change in False Bay South Africa: setting the scene for multidisciplinary research and management, Elem. Sci. Anth., 7, 32, https://doi.org/10.1525/elementa.367, 2019.
Rautenbach, C.: The influence of a space varying wind field on wind-wave generation in False Bay South Africa, (preprint) SAMSS conference, Stellenbosch, 2014.
Reynolds, R. W., Rayner, N. A., Smith, T. M., Stokes, D. C., and Wang, W.: An improved in situ and satellite SST analysis for climate, J. Climate 15, 1609–1625, 2002.
Rouault, M., Pohl, B., and Penven, P.: Coastal oceanic climate change and variability from 1982 to 2009 around South Africa, Afr. J. Mar. Sci., 32, 237–246, 2010.
Roux, G. B. and Toms, G.: Reduction of seawall overtopping at the Strand. Univ. Stellenbosch, Internal Report, 2013.
Saha, S., Moorthi, S., Pan, H.-L., Wu, X., Wang, J., Nadiga, S., Tripp, P., Kistler, R., Woollen, J., Behringer, D., Liu, H., Stokes, D., Grumbine, R., Gayno, G., Wang, J., Hou, Y.-T., Chuang, H-Y., Juang, H-M., Sela, J., Iredell, M., Treadon, R., Kleist, D., vanDelst, P., Keyser, D., Derber, J., Ek, M., Meng, J., Wei, H., Yang, R., Lord, S., vanDenDool, H., Kumar, A., Wang, W., Long, C., Chelliah, M., Xue, Y., Huang, B., Schemm, J.-K., Ebisuzaki, W., Lin, R., Xie, P.-P., Chen, M., Zhou, S., Higgins, W., Zou, C.-Z., Liu, Q., Chen, Y., Han, Y., Cucurull, L., Reynolds, R. W., Rutledge, G., Goldberg, M.: The NCEP Climate Forecast System version 2, J. Climate, 27, 2185–2208, 2014.
Schlegel, R. W., Oliver, E. C., Wernberg, T., and Smit, A. J.: Nearshore and offshore co-occurrence of marine heatwaves and cold-spells, Prog. Oceanogr., 151, 189–205, 2017.
Schilperoort, D. E., Shillington, F., Hermes, J., and Rautenbach, C.: Investigation into the capability of the Conformal-Cubic Atmospheric Model in representing the wind fields and patterns over the Fasle Bay region in comparison to NCEP/NCAR and observational data, Dept. Oceanography, Univ. Cape Town, Internal Report, 2013.
Shannon, L. V. (Ed.): South African Ocean Colour and Upwelling Experiment, Sea Fisheries Research Institute, Cape Town, 270 pp, 1985.
Shannon, L. V. and Field, J. G.: Are fish stocks food-limited in the Southern Benguela pelagic ecosystem?, Mar. Ecol. Prog. Ser. 22, 7–19, 1985, https://doi.org/10.3354/meps022007.
Skamarock, W. C., Klemp, J. B.. Dudhia, J., Gill, D. O., Barker, D. M., Huang, X., Wang, W., and Powers, J. G.: A description of the Advanced Research WRF v3, NCAR Tech Note 475 pp, 2008.
Tadross, M. A., Taylor, A., and Johnston, P. A.: Understanding Cape Town's climate, in: Climate change at the city scale: impacts, mitigation and adaptation in Cape Town, edited by: Cartwright, A., Oelofse, G., Parnell, S., and Ward, S., Routledge, 9–20, 2012.
Taljaard, S.: The origin and distribution of dissolved nutrients in False Bay. Trans. Royal Soc. S. Afr. 47, 4–5, 1991.
Taljaard, S. van Ballegooyen, R., and Morant, P.: False Bay Water Quality Review, CSIR Report ENV-SC 86: 2, Stellenbosch, 2000.
Theron, A., Rossouw, M., Barwell, L., Maherry, A., Diedericks, G., and de Wet, P.: Quantification of risk to coastal areas and development: wave run-up and erosion, (preprint) Science real and relevant conf., Pretoria, CSIR Internal Report, 2010.
Theron, A., Rossouw, M., Rautenbach, C., von Saint-Ange, U., Maherry, A., and August, M.: Determination of inshore wave climate along South African coast: phase 1 coastal hazard and vulnerability assessment, CSIR Internal Report, Stellenbosch, 2014a.
Theron, A., Rossouw, M., Rautenbach, C., van Niekerk, L., Luck-Vogel, M., and Cilliers, L.: South African coastal vulnerability assessment: phase 2, Stellenbosch: CSIR internal report, 2014b.
Tolman, H. L.: User manual and system documentation of WAVEWATCH-III version 2.22, NCEP Tech. Note, Washington, 139 pp, 2002.
van Ballegooyen, R.: The dynamics relevant to the modelling of synoptic scale circulations within False Bay, Trans. Roy. Soc. S. Afr., 47, 419–431, 1991.
Wainman, C. K., Polito, A., and Nelson, G.: Winds and subsurface currents in the False bay region, South Africa, S. Afr. J. Mar. Sci., 5, 337–346, 1987.
World Ocean Atlas: Temperature/Salinity, NOAA Atlas NESDIS 73/74, (observation density), edited by: Locarnini, R. A., 40 pp., 2013.