the Creative Commons Attribution 4.0 License.
the Creative Commons Attribution 4.0 License.
 | 23 Jan 2020
Photoproduction of nitric oxide in seawater
Ye Tian
Gui-Peng Yang
Chun-Ying Liu
Pei-Feng Li
Hong-Tao Chen
Hermann W. Bange
Nitric oxide (NO) is a short-lived intermediate of the oceanic nitrogen cycle. However, our knowledge about its production and consumption pathways in oceanic environments is rudimentary. In order to decipher the major factors affecting NO photochemical production, we irradiated several artificial seawater samples as well as 31 natural surface seawater samples in laboratory experiments. The seawater samples were collected during a cruise to the western tropical North Pacific Ocean (WTNP, a N–S section from 36 to 2∘ N along 146 to 143∘ E with 6 and 12 stations, respectively, and a W–E section from 137 to 161∘ E along the Equator with 13 stations) from November 2015 to January 2016. NO photoproduction rates from dissolved nitrite in artificial seawater showed increasing trends with decreasing pH, increasing temperature, and increasing salinity. In contrast, NO photoproduction rates (average: mol L−1 s−1) in the natural seawater samples from the WTNP did not show any correlations with pH, water temperature, salinity, or dissolved inorganic nitrite concentrations. The flux induced by NO photoproduction in the WTNP (average: mol m−2 s−1) was significantly larger than the NO air–sea flux density (average: mol m−2 s−1), indicating a further NO loss process in the surface layer.
- Article
(4979 KB) - Full-text XML
- BibTeX
- EndNote


Nitric oxide (NO) is a short-lived intermediate of the oceanic nitrogen cycle; see Bange (2008) and Kuypers et al. (2018). There are only a few reports about the oceanic NO determination method so far because of its high reactivity with other substances (Zafiriou et al., 1980; Lutterbeck and Bange, 2015; Liu et al., 2017). NO is produced and consumed during various microbial processes such as nitrification, denitrification, and anammox (Schreiber et al., 2012; Kuypers et al., 2018). Moreover, it is known that both phytoplankton and zooplankton can metabolize NO, and they are influenced by ambient (extracellular) NO concentrations (Singh and Lal, 2017; Wang et al., 2017; Astier et al., 2018).
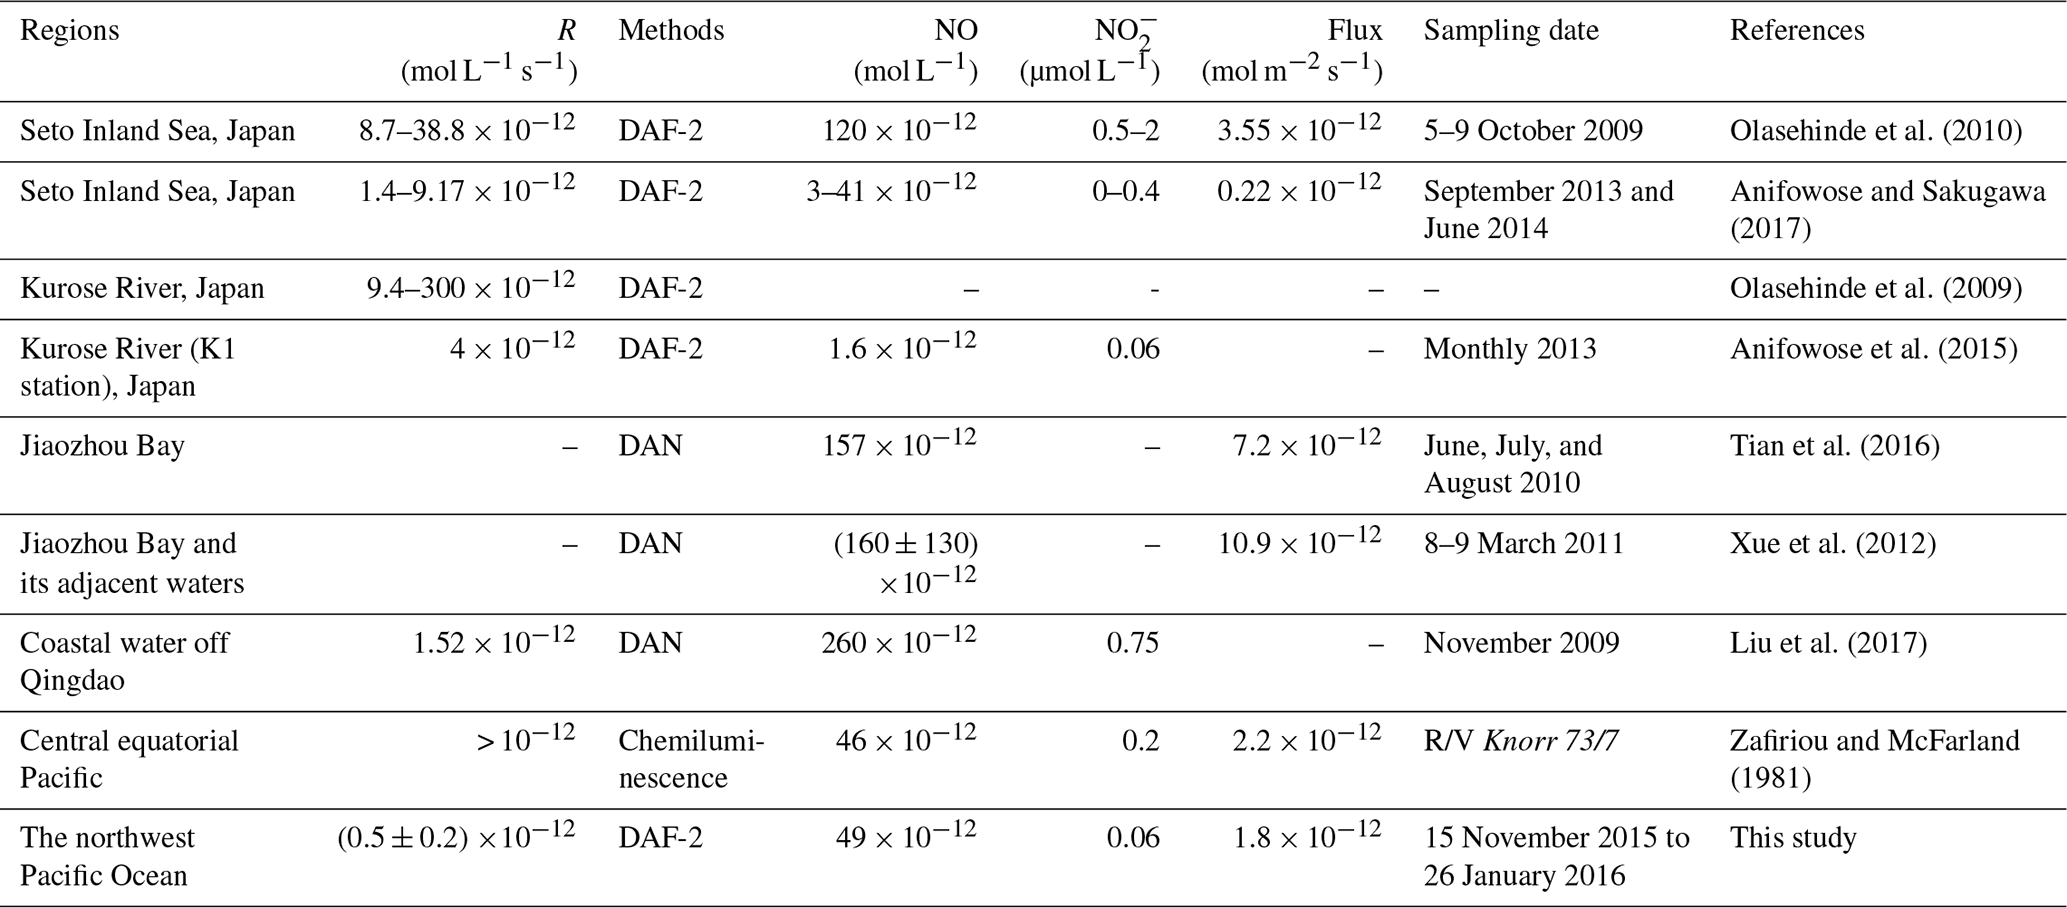
Table 1Photoproduction rates (R), methods, average NO concentrations, concentrations, and average flux densities of NO in different regions.
Apart from (micro)biological processes, NO can be produced photochemically from dissolved nitrite () in the sunlit surface ocean (Zafiriou and True, 1979; Zafiriou and McFarland, 1981):
Mack and Bolton (1999) reviewed the possible subsequent reactions of Reaction (1); for example, the produced NO and hydroxyl radical (OH•) of Reaction (1) could react to produce HNO2 reversely (Reaction 2) and some reactions that consumed NO or its oxides like Reaction (3) to Reaction (8).
Besides, in natural sunlit seawater, photolyzed dissolved nitrate () could be a source of NO through (Reaction 9); during the process of ammonium () oxidation into and , NO might be an intermediate (Joussotdubien and Kadiri, 1970), or NO could be produced through amino-peroxyl radicals () through Reactions (10) to (14) (Laszlo et al., 1998; Clarke et al., 2008).
Table 1 summarizes studies about photochemical production of NO measured in the surface waters of the equatorial Pacific Ocean (Zafiriou et al., 1980; Zafiriou and McFarland, 1981), the Seto Inland Sea (Olasehinde et al., 2009, 2010; Anifowose and Sakugawa, 2017), the Bohai Sea and Yellow Sea (Liu et al., 2017; Tian et al., 2019), and the Kurose River (Japan) (Olasehinde et al., 2009; Anifowose et al., 2015). NO concentration was determined by the balance of the production and the removal process; thus, changes in NO production and removal rates could influence NO concentration in the seawater. In the surface seawater, the photochemical process was regarded as the main production process (Zafiriou and McFarland, 1981; Olasehinde et al., 2010; Anifowose et al., 2015). In Table 1, NO photoproduction rates varied among different seawater samples: the photoproduction rates in Kurose River (average: mol L−1 s−1) were the largest, which might be due to an increase in nitrite being released into the river because of agricultural activity during the study time. However, NO concentration was about mol L−1, at the lowest level, which was because of higher scavenging rate in river water. Anifowose et al. (2015) found that NO lifetime, which was defined as the reciprocal of first-order scavenging rate constant of NO (Olasehinde et al., 2010) in Kurose River, was only 0.25 s. The lifetime of NO showed an increasing trend from river (several seconds) via inland sea (dozens of seconds) to open sea (dozens to hundreds of seconds), reviewed in Anifowose and Sakugawa (2017). However, NO showed higher concentration levels in coastal waters than in open sea; higher photoproduction rates in coastal waters than open sea, or other production processes in coastal waters, might account for this.
In this study, we present the results of our measurements of NO photoproduction in laboratory experiments using artificial and natural seawater samples. The major objectives of our studies were (i) to decipher the factors affecting NO photoproduction in seawater, (ii) to determine the photoproduction rates of NO from samples collected during a cruise to the western tropical North Pacific Ocean (WTNP), and (iii) to quantify the role of photoproduction as a source of NO in the surface waters of the WTNP.
2.1 Determination of dissolved NO in aqueous samples
For the measurements of dissolved NO, we applied the method described by Olasehinde et al. (2009). In brief, NO in the aqueous samples was determined by trapping it with added 4,5-diaminofluorescein (DAF-2, chromatographic grade from Sigma-Aldrich, USA) and measuring the reaction product triazolofluorescein (DAF-2T) with a high-performance liquid chromatography system (HPLC). We used an Agilent 1260 Infinity HPLC (Agilent Technologies Inc., USA) system equipped with a Venusil XBP-C18 column (5.0 µm; 4.6 mm × 250 mm i.d.). The column temperature was set to 25 ∘C and the mobile phase was comprised of acetonitrile (HPLC grade from Merck, Germany) and phosphate buffer (disodium hydrogen phosphate heptahydrate, guaranteed reagent from Sinopharm Chemical Reagent Co., Ltd, China) solution (10 mmol L−1 at pH 7.4) with a ratio of 8:92 (v:v) and a flow rate of 1 mL min−1 in the isocratic mode.
The injected sample volume was 5.0 µL. The eluate was analyzed with a fluorescence diode array detector at wavelengths of 495 and 515 nm for excitation and emission, respectively. The retention time of DAF-2T was about 5.5 min.
An aliquot of 10 mL artificial seawater was bubbled with N2 gas at a flow of 10 mL min−1 for 2 h to remove O2 after 10 min of ultrasonic and heat degassing. The solution was then bubbled with high-purity NO gas (99.9 %, Dalian Date Gas Ltd., China) for 30 min. The concentration of the saturated NO stock solution was 1.4 mmol L−1, which could be used within 3 h (Lantoine et al., 1995). A series of diluted NO solutions were prepared in N2-purged water from the NO stock solution using a microsyringe (Xing et al., 2005; Liu et al., 2017). And the series samples were trapped by DAF-2 solution.
The detection limit of dissolved NO in Milli-Q water was mol L−1, which was determined by (3×0.03) with the blank samples (n=7) and the slope (0.101) in the low concentration range (3.3–33 × 10−10 mol L−1). Average relative standard error of the NO measurements was ±5.7 % at a concentration of mol L−1.
2.2 Set up of irradiation experiments
We performed irradiation experiments with Milli-Q water (18.2 MΩcm, Millipore Company, USA), artificial seawater, and natural seawater samples. Artificial seawater was prepared by dissolving 23.96 g NaCl, 5.08 g MgCl2, 3.99 g Na2SO4, 1.12 g CaCl2, 0.67 g KCl, 0.20 g NaHCO3, 0.10 g KBr, 0.03 g H3BO3, and 0.03 g NaF in 1 L of Milli-Q water (Bajt et al., 1997) and filtered by 0.2 µm polyethersulfone membrane (Pall, USA) before the experiments.
All irradiation experiments (except the experiments for the temperature dependence, see section below) were conducted at a constant temperature of 20 ∘C by controlling the temperature of a thermostat water bath (LAUDA Dr. R. Wobser GmbH & Co. KG, Germany). The height of the cylindrical quartz cuvette used for irradiation was 70 mm and the inner diameter was 14 mm with the volume about 10 mL. The optical pathlength was 70±1 mm. During the experiment, the quartz cuvette, filled with 10 mL sample and blocked by a PTFE stopper, was installed in the simulator and a little higher than the water bath surface. All quartz cuvettes were treated in the same manner except the cuvettes wrapped in aluminum foil, which served as dark control.
Milli-Q water and artificial seawater samples were spiked with varying amounts of NaNO2 (puriss. p.a. ACS grade from Sigma-Aldrich, USA; for details, see sections below). All other chemicals were of analytical grade from Tianjin Kemiou Chemical Reagent Co., Ltd. or Shanghai Sinopharm Chemical Reagent Co., Ltd.
Triplicate samples from each treatment were collected every 0.5 h with an entire irradiation time of 2 h. At the sampling time, the SUNTEST CPS+ was turned off and triplicate subsamples were collected from each sample in the dark with microsyringe (50 µL), and then the cuvettes were quickly put back into the water bath to continue the experiment until 2 h. The results showed that both in Milli-Q and artificial seawater samples, the photoproduced NO showed linear relationship with time (see below). However, for the natural seawater samples, a linear relationship was only found in the irradiation time range of 30 min, while the relationship was not found after 30 min. Therefore, we decided to choose 30 min as the total experimental time for natural seawater samples. Statistical analyses were done using SPSS v.16.0 or Origin 9.0 and results were considered significant at p≤0.05.
The artificial light source was a 1.5 kW xenon lamp, which provided a light intensity of 765 W m−2. The lamp was installed in an immersion well photochemical reactor called SUNTEST CPS+ solar simulator produced by ATLAS, Germany. The solar simulator employed in this study has been demonstrated to produce a spectrum which mimics that of solar radiation and emits radiation of wavelengths from 300 to 800 nm (Wu et al., 2015).
2.3 Experimental outline
2.3.1 Optimal DAF-2 concentration and storage time
In order to find out the optimal DAF-2 concentration, 10 mL of artificial seawater containing 0.5 µmol L−1 was irradiated with various concentrations of DAF-2 ranging from 0.7 to 4.8 µmol L−1 for 2 h.
To ascertain the sample storage time, 10 mL with artificial seawater samples containing 5.0 or 0.5 µmol L−1 were irradiated with various concentrations of DAF-2 for 2 h. After irradiation, samples were kept in the dark and measured every 2 h.
2.3.2 Influence of pH, temperature, salinity, and wavelengths
The influence of the pH was assessed by adjusting artificial seawater samples to pH levels of 7.1, 7.6, and 8.1 by adding appropriate amounts of hydrochloric acid (2 mol L−1) or caustic soda solution (2 mol L−1).
To assess the influence of the temperature, artificial seawater samples were adjusted to temperatures of 10, 20, and 30 ∘C by controlling the temperature of the thermostat water bath.
To assess the influence of the salinity on the photoproduction of NO from dissolved , artificial seawater samples were adjusted to different salinity of 20 ‰, 30 ‰, and 35 ‰ by adding Milli-Q water or NaCl to the stock solution of artificial seawater.
In order to compare the contributions of ultraviolet A (UVA), ultraviolet B (UVB), and visible light to the NO photoproduction, two kinds of light filter film were used (wrapped around the quartz cuvette tubes): (i) a Mylar plastic film (from United States Plastic Corp., Lima, Ohio) which can only shield UVB and (ii) a film, usually used as a car insulation film (from CPFilms Inc., USA), shielding both UVA and UVB (Li et al., 2010; Wu et al., 2015).
2.4 Calculations of photoproduction rates (RNO), photoproduction rate constant (JNO), and reaction yield
For the artificial seawater experiments determining the generation of NO from the photochemical degradation, the data were fitted with a simple linear regression with the form , where y is the NO concentration which was calculated by the signal intensity of DAF-2T at time t, b is the intercept of the fitting equation, and RNO is the photoproduction rate.
The photoproduction rate constant of NO from nitrite (JNO) was determined by preparing different concentrations of (0.5, 2.0, and 5.0 µmol L−1) in Milli-Q water and artificial seawater. The slope of the linear correlation between photoproduction rates and concentrations of represents JNO (Anifowose et al., 2015).
The yield of NO formation (%fNO) from the photodegradation via was estimated according to Anifowose et al. (2015):
where c() is the initial concentration of .
2.5 Seawater samples
Surface seawater samples were collected form a water depth of 1 m during a ship campaign to the western tropical North Pacific Ocean on board the R/V Dong Fang Hong 2 from 13 November 2015 to 5 January 2016. This cruise covered two sections: a N–S section from 36 to 2∘ N along 146 to 143∘ E with 6 and 12 stations, respectively, and a W–E section from 137 to 161∘ E along the Equator with 13 stations (Fig. 1). Stations S0701–S0723 were sampled between 11 and 28 November (i.e., the first part of the N–S section), followed by sampling of the W–E section between 16 and 27 December and finally sampling of stations S0725–S0735 between 30 December 2015 and 5 January 2016 (i.e., second part of the N–S section). In addition, relevant surface currents are indicated in Fig. 1 (Fine et al., 1994; Zhao et al., 2016; Zhang et al., 2018). The location of the Kuroshio Current on 15 November 2015 was referenced from https://www1.kaiho.mlit.go.jp/ (last access: 1 April 2018).
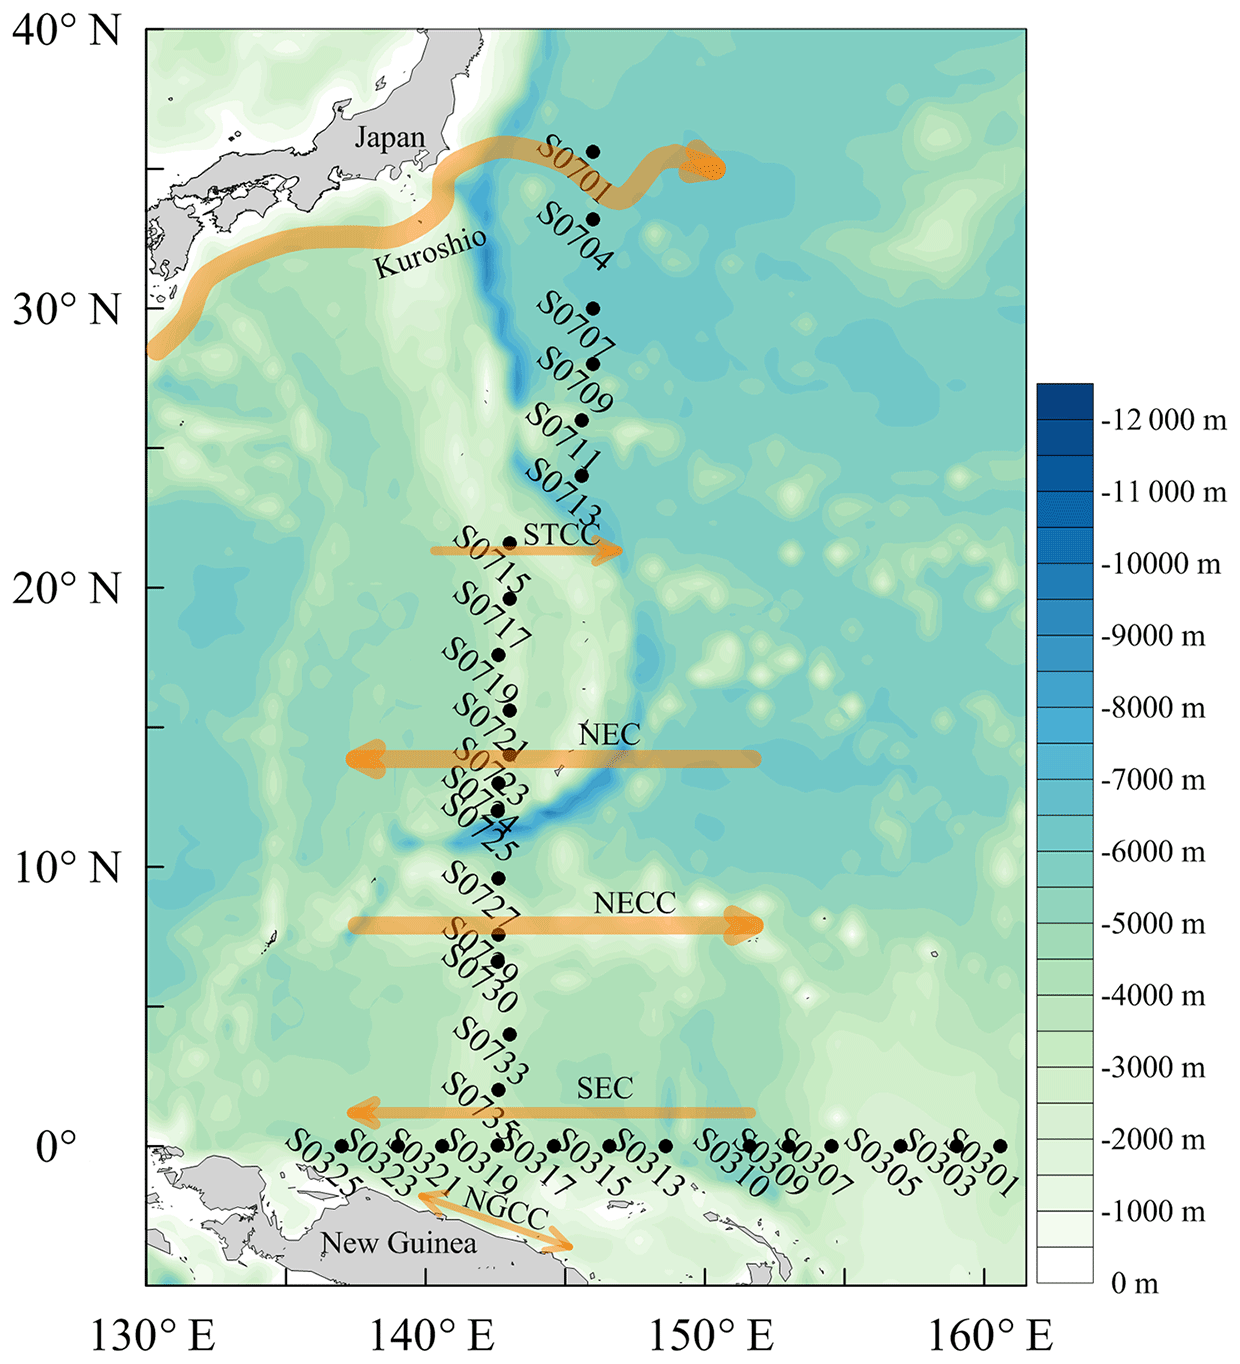
Figure 1Locations of the sampling stations in the western tropical North Pacific Ocean. The acronyms NGCC, SEC, NECC, NEC, and STCC stand for New Guinea Coastal Current, South Equatorial Current, North Equatorial Countercurrent, North Equatorial Current, and Subtropical Countercurrent, respectively.
Seawater samples were collected using 8 L Niskin bottles equipped with silicon O-rings and Teflon-coated springs and mounted on a Sea-Bird CTD (conductivity, temperature, depth) instrument (Sea-Bird Electronics, Inc., USA). A 750 mL black glass bottle was rinsed with in situ seawater three times, and then it was filled with seawater quickly through a siphon. When the overflowed sample reached the half volume of the bottle, the siphon was withdrawn rapidly, and the bottle was sealed quickly. Samples were filtered through 0.45 and 0.2 µm polyethersulfone membranes (Pall, USA) to minimize microbial influence (Kieber et al., 1996; Yang et al., 2011). Then the filtered seawater was transferred in the dark into acid-cleaned and precombusted amber glass bottles, stored in darkness at 4 ∘C and brought back to the laboratory on land. Samples were refiltered with 0.2 µm polyethersulfone membranes (Pall, USA) before the irradiation experiments. DAF-2 solutions were added in the dark. The irradiation experiments were conducted within 2 weeks after the samples arrived in the land laboratory, and the maximum storage time was about 2 months.
2.6 Dissolved inorganic nitrogen (DIN) and pH measurements
The concentrations of dissolved inorganic nitrogen (DIN = nitrate, nitrite, and ammonium) from the cruise were analyzed using an automated nutrient analyzer (SKALAR San system, SKAlAR, the Netherlands) on board. The detection limit was 0.05 µmol L−1 for nitrate, nitrite, and ammonium. When the concentration was below detection limit, 1∕2 of the detection limit (0.025 rounded off to 0.02) was used.
The pH values were measured just before the experiments by using a benchtop pH meter (Orion Star A211, Thermo Scientific, USA) which was equipped with an Orion 8102 Ross combination pH electrode (Thermo Scientific, USA). In order to ensure comparability with the temperature in the irradiation experiments, pH values of the natural seawater samples were measured at 20 ∘C. The pH meter was calibrated with three NIST-traceable pH buffers (pH = 4.01, 7.00, and 10.01 at 20 ∘C). The precision of pH measurements was ±0.01.
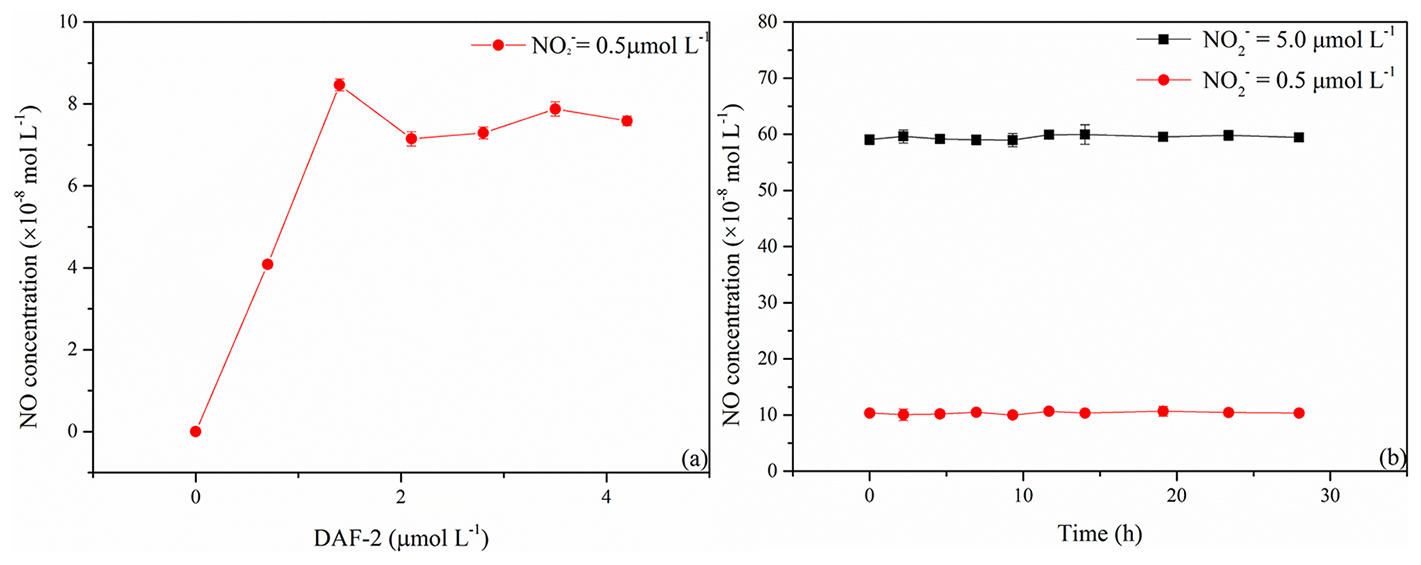
Figure 2Changes in NO concentrations with initial DAF-2 concentrations of 0, 0.7, 1.4, 2.1, 2.8, 3.5, and 4.2 µmol L−1 after an irradiation time of 2 h (a) and changes in different NO concentrations with storage time monitored at about 2 h time intervals (b).
3.1 Optimal DAF-2 concentration and storage time
NO concentrations generated from photolysis of artificial seawater samples with an initial concentration of 0.5 µmol L−1 increased with increasing DAF-2 concentrations, and the reached a maximum at a DAF-2 concentration of 1.4 µmol L−1 (Fig. 2a). At DAF-2 concentrations > 1.4 µmol L−1 no further increase in the NO concentrations was observed. Thus, we used a DAF-2 concentration of 1.4 µmol L−1 for all experiments.
Samples after reaction with DAF-2 and stored at 4 ∘C in the dark were stable for at least 28 h with the measurement interval about 2 h (Fig. 2b). The relative standard deviations of the resulting NO concentrations after irradiating samples containing 0.5 and 5.0 µmol L−1 were ±13 % and ±7 %, respectively. This demonstrated that photolysis samples with NO, which were allowed to react with DAF-2, could be stored for at least 1 d at 4 ∘C in the dark.
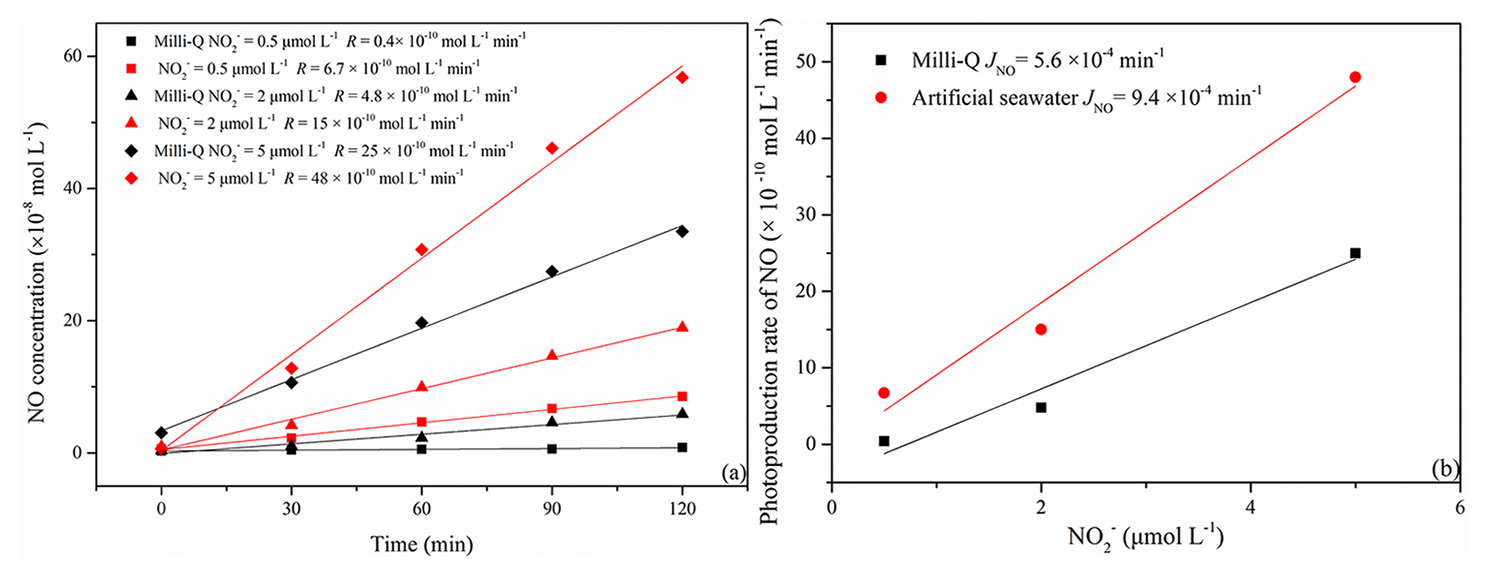
Figure 3Photoproduction rates of NO with 0.5, 2, and 5.0 µmol L−1 (a) and the calculated JNO values in Milli-Q water and artificial seawater (b); red symbols represent the artificial seawater samples, and black symbols represent the Milli-Q water samples.
3.2 Photoproduction of NO in Milli-Q water and artificial seawater
The photoproduction rates of NO in samples with concentrations of 0.5, 2.0, and 5.0 µmol L−1 were generally higher in artificial seawater than in Milli-Q water (Fig. 3a and b).
The resulting JNO values were and min−1 for Milli-Q water and artificial seawater, respectively. They are lower than the JNO of min−1 for Milli-Q water reported by Anifowose et al. (2015). The difference might be explained by a higher solar radiation flux in their study, which was about 1055 W m−2.
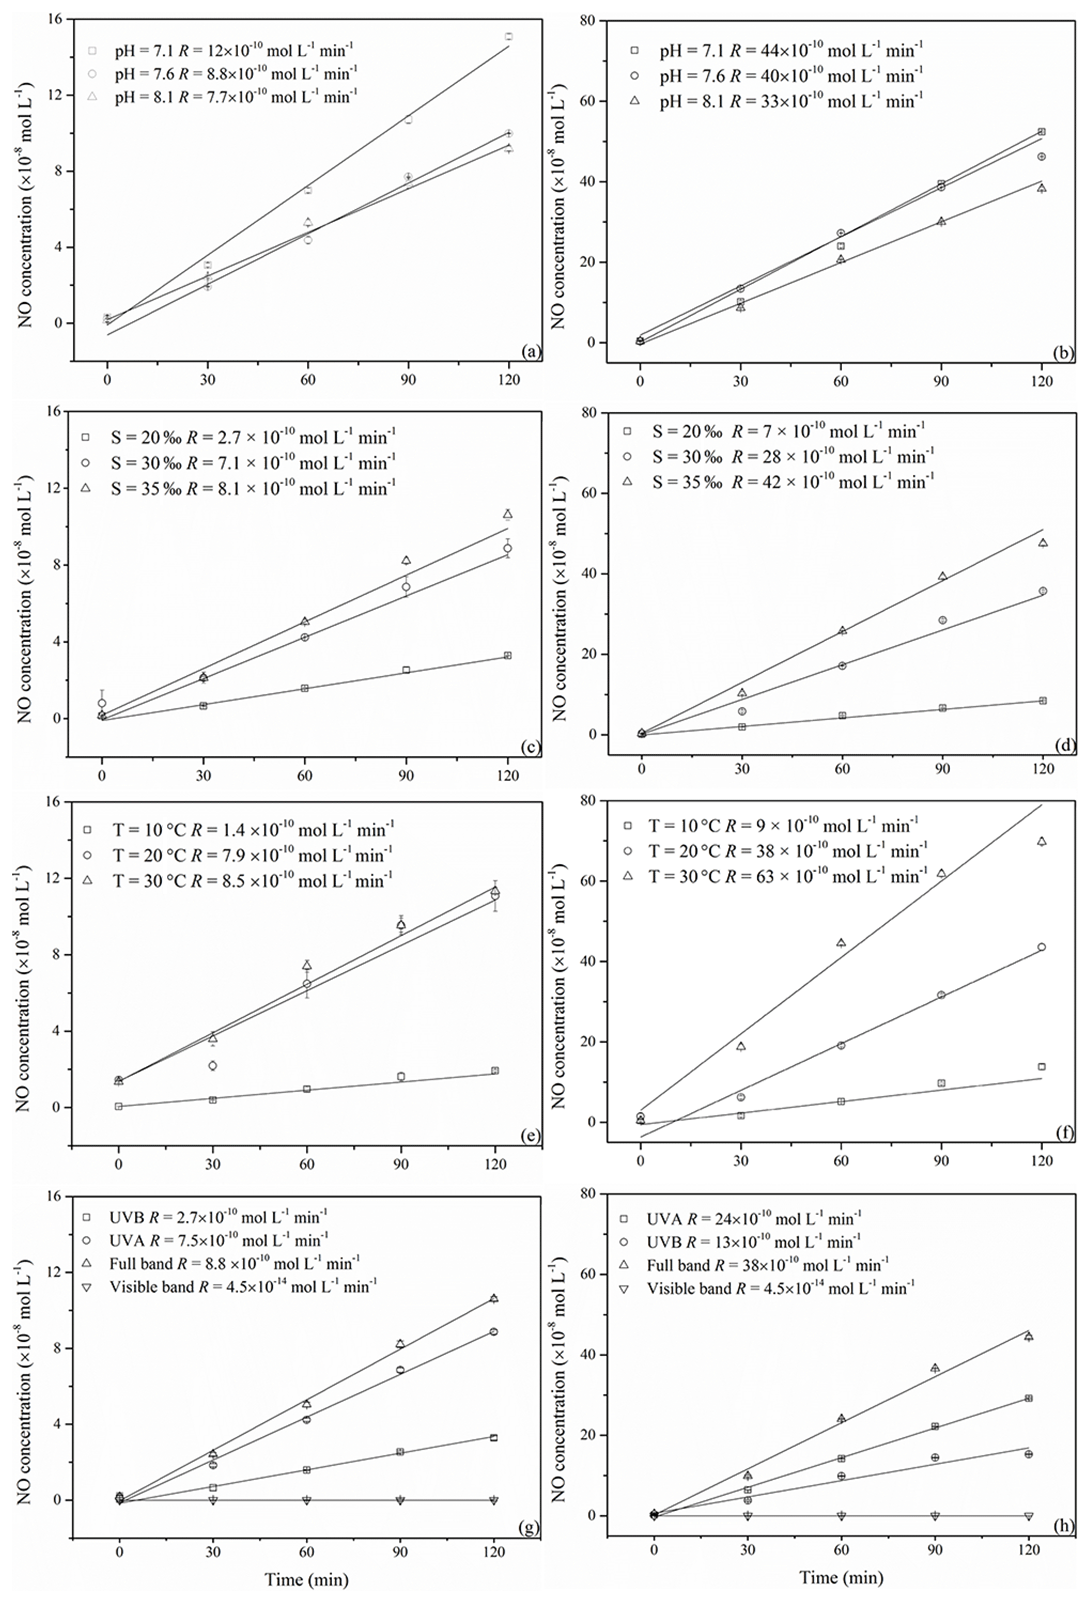
Figure 4NO concentration changes with irradiation time at different pH, salinity, temperature, and illumination conditions (a, c, e, and g for 0.5 µmol L−1 and b, d, f, and h for 5.0 µmol L−1 NO).
Figure 5Changes in NO photoproduction rates with irradiation time at different pH, salinity, temperature, and illumination conditions (a, c, e, and g for 0.5 µmol L−1 and b, d, f, and h for 5.0 µmol L−1 NO).
3.3 Influence of pH, temperature, salinity, and wavelengths
All irradiation experiments conducted in artificial seawater had two different concentrations of 0.5 and 5.0 µmol L−1 added. The resulting NO concentrations were generally higher when irradiating the samples with the initial concentration of 5.0 µmol L−1. NO photoproduction rates showed increasing trends with decreasing pH, increasing temperature, and increasing salinity; the relationships between rates with salinity and temperature were significant (p<0.5) (Figs. 4 and 5).
Reaction (1) indicates that decreasing pH results in lower concentrations of OH−, which in turn will promote NO formation via . This is in line with the finding of Li et al. (2011), who found that the photodegradation rate of in Milli-Q water was higher at pH = 6.5 than at pH = 9.5. Tugaoen et al. (2018) also found the effect of lowering pH to conjugate to HONO, which allowed for HONO photolysis (pH = 2.5). Besides, higher pH could also inhibit N2O4 and N2O3 hydrolysis reaction (Reactions 4 and 8) as reviewed by Mack and Bolton (1999). However, in a previous study of Chu and Anastasio (2007) and Zellner et al. (1990), the quantum yield of OH (which equals to the quantum yield of NO) was constant at the pH ranges from 6.0 to 8.0 and 5.0 to 9.0 under single-wavelength light in nitrite solution. This might indicate that decreasing pH in our study mainly reduced NO consumption rather than increased NO production.
Higher temperatures led to increasing NO photoproduction rates according to the temperature dependence of chemical reactions given by the Arrhenius formula:
where A is an Arrhenius prefactor and T is the temperature (K). This indicates that an increasing temperature results in a higher rate; Chu and Anastasio (2007) also found that quantum yield of OH (or NO) showed a decreasing trend from 295 via 263 to 240 K. Moreover, this equation can be used to consider the difference in the rates at two temperatures T1 and T2:
If we assume that E is a constant in the temperature range of 10 to 30 ∘C when µmol L−1 and we plot ln R against 1∕T, we would get the E value as 57.5 kJ mol−1 K−1. Using the photoproduction rate at 20 ∘C (293.15 K) as our reference point (T1), an expression of RT with the temperature was as follows:
Similarly, we could conclude that the expression of RT with the temperature when =5.0 µmol L−1 is
However, the NO production rate at 0.5 µmol L−1 nitrite did not increase from 20 to 30 ∘C; the plausible explanation is that the concentration here was the main influencing factor and might run out at 30 ∘C. If the concentration increased to 5.0 µmol L−1, the temperature could make a noticeable difference.
At 0.5 and 5.0 µmol L−1 initial concentrations of Milli-Q water and artificial seawater samples, respectively, higher salinity showed higher photoproduction rates of NO. The regression relationship is for 0.5 µmol L−1 and for 5.0 µmol L−1 , respectively, where x is the salinity (‰) and y is the photoproduction rate ( mol L−1 s−1). This result indicates that with increasing ion strength NO production is enhanced; however, the exact mechanism is unknown and needs further study. Zafiriou and McFarland (1980) demonstrated that artificial seawater comprised with major and minor salts showed complex interactions and the addition of ethylenediaminetetraacetic acid (EDTA) could diminish NO concentration, which means trace metals could keep the NO concentration at a higher level, which is similar to our results. But Chu and Anastasio (2007) reported that addition of Na2SO4 (4.0–7.0 mmol L−1) in solution had no effect on the quantum yield of OH, which might be because of the complexity of the natural seawater samples. Overall, in artificial seawater samples, photoproduction rates showed an increasing trend with salinity.
The highest NO photoproduction rates were observed with full wavelength irradiation, whereas the lowest NO rates were observed with UVB. The NO photoproduction rates approached zero at wavelengths in the visible band. The contributions of visible, UVA, and UVB bands were <1 %, 30.7 %, and 85.2 % and <1.0 %, 34.2 %, and 63.1 % for 0.5 and 5.0 µmol L−1 , respectively. Our results are in line with the findings of Zafiriou and McFarland (1981), who found that samples exposed to (UV+visible) wavelengths lost more rapidly than those exposed only to the visible wavelengths alone. In the study of Chu and Anastasio (2007), under single-wavelength light, the quantum yield of OH decreased with the wavelength (280 to 360 nm and plateau until 390 nm) which means that single-wavelength UVB light had a higher photoproduction rate than UVA. Compared with the results in our study, this might be because of the wide band of UVA (320–420 nm) that led to the total higher rates under UVA than UVB (in our system 300–320 nm). Moreover, according to the UV–visible absorption spectra of , λmax was 354 nm, which is in the range of UVA (320–420 nm) (Zuo and Deng, 1998; Zafiriou and McFarland, 1981). Thus, it seems reasonable that in our study the photoproduction rate under UVA was higher than UVB; with full wavelength illumination, the photoproduction rates are the highest; and in the visible band, the NO photoproduction rates approached zero.
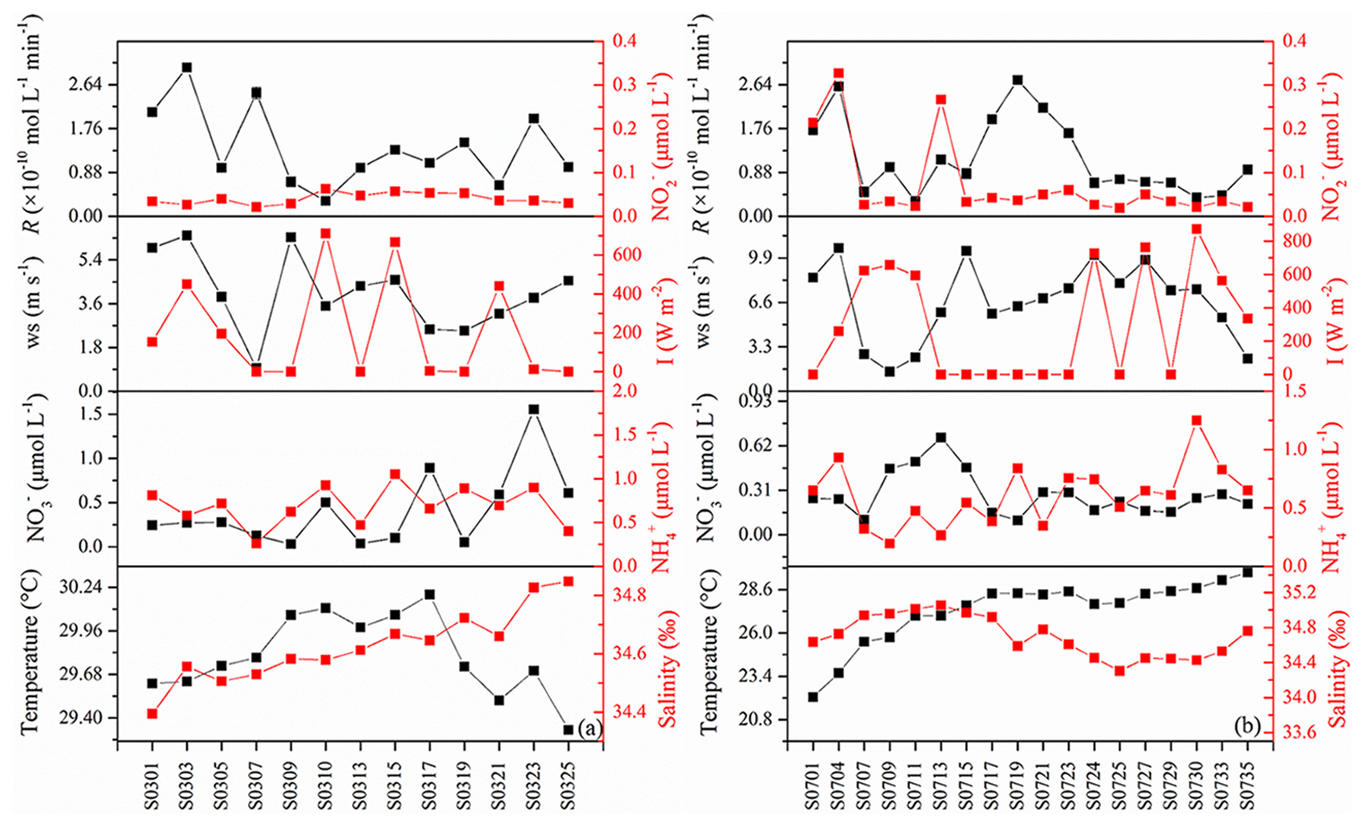
Figure 6Seawater temperature; salinity; concentrations of , , and ; wind speed; light intensity; and photoproduction rates of NO (RNO) in the western tropical North Pacific Ocean (a W–E transect; b N–S transect).
3.4 Kinetics of the NO photoproduction
The yields of NO formation from (%fNO) in artificial seawater samples were about 70.1 % and 97.9 % for the initial concentrations of 0.5 and 5.0 µmol L−1, respectively. The missing NO yield (29.9 % for 0.5 µmol L−1 and 2.1 % for 5.0 µmol L−1) might result from NO production via other (unknown) nitrogen-containing substrates (Anifowose et al., 2015). Another plausible explanation would be that during the process of photoproduction, some NO was oxidized into NO2, then NO2 dimerized (Reaction 6) and the dipolymer N2O4 would hydrolyze into and (Reaction 7), which actually reduces the concentration of (Mack and Bolton, 1999).
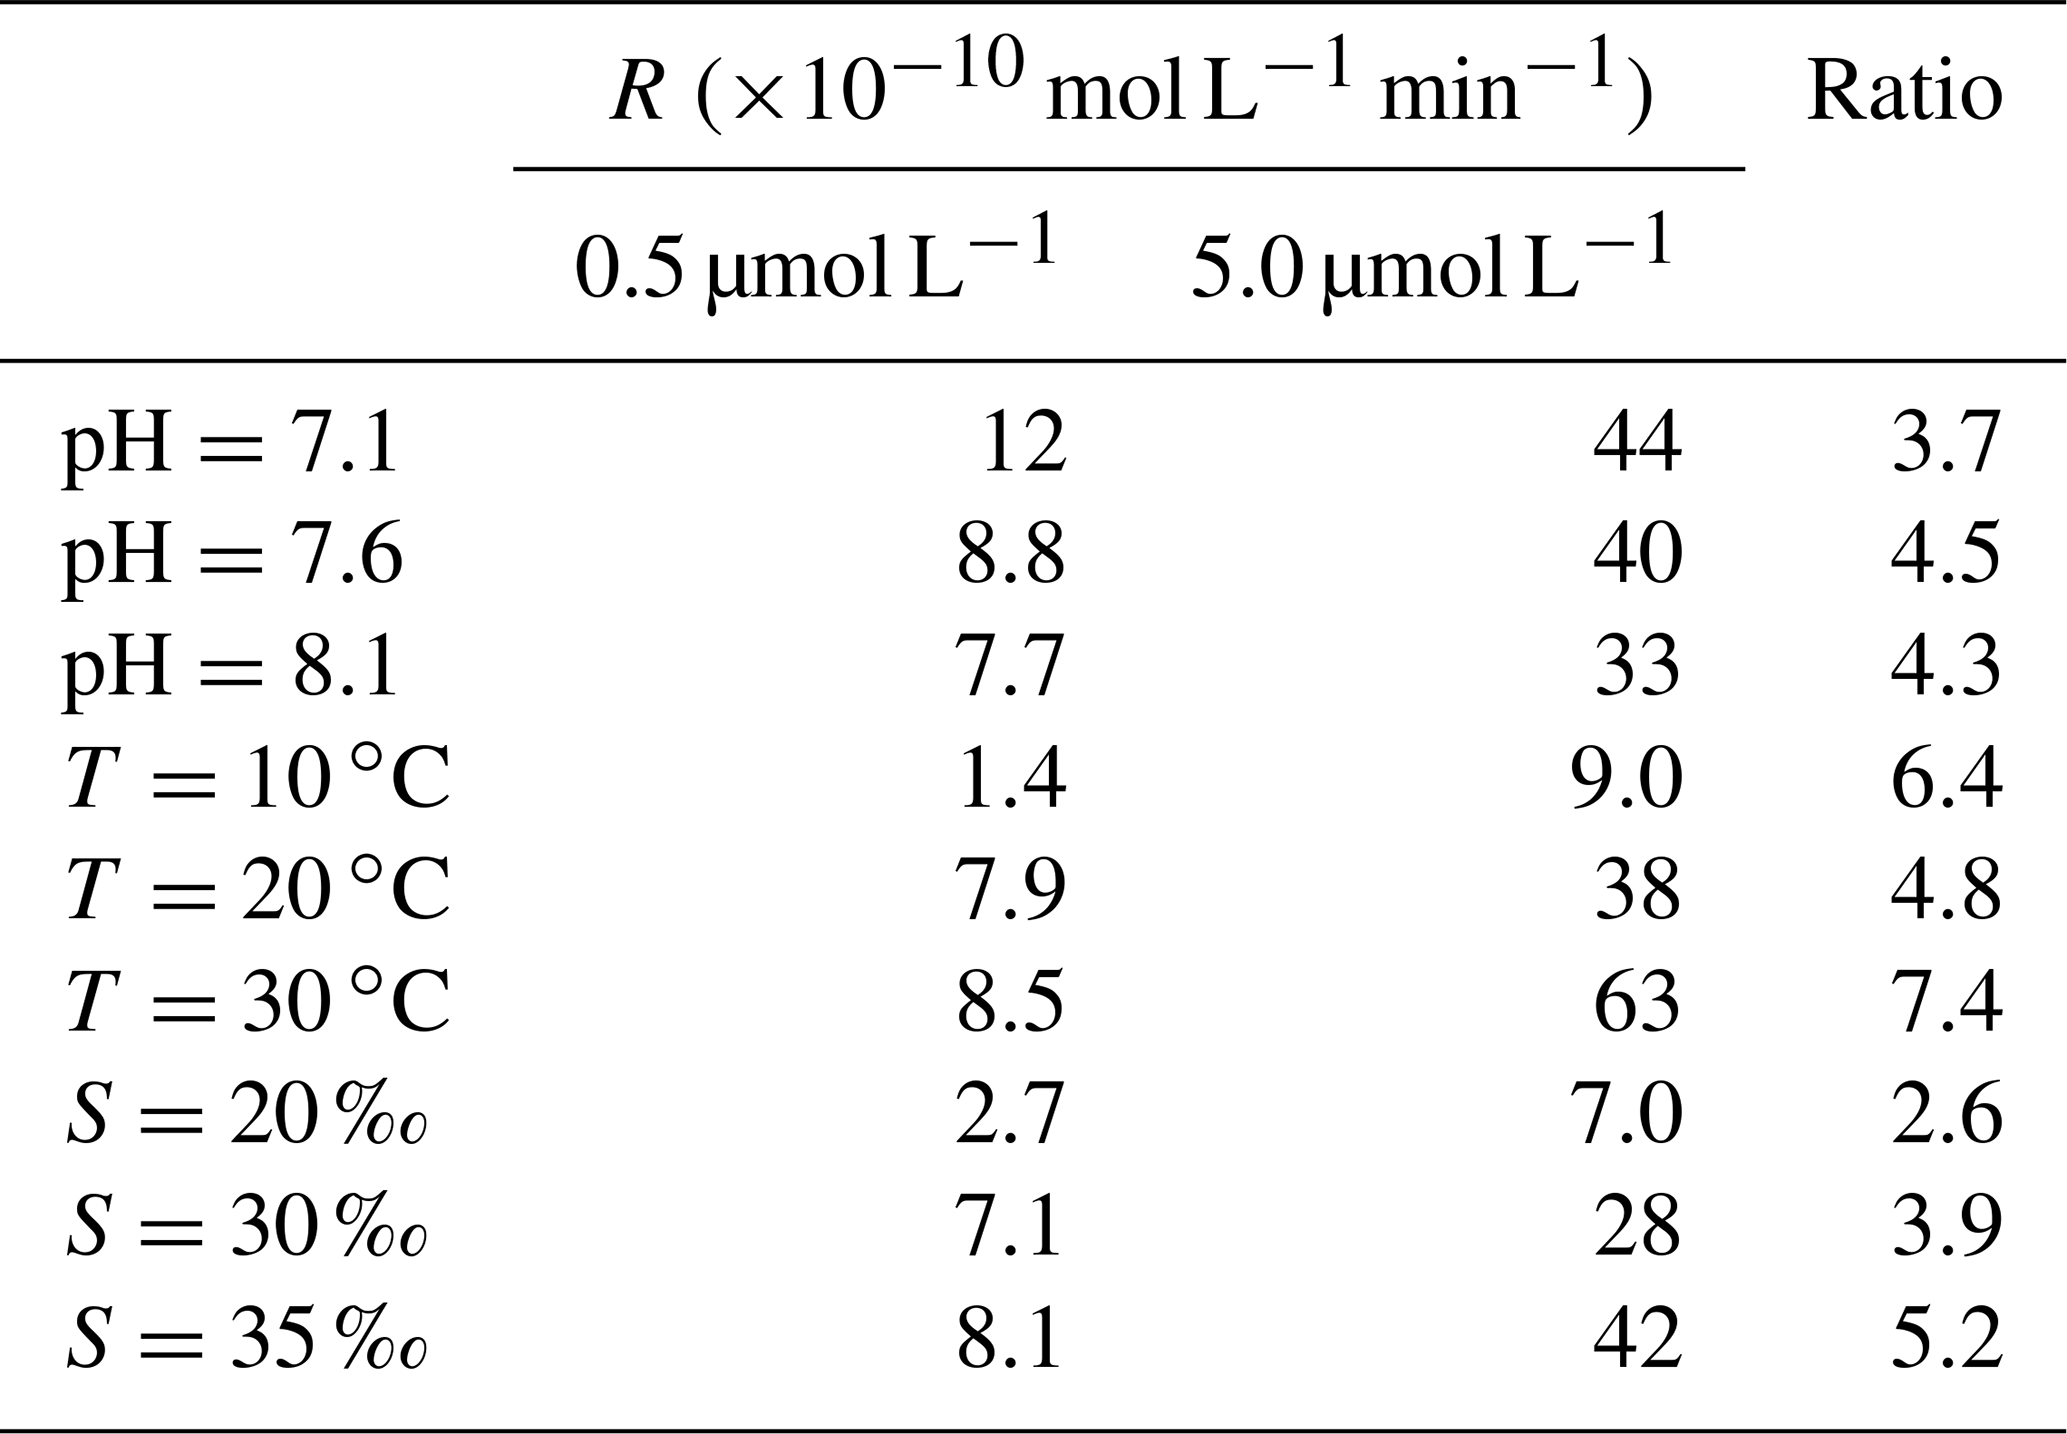
Assuming a 100 % yield from degradation and a fast reaction of NO with DAF-2, the observed linear relationships during the various irradiation experiments (Fig. 6) indicate that NO photoproduction was following a pseudo zero-order reaction. However, the RNO ratios (average: 4.8) listed in Table 2 were not the same for the experiments despite the fact that the ratio of the initial concentrations (10) was the same for all experiments. This result, however, does point to a reaction which is different from a zero-order reaction.
Table 2The ratios of photoproduction rates (R5.0/R0.5) in the different irradiation experiments.
3.5 Photoproduction rates of NO in the western tropical North Pacific Ocean
During the cruise, surface temperatures and salinities were in the range from 22.15 to 30.19 ∘C and 34.57 to 35.05, respectively. The concentrations of , , and ranged from 0.03 to 1.6, 0.20 to 1.2, and 0.02 to 0.33 µmol L−1, respectively (Fig. 6). The measured photoproduction rates of NO ranged from (station S0711) to mol L−1 min−1 (station S0303) (Tian, 2020), with an average value of mol L−1 min−1. Photoproduction rates did not show significant correlations with , , , pH, salinity, water temperature, or with colored dissolved organic matter (data not shown, the same method with Zhu et al., 2017, absorption coefficients at 355 nm) (SPSS v.16.0, Pearson correlation test).
There was no linear relationship found between RNO and dissolved during our cruise, which is in contrast to the results of Olasehinde et al. (2010), Anifowose et al. (2015), and Anifowose and Sakugawa (2017), who observed positive linear relationships between NO photoproduction rates and the concentrations in the surface waters of the Seto Inland Sea and the Kurose River. This might be because other factors like pH and salinity were different between samples collected at different stations.
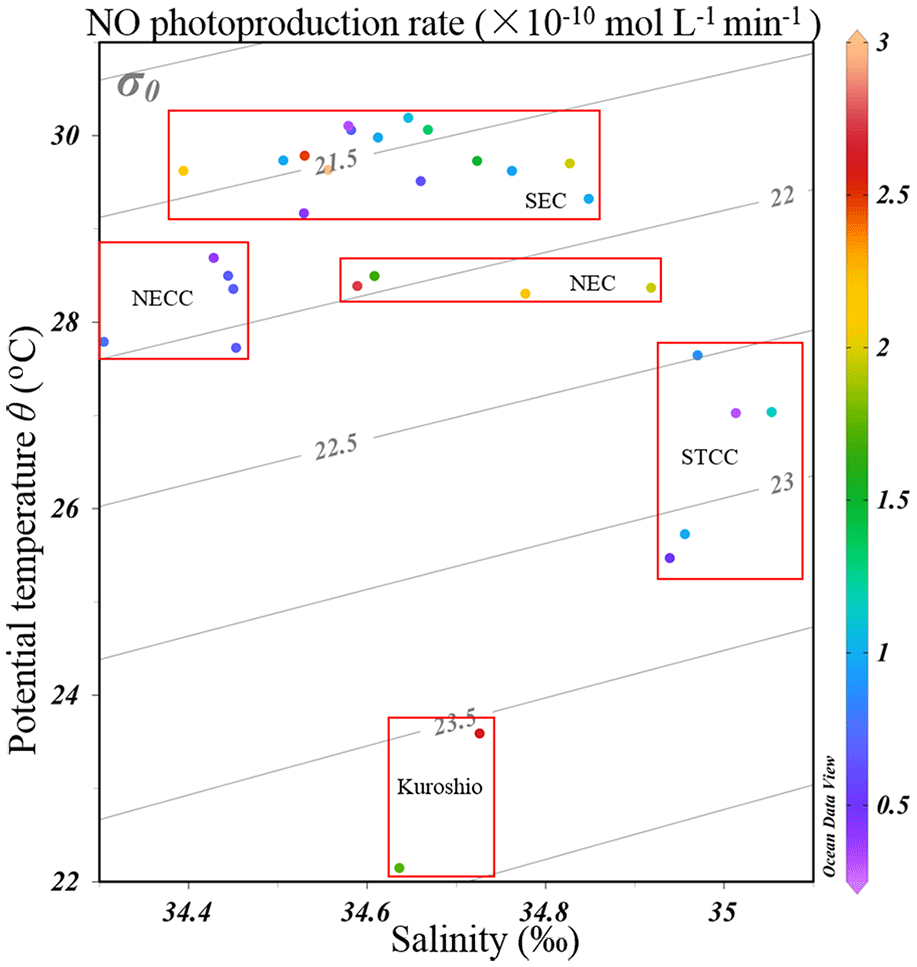
Figure 7The potential temperature–salinity (T–S) diagram with NO photoproduction rates indicated in the color bar. Water mass characteristics of surface currents shown in Fig. 1 are indicated. The acronyms NGCC, SEC, NECC, NEC, and STCC stand for New Guinea Coastal Current, South Equatorial Current, North Equatorial Countercurrent, North Equatorial Current, and Subtropical Countercurrent, respectively.
In Table 1, we found that the average photoproduction rate of NO measured in our cruise is lower than that of the Seto Inland Sea and the Kurose River, which could be ascribed to higher background in the inland sea waters (Olasehinde et al., 2009, 2010). Our result is slightly lower than the RNO from the central equatorial Pacific Ocean (> 10−12 mol L−1 s−1), and the lower concentration of (0.06 µmol L−1) in our study area might account for this (Zafiriou and McFarland, 1981). In Table 1, the concentration of 0.06 µmol L−1 in our study was lower than most other study areas like Qingdao coastal waters (0.75 µmol L−1) and the Seto Inland Sea (0–0.4 or 0.5–2 µmol L−1). In the study of Anifowose et al. (2015), since the concentration of upstream K1 station was similar to ours (0.06 µmol L−1), the higher RNO might be attributed to lower pH (7.36) as mentioned above. Or it might be because the difference in the river water and the seawater, considering lower nitrite level of K1, dissolved organic matter might also account for the higher RNO. Because of its conservative mixing behavior with salinity, dissolved organic matter always showed a higher level in river than open sea (Zhu et al., 2017), which could photodegrade itself to produce and finally to promote RNO. In our study, the rates were adjusted to the ambient conditions, which included nighttime samples when the rates were lower. From the T–S diagram (Fig. 7), we found that higher photoproduction rates at stations S0701 and S0704 might result from the influence of the Kuroshio (see Fig. 1), with enhanced concentrations of . The higher NO production rates measured for stations S0303/S0307 and S0717–S0723 might have been influenced by the South Equatorial Current and North Equatorial Current, respectively, but were obviously not associated with enhanced concentrations.
If we take the missing 30 % of fNO in artificial seawater as the experimental error, then in our study, using the JNO in the artificial seawater, the average %fNO value in natural water was calculated to be 52 % (−30 %), indicating that there are other unknown nitrogenous compounds, for example, produced from photolysis (Reaction 9) or from other organic matter which could further lead to NO production (Kieber et al., 1999; Benedict et al., 2017; Goldstein and Rabani, 2007; Minero et al., 2007).
According to the photoproduction rates and the relevant concentration in Olasehinde et al. (2010) and Anifowose and Sakugawa (2017) (Table 1), the photoproduction rates under 0.02 µmol L−1 might not be determined in nearshore waters like the Seto Inland Sea.
3.6 Flux densities of NO in the surface layer of the WTNP
3.6.1 Air–sea flux density of NO
The NO flux densities were computed with (Eq. 7):
where F stands for the flux density (mass per area per time) across the air–sea interface, ksea is the gas transfer velocity (length per time), [NO] is the measured concentration of NO in the surface seawater (mol per volume), x'NOair is the mixing ratio of atmosphere NO (dimensionless), and pss is the barometric pressure with pw calculated after Weiss and Price (1980):
Hcp is the Henry's law constant which is calculated after Sander (2015) as
where , HΘ and are tabulated in Sander (2015) ( and mol m−3 Pa−1). The reviewed literature about NO, HΘ, and the values in different literature studies were similar (Sander, 2015). In our calculation, the values in Warneck and Williams (2012) were used.
Then ksea was calculated after Wanninkhof (2014) as Eq. (10):
where γa is the fraction of the entire gas concentration gradient across the air-side boundary layer as a fraction of the entire gradient from the bulk water to the bulk air (dimensionless), ka is the air-side air–sea gas transfer coefficient (length per time) according to Jähne et al. (1987); Mcgillis et al. (2000); and Sharqawy et al. (2010). For details about the calculation of kw and γa, see Tian et al. (2019).
Since onboard wind speeds were not available, ECMWF (European Centre for Medium-Range Weather Forecasts) reanalysis data sets (ERA-5 hourly data) were applied (Fig. 6). We used a value of 10−11 (v∕v) for atmospheric NO (Law, 2001). The atmosphere pressure was set to 101.325 kPa.
Since the measurements of [NO] were not available from the cruise, we estimated [NO] by assuming that (1) NO production is mainly resulting from photodegradation, (2) the NO photoproduction RNO, as measured in our irradiation experiment, is balanced by the NO scavenging rate Rs, and (3) rates of nitrite photoproduction to NO were proportional to the irradiance flux in order to adjust the rates under solar simulator light into ambient light at the sampling time (Zafiriou and McFarland, 1981; Olasehinde et al., 2010):
where Rs represents the sum of the rate constants for the scavenging compounds reacting with NO times the concentrations of the scavenger compounds, Iambient and Isimulator denote the light intensity of the sampling station and the CPS+ simulator (765 W m−2). Iambient was ECMWF reanalysis data sets (ERA-5 hourly data, Fig. 6), which ranged from 0 to 762.9 W m−2 and the resulting ranged from 0 to 1.01 with an average of 0.35. In the studies of Zafiriou et al. (1980) and Anifowose and Sakugawa (2017), they reviewed the NO lifetime in different areas for the Kurose River (0.05–1.3 s), the Seto Inland sea (1.8–20 s), and the central equatorial Pacific (28–216 s, 170∘ E equatorial regions), which showed an increasing trend from river to open sea. It seemed that NO lifetime in our study area should be most similar to the central equatorial Pacific. Considering that part of our sampling stations were in open sea while some stations were close to the continent, like New Guinea island and Japan, average lifetimes of about 100 s (with an uncertainty factor of 2.5) were applied in our study. Tian et al. (2019) found that NO concentration in the surface water showed no significant difference with that in the bottom water (average depth: 43 m), so it seems reasonable to estimate the steady-state NO concentration with the NO concentration in the mixed layer. Then, [NO] was estimated to range from 0 to mol L−1 (0 means that sampling time during nighttime), with an average of mol L−1, which was consistent with previous results in central equatorial Pacific ( mol L−1), while it was lower than near-continent seawater, like the Seto Inland Sea (up to mol L−1) and the Jiaozhou Bay ( mol L−1), which might be because of the higher nitrite concentration. NO showed the lowest concentration in Kurose River; the shortest lifetime in river water than in seawater might account for this (Anifowose and Sakugawa, 2017).
In Table 1, the resulting flux density of NO for WTNP ranged from 0 to mol m−2 s−1, with an average of mol m−2 s−1, which is in good agreement with that in the central equatorial Pacific (see Table 1), while it was lower than that in coastal seawater such as the Seto Inland Sea or Jiaozhou Bay, consistent with the NO concentration distribution.
3.6.2 Oceanic photoproduction rates of NO
The photoproduction rates from our irradiation experiments were extrapolated to oceanic photoproduction in the WTNP with the equation from Uher and Andreae (1996) and Bange and Uher (2005):
where Rocean and RNO are the photoproduction rates for the ocean mixed layer and seawater irradiation experiments, respectively; see Sect. 3.5. Iocean and Iss are the average global irradiance at the surface of the ocean mixed layer and the solar simulator used here, respectively. KD is the light attenuation coefficient and MLD is the estimated mixed layer depth at the sampled station.
Iocean was set to 185 W m−2 (Bange and Uher, 2005), while Iss was 765 W m−2 in our study (Wu et al., 2015). As described above, KD-354 was applied to estimate the MLD. In Smyth (2011), KD-340 to KD-380, derived from 10 % residual light level depths, ranged from 0.04 to 0.07 m−1 for our study area, and we used the average value of 0.05 m−1. The MLD was taken as the layer depth where the temperature was 0.2 ∘C lower than the 10 m near-surface seawater layer (Montégut, 2004), ranging from 13–77 m with an average of 37 m. The resulting average Rocean was about mol L−1 min−1 for the WTNP at the time of our cruise. Besides, the temperature at 20 ∘C in our laboratory experiment would induce an error of about 10 % (Fig. 4e).
The flux induced by NO photoproduction in the WTNP (NO photoproduction rates divide by MLD, average: mol m−2 s−1) was significantly larger than the NO air–sea flux densities (average: mol m−2 s−1), indicating a further NO loss process in the surface layer.
The results of our irradiation experiments showed that NO photoproduction from in artificial seawater is significantly affected by changes in pH, temperature, and salinity. We found increasing NO production rates from dissolved with decreasing pH, increasing temperature, and increasing salinity. In contrast, we did not find any correlations for NO photoproduction with pH, salinity, water temperature, or dissolved in natural surface seawater samples from a cruise to the western tropical North Pacific Ocean (November 2015–January 2016). We conclude that the trends observed in our irradiation experiments with artificial seawater do not seem to be representative of WTNP because of the complex settings of open ocean environments. Moreover, we conclude that future changes in NO photoproduction due to ongoing environmental changes such as ocean warming and acidification are, therefore, difficult to predict and need to be tested by irradiation experiments of natural seawater samples under varying conditions. The flux induced by NO photoproduction in the WTNP (average: mol m−2 s−1) was significantly larger than the NO air–sea flux densities (average: mol m−2 s−1), indicating a further NO loss process in the surface layer. In order to decipher and to quantify the NO production and consumption pathways in the oceanic surface layer, more comprehensive laboratory and onboard measurements are required.
The data can be accessed by email request to the corresponding authors, or they can be downloaded from https://pan.baidu.com/s/19LQIPADW5KDhONQuX9ub5g, (Tian, 2020).
YT, GPY, CYL, HTC, and PFL prepared the original manuscript and designed the experiments; HWB made many modifications and gave a lot of suggestions on design of figures and the computing method. All authors contributed to the analysis of the data and discussed the results.
The authors declare that they have no conflict of interest.
We thank the captain and crew of R/V Dong Fang Hong 2 for their support and help during the cruise. This is MCTL contribution no. 223. We thank the editor and two reviewers for their thoughtful feedback on the article.
This research has been supported by the National Natural Science Foundation of China (grant no. 41676065), the National Key Research and Development Program of China (grant no. 2016YFA0601301), and the Fundamental Research Funds for the Central Universities (grant no. 201762032).
This paper was edited by Mario Hoppema and reviewed by Oliver Zafiriou and one anonymous referee.
Anifowose, A. J. and Sakugawa, H.: Determination of daytime flux of nitric oxide Radical (NO⋅) at an inland sea-atmospheric boundary in Japan, J. Aquat. Pollut. Toxicol., 1, 1–6, 2017.
Anifowose, A. J., Takeda, K., and Sakugawa, H.: Photoformation rate, steady-state concentration and lifetime of nitric oxide radical (NO) in a eutrophic river in Higashi-Hiroshima, Japan, Chemosphere, 119, 302–309, https://doi.org/10.1016/j.chemosphere.2014.06.063, 2015.
Astier, J., Jeandroz, S., and Wendehenne, D.: Nitric oxide synthase in plants: The surprise from algae, Plant Sci., 268, 64–66, https://doi.org/10.1016/j.plantsci.2017.12.008, 2018.
Bajt, O., Šket, B., and Faganeli, J.: The aqueous photochemical transformation of acrylic acid, Mar. Chem., 58, 255–259, https://doi.org/10.1016/S0304-4203(97)00052-2, 1997.
Bange, H. W.: Gaseous Nitrogen Compounds (NO, N2O, N2, NH3) in the Ocean, Elsevier, 51–94 pp., 2008.
Bange, H. W. and Uher, G.: Photochemical production of methane in natural waters: implications for its present and past oceanic source, Chemosphere, 58, 177–183, https://doi.org/10.1016/j.chemosphere.2004.06.022, 2005.
Benedict, K. B., McFall, A. S., and Anastasio, C.: Quantum yield of nitrite from the photolysis of aqueous nitrate above 300 nm, Environ. Sci. Technol., 51, 4387–4395, https://doi.org/10.1021/acs.est.6b06370, 2017.
Chu, L. and Anastasio, C.: Temperature and wavelength dependence of nitrite photolysis in frozen and aqueous solutions, Environ. Sci. Technol., 41, 3626–3632, https://doi.org/10.1021/es062731q, 2007.
Clarke, K., Edge, R., Johnson, V., Land, E. J., Navaratnam, S., and Truscott, T. G.: The carbonate radical: Its reactivity with oxygen, ammonia, amino acids, and melanins, J. Phys. Chem. A, 112, 10147–10151, https://doi.org/10.1021/jp801505b, 2008.
Fine, R. A., Lukas, R., Bingham, F. M., Warner, M. J., and Gammon, R. H.: The western equatorial Pacific: A water mass crossroads, J. Geophys. Res.-Oceans, 99, 25063–25080, https://doi.org/10.1029/94jc02277, 1994.
Goldstein, S. and Rabani, J.: Mechanism of nitrite formation by nitrate photolysis in aqueous solutions:? The role of peroxynitrite, nitrogen dioxide, and hydroxyl radical, J. Am. Chem. Soc., 129, 10597–10601, https://doi.org/10.1021/ja073609+, 2007.
Jähne, B., Heinz, G., and Dietrich, W.: Measurement of the diffusion coefficients of sparingly soluble gases in water, J. Geophys. Res.-Oceans, 92, 10767–10776, https://doi.org/10.1029/JC092iC10p10767, 1987.
Joussotdubien, J. and Kadiri, A.: Photosensitized oxidation of ammonia by singlet oxygen in aqueous solution and in seawater, Nature, 227, 700–701, https://doi.org/10.1038/227700b0, 1970.
Kieber, D. J., Jiao, J., Kiene, R. P., and Bates, T. S.: Impact of dimethylsulfide photochemistry on methyl sulfur cycling in the equatorial Pacific Ocean, J. Geophys. Res.-Oceans, 101, 3715–3722, https://doi.org/10.1029/95jc03624, 1996.
Kieber, R. J., Li, A., and Seaton, P. J.: Production of nitrite from the photodegradation of dissolved organic matter in natural waters, Environ. Sci. Technol., 33, 993–998, https://doi.org/10.1021/es980188a, 1999.
Kuypers, M. M. M., Marchant, H. K., and Kartal, B.: The microbial nitrogen-cycling network, Nat. Rev. Microbiol., 16, 263–276, https://doi.org/10.1038/nrmicro.2018.9, 2018.
Lantoine, F., Trévin, S., Bedioui, F., and Devynck, J.: Selective and sensitive electrochemical measurement of nitric oxide in aqueous solution: discussion and new results, J. Electroanal. Chem., 392, 85–89, https://doi.org/10.1016/0022-0728(95)04042-M, 1995.
Laszlo, B., Alfassi, Z. B., Neta, P., and Huie, R. E.: Kinetics and mechanism of the reaction of ⋅ NH2 with O2 in aqueous solutions, J. Phys. Chem. A, 102, 8498–8504, https://doi.org/10.1021/jp981529+, 1998.
Law, C. S.: Air-sea transfer: N2O, NO, CH4 , CO, in: Encyclopedia of Ocean Sciences, edited by: John H. Steele, Academic Press, Plymouth, UK, 137–144, https://doi.org/10.1006/rwos.2001.0064, 2001.
Li, P. F., Li, W. S., Liu, C. Y., Zhu, X. C., and Zhang, Q.: The photodecomposition of nitrite in water, Chin. J. Environ. Sci., 30, 1883–1888, 2011 (in Chinese).
Li, Y., Mao, Y., Liu, G., Tachiev, G., Roelant, D., Feng, X., and Cai, Y.: Degradation of methylmercury and its effects on mercury distribution and cycling in the Florida Everglades, Environ. Sci. Technol., 44, 6661–6666, https://doi.org/10.1021/es1010434, 2010.
Liu, C.-Y., Feng, W.-H., Tian, Y., Yang, G.-P., Li, P.-F., and Bange, H. W.: Determination of dissolved nitric oxide in coastal waters of the Yellow Sea off Qingdao, Ocean Sci., 13, 623–632, https://doi.org/10.5194/os-13-623-2017, 2017.
Lutterbeck, H. E. and Bange, H. W.: An improved method for the determination of dissolved nitric oxide (NO) in seawater samples, Ocean Sci., 11, 937–946, https://doi.org/10.5194/os-11-937-2015, 2015.
Mack, J. and Bolton, J. R.: Photochemistry of nitrite and nitrate in aqueous solution: a review, J. Photochem. Photobio., A, 128, 1–13, https://doi.org/10.1016/S1010-6030(99)00155-0, 1999.
Mcgillis, W. R., Dacey, J. W. H., Frew, N. M., Bock, E. J., and Nelson, R. K.: Water-air flux of dimethylsulfide, J. Geophys. Res.-Oceans, 105, 1187–1193, https://doi.org/10.1029/1999JC900243, 2000.
Minero, C., Chiron, S., Falletti, G., Maurino, V., Pelizzetti, E., Ajassa, R., Carlotti, M. E., and Vione, D.: Photochemincal processes involving nitrite in surface water samples, Aquat. Sci., 69, 71–85, https://doi.org/10.1007/s00027-007-0881-6, 2007.
Montégut, C. D. B.: Mixed layer depth over the global ocean: An examination of profile data and a profile-based climatology, J. Geophys. Res.-Oceans, 109, C12003, https://doi.org/10.1029/2004JC002378, 2004.
Olasehinde, E. F., Takeda, K., and Sakugawa, H.: Development of an analytical method for nitric oxide radical determination in natural waters, Anal. Chem., 81, 6843–6850, https://doi.org/10.1021/ac901128y, 2009.
Olasehinde, E. F., Takeda, K., and Sakugawa, H.: Photochemical production and consumption mechanisms of nitric oxide in seawater, Environ. Sci. Technol., 44, 8403–8408, https://doi.org/10.1021/es101426x, 2010.
Sander, R.: Compilation of Henry's law constants (version 4.0) for water as solvent, Atmos. Chem. Phys., 15, 4399–4981, https://doi.org/10.5194/acp-15-4399-2015, 2015.
Schreiber, F., Wunderlin, P., Udert, K. M., and Wells, G. F.: Nitric oxide and nitrous oxide turnover in natural and engineered microbial communities: biological pathways, chemical reactions, and novel technologies, Front. Microbiol., 3, 372, https://doi.org/10.3389/fmicb.2012.00372, 2012.
Sharqawy, M. H., Lienhard, J. H., and Zubair, S. M.: Thermophysical properties of seawater: a review of existing correlations and data, Desalin. Water Treat., 16, 354–380, https://doi.org/10.5004/dwt.2010.1079, 2010.
Singh, V. K. and Lal, B.: Nitric oxide (NO) stimulates steroidogenesis and folliculogenesis in fish, Reproduction, 153, 133–146, https://doi.org/10.1530/REP-16-0482, 2017.
Smyth, T. J.: Penetration of UV irradiance into the global ocean, J. Geophys. Res.-Oceans, 116, 20–32, https://doi.org/10.1029/2011JC007183, 2011.
Tian, Y.: Photoproduction of nitric oxide in seawater, Baidunetdisk, available at: https://pan.baidu.com/s/19LQIPADW5KDhONQuX9ub5g, last access: 9 January 2020.
Tian, Y., Xue, C., Liu, C., and Li, P.: Distribution and influencing factors of nitric oxide in the surface water of Jiaozhou Bay, Res. Environ. Sci., 29, 1451–1458, 2016 (in Chinese).
Tian, Y., Xue, C., Liu, C.-Y., Yang, G.-P., Li, P.-F., Feng, W.-H., and Bange, H. W.: Nitric oxide (NO) in the Bohai Sea and the Yellow Sea, Biogeosciences, 16, 4485–4496, https://doi.org/10.5194/bg-16-4485-2019, 2019.
Tugaoen, H. O. N., Herckes, P., Hristovski, K., and Westerhoff, P.: Influence of ultraviolet wavelengths on kinetics and selectivity for N-gases during TiO2 photocatalytic reduction of nitrate, Appl. Catal. B-Environ., 220, 597–606, https://doi.org/10.1016/j.apcatb.2017.08.078, 2018.
Uher, G. and Andreae, M. O.: The diel cycle of carbonyl sulfide in marine surface waters: Field study results and a simple model, Aquat. Geochem., 2, 313–344, https://doi.org/10.1007/BF00115975, 1996.
Wang, B., Dan, L., Chao, W., Wang, Q., Hui, Z., Liu, G., Xia, T., and Zhang, L.: Mechanism of endothelial nitric oxide synthase phosphorylation and activation by tentacle extract from the jellyfish Cyanea capillata, Peerj, 5, e3172, https://doi.org/10.7717/peerj.3172, 2017.
Wanninkhof, R.: Relationship between wind speed and gas exchange over the ocean revisited, Limnol. Oceanogr.-Meth., 12, 351–362, https://doi.org/10.4319/lom.2014.12.351, 2014.
Warneck, P. and Williams, J.: The Atmospheric Chemist's Companion, Springer, Netherlands, 2012.
Weiss, R. F. and Price, B. A.: Nitrous oxide solubility in water and seawater, Mar. Chem., 8, 347–359, https://doi.org/10.1016/0304-4203(80)90024-9, 1980.
Wu, X., Liu, C. Y., and Li, P. F.: Photochemical transformation of acrylic acid in seawater, Mar. Chem., 170, 29–36, https://doi.org/10.1016/j.marchem.2015.01.003, 2015.
Xing, L., Zhang, Z. B., Liu, C. Y., Wu, Z. Z., and Lin, C.: Amperometric detection of nitric oxide with microsensor in the medium of seawater and its applications, Sensors, 5, 537–545, https://doi.org/10.3390/s5120537, 2005.
Xue, C., Liu, C., Yang, G., Zhu, C., and Zhang, H.: Distribution and controlling factors of nitric oxide concentrations in surface seawater of Jiaozhou Bay and adjacent waters, Chin. J. Environ. Sci., 33, 1086–1090, 2012 (in Chinese).
Yang, G. P., Ren, C. Y., Lu, X. L., Liu, C. Y., and Ding, H. B.: Distribution, flux, and photoproduction of carbon monoxide in the East China Sea and Yellow Sea in spring, J. Geophys. Res.-Oceans, 116, 1–15, https://doi.org/10.1029/2010JC006300, 2011.
Zafiriou, O. C. and McFarland, M.: Determination of trace levels of nitric oxide in aqueous solution, Anal. Chem., 52, 1662–1667, https://doi.org/10.1021/ac50061a029, 1980.
Zafiriou, O. C. and McFarland, M.: Nitric oxide from nitrite photolysis in the central equatorial Pacific, J. Geophys. Res.-Oceans, 86, 3173–3182, https://doi.org/10.1029/JC086iC04p03173, 1981.
Zafiriou, O. C. and True, M. B.: Nitrite photolysis in seawater by sunlight, Mar. Chem., 8, 33–42, https://doi.org/10.1016/0304-4203(79)90030-6, 1979.
Zafiriou, O. C., Mcfarland, M., and Bromund, R. H.: Nitric oxide in seawater, Science, 207, 637–639, https://doi.org/10.1126/science.207.4431.637, 1980.
Zellner, R., Exner, M., and Herrmann, H.: Absolute OH quantum yields in the laser photolysis of nitrate, nitrite and dissolved H2O2 at 308 and 351 nm in the temperature range 278–353 K, J. Atmos. Chem., 10, 411–425, https://doi.org10.1007/BF00115783, 1990.
Zhang, Z., Qiu, B., Tian, J., Zhao, W., and Huang, X.: Latitude-dependent finescale turbulent shear generations in the Pacific tropical-extratropical upper ocean, Nat. Commun., 9, 4086, https://doi.org/10.1038/s41467-018-06260-8, 2018.
Zhao, J., Li, Y., and Wang, F.: Seasonal variation of the surface North Equatorial Countercurrent (NECC) in the western Pacific Ocean, Chin. J. Oceanol. Limnol., 34, 1332–1346, https://doi.org/10.1007/s00343-016-5119-9, 2016.
Zhu, W. Z., Zhang, J., and Yang, G. P.: Mixing behavior and photobleaching of chromophoric dissolved organic matter in the Changjiang River estuary and the adjacent East China Sea, Estuarine, Coast. Shelf Sci., 207, 422–434, https://doi.org/10.1016/j.ecss.2017.07.019, 2017.
Zuo, Y. and Deng, Y.: The near-UV absorption constants for nitrite ion in aqueous solution, Chemosphere, 36, 181–188, https://doi.org/10.1016/S0045-6535(97)10028-5, 1998.