the Creative Commons Attribution 4.0 License.
the Creative Commons Attribution 4.0 License.
 | 06 Jun 2019
Technical note: On the importance of a three-dimensional approach for modelling the transport of neustic microplastics
Isabel Jalón-Rojas
Xiao-Hua Wang
Erick Fredj
Understanding and estimating the distribution and transport of microplastics in marine environments has been recognized as a major global research issue. Most of the existing research on transport modelling has focused on low-density particles floating in surface waters, using a 2-D Lagrangian approach and ignoring the vertical displacement of particles. In this work, we evaluate to what extent the vertical movement of particles within surface waters by mixing processes may affect the horizontal transport and fate of microplastics. The aim is to determine whether a 2-D approach is sufficient for the accurate modelling of neustic-microplastics transport or whether a 3-D approach is necessary. For this purpose, we compare visually and statistically the microplastics transport patterns of three simulations in a coastal system: one using a 2-D approach; and two using a 3-D approach with weak and strong vertical turbulence, respectively. The 2-D simulation roughly reproduced the transport and accumulation patterns, but accurate results required a 3-D approach. This was particularly important for strong vertical turbulence and regions characterized by strong vertical current shear. Moreover, a 2-D approach can lead to errors in the results even with negligible turbulence due to simplifications in the velocity field. A 3-D modelling approach is therefore key to an accurate estimation and prediction of microplastics distribution in coastal systems and consequently for planning mitigation and cleaning programmes.
- Article
(2453 KB) - Full-text XML
-
Supplement
(514 KB) - BibTeX
- EndNote


Marine plastic debris is of increasing concern because of its persistence, toxicological properties, and effects on marine ecosystems, wildlife, and humans (Lithner et al., 2011; Rochman et al., 2013). In particular, microplastics (< 5 mm) are the most abundant and potentially hazardous plastic items in marine environments (Andrady, 2011). Microplastics pollution has been documented throughout the world and marine habitats (Eriksen et al., 2014; Galgani et al., 2015), in the surface and subsurface water column, on the sea floor, along coastlines and in the polar regions. Microplastics can also accumulate in marine organisms at different trophic levels (Carbery et al., 2018).
Understanding, estimating and predicting the distribution and transport of microplastics is a key step in addressing this global issue. This is a complex problem that requires in situ observations and numerical modelling. Numerous studies have used Lagrangian particle-tracking models to assess the sources, pathways and sinks of microplastics in marine environments, especially at ocean and regional scales (e.g. Wakata and Sugimori, 1990; Isobe et al., 2009; Ebbesmeyer et al., 2012; Lebreton et al., 2012; Critchell and Lambrechts, 2016; Carlson et al., 2017; Liubartseva et al., 2018). These models typically consider particles moving in surface waters and therefore use a two-dimensional approach based on surface or vertically averaged current velocities. However, microplastics can move through the water column for different reasons (Zhang, 2017) – neutral and negative buoyancy, vertical mixing processes, upwelling/downwelling processes – and a three-dimensional approach could be necessary. In the case of positive buoyant microplastics, observations revealed that they normally remain near the surface but can move within a layer of depth up to 5 m due to hydrodynamic mixing processes (Reisser et al., 2015; Kooi et al., 2016). This vertical movement may affect the horizontal trajectories of microplastics in stratified systems, but this impact has not yet been explored.
The aim of this work is to evaluate the accuracy of a two-dimensional approach for modelling the transport of positive-buoyant neustic microplastics under conditions of low and high vertical turbulence in coastal shallow environments. We implement a Lagrangian particle-tracking model to compare the trajectories and fates of microplastics from 2-D simulations with those from 3-D simulations (used as reference solutions), using Jervis Bay (south-eastern Australia) as a natural laboratory. This comparison is performed both visually and quantitatively using probability-density maps and coastal connectivity analysis. This work also provides a first insight into the pertinence of a 3-D approach for modelling the transport of negative-buoyant microplastics subject to sinking and other physical processes involving vertical transport.
2.1 Lagrangian particle-tracking model
The Particle Tracking and Analysis TOolbox (PaTATO, Fredj et al., 2016) was used for modelling the advection–diffusion of buoyant particles in 2-D and 3-D. Advective and diffusive displacement determines the trajectories of particles as
The particle displacement dX= (dX, dY, dZ) is given by the flow velocity , which can provided by diverse hydrodynamic models (e.g. POM, ROMS), and a stochastic term related to the dispersion coefficients K= (Kh,x, Kh,y, Kh,z). R= (Rx, Ry, Rz) represents white-noise random walks with average and standard deviations of 0.0 and 1.0. Particles can beach when their positions are inside the land domain.
2.2 Model settings
The Lagrangian particle-tracking model was implemented in Jervis Bay (south-eastern Australia, Fig. 1a) in two and three dimensions, in order to compare the results of two approaches. This semi-enclosed bay is 8 km wide, 15 km long and 15 m deep on average. We used hydrodynamic model results from the Princeton Ocean Model (POM) as inputs. In particular, we used the hydrodynamics data from 24 June to 11 July 1998, as the model was validated using observation of currents, temperature, salinity and water level during this period, obtaining a very good fit (Wang and Symonds, 1999; Sun et al., 2017; Liao and Wang, 2018). The POM model spatial resolution is 500 m around the bay, and the temporal resolution is 12 s. It uses a total of 21 sigma levels in the z direction, with finer layers near the surface and bottom. During this simulation period, Jervis Bay was characterized by its typical circulation pattern: clockwise and anti-clockwise circulation in the northern and southern regions, respectively. The flow exchange through the entrance was highly stratified, with near-surface inflow on the southern side and deeper outflow on the northern side (Fig. 1b). Vertical currents were 3–4 orders of magnitude lower than horizontal currents (Fig. 1b). However, the aim of this work is not to discuss the typical patterns of microplastics transport in Jervis Bay; it is a case study to explore the implications of a 2-D approach for the simulation accuracy of neustic-microplastics transport in coastal shallow waters. The reader is referred to Sun et al. (2017) for more details on the hydrodynamic model settings.
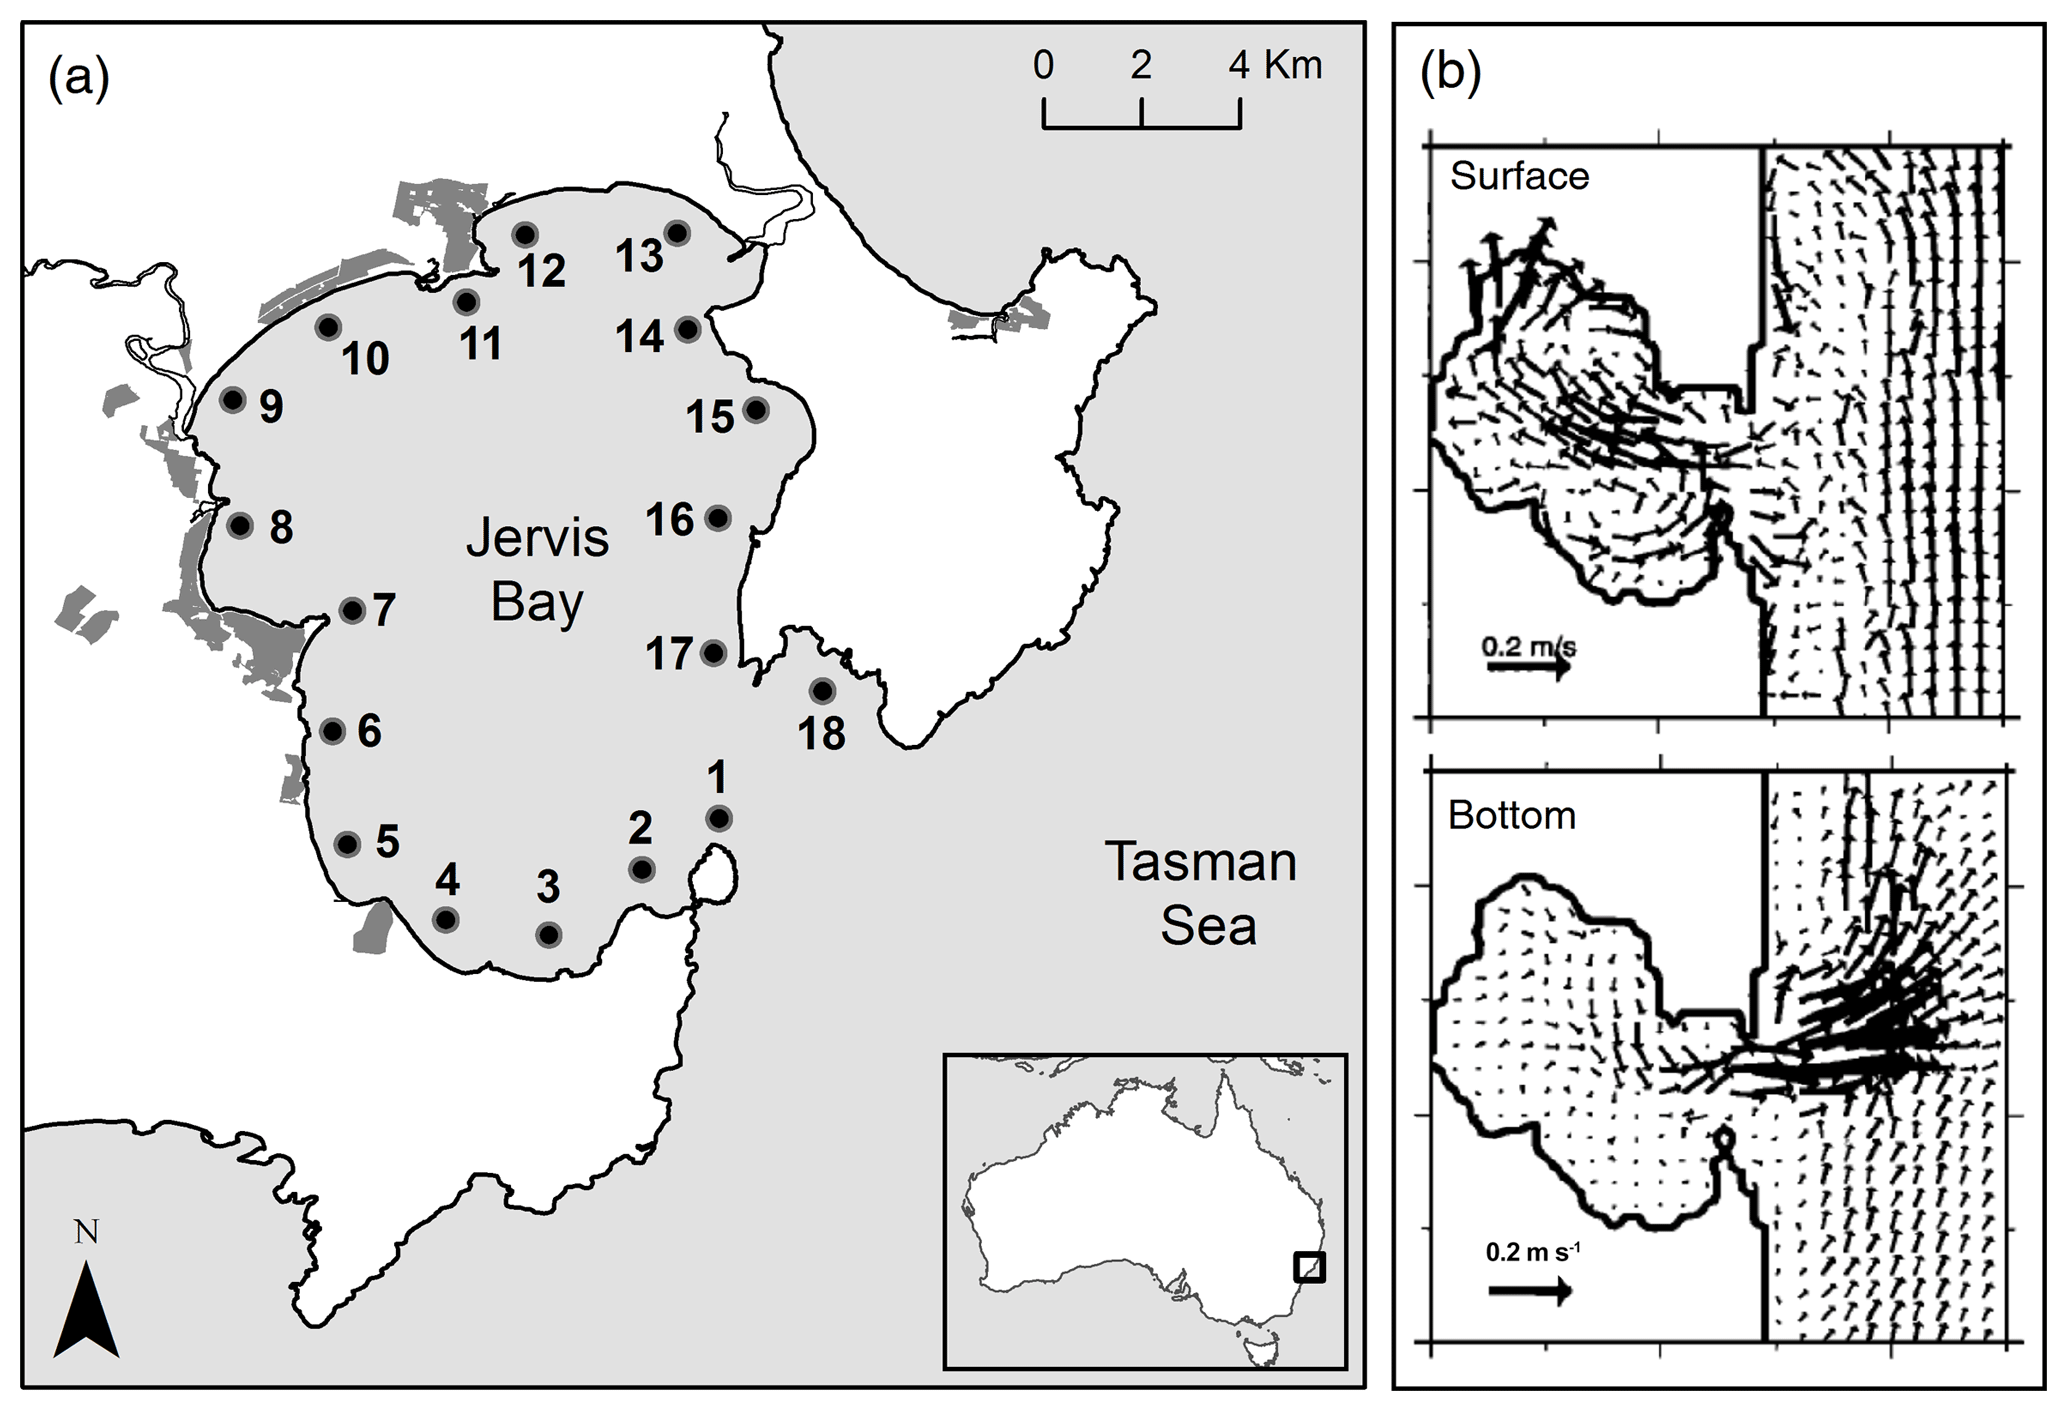
Figure 1(a) Map of Jervis Bay (south-eastern Australia). Black dots show the seeding locations and also the centre of destination regions used in the coastal connectivity analysis. Shaded areas represent urban zones. (b) Typical surface and bottom currents of the bay (modified from Wang and Symonds, 1999).
We implemented three model simulations to evaluate the accuracy of a 2-D approach for modelling microplastics floating in surface waters:
- a.
2-D approach,
- b.
3-D approach with weak vertical turbulence,
- c.
3-D approach with strong vertical turbulence.
The only processes involved in the transport of microplastics in the three simulations were advection, diffusion and beaching, as in most of the existing 2-D models for the transport of microplastics. The 2-D approach used surface currents in the first sigma level of the POM domain (layer thickness around 0.08 m at the inner bay and 0.3 m at the mouth). The reference 3-D approaches used the whole 3-D velocity dataset. Weak and strong vertical turbulences were defined by low (10−5 m2 s−1) and high (10−4 m2 s−1) values of the vertical diffusivity coefficients typical of marine systems (Talley et al., 2011). With weak turbulence, particles remained near the surface during the whole simulation (standard deviation of particles depths, σ, equals 0.7 m), whereas strong turbulent conditions induced high vertical displacements of particles (σ equals 2.5 m). In order to compare only the impact of vertical turbulence on the horizontal trajectories, the effect of the horizontal diffusivity on the trajectory of each particle at each time step was considered identical in all three scenarios. Therefore, vertical displacements will be the only possible cause of the potential differences between the horizontal transport patterns of the three different approaches. In order to avoid the random behaviour of turbulent dispersion having an impact on the comparison of simulations, the same turbulent horizontal and vertical displacements were assigned to each particle at each time step for all scenarios.
All the simulations were seeded at 18 locations (Fig. 1) covering the whole coast of Jervis Bay in order to analyse the bay connectivity. Twenty particles per hour were released at each seeding site in surface waters during 3 days from 26 June 1998, a total of 25 920 particles per simulation. A sensitivity analysis of model results to the number of particles is provided in the Supplement to demonstrate that results were not affected by this parameter. Simulations were run for 5 days, as most of the particles reached the coast during this period.
2.3 Probability distributions and connectivity analysis
To evaluate the prediction accuracy of a 2-D approach in modelling the transport of neustic microplastics, we compared the trajectories and fates of microplastics obtained from 2-D and 3-D simulations using three methods: (1) visual and descriptive comparison of the resulting trajectories and fate; (2) probability-density maps; and (3) coastal connectivity analysis.
2.3.1 Probability-density maps
This analysis facilitates visualization and understanding of particle trajectories by binning particle positions into histograms. It calculates the probability that a particle will move from one location to another over a time interval τ by counting the number of particles per bin and then normalizing by the total number of particles. Bins were defined by the grid of the hydrodynamic model (500×500 m). The result is a probability map of particle density.
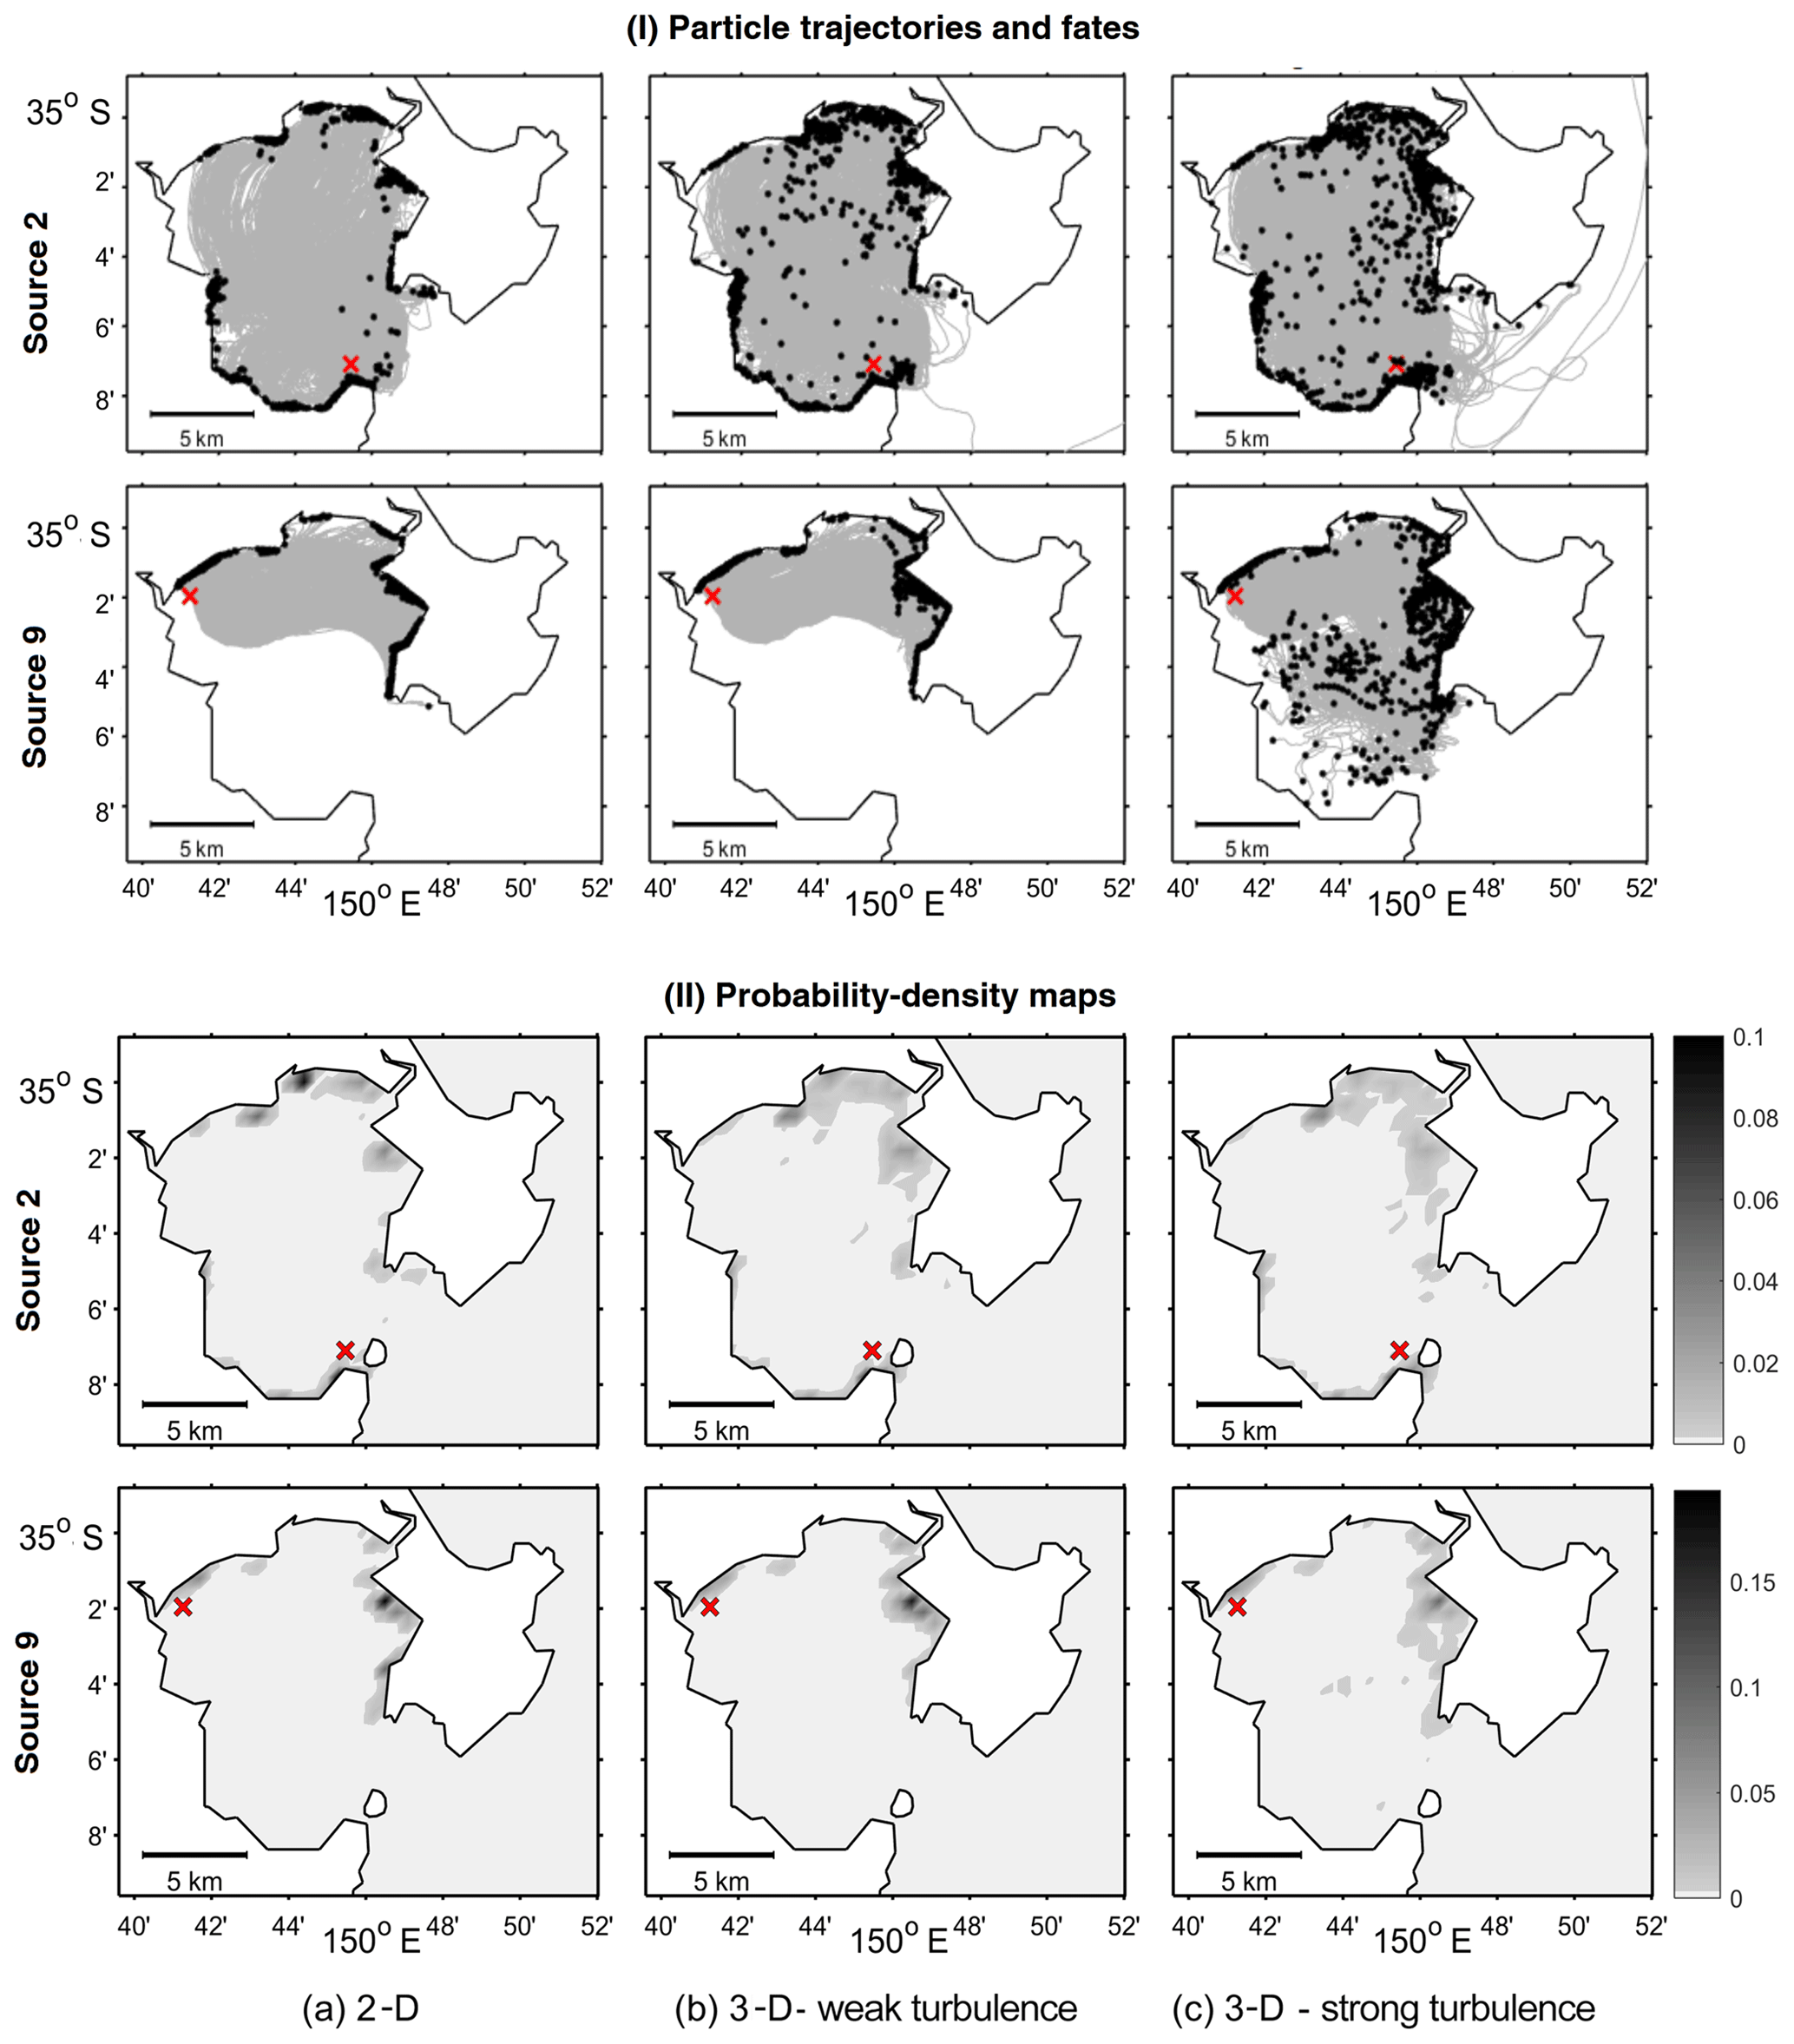
Figure 2(I) Trajectories (grey lines), fate (black dots) and (II) probability-density distribution (greyscale bar) of microplastics released at sources 2 and 9 (red crosses) after 5 d of simulation for the three different scenarios: (a) 2-D approach; (b) 3-D approach with weak vertical turbulence; (c) 3-D approach with strong vertical turbulence.
2.3.2 Coastal connectivity analysis
Coastal connectivity Cji(τ) is the probability that a particle leaving a source site j will arrive at a destination site i over the time interval τ, calculated in the same way as for the probability-density maps, using the site locations shown in Fig. 1 as source and destination locations. Destinations are rectangular areas of 1.5 km2 centred on the site locations of Fig. 1. Cji(τ) was thus calculated for five time intervals τ=1, 2, 3, 4 and 5 d. This results in five 18×18 connectivity matrices that describe the probability of microplastics particles being transported between different sites along the whole Jervis Bay coast. Readers should refer to van Sebille et al. (2018) and Mitarai et al. (2009) for a detailed description and application of both probability-density maps and connectivity analysis.
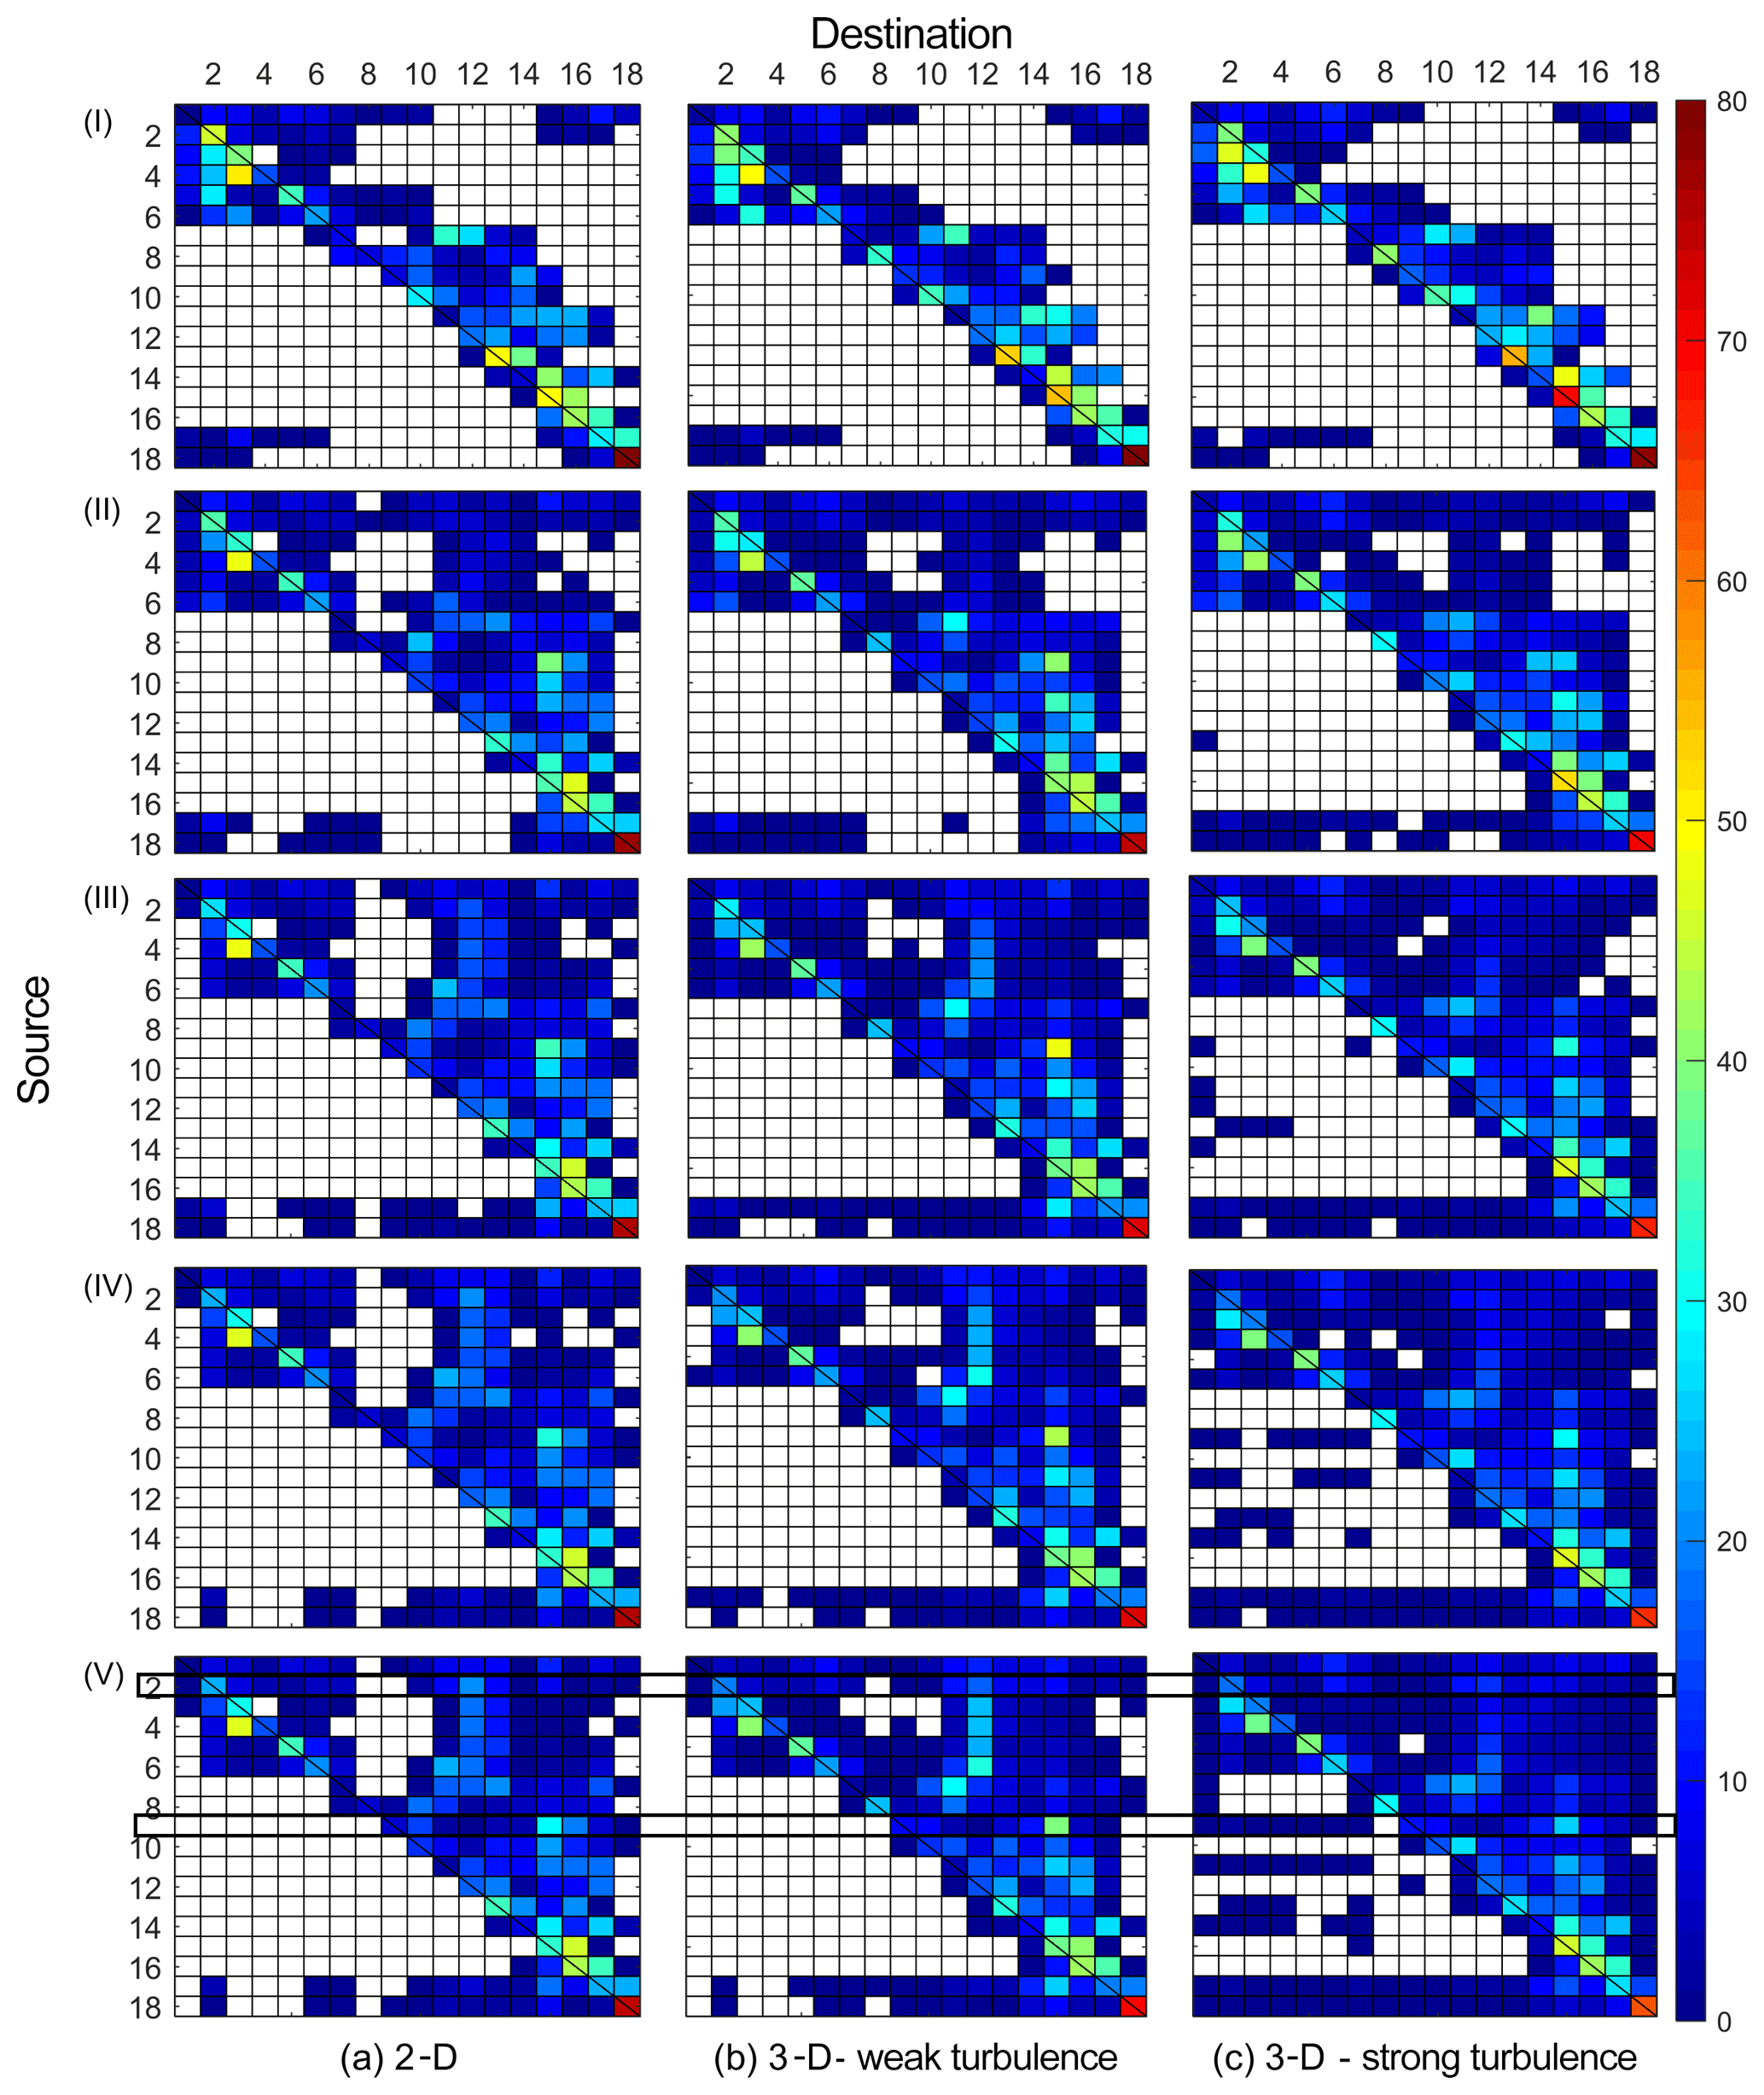
Figure 3Coastal connectivity between 18 coastal regions in Jervis Bay (Fig. 1) for simulation times (I) 1; (II) 2; (III) 3; (IV) 4; and (IV) 5 d, and for the three different scenarios: (a) 2-D approach; (b) 3-D approach with weak vertical turbulence; and (c) 3-D approach with strong vertical turbulence. Each matrix shows the percentage of particles released at source j (vertical axis) that travel to destination i (horizontal axis) for a given simulation time. Black-outlined squares in the lower panels (V) highlight the connectivity for the sources and simulation times in Fig. 2.
The trajectories and fates of microplastics released at the different source locations (Fig. 1) were plotted for the three scenarios to gain a first insight into the differences between the 2-D and 3-D approaches. Figure 2I illustrates these results for microplastic particles released at sources 2 and 9. A first comparison of the three scenarios shows differences in the dispersion patterns of particles between the 2-D and 3-D simulations. In general, particles released at a given source reached similar coastal regions in all three approaches. However, the particles seemed to have a higher horizontal spread in the 3-D approach (Fig. 2Ib–c), especially with strong vertical turbulence (Fig. 2Ic). In the case of particles released near the entrance (source 1), the vertical turbulent displacement can induce either a surface inflow or a deep outflow, so some particles could leave the bay in outflow deep currents with strong turbulence (Fig. 2Ic), whereas all the particles stayed in the bay in the 2-D approach (Fig. 2Ia) and the 3-D approach with weak vertical turbulence (Fig. 2Ib). Even in these two last cases, in which particles barely moved vertically, the dispersion patterns showed some differences. Whereas most of the particles reached the coastal region in the 2-D simulation (Fig. 2Ia), some particles remained in suspension in the bay after 5 d of simulation in the 3-D approach (Fig. 2Ib). Differences between 2-D and 3-D weak-turbulence simulations were less evident for particles released in the inner bay, for example at source 9 (Fig. 2Ia–b). In this case, most of the particles had accumulated in the inner bay by the end of the simulation; with strong turbulence, some particles ended up in the middle of the bay (Fig. 2Ic). However, this kind of analysis does not tell us whether most of the particle trajectories followed the same pattern in all three approaches, so that the visible differences did not show significant trends, or whether the visible differences showed the most common trends.
For a statistical quantification and comparison of the transport trends of the different approaches, we turn to probability-density maps; these show the probability of a particle released at a given source moving to different regions of the bay. Figure 2II shows the accumulation regions of particles released at sources 2 and 9 after 5 d of simulation. The accumulation patterns of the different approaches were not as different as suggested in Fig. 2I, and the transport patterns were roughly similar for the 2-D and 3-D approaches. In all three scenarios, particles released at sources 2 and 9 accumulated mainly in the northern and eastern regions of the bay (Fig. 2II). Nevertheless, there were clear differences between the 2-D and 3-D results. For particles released at source 9 in the inner bay with strong vertical turbulence (Fig. 2IIc), these differences were significant. Whereas there was a significant accumulation spot of microplastics on the eastern coast of the bay for the 2-D and 3-D weak-turbulence approaches (dark grey, Fig. 2IIa–b), the particles' fate was more spread out with strong vertical turbulence (Fig. 2IIc). For particles released near the entrance (source 2), differences in the fate patterns appeared between the 2-D and 3-D approaches, even for weak vertical turbulence (Fig. 2IIa–b). In this case, there was a higher spread of particles in both 3-D approaches.
For an overview of how the different modelling approaches influenced the transport patterns of neustic microplastics in the whole bay and as particles were released, Fig. 3 shows the percentage of particles traveling from and to the different coastal regions of the bay (18 sites in Fig. 1; see Sect. 2) for the three different scenarios, and simulation times from 1 to 5 d. This analysis confirmed most of the conclusions reached above. First, both the 2-D and 3-D approaches provided similar transport patterns, but there were some clear differences. These differences appeared even when vertical turbulent dispersion was weak, although they were more evident with strong vertical turbulence. In particular, particle fates were concentrated over a shorter length of the coast in the 2-D approach (fewer destinations for each source and higher probabilities of a specific destination, Fig. 3a), whereas the particle spread was greater in the 3-D approaches, especially for strong vertical turbulence (more destinations, with lower probabilities for each source; Fig. 3b–c). These differences were more significant: (1) in sources near the entrance due to the higher vertical gradients of horizontal currents (see sources from 1–9, 17 and 18 in Fig. 3); and (2) for longer simulation times, as more particles had time to reach the coast, in particular from simulation times higher than 3 d (Fig. 3III–IV).
In summary, the vertical transport of particles within surface layers due to mixing processes can affect the horizontal trajectories and fates of microplastics, particularly in systems with sharp horizontal velocity gradients. Although a 2-D approach can predict general patterns, a 3-D approach is recommended to improve the accuracy of the results, especially in the presence of strong turbulence. Three-dimensional simulations may even be necessary with weak vertical turbulence. This is because a 2-D approach can cause errors in the results due to the use of velocities at a single sigma layer which represent different depths along the particle trajectory. This can lead to unphysical vertical movements and therefore to wrong horizontal patterns in very stratified systems. Vertically averaged current velocities could also lead to errors in the horizontal trajectories. In the 3-D approach, the vertical resolution of the hydrodynamic model should be finer enough to represent the vertical current shear accurately.
All these findings may be transferable to (1) the other hydrodynamic conditions of this bay which are also dominated by baroclinic processes (coastal trapped waves, upwelling, cooling events; e.g. Wang and Symonds, 1999; Sun et al., 2017; Liao and Wang, 2018), (2) other stratified coastal systems such as estuaries characterized by a density circulation, but also (3) to oceanic water characterized by vertical current shear induced by wind and wave-driven Ekman flow or density-driven processes, for instance (Lund et al., 2015; Lanotte et al., 2016). Besides the microplastics, these results can also be applied for other floating “young” objects. A 2-D approach may be sufficient when vertical current shear is negligible. In the present case study, the transfer of particles through the water column was mainly due to vertical dispersion, while vertical advection was negligible (see the impact of vertical advection in Supplement 2). However, these results also highlight that the vertical movement of particles induced by other physical processes, such as upwelling, downwelling, wave enhancing vertical mixing, and particle sinking (in the case of non-buoyant particles), could also affect the horizontal transport of microplastics, even in a higher degree, and a 3-D approach could be mandatory. Some modelling studies consider the particle sinking in a 2-D approach (Critchell and Lambrechts, 2016; Liubartseva et al., 2018), so the vertical current shear during the vertical transport is not taken into account. Further progress on microplastics modelling requires thus the development of three-dimensional models that consider the particle sinking, which in turn depends on particle physical properties (density, size, shape, Chubarenko et al., 2016). This has been analysed in depth in our work (Jalon-Rojas et al., 2019).
In short, a 3-D approach improves the simulation of the vertical position of particles in all turbulence conditions, which impact the predictions of the horizontal trajectories and fates of low-density neustic particles, especially in stratified systems. These results have important implications for the assessment and prediction of pollution hot spots in coastal systems, as well as for planning effective clean-up programmes.
Data used in this study will be available at The ResData (UNSW repository) from 19 June 2019: http://handle.unsw.edu.au/1959.4/resource/collection/resdatac_873/1 (last access: 29 May 2019).
The supplement related to this article is available online at: https://doi.org/10.5194/os-15-717-2019-supplement.
IJR developed the study concept and performed the analysis under the supervision of EF and XHW. The manuscript was drafted by IJR and critically reviewed by all the other authors. All the authors approved the final version of the paper for submission.
The authors declare that they have no conflict of interest.
The authors thank Peter McIntyre for proofreading the article and the National Computational Infrastructure (NCI) at the Australian National University for the computational support. This is publication no. 63 of the SARCCM at UNSW Canberra. Thanks as well to the three anonymous reviewers for their helpful and constructive comments on the manuscript.
This paper was edited by Markus Meier and reviewed by three anonymous referees.
Andrady, A. L.: Microplastics in the marine environment, Mar. Pollut. Bull., 62, 1596–1605, https://doi.org/10.1016/j.marpolbul.2011.05.030, 2011.
Carbery, M., O'Connor, W., and Palanisami, T.: Trophic transfer of microplastics and mixed contaminants in the marine food web and implications for human health, Environ. Int., 115, 400–409, https://doi.org/10.1016/j.envint.2018.03.007, 2018.
Carlson, D. F., Suaria, G., Aliani, S., Fredj, E., Fortibuoni, T., Griffa, A., Russo, A., and Melli, V.: Combining Litter Observations with a Regional Ocean Model to Identify Sources and Sinks of Floating Debris in a Semi-enclosed Basin: The Adriatic Sea, Front. Mar. Sci., 4, https://doi.org/10.3389/fmars.2017.00078, 2017.
Chubarenko, I., Bagaev, A., Zobkov, M., and Esiukova, E.: On some physical and dynamical properties of microplastic particles in marine environment, Mar. Pollut. Bull., 108, 105–112, https://doi.org/10.1016/j.marpolbul.2016.04.048, 2016.
Critchell, K. and Lambrechts, J.: Modelling accumulation of marine plastics in the coastal zone; what are the dominant physical processes?, Estuar. Coast. Shelf Sci., 171, 111–122, https://doi.org/10.1016/j.ecss.2016.01.036, 2016.
Ebbesmeyer, C. C., Ingraham, W. J., Jones, J. A., and Donohue, M. J.: Marine debris from the oregon dungeness crab fishery recovered in the Northwestern Hawaiian Islands: Identification and oceanic drift paths, Mar. Pollut. Bull., 65, 69–75, https://doi.org/10.1016/j.marpolbul.2011.09.037, 2012.
Eriksen, M., Lebreton, L. C. M., Carson, H. S., Thiel, M., Moore, C. J., Borerro, J. C., Galgani, F., Ryan, P. G., and Reisser, J.: Plastic Pollution in the World's Oceans: More than 5 Trillion Plastic Pieces Weighing over 250,000 Tons Afloat at Sea, PLoS One, 9, e111913, https://doi.org/10.1371/journal.pone.0111913, 2014.
Fredj, E., Carlson, D. F., Amitai, Y., Gozolchiani, A., and Gildor, H.: The particle tracking and analysis toolbox (PaTATO) for Matlab, Limnol. Oceanogr.-Meth., 14, 586–599, https://doi.org/10.1002/lom3.10114, 2016.
Galgani, F., Hanke, G., and Maes, T.: Global distribution, composition and abundance of marine litter, in: Marine Anthropogenic Litter, edited by: Ergmann, M., Gutow, L., and Klages, M., Springer, 29–56, 2015.
Isobe, A., Kako, S. I., Chang, P. H., and Matsuno, T.: Two-way particle-tracking model for specifying sources of drifting objects: Application to the East China Sea shelf, J. Atmos. Ocean. Technol., 26, 1672–1682, https://doi.org/10.1175/2009JTECHO643.1, 2009.
Jalón-Rojas, I., Wang, X. H., and Fredj, E.: A 3-D numerical model to Track Marine Plastic Debris (TrackMPD): Sensitivity of microplastic trajectories and fates to particle dynamical properties and physical processes, Mar. Pollut. Bull, 141, 256–272, https://doi.org/10.1016/j.marpolbul.2019.02.052, 2019.
Kooi, M., Reisser, J., Slat, B., Ferrari, F. F., Schmid, M. S., Cunsolo, S., Brambini, R., Noble, K., Sirks, L. A., Linders, T. E. W., Schoeneich-Argent, R. I., and Koelmans, A. A.: The effect of particle properties on the depth profile of buoyant plastics in the ocean, Sci. Rep., 6, 33882, https://doi.org/10.1038/srep33882, 2016.
Lanotte, A. S., Corrado, R., Palatella, L., Pizzigalli, C., Schipa, I., and Santoleri, R.: Effects of vertical shear in modelling horizontal oceanic dispersion, Ocean Sci., 12, 207–216, https://doi.org/10.5194/os-12-207-2016, 2016.
Lebreton, L. C. M., Greer, S. D., and Borrero, J. C.: Numerical modelling of floating debris in the world's oceans, Mar. Pollut. Bull., 64, 653–661, https://doi.org/10.1016/j.marpolbul.2011.10.027, 2012.
Liao, F. and Wang, X. H.: A study of low-frequency, wind-driven, coastal-trapped waves along the southeast coast of Australia, J. Phys. Oceanogr., 48, 301–316, 2018.
Lithner, D., Larsson, A., and Dave, G.: Environmental and health hazard ranking and assessment of plastic polymers based on chemical composition, Sci. Total Environ., 18, 3309–3324, https://doi.org/10.1016/j.scitotenv.2011.04.038, 2011.
Liubartseva, S., Coppini, G., Lecci, R., and Clementi, E.: Tracking plastics in the Mediterranean: 2-D Lagrangian model, Mar. Pollut. Bull., 129, 151–162, https://doi.org/10.1016/j.marpolbul.2018.02.019, 2018.
Lund, B., Graber, H. C., Tamura, H., Collins, C. O., and Varlamov, S. M.: A new technique for the retrieval of near-surface vertical current shear from marine X-band radar images, J. Geophys. Res.-Ocean., 120, 8466–8486, https://doi.org/10.1002/2015JC010961, 2015.
Mitarai, S., Siegel, D. A., Watson, J. R., Dong, C., and McWilliams, J. C.: Quantifying connectivity in the coastal ocean with application to the Southern California Bight, J. Geophys. Res.-Ocean., 114, C10026, https://doi.org/10.1029/2008JC005166, 2009.
Reisser, J., Slat, B., Noble, K., Du Plessis, K., Epp, M., Proietti, M., De Sonneville, J., Becker, T., and Pattiaratchi, C.: The vertical distribution of buoyant plastics at sea: An observational study in the North Atlantic Gyre, Biogeosciences, 12, 1249–1256, https://doi.org/10.5194/bg-12-1249-2015, 2015.
Rochman, C. M., Browne, M. A., Halpern, B. S., Hentschel, B. T., Hoh, E., Karapanagioti, H. K., Rios-Mendoza, L. M., Takada, H., Teh, S., and Thompson, R. C.: Classify plastic waste as hazardous, Nature, 494, 169–171, https://doi.org/10.1038/494169a, 2013.
Sun, Y. J., Jalón-Rojas, I., Wang, X. H., and Jiang, D.: Coastal upwelling by wind-driven forcing in Jervis Bay, New South Wales: A numerical study for 2011, Estuar. Coast. Shelf Sci., 206, 101–115, https://doi.org/10.1016/j.ecss.2017.11.022, 2018.
Talley, L. D., Pickard, G. L., Emery, W. J., and Swift, J. H.: Dynamical processes for descriptive ocean circulation, in: Descriptive Physical Oceanography, 1–72, 2011.
van Sebille, E., Griffies, S. M., Abernathey, R., Adams, T. P., Berloff, P., Biastoch, A., Blanke, B., Chassignet, E. P., Cheng, Y., Cotter, C. J., Deleersnijder, E., Döös, K., Drake, H. F., Drijfhout, S., Gary, S. F., Heemink, A. W., Kjellsson, J., Koszalka, I. M., Lange, M., Lique, C., MacGilchrist, G. A., Marsh, R., Mayorga Adame, C. G., McAdam, R., Nencioli, F., Paris, C. B., Piggott, M. D., Polton, J. A., Rühs, S., Shah, S. H. A. M., Thomas, M. D., Wang, J., Wolfram, P. J., Zanna, L., and Zika, J. D.: Lagrangian ocean analysis: Fundamentals and practices, Ocean Model., 121, 49–75, https://doi.org/10.1016/j.ocemod.2017.11.008, 2018.
Wakata, Y. and Sugimori, Y.: Lagrangian Motions and Global Density Distributions of Floating Matter in the Ocean Simulated Using Shipdrift Data, J. Phys. Oceanogr., 20, 125–138, 1990.
Wang, X. H. and Symonds, G.: Coastal embayment circulation due to atmospheric cooling, J. Geophys. Res., 104, 29801–29816, https://doi.org/10.1029/1999JC900183, 1999.
Zhang, H.: Transport of microplastics in coastal seas, Estuar. Coast. Shelf Sci., 199, 74–86, https://doi.org/10.1016/j.ecss.2017.09.032, 2017.