the Creative Commons Attribution 4.0 License.
the Creative Commons Attribution 4.0 License.
 | 05 Mar 2019
Accuracy of altimeter data in inner and coastal seas
Luigi Cavaleri
Luciana Bertotti
Paolo Pezzutto
We carry out an inter-comparison of four different altimeters: Cryosat, Jason-2, Jason-3, and Sentinel-3. This inter-comparison is undertaken by checking the altimeter data against the wind and wave model results of a given area, the Mediterranean Sea, for a 1-year period. The four data sets are consistent for wind speed, but they show substantial differences with respect to wave heights. The verification of a Sentinel-3 pass close to the coast in the northern Adriatic Sea shows irregular, spiky, large, wave height values close to the coast. This problem worsens when using high-frequency altimeter data.
- Article
(1361 KB) - Full-text XML
- BibTeX
- EndNote


There is no doubt that satellite radar altimetry has revolutionized oceanography due to the continuous and abundant flow of data that has become available over the last 3 decades or so. The related surface wind speed and significant wave height data have provided both crucial information for data assimilation in, and validation of, model activity and results (e.g. Abdalla, 2007, 2016) and substantial and prolonged information that can be used for global statistics over the oceans.
Although officially calibrated, a careful inter-comparison strongly suggests that the data from different altimetry instruments require specific attention and calibration (see the keen and prolonged analysis by Young et al., 2017). While data collection began in 1986 with Geosat, the real continuous data flow began in 1991 with the launch of ERS-1, followed in time by Jason-1, ERS-2, Jason-2, Jason-3, Envisat, Altika, and Cryosat, before ending (for the time being) with Sentinel-3 (see also Passaro et al., 2014).
The two different principles of interaction with the sea surface for wind and wave information retrieval (back scattering and specular reflection, respectively) imply different calibrations for the two signals. These calibrations should be sensitive to the average conditions where the specific operation was carried out (see the valuable work on this topic by Queffeulou and Bertamy, 2007). As these calibrations are mainly carried out using buoy data in the oceans, it is correct to wonder if the calibrations also hold in the rather different conditions of inner seas. This is particularly true in view of the use of Sentinel-3 in close coastal waters in an attempt to push the use of altimeter data very close to the coast – certainly much closer than the 20–30 km distance used in classical altimetry.
In this short paper we carry out an inter-comparison of the wind and wave data from four different altimeters and the results of two high-resolution models, a meteorological and a wave model, respectively, in the Mediterranean Sea. We use Cryosat, Jason-2, Jason-3, and Sentinel-3 data (hereafter referred to as Cy, J2, J3, and S3, respectively). The study period utilized is the 12 months from July 2016 to June 2017, and the models used in the inter-comparison are COSMO for meteorology (see http://www.cosmo-model.org/content/model/default.htm, last access: 23 July 2018) and WAM for waves (see the historical study by Komen et al., 1994, and the more updated work by Janssen et al., 2005). The related operational system is the combined effort of the Italian Meteorological Service and the Institute of Marine Sciences (ISMAR-CNR). COSMO is run at a 7 km resolution, whereas WAM is run at a 0.05∘ resolution. The system provides twice daily 3-day forecasts at hourly intervals. A full description of the system and its accuracy is available in Bertotti et al. (2013). For the altimeter–model inter-comparison we used the first 12 h forecasts of the twice daily operational activity (hourly fields). The model data have been, bilinearly in space and linearly in time, interpolated at the position and time of each altimeter datum. The Cy, J2, and J3 data were retrieved from the Delft University website http://rads.tudelft.nl/rads/rads.shtml (last access: 23 July 2018), whereas the S3 data were retrieved from https://coda.eumetsat.int (last access: 23 July 2018).
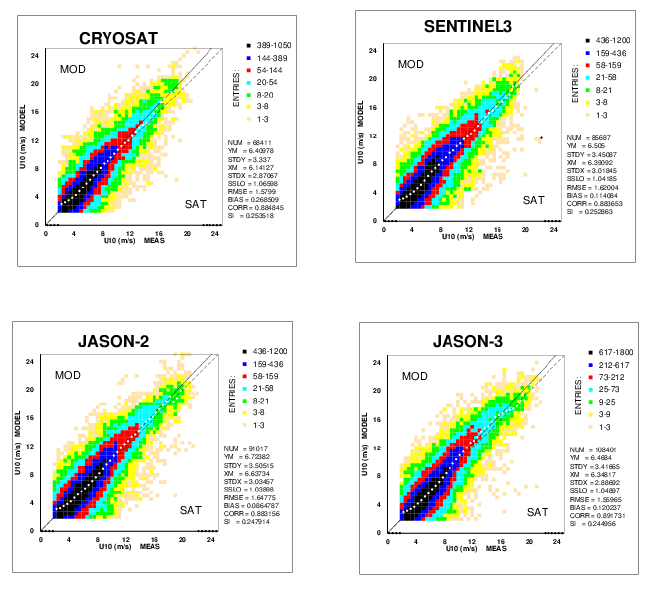
Figure 1Scatter diagrams of the COSMO model wind speeds vs. the Cy, S3, J2, and J3 altimeter data in the Mediterranean Sea region. The continuous lines show the respective best-fit slopes. Dashed lines represent the perfect fit.
We stress that for the most part, the analysis is based on an inter-comparison (although an indirect inter-comparison) of the different altimeters rather than on a comparison with the model data. We present our analysis and results in Sect. 2. In Sect. 3 we focus on an example of use of S3 data very close to the coast, and we summarize our conclusions in Sect. 4.
Figure 1 provides the scatter diagrams and related statistics for the model surface wind speed vs. the altimeter data for the four satellites considered. The coloured scale on the right side of each panel indicates the number of data entries in each pixel.
With wind speed best-fits varying between 4 % and 6 %, there is a clear relative overestimate by the model. There is a rather large scatter, with the scatter index (SI) typically around 0.25. Furthermore, there is some indication of a larger overestimate in the higher value range. However, for the purpose of this study we focus on the altimeter data, and the results in Fig. 1 suggest consistent performance among the four altimeters.
Things are rather different when we consider the significant wave height, Hs (Fig. 2). In this case, there are obvious differences among the four altimeters (summarized in Table 1).
Table 1Symmetric best-fit slope (SSLO) and scatter index (SI) of the wave model data vs. the altimeter data. Cy refers to Cryosat, J2 refers to Jason-2, J3 refers to Jason-3, and S3 refers to Sentinel-3.

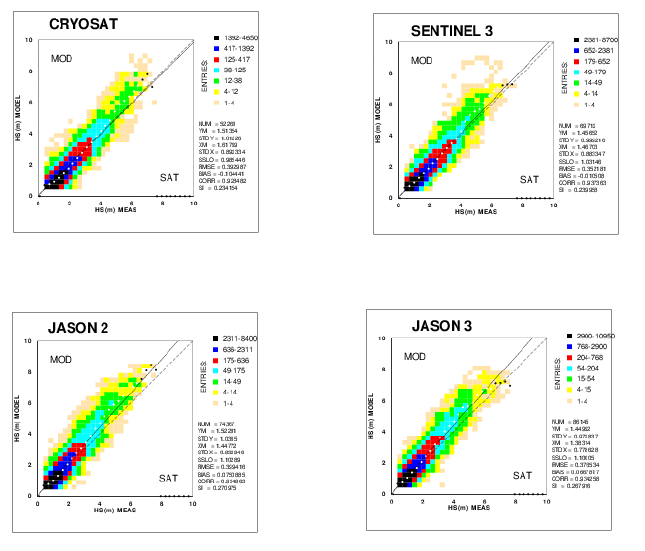
There is a 12 % wave height best-fit difference between the two Jason altimeters and Cy, and a 7 % best-fit difference vs. S3. Therefore, our argument is as follows: given that the different altimeters have been compared against the same model data (area and period), these results must reflect differences between the four instruments. However, it can also be argued that the four instruments did not measure the same wave conditions (in space and time), with each satellite sampling the surface at different times and positions. To explore this possibility, we split each altimeter data set into two halves using random sampling of the different passes. We then carried out new statistical analyses for each of the two halves of the data. As an example, we show the related results for Cy in Fig. 3. Similar results hold for each satellite. There is hardly any difference. For each altimeter the differences among the full and half statistics are generally less than 2 % of the single statistical figures. Therefore, the results in Table 1 are fully representative of the entire situation.

Figure 3As in Fig. 1, but only for the Cryosat data. The full data set (a) and the two complementary halves of the data selected using random sampling (b, c) are shown.
The Sentinel-3 altimeter acquisition system, which to some extent is an evolution of the SIRAL mounted on the Cryosat-2 satellite, is claimed to enhance the accuracy of sea state measurements close to the coast. The S3 altimeter, SRAL, has two distinct operational modes: the conventional low-resolution (LRM) mode and the high along-track resolution, or SAR mode (https://sentinel.esa.int). The latter mode is synthesized from a composition of 64 Ku-band pulses and two C-band ones. Operating in SAR mode, the SRAL along-track resolution is of the order of 300 m with a large (up to 10 km) lateral swath. The reduced sampling area obviously implies higher noise in the signal; however, in principal, it allows the acquisition of meaningful data much closer to the coast, especially when flying perpendicular to the coastline. We explore this possibility by analysing one pass in the northern Adriatic Sea.
The proposed sample is a Level 2 product provided from the Copernicus service with the following identifier: “S3A_SR_2_WAT____20170725T094431_20170725T094658_20170725T120008_0146_020_193______MAR_O_NR_002.SEN”. The NetCDF file also contains plrm (pseudo-low-res mode) data, which is intended as a simulation, starting from Ku-band pulses, of the classical altimeter sampling strategy, LRM.
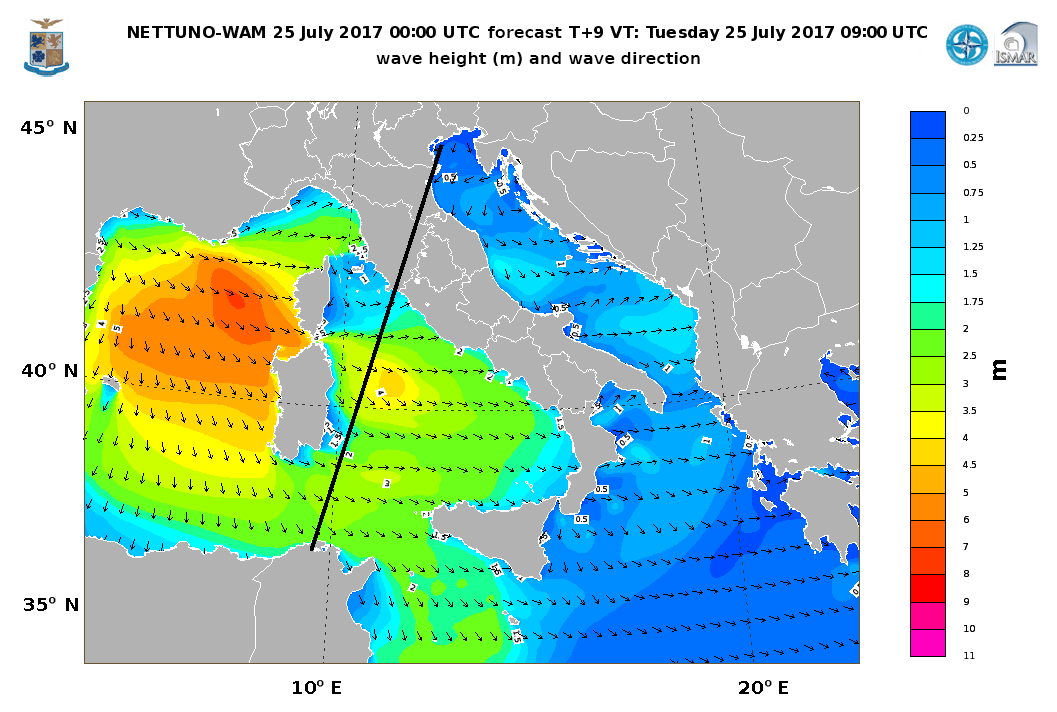
Figure 4Ground track of a descending pass of the Sentinel-3 altimeter. The background colours and arrows show the significant wave height distribution.
Figure 4 shows the ground track during an S3 descending pass over the Adriatic and then the Tyrrhenian Sea on 25 July 2017. There was a severe mistral storm in the western Mediterranean (see the Hs scale on the right), but only a tiny bit of it passing between Corsica and Sardinia was touched by the pass. The model and altimeter data are shown in Fig. 5, with decreasing latitude on the x axis; hence, Fig. 5 follows the satellite track from left to right. For a short moment we focus on the Tyrrhenian Sea results, the modelled Hs follows the measured quantity well. The dashed line (right scale) shows the distance from the closest coast (in kilometres). Note the altimeter spikes when entering and exiting land. In this respect, we zoom in on the short passage over the Adriatic Sea (the first short section in Fig. 5), which is geographically better represented in Fig. 6. We recognize the Venice Lagoon (about 50 km long) and the protruding Po River delta intersected by the descending satellite ground track. The dots in Fig 6 and the numbers listed beside them represent the 1 s S3 Hs data (Ku-band); note the incoherent data when passing over the Po River delta and when entering land again shortly after. The oceanographic situation is shown in Fig. 7. There is a very mild wind sea from the north-east and a significant wave height close to, but generally less than, 0.5 m (product of the operational ISMAR Adrioper wave forecast system; see Bertotti and Cavaleri, 2009). An independent validation (not shown) of the model results for this day is provided using the data regularly recorded at the ISMAR “Aqua Alta” oceanographic tower (Cavaleri, 2000), located 15 km offshore from the Venice Lagoon (see Fig. 6). The model–measurement Hs difference close to the time of the satellite overpass is less than 10 %, which, based on previous experience and validation (Bertotti and Cavaleri, 2009), we take as being characteristic of the overall local field, including the model data corresponding to the S3 differences.
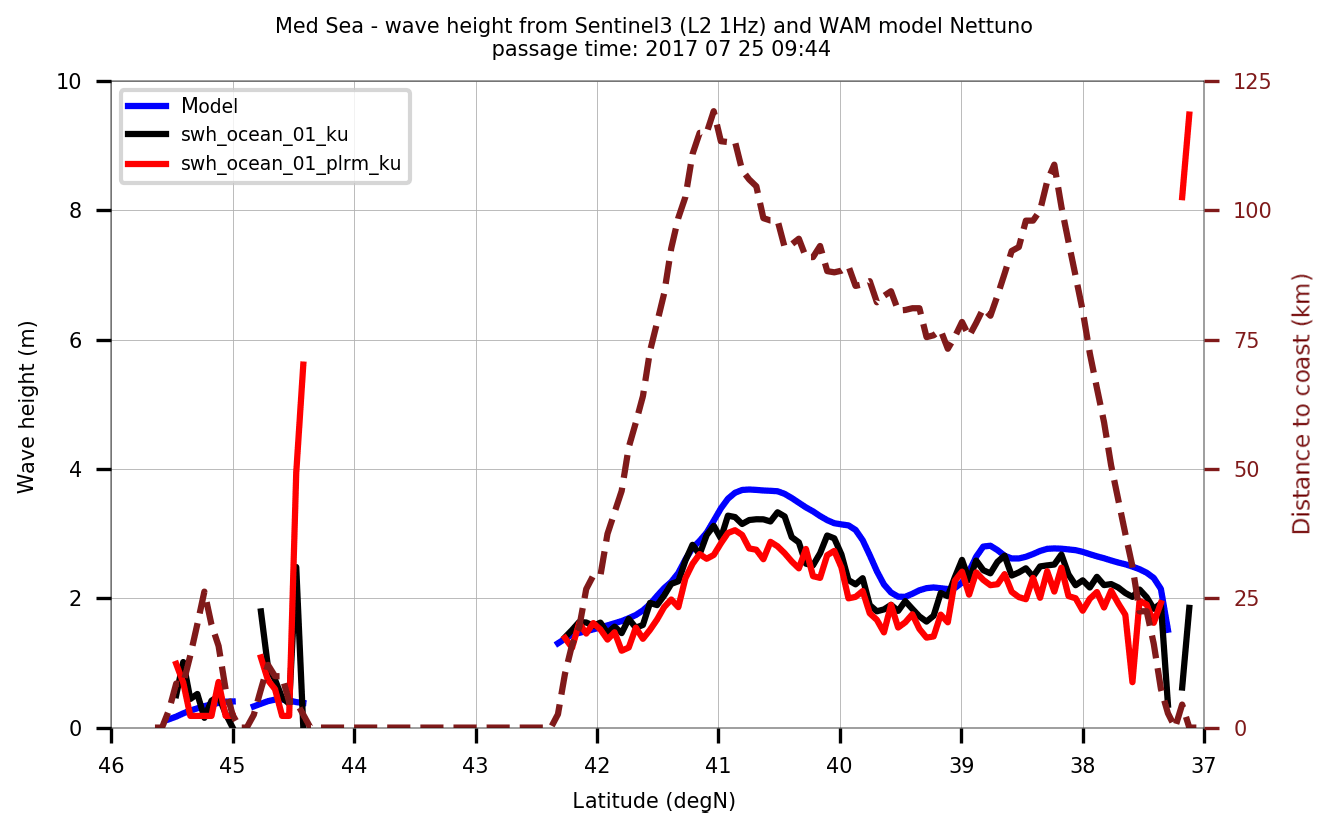
Figure 5Inter-comparison, along the ground track in Fig. 4, of the model significant wave heights and the measurements (ku- and plrm-ku-corrected Hs) from the Sentinel-3 altimeter. The dashed line shows the distance in kilometres of each measurement from the closest coast.
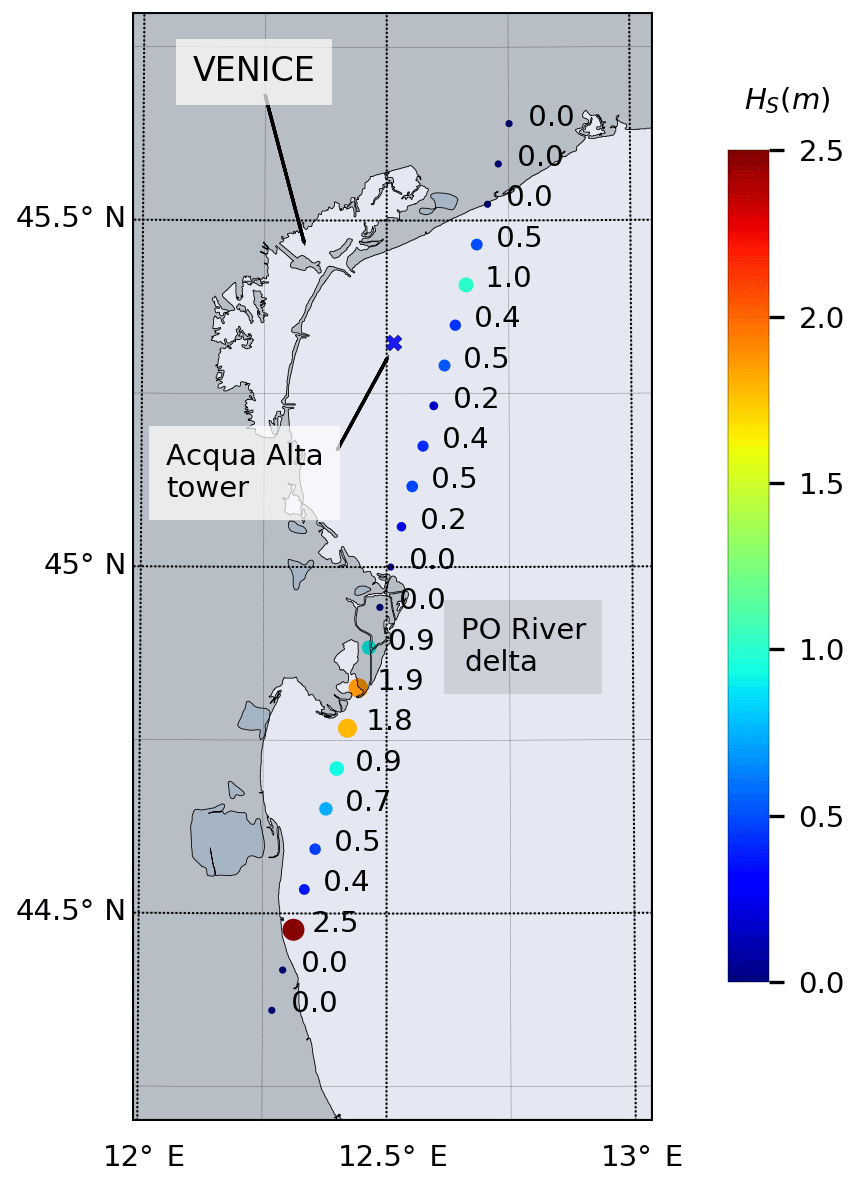
Figure 6Detailed geometry, focused on the Adriatic Sea, of the area of the pass shown in Fig. 4 and (in more detail in) Fig. 7. The positions and the corresponding SAR mode (swh_ocean_01_ku) altimeter significant wave height values are also shown (in metres).
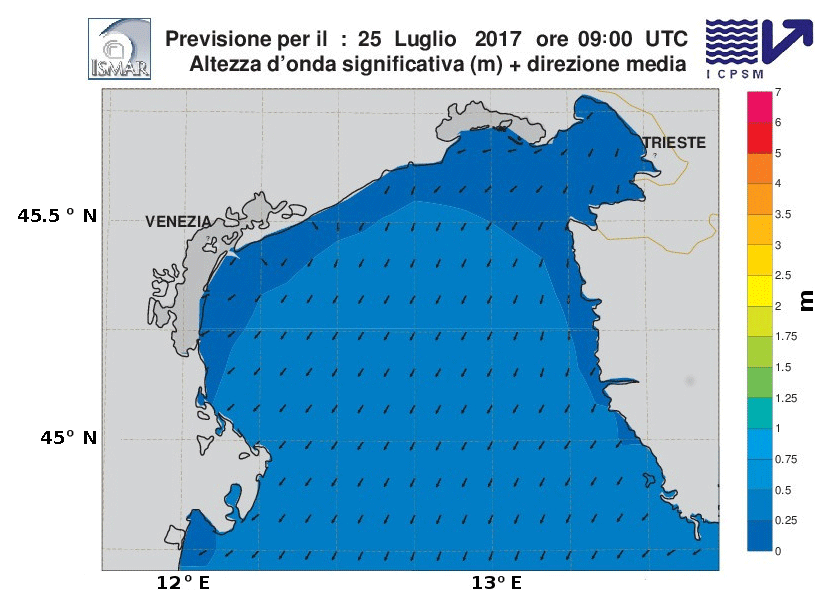
Figure 7Wave field (very mild conditions) in the northern Adriatic Sea at 09:00 UTC on 25 July 2017. The arrows show the significant wave height and mean direction. The modelled maximum wave height in the field is close to 0.5 m. Wind and waves were from the east-north-east.
In Fig. 8 we show a detailed comparison of the three different (ku- and plrm-ku-) bands and model Hs values plus the distance (km) from the closest coast. There are some obviously absurd values from S3 in the two signals, more so in the plrm-ku band; these values correspond to distances of less than 10 km from the coast.

Figure 8Inter-comparison, for the pass shown in Fig. 6 and the time shown in Fig. 7, of the S3 ku- and plrm-ku- wave heights and the corresponding wave model results. The dashed line shows the distance from the closest coast (in kilometres).
Finally in Fig. 9 we explore the 20 Hz data. Panel (a) shows the whole pass (corresponding to the pass shown in Fig. 5), and panel (b) focuses on the Adriatic Sea. The noise of the signal is evident, also when the distance from the coast was about 20 km. There is also a very large variability of the S3 altimeter signal in the Tyrrhenian Sea, which can not be justified on a geophysical basis; therefore, it is natural to associate this variability with the instrument and the sampling variability. Again, the S3 approach seems to lead to very large Hs values, particularly when the distance from the coast approaches the classical 20–30 km limit of standard altimetry.
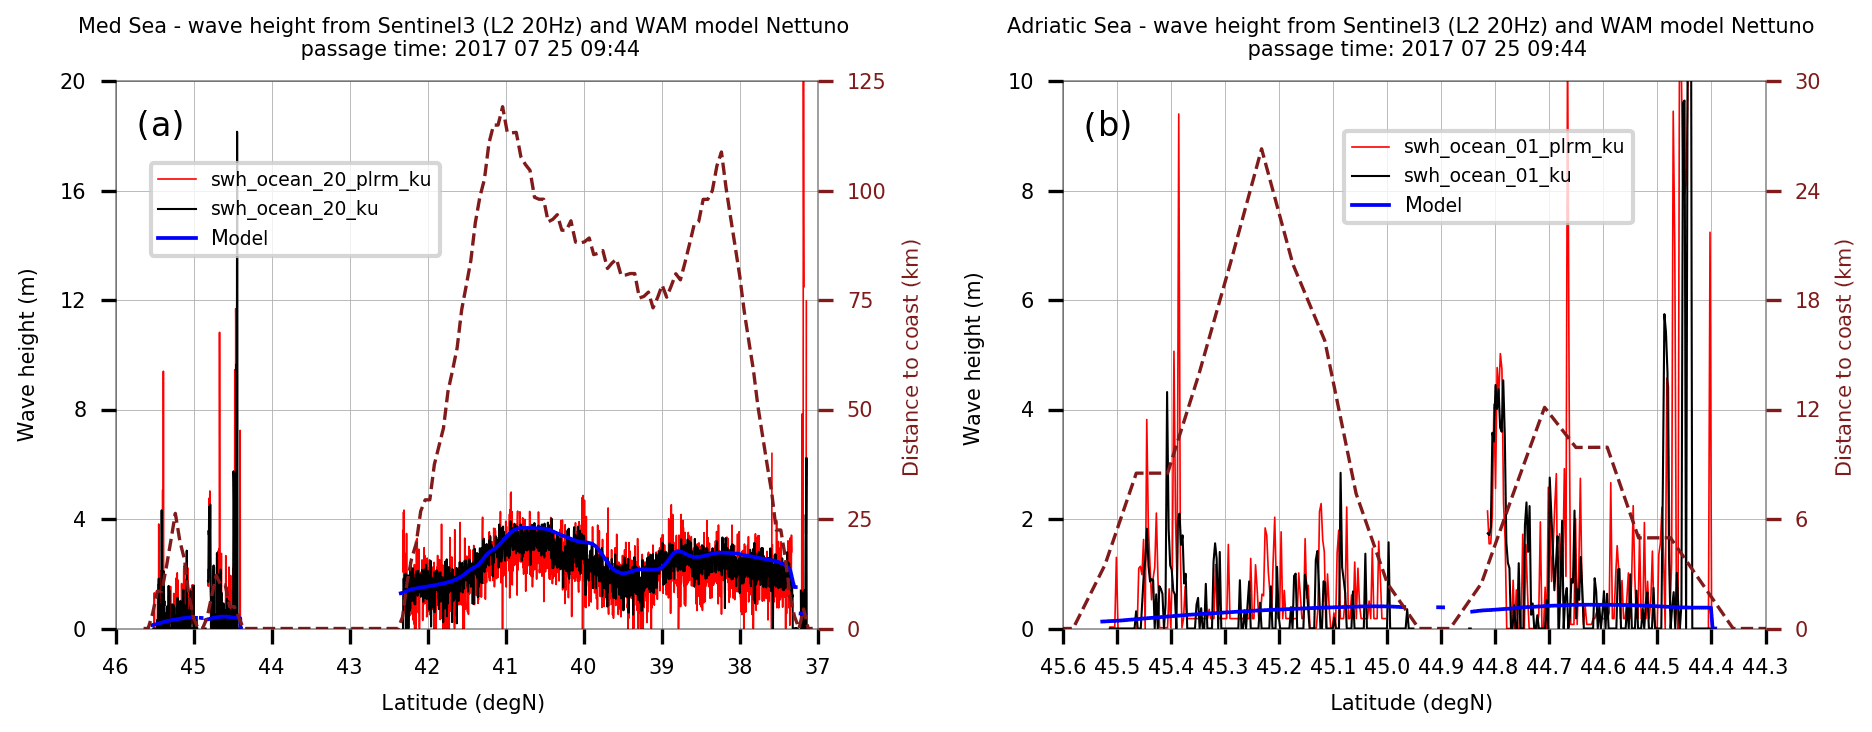
Figure 9As in Fig. 8, but for the 20 Hz altimeter data. Panel (a) represents the full pass, and panel (b) represents the Adriatic Sea section (see Fig. 8 for comparison).
Following the extensive availability of altimeter data for both wind and waves, and the relevance of these data for validating model results, we explored the consistency of the data from four different altimeters. Due to the lack of the possibility to carry out extensive triple-colocation analysis (the data sets would have been too small to obtain meaningful results), we followed a different principle, i.e. we used the model data as reference and, without arguing about right or wrong, we explored how each satellite fitted the model data. If the altimeters are consistent with one another, each altimeter vs. model fit should provide the same best-fit slope. Furthermore, we also explored the values of S3 data close to the coast. In summary, we carried out two tests: (1) an extensive test on four different altimeters (Cy, J2, J3, and S3; see Table 1), and (2) a sample test on one S3 pass. The purpose of (1) was an, indirect but significant, inter-comparison of the four altimeters. Test (2) was meant to explore one specific case of sampling by S3 in coastal waters. During test (2), we also checked the value of the 20 Hz data. We summarize our results as follows:
- 1.
The surface wind speed values derived from the four altimeters are consistent to each other, differing by less than 2 % on average.
- 2.
Large differences are found in a similar inter-comparison for the significant wave height Hs. There is a 12 % difference on average between the best-fit slopes of Cy and the J2–J3 data, the latter instruments measured larger wave heights. The S3 values lay more or less in the middle.
- 3.
The S3 1 Hz data close to the coast are noisy, with spikes of obviously incorrect, large values. The use of 20 Hz seems to increase the noise, with incorrect, large values also appearing relatively far (20 km) from the coast.
- 4.
Furthermore, the use of 20 Hz also leads to a high variability of the Hs data in the open sea, far from the coast, implying that this variability is associated with the instrumental measurement and its sampling variability.
The altimeter data are available at http://rads.tudelft.nl/rads/rads.shtml (last access: 9 January 2019). The S3 data are available at https://sentinel.esa.int/web/sentinel/missions/sentinel-3/data-products (last access: 9 January 2019). The model data are available from the Italian Meteorological Service at http://www.meteoam.it/ (last access: 9 January 2019).
LC and LB have dealt with the model and altimeter data. PP worked with the S3 data and their analysis.
The authors declare that they have no conflict of interest.
This article is part of the special issue “Coastal modelling and uncertainties based on CMEMS products”. It is not associated with a conference.
Luigi Cavaleri, Luciana Bertotti, and Paolo Pezzutto were partially
supported by the EU contract 730030, referred to as H2020-EO-2016 “CEASELESS”. Jesus
Portilla and two anonymous reviewers provided useful suggestions to
improve the readability of the paper.
Edited by: Joanna Staneva
Reviewed by: Jesus Portilla and two anonymous referees
Abdalla, S.: Ku-band radar altimeter surface wind speed algorithm, in: Proceeding sof the Envisat Symposium 2007, edited by: Lacoste, H. and Onwehand, L., ERA SP-646, 463250, available at: https://earth.esa.int/workshop/envisatsymposium/proceedings/sessions/3E4/463250sa.pdf (last access: 1 July 2018), 2007.
Abdalla, S.: The use of radar altimeter products at ECMWF, ECMWF, ECMWF Newsletter, 149, 14–19, 2016.
Bertotti, L. and Cavaleri, L.: Wind and wave predictions in the Adriatic Sea, J. Marine Syst., 78, S227–S234, https://doi.org/10.1016/j.jmarsys.2009.01.018, 2009.
Bertotti, L., Cavaleri, L., Loffredo, L., and Torrisi, L.: Nettuno: analysis of a wind and wave forecasting system for the Mediterranean Sea, Mon. Weather Rev., 141, 3130–3141, https://doi.org/10.1175/MWR-D-12-00361.1, 2013.
Cavaleri, L.: The oceanographic tower Acqua Alta – Activity and prediction of sea states at Venice, Coast. Eng., 39, 29–70, https://doi.org/10.1016/S0378-3839(99)00053-8, 2000.
Janssen, P. A. E. M., Bidlot, J.-R., Abdalla, S., and Herbach, H.: Progress in ocean wave forecasting at ECMWF, ECMWF, ECMWF Technical memorandum 478, 27 pp., 2005.
Komen, G. J., Cavaleri, L., Donelan, M., Hasselmann, K., Hasselmann, S., and Janssen, P. A. E. M.: Dynamics and Modelling of Ocean Waves, Cambridge University Press, University Press, Cambridge, U.K., 532 pp., 1994.
Passaro, M., Cipollini, P., Vignudli, S., Quartly, G., and Seveith, H.: ALES: a multi-mission adaptive waveform retracker for coastal and open ocean altimetry, Remote Sens. Environ., 145, 173–179, 2014.
Queffeulou, P. and Bertamy, A.: Analysis of wave height variability using altimeter measurements: application to the Mediterranean Sea, J. Atmos. Ocean Tech., 21, 2078–2092, https://doi.org/10.1175/2007JTECH0507.1, 2007
Young, I. R., Sanina, E., and Babanin, A. V.: Calibration and cross validation of a global wind and wave database of altimeter, radiometer, and scatterometer measurements, J. Atmos. Ocean Tech., 34, 1285–1306, https://doi.org/10.1175/JTECH-D-16-0145.1, 2017.