the Creative Commons Attribution 4.0 License.
the Creative Commons Attribution 4.0 License.
 | 02 Aug 2018
An evaluation of the performance of Sea-Bird Scientific's SeaFET™ autonomous pH sensor: considerations for the broader oceanographic community
Cale A. Miller
Katie Pocock
Wiley Evans
Amanda L. Kelley
The commercially available Sea-Bird SeaFET™ provides an accessible way for a broad community of researchers to study ocean acidification and obtain robust measurements of seawater pH via the use of an in situ autonomous sensor. There are pitfalls, however, that have been detailed in previous best practices for sensor care, deployment, and data handling. Here, we took advantage of two distinctly different coastal settings to evaluate the Sea-Bird SeaFET™ and examine the multitude of scenarios in which problems may arise confounding the accuracy of measured pH. High-resolution temporal measurements of pH were obtained during 3- to 5-month field deployments in three separate locations (two in south-central Alaska, USA, and one in British Columbia, Canada) spanning a broad range of nearshore temperature and salinity conditions. Both the internal and external electrodes onboard the SeaFET™ were evaluated against robust benchtop measurements for accuracy using the factory calibration, an in situ single-point calibration, or an in situ multi-point calibration. In addition, two sensors deployed in parallel in Kasitsna Bay, Alaska, USA, were compared for inter-sensor variability in order to quantify other factors contributing to the sensor's intrinsic inaccuracies. Based on our results, the multi-point calibration method provided the highest accuracy (< 0.025 difference in pH) of pH when compared against benchtop measurements. Spectral analysis of time series data showed that during spring in Alaskan waters, a range of tidal frequencies dominated pH variability, while seasonal oceanographic conditions were the dominant driver in Canadian waters. Further, it is suggested that spectral analysis performed on initial deployments may be able to act as an a posteriori method to better identify appropriate calibration regimes. Based on this evaluation, we provide a comprehensive assessment of the potential sources of uncertainty associated with accuracy and precision of the SeaFET™ electrodes.
- Article
(3925 KB) - Full-text XML
- BibTeX
- EndNote


The intrusion of excess anthropogenic CO2 into the global oceans – referred to as ocean acidification (OA) – induces a series of geochemical reactions that increases seawater hydrogen ion concentration [H+] (lowering pH) while concomitantly reducing the ocean's overall buffering capacity by reducing the carbonate concentration [] (Caldeira and Wickett, 2003; Orr et al., 2005). Due to more dynamic natural, physical, and chemical processes in the coastal ocean, drivers of nearshore acidification are different than those for the open ocean. Open-ocean acidification of surface waters is predominately a function of equilibration with atmospheric pCO2, thus increasing on yearly and decadal timescales as anthropogenic sources of CO2 production continue (Hofmann et al., 2011; Orr et al., 2005). Coastal acidification, however, can manifest on short time and space scales driven by riverine input and its chemical constituents (e.g., organic carbon, nutrients, and organic alkalinity), community metabolism and organization, tidal cycles, upwelling, and groundwater input (Duarte et al., 2013; Sunda and Cai, 2012; Waldbusser and Salisbury, 2014), all of which can act in conjunction with increasing atmospheric CO2, leading to more frequent, intense, and longer-lasting acidification events (Hales et al., 2016; Harris et al., 2013). In the face of rapidly changing coastal conditions, tracking and quantifying the progression of OA requires precise and accurate measurements of carbonate chemistry over long periods of time; these can be achieved by appropriately constraining the carbonate system by measuring at least two of the system's parameters: total dissolved inorganic carbon (TCO2), total alkalinity (TA), pH, and the partial pressure of CO2 (pCO2). Despite the marked increase in OA research over the past decade (Riebesell and Gattuso, 2015; Rudd, 2017), nearshore monitoring efforts – particularly in estuarine waters – have been slow to ramp up; however, efforts are beginning to intensify as technological advancements are made (Feely et al., 2010, 2016; Hales et al., 2016; Harris et al., 2013; Newton et al., 2012; Waldbusser and Salisbury, 2014; Chan et al., 2017).
Acidification of Alaskan coastal waters is predicted to progress rapidly relative to other regions within the next 50 years, and negatively impact the socioeconomic and ecological structure of Alaskan marine resources, disrupting Alaskan Native subsistence and commercial fisheries (Ekstrom et al., 2015; Mathis et al., 2015b). The ocean waters present along the Alaskan coastline experience chemical and physical drivers of seawater chemistry that are unique to this region. The low seawater temperatures inherently have higher concentrations of dissolved CO2, and chemical and physical oceanic processes unique to Alaskan waters such as sea ice melt, glacial discharge, and benthic pelagic coupling across shallow shelves are likely to exacerbate acidification in this region (Evans et al., 2014; Mathis et al., 2011a, b, 2012). Recently, an OA monitoring initiative has been setup by the Alaska Ocean Observing Network (AOOS) to track and provide accessible material dedicated to acidification research in Alaskan waters (http://www.aoos.org/alaska-ocean-acidification-network, last access: 30 July 2018). Along the Pacific coast of Alaska, a robust benchtop system known as a Burke-o-Lator (BoL), which measures TCO2 and pCO2 either continuously in a flow-through environment or from discrete seawater samples (Bandstra et al., 2006; Barton et al., 2012; Hales et al., 2016), has been installed in several locations, including the OceansAlaska Shellfish Hatchery in Ketchikan, the Alutiiq Pride Shellfish Hatchery in Seward (Evans et al., 2015), and at the Sitka Tribe of the Alaska Environmental Research Center (real-time data from Alaskan and other BoLs: http://www.ipacoa.org/Explorer?action=oiw:fixed_platform last access: 30 July 2018). Nominal analytical uncertainty for TCO2 determinations from this system is 0.2 % based on the reproducibility of sample and certified reference material (CRM; provided by Andrew G. Dickson analyses). For pCO2 determinations, analytical uncertainty is 1.5 % based on the inaccuracy of calculated CRM alkalinity relative to the certified value. While the BoL has significant advantages for achieving robust OA measurements in nearshore waters, the physical constraints of a benchtop system limit the spatial dimension of which carbonate chemistry parameters can be measured. One potential resolution to diminish the gap in coverage of OA monitoring is to utilize autonomous pH sensors, which are far more versatile in their ability to monitor hard-to-reach areas.
Recent assessments regarding OA monitoring efforts have specifically highlighted the benefits of accessibility by the commercially produced SeaFET™ pH sensor using Honeywell Durafet technology (Martz et al., 2015). The SeaFET™ was originally developed at the Monterey Bay Aquarium Research Institute (Martz et al., 2010) but since has been manufactured and distributed by Satlantic, which is now incorporated into Sea-Bird Scientific (http://www.seabird.com, last access: 30 July 2018). The partnership between MBARI, the Scripps Institute of Oceanography, and Satlantic led the way for commercial availability of the SeaFET™, providing a ready-to-deploy factory calibration, quick start manual, and user-friendly interface. The first generation of SeaFETs™ (not distributed by Sea-Bird, but by Todd Martz at Scripps Institute of Oceanography) have been deployed in numerous field studies and were heavily scrutinized in order to provide robust best practices for appropriate calibration and deployment procedures (Bresnahan et al., 2014; Hofmann et al., 2011; Kapsenberg and Hofmann, 2016; Martz et al., 2010; Matson et al., 2011; Yu et al., 2011). More recent studies have expanded the scope of SeaFET™ accuracy, inter-sensor variability, operator experience, and multi-point calibration techniques (Gonski et al., 2018; Johnson et al., 2017; Kapsenberg et al., 2017; McLaughlin et al., 2017). Given the multitude of information regarding SeaFET™ performance, coalescing all the potential sources of uncertainty of measurements (e.g., inter-sensor variability and calibration method) can be logistically challenging for inexperienced oceanographers who now have access to SeaFETs™ distributed by Sea-Bird.
In this study, we aimed to take advantage of two distinct coastal settings in order to deploy and evaluate the commercially available Sea-Bird SeaFET™, and the potential uncertainties that can arise with time series pHt (total scale) measurements. For this evaluation, SeaFETs™ were co-deployed side-by-side to quantify inter-sensor variability, discrepancies were examined between factory calibration, in situ single-point calibration, and in situ multi-point calibration pHt values, and anomalous data associated with sensor conditioning times were detailed and considered as potential sources of measurement inaccuracies. All evaluations of SeaFET™ performance were under non-controlled source water conditions (i.e., non-manipulated seawater) or by in situ deployments. Three pH sensors were deployed in coastal waters and were subjected to tidal influences and freshwater input, while a fourth was compared to pHt values derived from measurements obtained by a BoL. Finally, a spectral analysis of the quality-controlled data was performed in order to identify the driving mechanism of pHt variability between these divergent sites and to consider possible un-accounted for calibration errors that could occur in dynamic settings that might not be resolved using a specific calibration method.
2.1 Apparatus: SeaFET™
The commercially available Sea-Bird SeaFET™ has retained the basic design of the original sensor developed at MBARI (Martz et al., 2010). This pH sensor uses the ion sensitive field effect transistor (ISFET) technology, and is outfitted with an internal Honeywell Durafet and an external solid-state chloride selective electrode (Cl-ISE) along with an internal thermistor, which derives temperature using the Steinhart and Hart (1968) equation. The internal reference electrode is intrinsically insensitive to salinity over a tested range from 30 to 36 (Bresnahan et al., 2014), with recent work even suggesting a near-ideal Nernstian response to salinity as low as ∼ 9.0 (Gonski et al., 2018). This is converse to the chloride sensitive external electrode, which is salinity dependent. Both electrodes demonstrate exceptional stability over a range of moderate salinity (30–36) and broad temperature (−1 to 35 ∘C) (Bresnahan et al., 2014; Kapsenberg et al., 2015; Martz et al., 2014, 2010). The range of salinity sensitivity for the external electrode has even been extended down to 20, where it displays a near-ideal Nernst slope (Takeshita et al., 2014). Sea-Bird suggests that the external reference electrode provides the more accurate and stable pHt measurement given that chloride concentration can be precisely determined from accurate salinity measurements. This is in agreement with previous research demonstrating that the external electrode has a more robust stability (Martz et al., 2010). In dynamic nearshore environments (e.g., estuaries with strong tidal and riverine fluxes), however, the pHt derived from the internal electrode is recommended (Sea-Bird Scientific's Branham, Charles, personal communication, 2016) despite the potential of thermodynamic hysteresis (Martz et al., 2010). Bresnahan et al. (2014) demonstrated that the internal electrode is of the highest quality and under most scenarios remains nearly as stable as the external electrode – this was further corroborated by Gonski et al. (2018) with SeapHOx deployments in the Murderkill estuary, Delaware.
2.2 Calibration
Currently, three different calibration methods are present for the SeaFET™: a factory pre-deployment single-point calibration, in situ single-point calibration, and an in situ multi-point calibration (Bresnahan et al., 2014; Gonski et al., 2018). To properly calculate pHt from sensor voltage readings, an appropriate calibration coefficient is required. The applied calibration coefficients from the factory are a single-point, pre-deployment calibration. Given that a conditioning period is required for the sensor (Bresnahan et al., 2014), these coefficients are likely not adequate once the sensor becomes conditioned to the environment to which it is deployed. For the internal electrode, the new calibration coefficient k0i can be determined as
and k0e for the external electrode
where Vint|ext is the voltage from the electrode and k2i|e is the temperature coefficient (dE∗ ∕ dT) applied to all SeaFETs™ (Martz et al., 2010). For detailed definitions of Snernst and the salinity dependent constants γHCl (HCl activity coefficient), ClT (total chloride), ST (total sulfate), and the dissociation constant Ks (Dickson et al., 2007; Khoo et al., 1977) in Eqs. (1) and (2), we refer readers to Martz et al. (2010), Bresnahan et al. (2014), and Sea-Bird Scientific SeaFET™ Product Manual 2.0.0 or most recent edition. In the literature, SeaFET™ calibration coefficients have been denoted as and (Martz et al., 2010; Bresnahan et al., 2014), however, for the purpose of this evaluation – which specifically examines Sea-Bird SeaFETs™ – the adoption of k0 and k2 is in accordance with the preferred nomenclature from the manufacturer.
Unlike the factory pre-deployment single-point calibration, the in situ single-point calibration occurs after the sensor has been deployed in the field. At the operator's discretion, a discrete sample will be collected in direct proximity to the deployed sensor at the same time that it is actively making a measurement, and then measured for pHt at in situ temperature and salinity. The known pHt would then be used in the above equations as the “pHt” variable. Similar to the single-point in situ calibration, the multi-point calibration derives a series of calibration coefficients over a short period of time that is long enough to capture environment variability such as tidal fluxes, and then a single calibration coefficient is averaged. Both single-point calibration methods – pre-deployment and in situ – appear to be suitable for fairly static environmental conditions, whereas the multi-point in situ calibration is best suited for dynamic nearshore environments (Bresnahan et al., 2014; Gonski et al., 2018).
Table 1Deployment regime of all four SeaFETs™ including deployment location, date, and calibration methods performed. *Non-controlled source water pumped directly from Resurrection Bay, AK, USA.
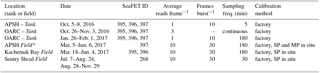
Factory: factory calibration; SP: in situ single-point calibration; MP: in situ multi-point calibration.
2.3 SeaFET™ conditioning: test tank deployments
A series of three separate test tank deployments for three SeaFETs™ were conducted in order to determine the conditioning period for each sensor. Initial sensor deployments took place in October 2016 at the Alutiiq Pride Shellfish Hatchery (APSH) in Seward, Alaska. Sensors were deployed for a duration of 72 h in a flow-through 60 L tank where seawater taken from a depth of ∼75 m in Resurrection Bay was sand-filtered, UV treated, and finally run through a 5 µm mesh. All three sensors were programmed with identical sampling settings (Table 1). The onboard internal thermistor was used to calculate temperature, and measurements of seawater salinity incoming to the hatchery were collected by a Sea-Bird Scientific SBE 45 MicroTSG thermosalinograph that is paired with the BoL and are available on the Alaska Ocean Observing System (http://portal.aoos.org/real-time-sensors.php#map, 30 July 2018). Factory calibration coefficients for the internal (k0i, k2i) and external (k0e, k2e) electrodes were retained when processing raw voltage data.
A second tank deployment for the same three sensors were deployed at the University of Alaska, Fairbanks, in the Ocean Acidification Research Center (OARC). Seawater collected from the APSH was delivered to the OARC test tank, ∼370 L in a half-filled tank. Seawater in the tank was circulated continuously and covered to aid in the prevention of evaporation and photosynthesis. A co-deployed Sea-Bird SBE 16plusV2 SeaCAT (recently serviced by Sea-Bird) collected temperature and salinity readings every 5 min. Sensors were deployed for a duration of 9 days in continuous operation mode which forgoes the ability to set frames per burst; average number of reads was identical between all sensors (Table 1). From 1 to 4 November 2016, duplicate discrete bottle samples were collected in 250 mL glass bottles with screw caps at ∼00:00 and 17:00 UTC per day. Bottle samples were preserved with 20 µL of saturated HgCl2 and processed at a later date for TCO2 and TA with a VINDTA 3C (Versatile INstrument for the Determination of Total inorganic carbon and titration Alkalinity). The VINDTA 3C has an uncertainty typically near 0.05 % (Mathis et al., 2014, 2015a). Bottle sample pHt was calculated using CO2SYS with known TCO2 and TA using the constants provided by Uppström (1974) and Lueker et al. (2000); derived pHt was then compared against sensor pHt to test the accuracy of both internal and external electrodes, assuming the discrete bottle samples were the “true pH” of the seawater. Upon recovery, all sensors were placed into polled mode and stored with wet caps filled with tris buffer (salinity 34, pH 8.09 at room temperature, 25 ∘C). Again, the factory calibration coefficients for the internal and external electrodes were retained when raw voltage was processed. Since the SBE 16plusV2 sampled every 5 min, salinity and temperature measured by the SBE at each 5 min point was repeated for the following 4 min in order to calculate continuous minute readings by sensors.
A final test tank deployment of sensors at OARC was conducted after an assumed adequate conditioning period of 9 days (first OARC deployment). All three sensors had been set to polled mode after the end of the previous deployment and, therefore, were sleeping for 83 days until this final 7-day deployment. The sampling settings were identical to the first OARC deployment for all three sensors (Table 1). Similar to the previous OARC tank deployment, a co-deployed Sea-Bird SBE 16plusV2 SeaCAT collected temperature and salinity mirroring the sensor sampling interval of 3 h.
The internal thermistor of each sensor was tested for accuracy by comparing its derived in situ temperature to that collected by the Sea-Bird SBE 16plusV2 during the test tank deployments. The temperature difference between the internal thermistor and the SBE 16plusV2 was used to calculate the average and maximum discrepancy between the two temperature readings. The temperature discrepancy was then applied to a combination of TA: TCO2 ratios over a range of salinity (20–35) in CO2SYS (constants: Uppström, 1974; Lueker et al., 2000), which produced two different pHt values. The difference between these two pHt values were, therefore, concluded to be a result of the temperature discrepancy.
2.4 SeaFET™ performance: field deployments
In late boreal winter 2017 – 32 days post final tank deployment – SeaFET™397 was deployed at the APSH and the two remaining sensors (SeaFET™395, 396) in Kasitsna Bay within the greater Kachemak Bay, Alaska (Fig. 1). At the APSH (60∘5′55.59 N, 149∘26′39.80 W), incoming seawater from Resurrection Bay at a depth of 75 m is split before running through a series of hatchery water filters so that an unfiltered line is run directly to the BoL. The incoming line to the BoL was then split to feed an ∼11.5 L conical tank housing sensor_397 fit with the copper bio-fouling guard; tank residence time was ∼7.5 min. The sensor_397 at this location was deployed on 6 March 2017 with a robust sampling setting (Table 1). Two calibration methods were applied to this sensor_397, an in situ single-point calibration and an in situ multi-point calibration. Both calibrations were performed 50 days after deployment on 25 April 2017 once the BoL had completed service maintenance. The single-point in situ calibration was taken during the midday tide transition in Resurrection Bay, while the multi-point in situ approach used five (sensor sampling 3 h intervals) time points spanning an entire tidal cycle. The single-point in situ calibration was used to derive k0i for the internal electrode (Eq. 1) and k0e for the external electrode (Eq. 2). The multi-point in situ calibration followed the same formulations with the difference being the final calibration coefficient calculated was the average of the five independently calculated calibration coefficients. Three final pHt values for the sensor_397, therefore, were calculated based upon the different calibration coefficients (factory, single-point, and multi-point in situ calibration) and compared against the pHt determined from continuous pCO2 measurements by the BoL and derived TA (TA-S equation, Evans et al., 2015) using CO2SYS with constants provided by Uppström (1974) and Lueker et al. (2000). pHt uncertainty from the BoL using this combination of measured and derived parameters is 0.007 units based on propagating the error of the BoL pCO2 uncertainty reported above with the RMSE (17 µmol kg−1) of the regional TA–S relationship (Orr et al., 2018).
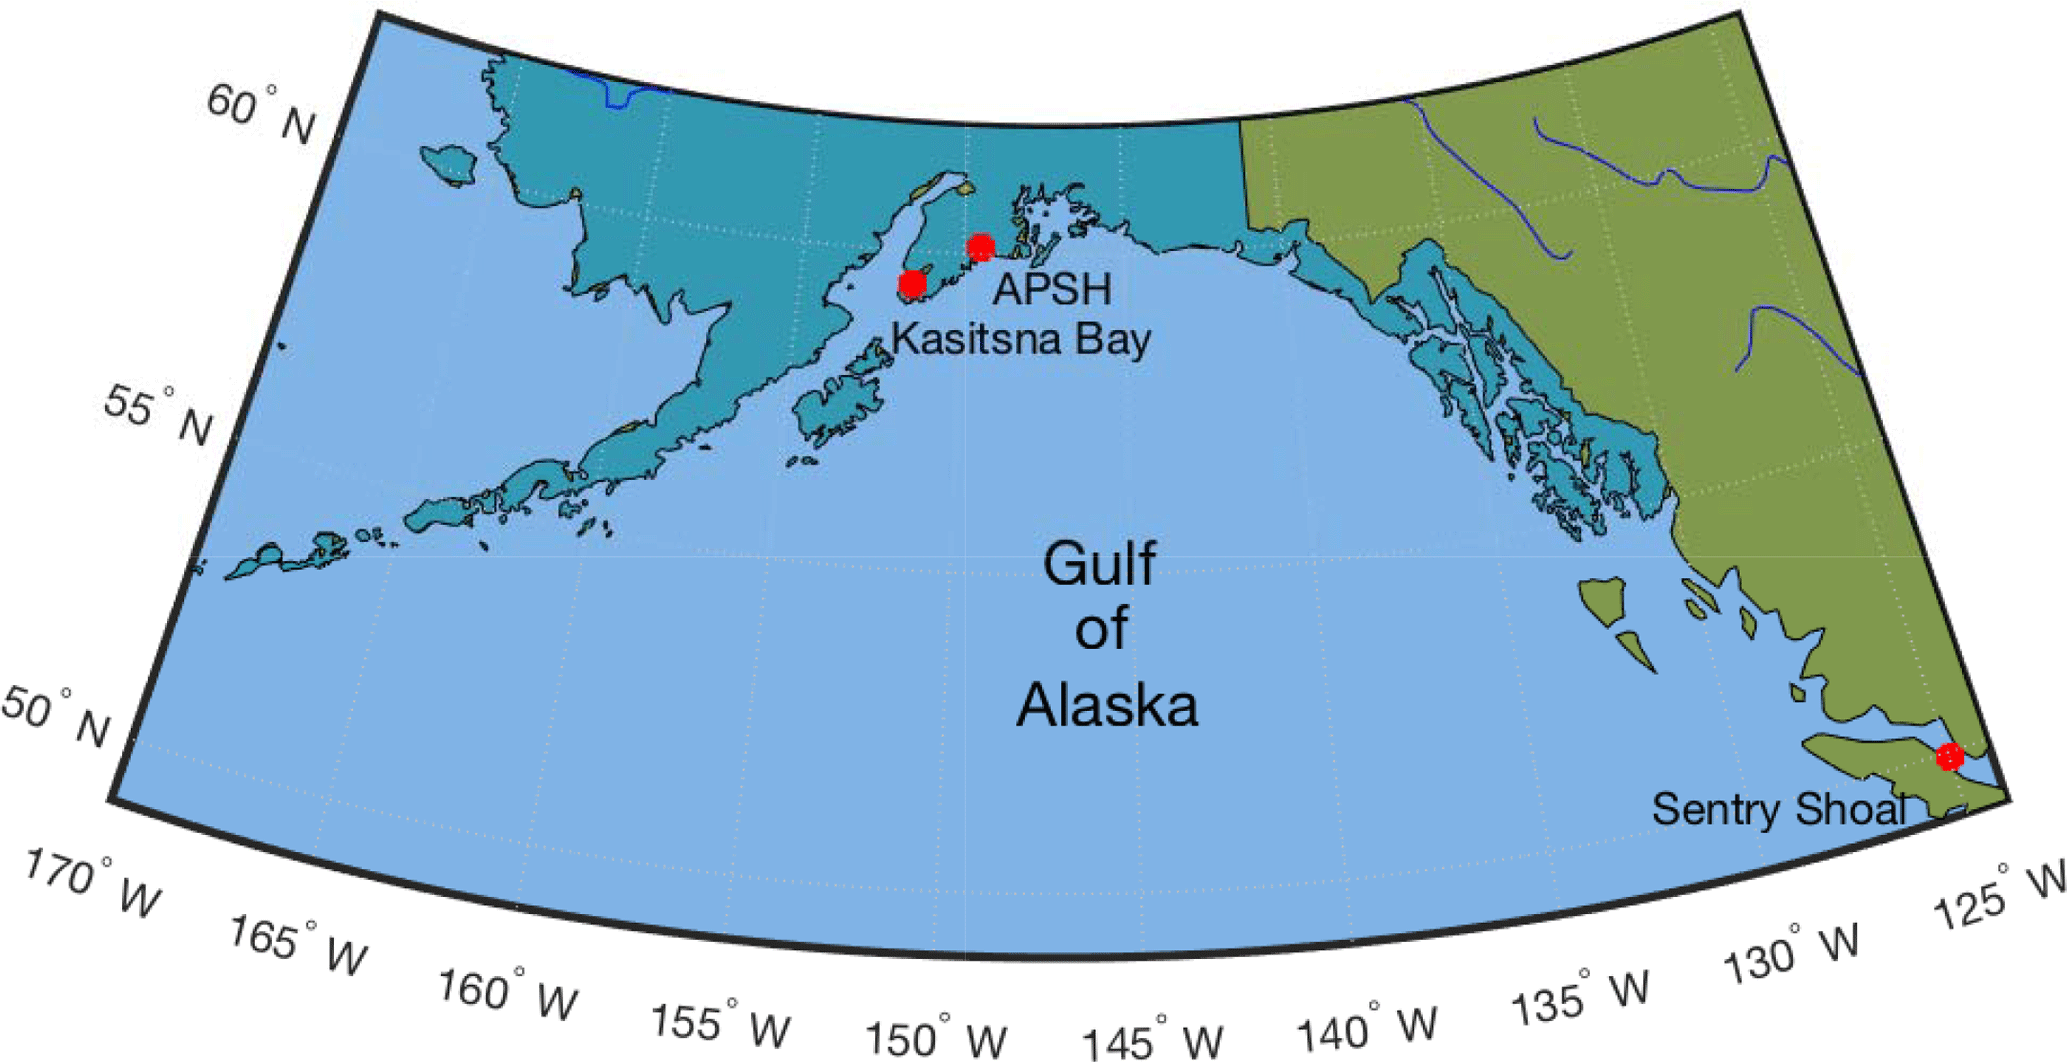
Figure 1Geographical map with locations of SeaFET™ field deployments along Alaska's, USA, south-central coast in Kasitsna Bay and at the Alutiiq Pride Shellfish Hatchery (APSH), and one location at Sentry Shoal in the Strait of Georgia, British Columbia, Canada.
Inter-sensor variability was examined between two SeaFETs™395, 396 deployed off the pier at the Kasitsna Bay laboratory in Kachemak Bay (59∘28′6.71 N, 151∘33′11.12 W) ∼1.5 m from the bottom: depth at this location fluctuates between ∼7.5 and 16.8 m (Fig. 1). On 18 March 2017 – 44 days post final tank deployment – the sensors_395, 396 were attached to the pier piling directly beside one another on a single mooring frame. Both sensors were wrapped with pipe tape to minimize biofouling and fitted with their respective copper biofouling guards which had a tributyltin plug attached to the inside of the guard. The sampling settings for both sensors_395, 396 were identical to the one at the APSH (Table 1). Five discrete reference samples were taken in duplicate: one sample on day of deployment (18 March 2017, 18:00 UTC), two samples 1-day post-deployment (19 March 2017, 03:00 and 15:00 UTC), and two samples 2- and 1-day pre-recovery of the sensors_395, 396 (3 June 2017, 03:00; 6 June 2017, 03:00 UTC). Reference samples were collected within 30 s of the instrument sampling time period via a diver's hand Niskin, measured for temperature and salinity with a YSI 3100 conductivity instrument, stored in 250 mL glass bottles with screw caps, poisoned with 100 µL of saturated HgCl2, and secured with Teflon tape around the bottleneck threading and Parafilm wrapped on the outside of the cap. Calibration samples were processed for TCO2 and TA with a VINDTA 3C and pHt calculated using CO2SYS with the constants provided by Uppström (1974) and Lueker et al. (2000). Salinity measurements collected by the Kachemak Bay National Estuarine Research Reserve data sonde, 10 km SE of the deployed sensors (59∘26′26.87 N, 151∘43′15.21 W), were used along with the sensor's internal thermistor readings to calculate pHt from the raw voltage data in order to capture representative environmental conditions providing relevance for the pHt time series in this location. A static salinity of 32 was also used for all calculations of pHt as an assessment of variability due to salinity measured from a data sonde 10 km away. A total of four different pHt values for both sensors_395, 396 were calculated based on calibration method (factory pre-deployment single-point calibration and the in situ single-point) and conditioning: either conditioned or non-conditioned to the environment. All calculated pHt values from the sensors_395, 396 were then compared against the remaining discrete reference bottle samples not used for calibration. This was done in order to examine the accuracy and inter-sensor variability difference between conditioned and non-conditioned to the environment electrodes. Because the Kachemak Bay data sonde was located 10 km from the deployed sensors_395, 396, the measured temperature and salinity from the discrete reference samples were used to determine pHt for the internal and external electrodes at those specific time points. That is, sensor accuracy for these two sensors_395, 396 was only assessed with accurate temperature and salinity values determined from the discrete bottle samples.
A fourth SeaFET™268 operated by the Hakai Institute was deployed on Environment Canada's Sentry Shoal weather buoy in the Northern Strait of Georgia, BC, Canada: 49∘54′24.00 N, 124∘59′5.99 W (Fig. 1). The Sentry Shoal mooring site is in a water depth of 15 m and the sensor_268 was affixed at a depth of 1 m. A pre-deployment bucket test was conducted for 24 h at a sampling interval of 30 min with an average of 10 samples per frame and 30 frames per burst from 28–29 June 2016. Sensor_268 was outfitted with a copper housing guard and wrapped with copper tape. Sensor_268 underwent two separate deployments, an initial deployment, and a redeployment (6 July and 27 August 2016) that occurred after the sensor was retrieved for cleaning and maintenance. Two separate calibration samples (taken in triplicate) were taken in accordance with each deployment, and occurred 13 and 7 days after each deployment (19 July and 2 September 2016). For each deployment, sensor_268 settings were similar to the others at the APSH and in Kasitsna Bay (Table 1). All calibration samples were taken in triplicate at a depth of 1 m via CTD and Niskin bottle castings and collected in 350 mL amber glass bottles with polyurethane-lined crimp-sealed metal caps and poisoned with 200 µL of saturated HgCl2, and then processed for TCO2 and pCO2 with a BoL at the Hakai Institute's Quadra Island Field Station. The measured values were used to derive pHt using CO2SYS with the constants provided by Uppström (1974) and Lueker et al. (2000) in order to perform a single-point in situ calibration. Uncertainty in pH determinations from BoL pCO2 and TCO2 measurements was 0.006 units. After sensor_268 deployment and calibration, a total of three, triplicate, reference sample sets were taken and processed for pHt following the procedure used for calibration samples, then compared against sensor pHt.
2.5 Quantifying pHt and intrinsic sensor uncertainties
Calculating pHt from the SeaFET's™ raw voltage reading is dependent on temperature, salinity and an ideal 100 % Nernstian response. The software application SeaFETcom permits the operator to automatically calculate pHt by assigning the calibration coefficient either written to the sensor's header file or the one provided on the CD-ROM (these should be identical). Determination of final pHt values from the first test tank deployment at the APSH were calculated by two different operators and two sources for the factory pre-deployment single-point calibration coefficients: header file and CD-ROM disc file. Aside from that exception, all other final pHt values for the internal and external electrodes were calculated with the Mathworks software MATLAB (V. 2016a) and Microsoft Excel (v. 2016) using the following equations for the internal electrode:
and the external electrode
where Vint|ext is the voltage from the electrode and k2i|e is the temperature coefficient (dE∗ ∕ dT) applied to all SeaFETs™ (Martz et al., 2010). Again, for detailed definitions of Snernst and the salinity dependent constants γHCl (HCl activity coefficient), ClT (total chloride), ST (total sulfate), and the dissociation constant Ks (Khoo et al., 1977; Dickson et al., 2007) in Eqs. (3) and (4), we refer readers to Martz et al. (2010), Bresnahan et al. (2014), and Sea-Bird Scientific SeaFET™ Product Manual 2.0.0 or most recent edition.
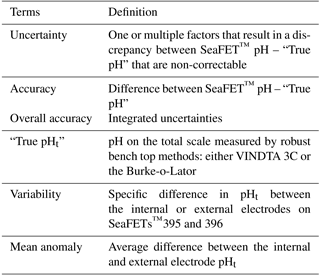
Table 2Terms and definitions used to describe the evaluation of the Sea-Bird SeaFET™ based on observations specific to this study.
2.5.1 Sensor uncertainty
The overall accuracy of every SeaFET™ sensor was evaluated by quantifying all sources of potential uncertainty when calculating a final pHt from the sensor (Table 2). The pHt uncertainty introduced by calibration method was calculated as the absolute difference between the “true pHt” and the final sensor pHt derived from either factory calibration, the single-point in situ calibration, or multi-point in situ calibration. The “true pHt” was calculated using CO2SYS dissociation constants by Lueker et al. (2000) and Uppström (1974) with measured TCO2 and TA via the VINDTA 3C, TCO2 and pCO2 measured by the BoL for discrete samples (e.g., sensor_268), and pCO2 and TA (TA-S equation, Evans et al., 2015) for continuous samples (sensor_397). A one-way analysis of variance (ANOVA) and the root mean square error (RMSE) were run and calculated in order to compare the pHt values from both electrodes on sensor_397 across calibration methods against the pHt values from the BoL. The BoL at the APSH sampled every 5 min which produced 256 comparable sample points with a time alignment disparity that ranged from 0 to 120 s against sensor_397. The potential pHt uncertainty based on the thermistor was calculated by using the absolute difference between the thermistor-derived temperature and that measured by the SBE 16plusV2 (Tdiff) from the OARC test tank deployments and the Kasitsna Bay sensors_395, 396 against the Seldovia data sonde 10 km away. Finally, an average inter-sensor variability uncertainty term was calculated as the difference between the two sensors_395, 396 deployed side-by-side in Kasitsna Bay after a single-point in situ calibration was performed. All uncertainty terms were calculated and collated based on our evaluations from the Alaska deployed sensors, while sensor_268 deployed at Sentry Shoal was only included when determining the accuracy uncertainty term. Due to the disparity between reference samples for the Kasitsna Bay sensors_395, 396 and the Sentry Shoal sensor_268 (two discrete reference samples) to that of sensor_397 at the APSH (256 reference samples), only the average calculated difference (SeaFET™ pHt – “true pHt”) for each calibration method and electrode was used from the APSH sensor_397 and then collated with the other reference points from the Kasitsna Bay and Sentry Shoal sensors.
2.5.2 pHt time series analysis
Final time series analysis was examined in the time and frequency domain using the Mathworks software MATLAB (V. 2016a). Power spectral density was determined via Welch's method using the pwelch function in MATLAB. Time series data were resampled and linearly interpolated in order to compensate for the missing data points that occurred when sensors arbitrarily stopped sampling.
3.1 Test tank and field conditions
Finalized (i.e., calibrated) pHt values from the first test tank deployment produced two different values, of which each was dependent on whether the calibration coefficient from the header file or the disc file was selected, the result was a difference of ∼0.0011 units for both the internal and external electrodes. Because sensors were stored in tris buffer that lacked the addition of bromide between tank deployments and before field deployments, an environmental conditioning period was required for each of the Alaska sensors once submerged in their respective field sites. Thus, any determination of SeaFET™ pHt accuracy and conditioning period from tank deployments were inconclusive and will not be considered henceforth. No sensors displayed signs of biofouling or low battery power upon recovery.
Sensor_397 deployed in parallel with the BoL at the APSH experienced a tank failure on 8 April 2017 resulting in the sensor's emergence for 24 h. In addition, missing temperature and salinity values resulted in gaps of pHt measurements over the entire deployment. The BoL experienced flow control issues when initial deployment occurred on 6 March 2017 and was not online until 18 April 2017 but, then, operated nearly consistently until 24 May 2017. All pHt and temperature comparisons were, therefore, made beginning on 18 April 2017.
Due to the in situ environmental conditioning period of the Kasitsna Bay sensors_395, 396, calibration was performed using the initial reference sample collected on 18 March 2017, 03:00 UTC and again with the reference sample collected on 3 June 2017, 03:00 UTC. Due to high variance between duplicate reference samples (SD: 0.08 pHt) on 19 March 2017, 15:00 UTC, this reference was discarded and not used for comparison or calibration. The Sentry Shoal sensor_268 underwent one maintenance and cleaning procedure, including a battery change, during the ∼5-month deployment (Table 1). One calibration sample (19 July 2016) and one reference sample (9 November 2016) were averaged from duplicate rather than triplicate replicates due to large variance from one of the replicate samples. The reference sample taken on 23 August 2016, 17:00 UTC was discarded as temperature and salinity data were missing and sensor_268 pHt could not be calculated. The final reference sample (9 November 2016, 17:05 UTC) was taken 5 min after sensor_268 sampled on 9 November 2016, 17:00 UTC.
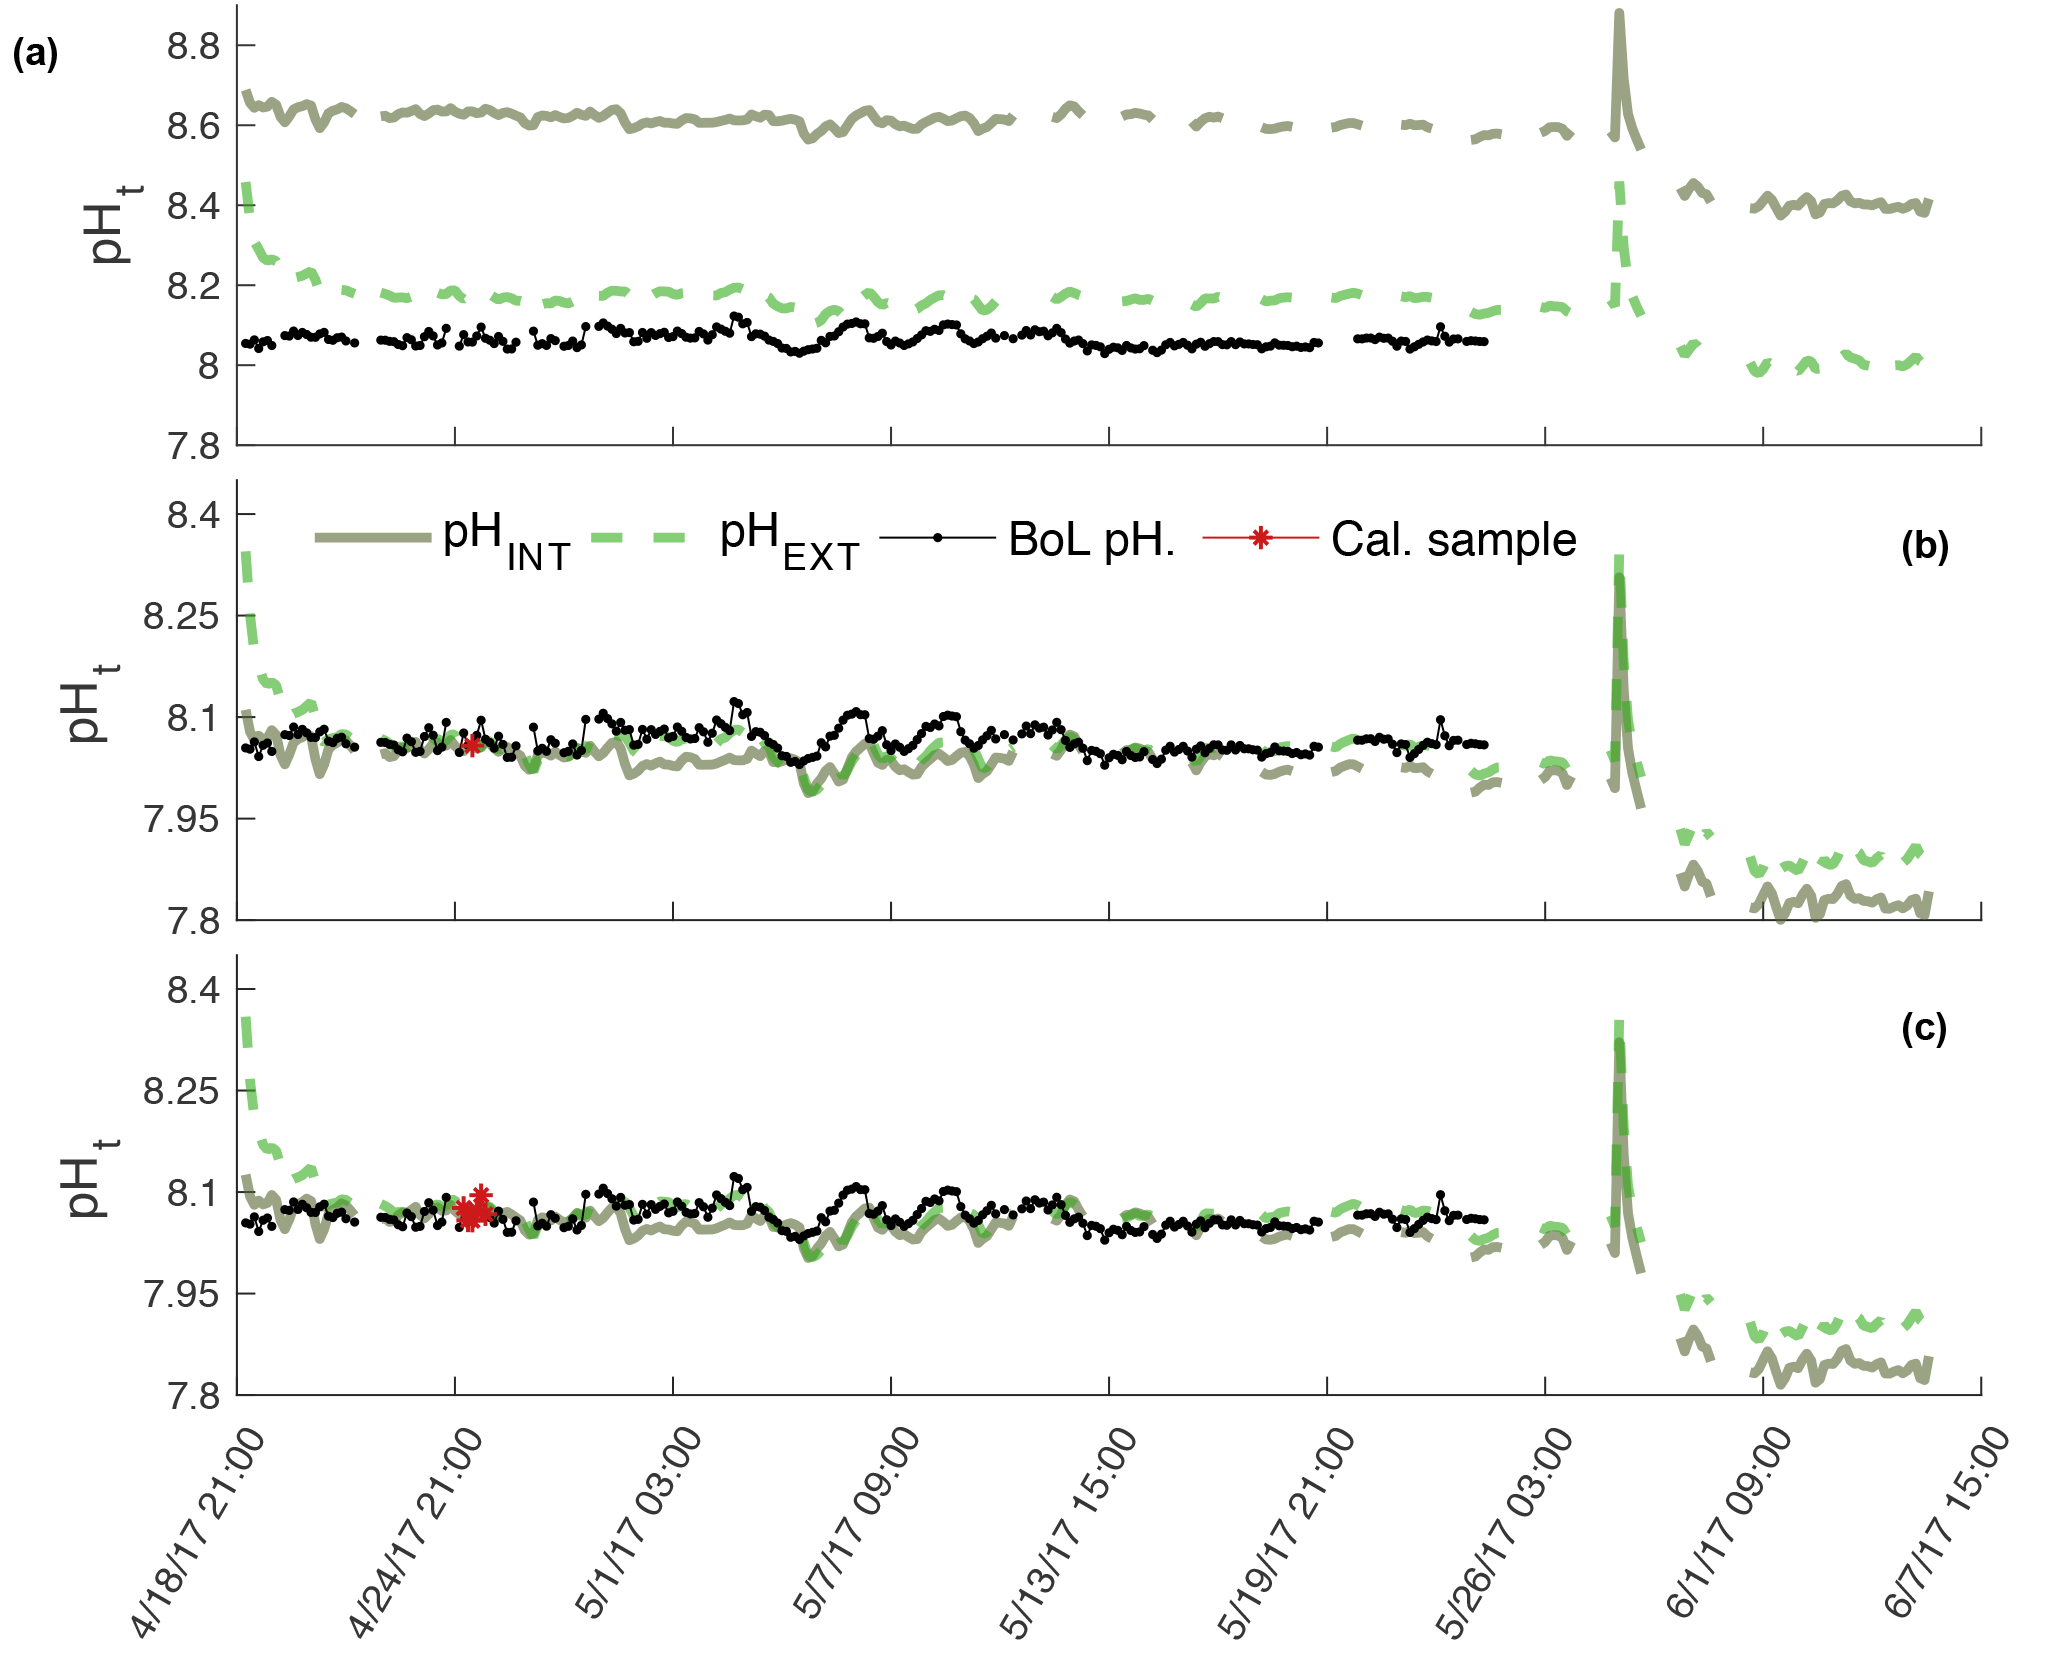
Figure 2pHt recorded by the internal (solid) and external (dashed) electrodes on SeaFET™397 deployed in parallel with the BoL at the Alutiiq Pride Shellfish Hatchery. pHt from both electrodes is shown when derived using factory calibration (FC) coefficients (a), in situ single-point (SC) calibration coefficients (b), and in situ multi-point (MC) calibration coefficients (c). Black solid line is pHt derived from continuous pCO2 measurements recorded by the BoL and derived TA from the TA–S relationship (Evans et al., 2015). Red circles are the calibration points from the BoL data.
3.2 Thermistor response: test tank deployment
The internal thermistor amongst the sensors had a difference of less than 0.2 ∘C over the entirety of the second and third tank deployments. All thermistor-derived temperature values had good alignment with the SBE 16plusV2 temperature, and consistently recorded a slightly higher temperature. The discrepancy between the thermistor temperature and SBE16plusV2 was minimal, and reached a maximum of 0.378 (logged by sensor_395) during any time over all tank deployments. The average discrepancy, however, was ∼0.21 ∘C when averaging across all sensors and all times – resulting in a 0.003 pH uncertainty.
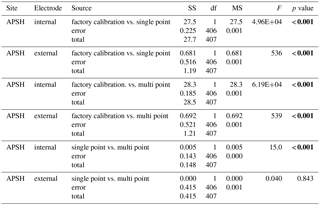
Table 3One-way Analysis of variance comparing the pHt error (SeaFET™ pHt−BoL pHt) across calibration methods for both the internal and external electrodes onboard SeaFETs™268 at Sentry Shoal (factory calibration and in situ single-point calibration) and SeaFET™397 at the Alutiiq Pride Shellfish Hatchery (factory calibration, in situ single-point calibration, and in situ multi-point calibration). Bold type denotes statistical significance.
3.3 Field performance
Sensor_397 deployed alongside the BoL appeared stable throughout its entire deployment and tracked the pHt derived from the BoL well (Fig. 2). Errant spikes were present from both electrodes throughout periods before 18 April 2017, which were a result of plumbing changes that occurred to the APSH incoming seawater. On 10 April 2017 the internal thermistor, BoL temperature, and BoL salinity fluctuated by 3 ∘C and 14, respectively, over a 12 h period. These anomalies were removed from analysis. Salinity remained relatively stable throughout the rest of the deployment and ranged from 30.0 to 32.1. The pHt uncertainty decreased, and the accuracy of the sensor's_397 internal electrode improved once the in situ single-point and multi-point calibrations were performed with a RMSE decreasing from 0.5455 pHt units under factory calibration, 0.0361 pHt units for in situ single-point calibration and 0.0273 pHt units for the in situ multi-point calibration. The external electrode also improved accuracy with in situ single-point and multi-point calibrations with an RMSE of 0.1077 under factory calibration, 0.0390 for in situ single-point calibration, and 0.0388 for the in situ multi-point calibration (Fig. 2). There was a significant difference in the reduction of the pHt uncertainty for both the internal and external electrodes when using in situ single-point and multi-point calibration coefficients compared to the factory calibration coefficients (Table 3). In addition, there was a significant decrease in the pHt uncertainty when using the in situ multi-point calibration coefficients rather than the in situ single-point method for the internal electrode, but not for the external electrode (Table 3). The pHt uncertainty in the internal electrode decreased from 0.0294 pH units with an in situ single-point calibration to 0.0224 units after an in situ multi-point calibration. It should be noted that the time alignment disparity which ranged from 0 to 120 s is not considered a significant source of discrepancy as only 4 sample points out of the 256 comparable points were >0.03 units (i.e., only 4 comparable points greater than the average pHt uncertainty found after calibration) between any one 5 min sample taken by the BoL. The internal thermistor of sensor_397 tracked the recorded BoL temperature trend fairly (Fig. 3), but had a greater magnitude discrepancy than its test tank deployment (∼0.21 ∘C). On average, the thermistor temperature had an absolute difference of 2.83 ∘C (SD 0.35) from 18 April to 6 June 2017, which would result in a pHt uncertainty of ∼0.044 units. Sensor_397 was not fully submerged in the conical tank leaving the top portion susceptible to air temperature fluctuations which could have affected the thermistor readings.
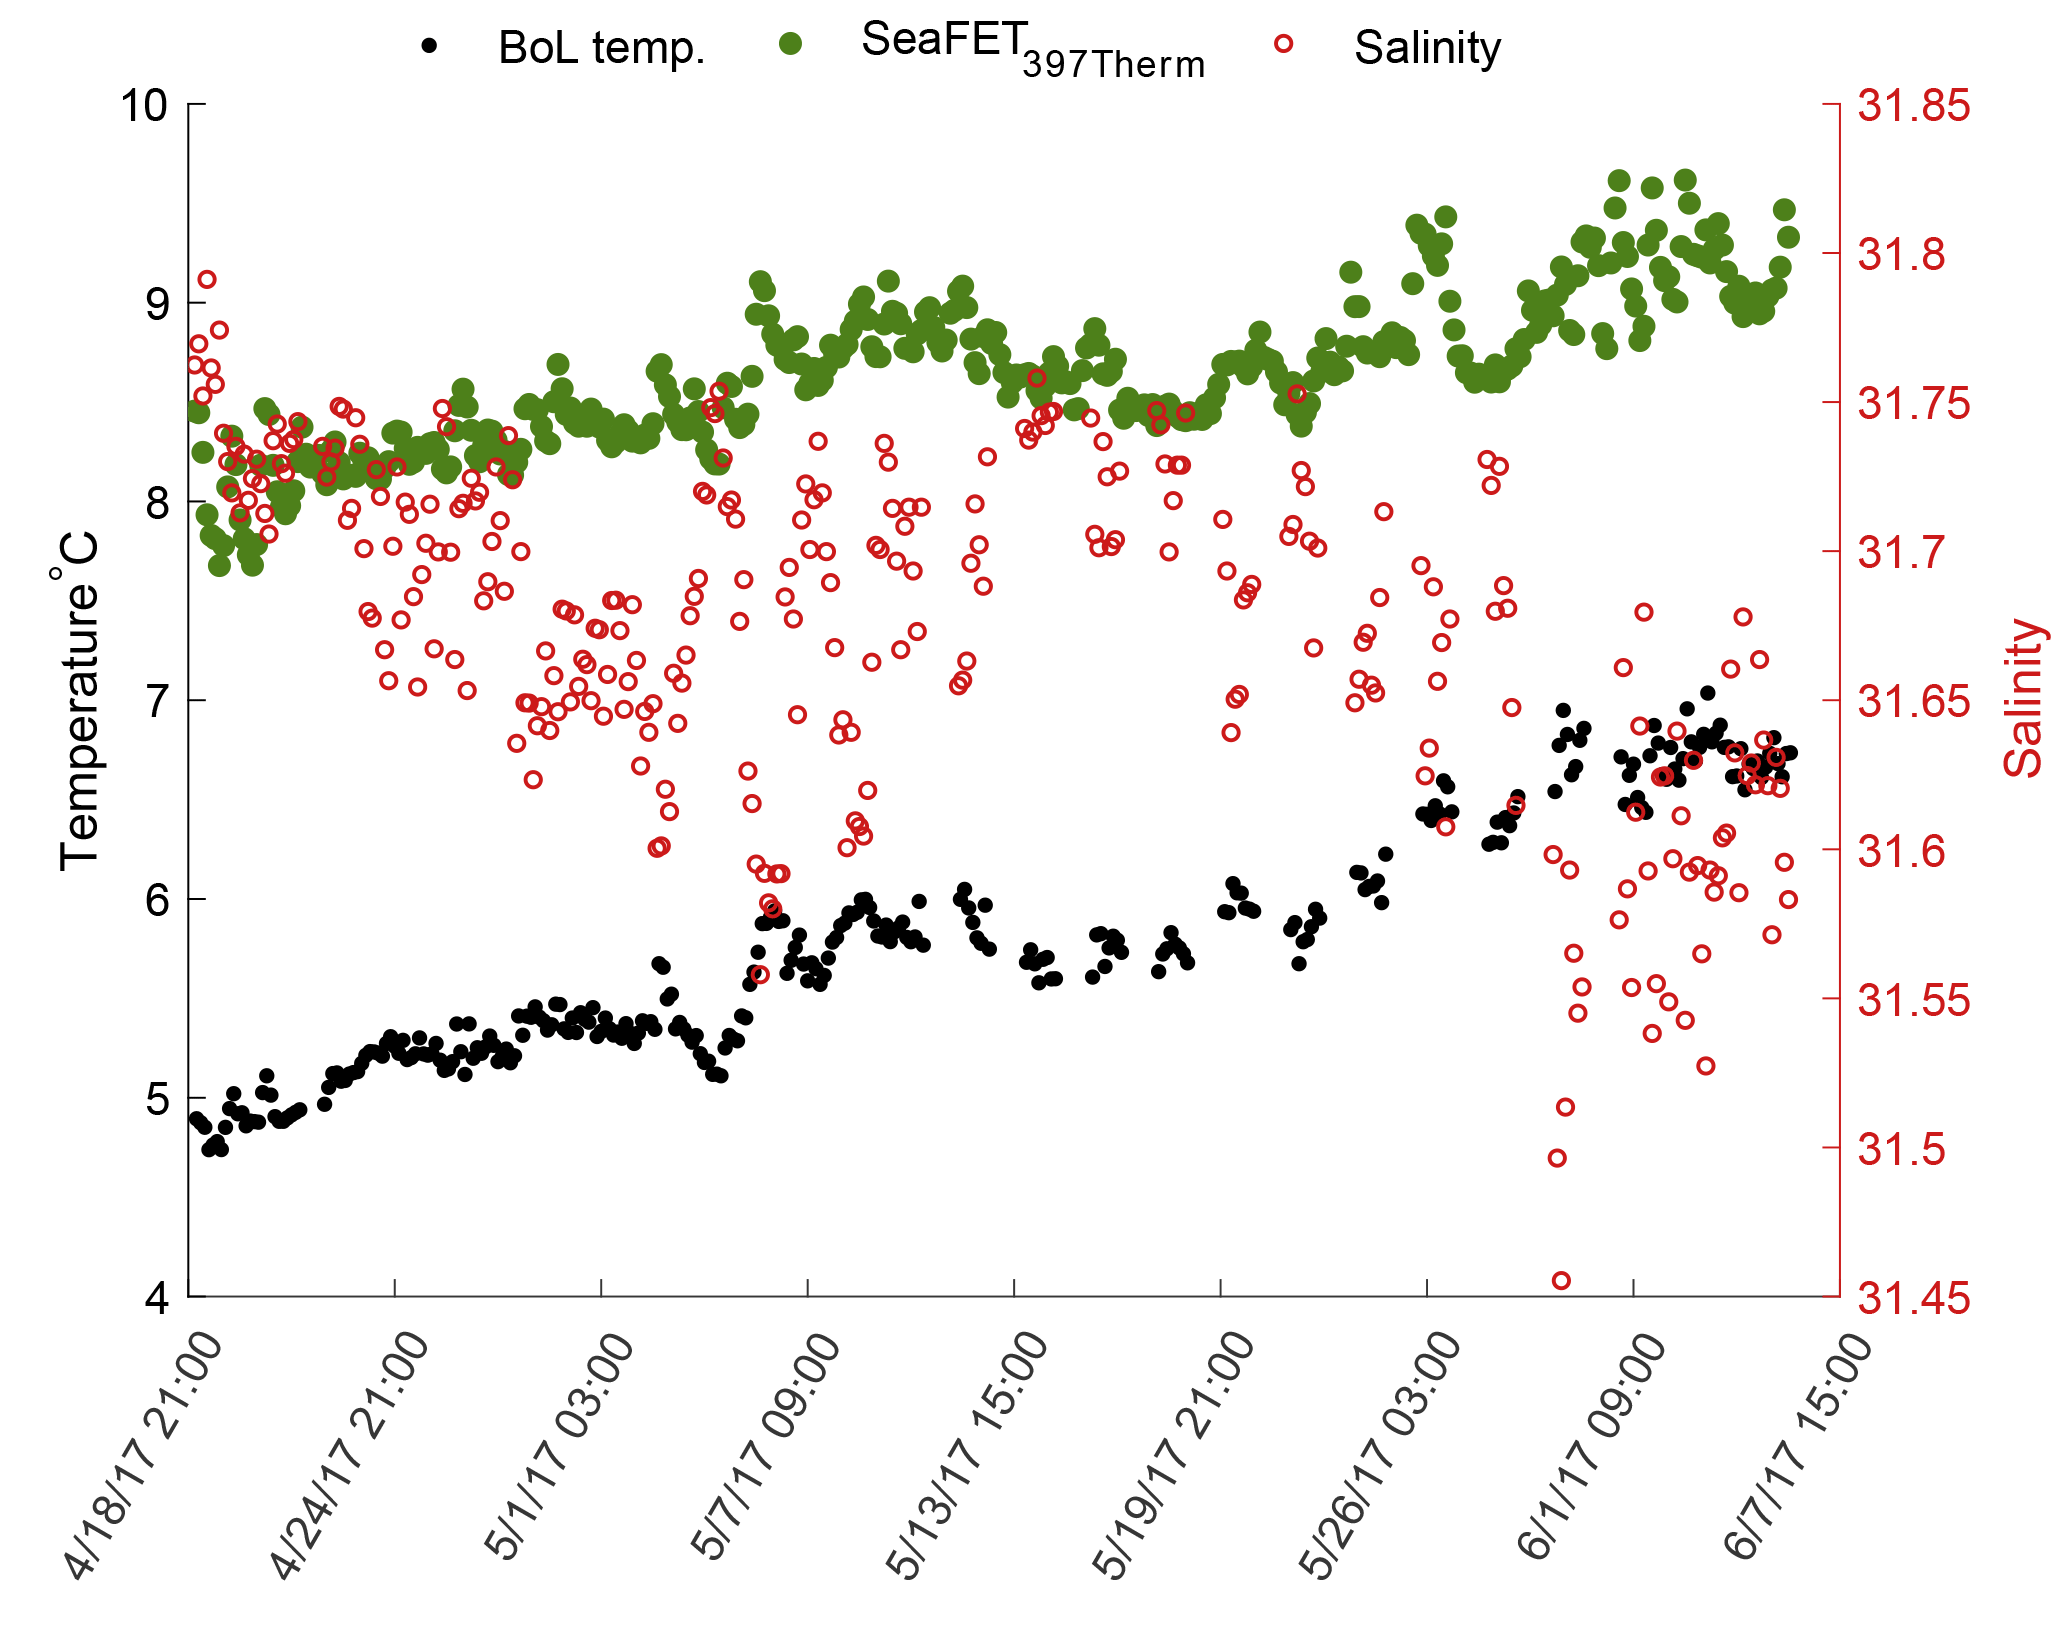
Figure 3Temperature derived from the internal thermistor on SeaFET™397 (green circles) and the temperature recorded by the BoL (black circles) at the Alutiiq Pride Shellfish Hatchery from late winter through spring 2017. Salinity (red circles) recorded by the BoL on the right y axis. SeaFET™397 was only partially submerged resulting in the top half of the sensor exposed to air temperature fluctuations.
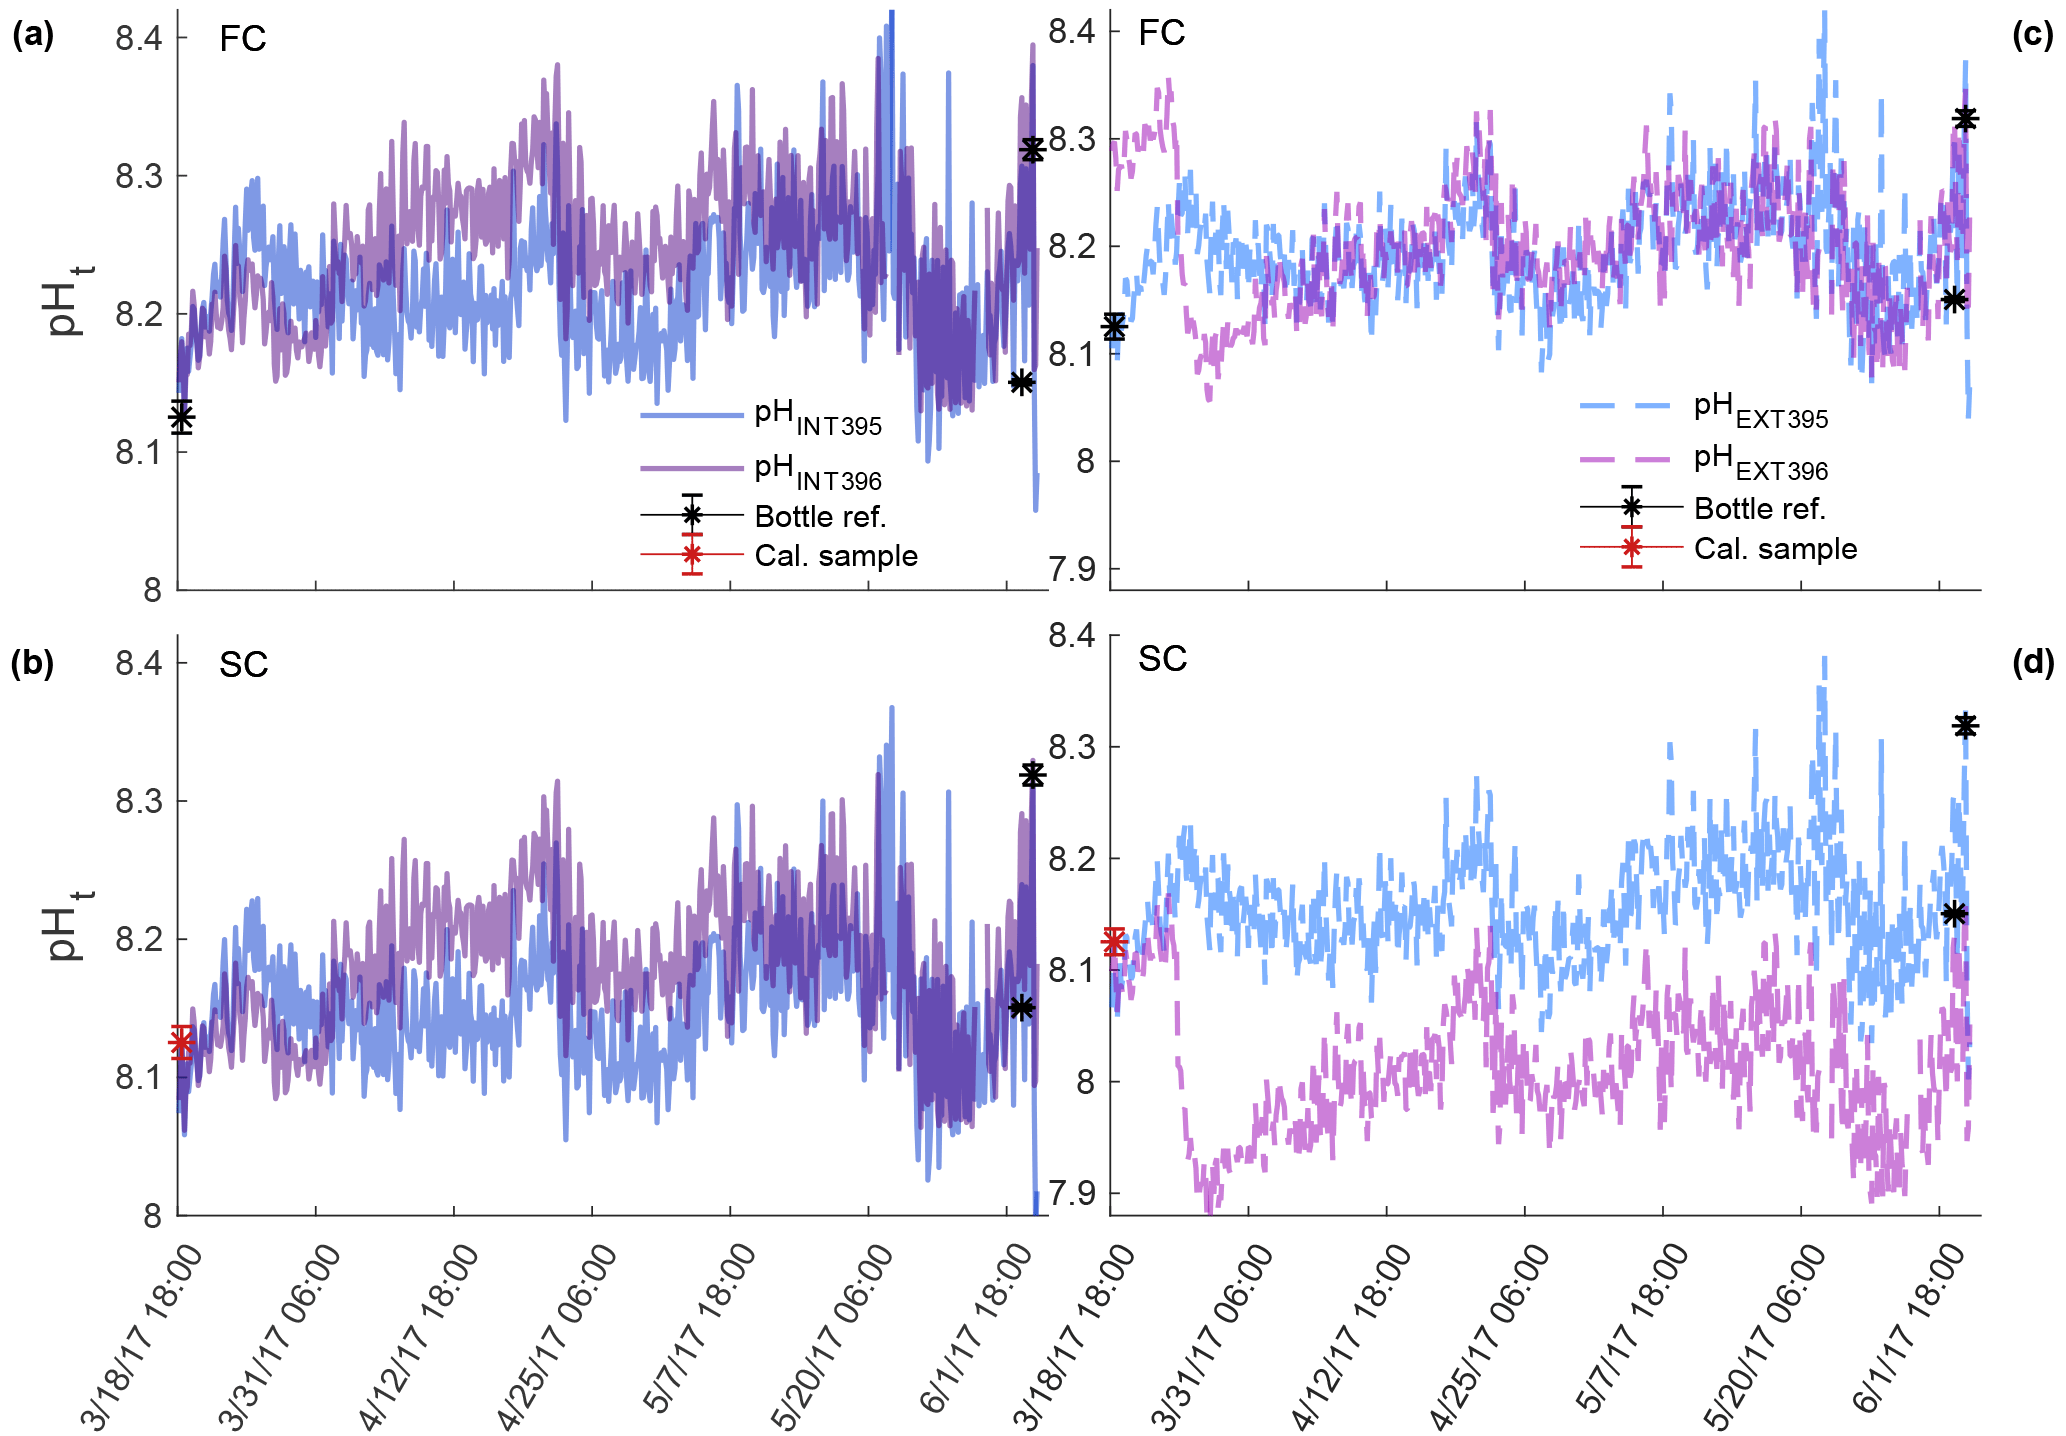
Figure 4Comparison of pHt recorded by the internal (a, b) and external (c, d) electrodes on SeaFET™395 (blue) and SeaFET™396 (purple) before they were conditioned to the environment (non-conditioned) deployed in Kasitsna Bay, AK, based on calibration method: factory calibration (FC) and in situ single-point (SC) calibration. Discrete reference samples (black asterisks) and calibration sample (red asterisks) were collected 36 and 12 h pre-SeaFET™ recovery, and <24 h post-deployment, respectively. Temperature and salinity measurements collected on reference and calibration samples were used to derive SeaFET™ pHt at those given time points. All other SeaFET™ pHt measurements use thermistor temperature and salinity logged by Kasitsna Bay data sonde.
The sensors_395, 396 in Kasitsna Bay improved their accuracy after an in situ single-point calibration was performed (Fig. 4); however, this was only the case when sensors were not conditioned as calibration performed after the conditioning period reduced accuracy (Fig. 5) when comparing against discrete reference samples. It should be noted that only the pHt recorded by both sensors_395, 396 at times of the reference samples had precise salinity and temperature (temperature and salinity recorded with reference sample rather than thermistor-derived temperature) measurements as all other measurements were calculated from salinity measured by the data sonde 10 km away, and with temperature derived from the onboard thermistor. The pHt recorded by the external electrode at a fixed salinity displayed little to no variance relative to pHt calculated with data sonde salinity (<0.02 pHt difference: average whether conditioned or non-conditioned to environment). The average pHt uncertainty from both sensors_395, 396 reduced by approximately half for the internal electrode when not conditioned to the environment after an in situ single-point calibration was performed (0.1072 and 0.1394 to 0.0475 and 0.0741 units, respectively), while the external electrode improved only minimally from 0.0988 and 0.0963 to 0.0610 and 0.0894 units, respectively (Fig. 4). When in situ single-point calibration was performed after the sensors_395, 396 were conditioned (i.e., calibrated with reference sample taken on 4 June 2017, 03:00 UTC), the pHt uncertainty for the internal electrode reduced only minimally from factory calibration: 0.1072 and 0.1394 to 0.0896 and 0.1240 units, respectively (Fig. 5a, b). Conversely, the pHt error for the external electrode increased from 0.0988 and 0.0963 to 0.1011 and 0.1480, respectively (Fig. 5c, d).
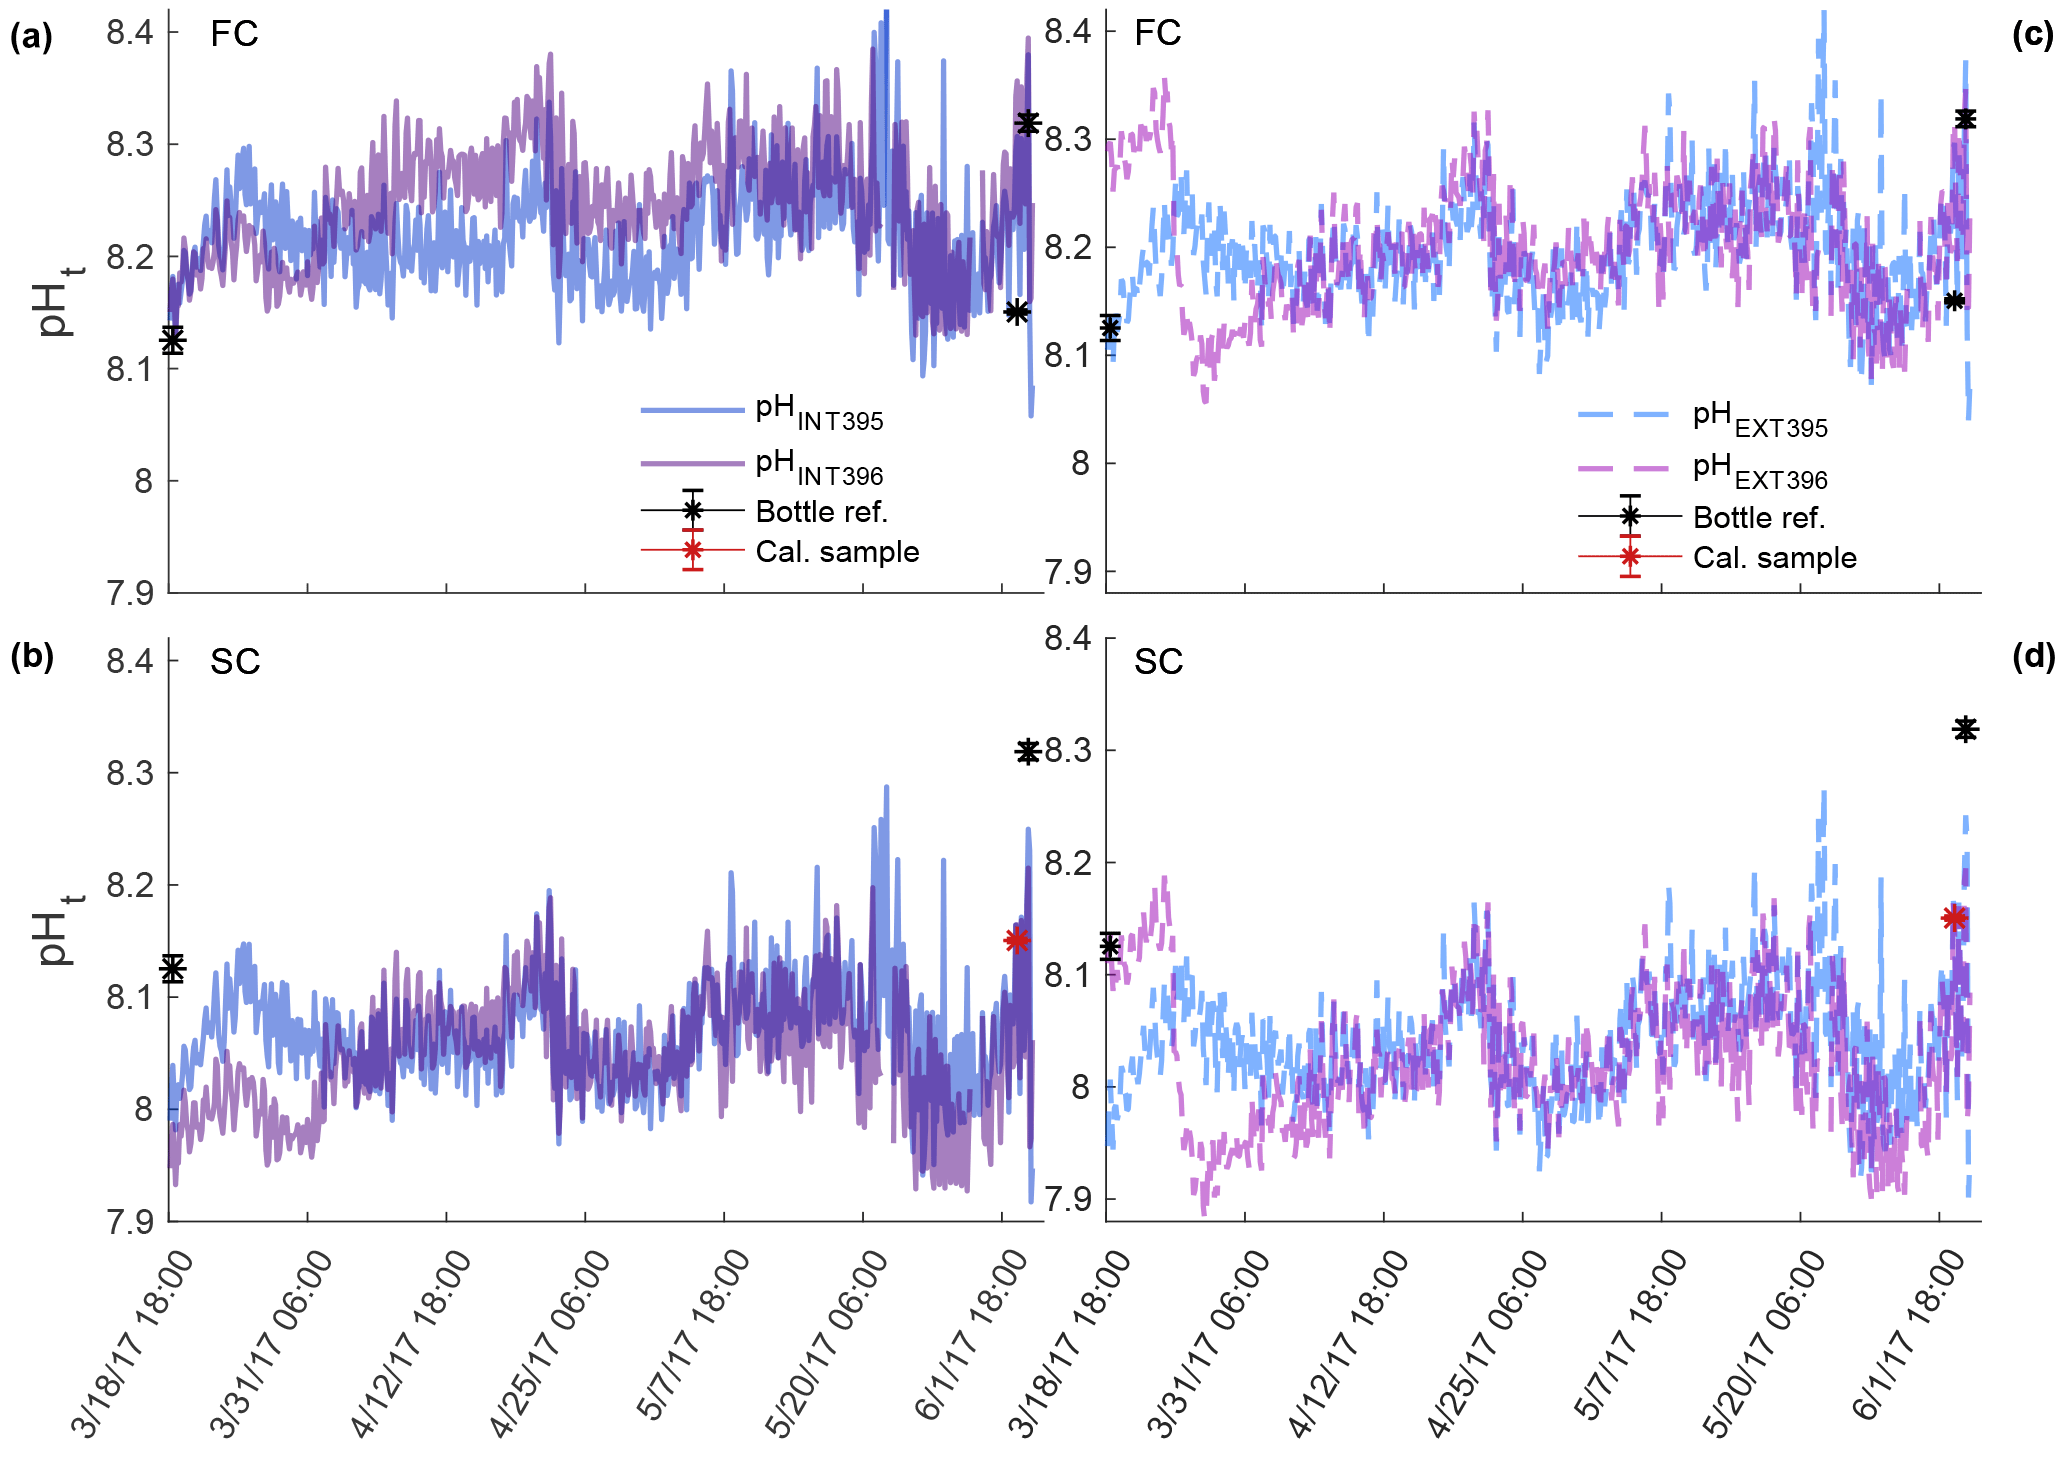
Figure 5Comparison of pHt recorded by the internal (a, b) and external (c, d) electrodes on conditioned SeaFET™395 (blue) and SeaFET™396 (purple) deployed in Kasitsna Bay, AK, based on calibration method: factory calibration (FC) and in situ single-point (SC) calibration. The data set here is the same as Fig. 4, but timing of calibration method is different. Discrete reference samples (black asterisks) and calibration sample (red asterisks) were collected <24 h post-deployment and 12 h pre-SeaFET™ recovery, while calibration sample was collected 36 h pre-SeaFET™ recovery. Temperature and salinity measurements collected on reference and calibration samples were used to derive SeaFET™ pHt at those given time points. All other SeaFET™ pHt measurements use thermistor temperature and salinity logged by Kasitsna Bay data sonde.
Both sensors_395, 396 displayed low inter-sensor variability for the internal electrode, and high for the external electrode after in situ single-point calibration was performed on sensors not conditioned to the environment (Fig. 6, gray circles). The mean anomaly between both sensor's_395, 396 internal electrodes was 0.0525 units, whereas the external mean anomaly was 0.145 units. When measurements taken before the sensor was conditioned to the environment (blue shaded region Fig. 6) were removed from analysis, the mean anomaly changed by <0.006 units for both electrodes. Inter-sensor variability for both electrodes once conditioned, and after in situ single-point calibration, was <0.05 units: 0.0409 and 0.0461 units for the internal and external electrodes, respectively (Fig. 6, black circles). When measurements recorded before the sensors were conditioned to the environment were removed (blue shaded region Fig. 10), the anomaly decreased further, <0.015 units for both electrodes.
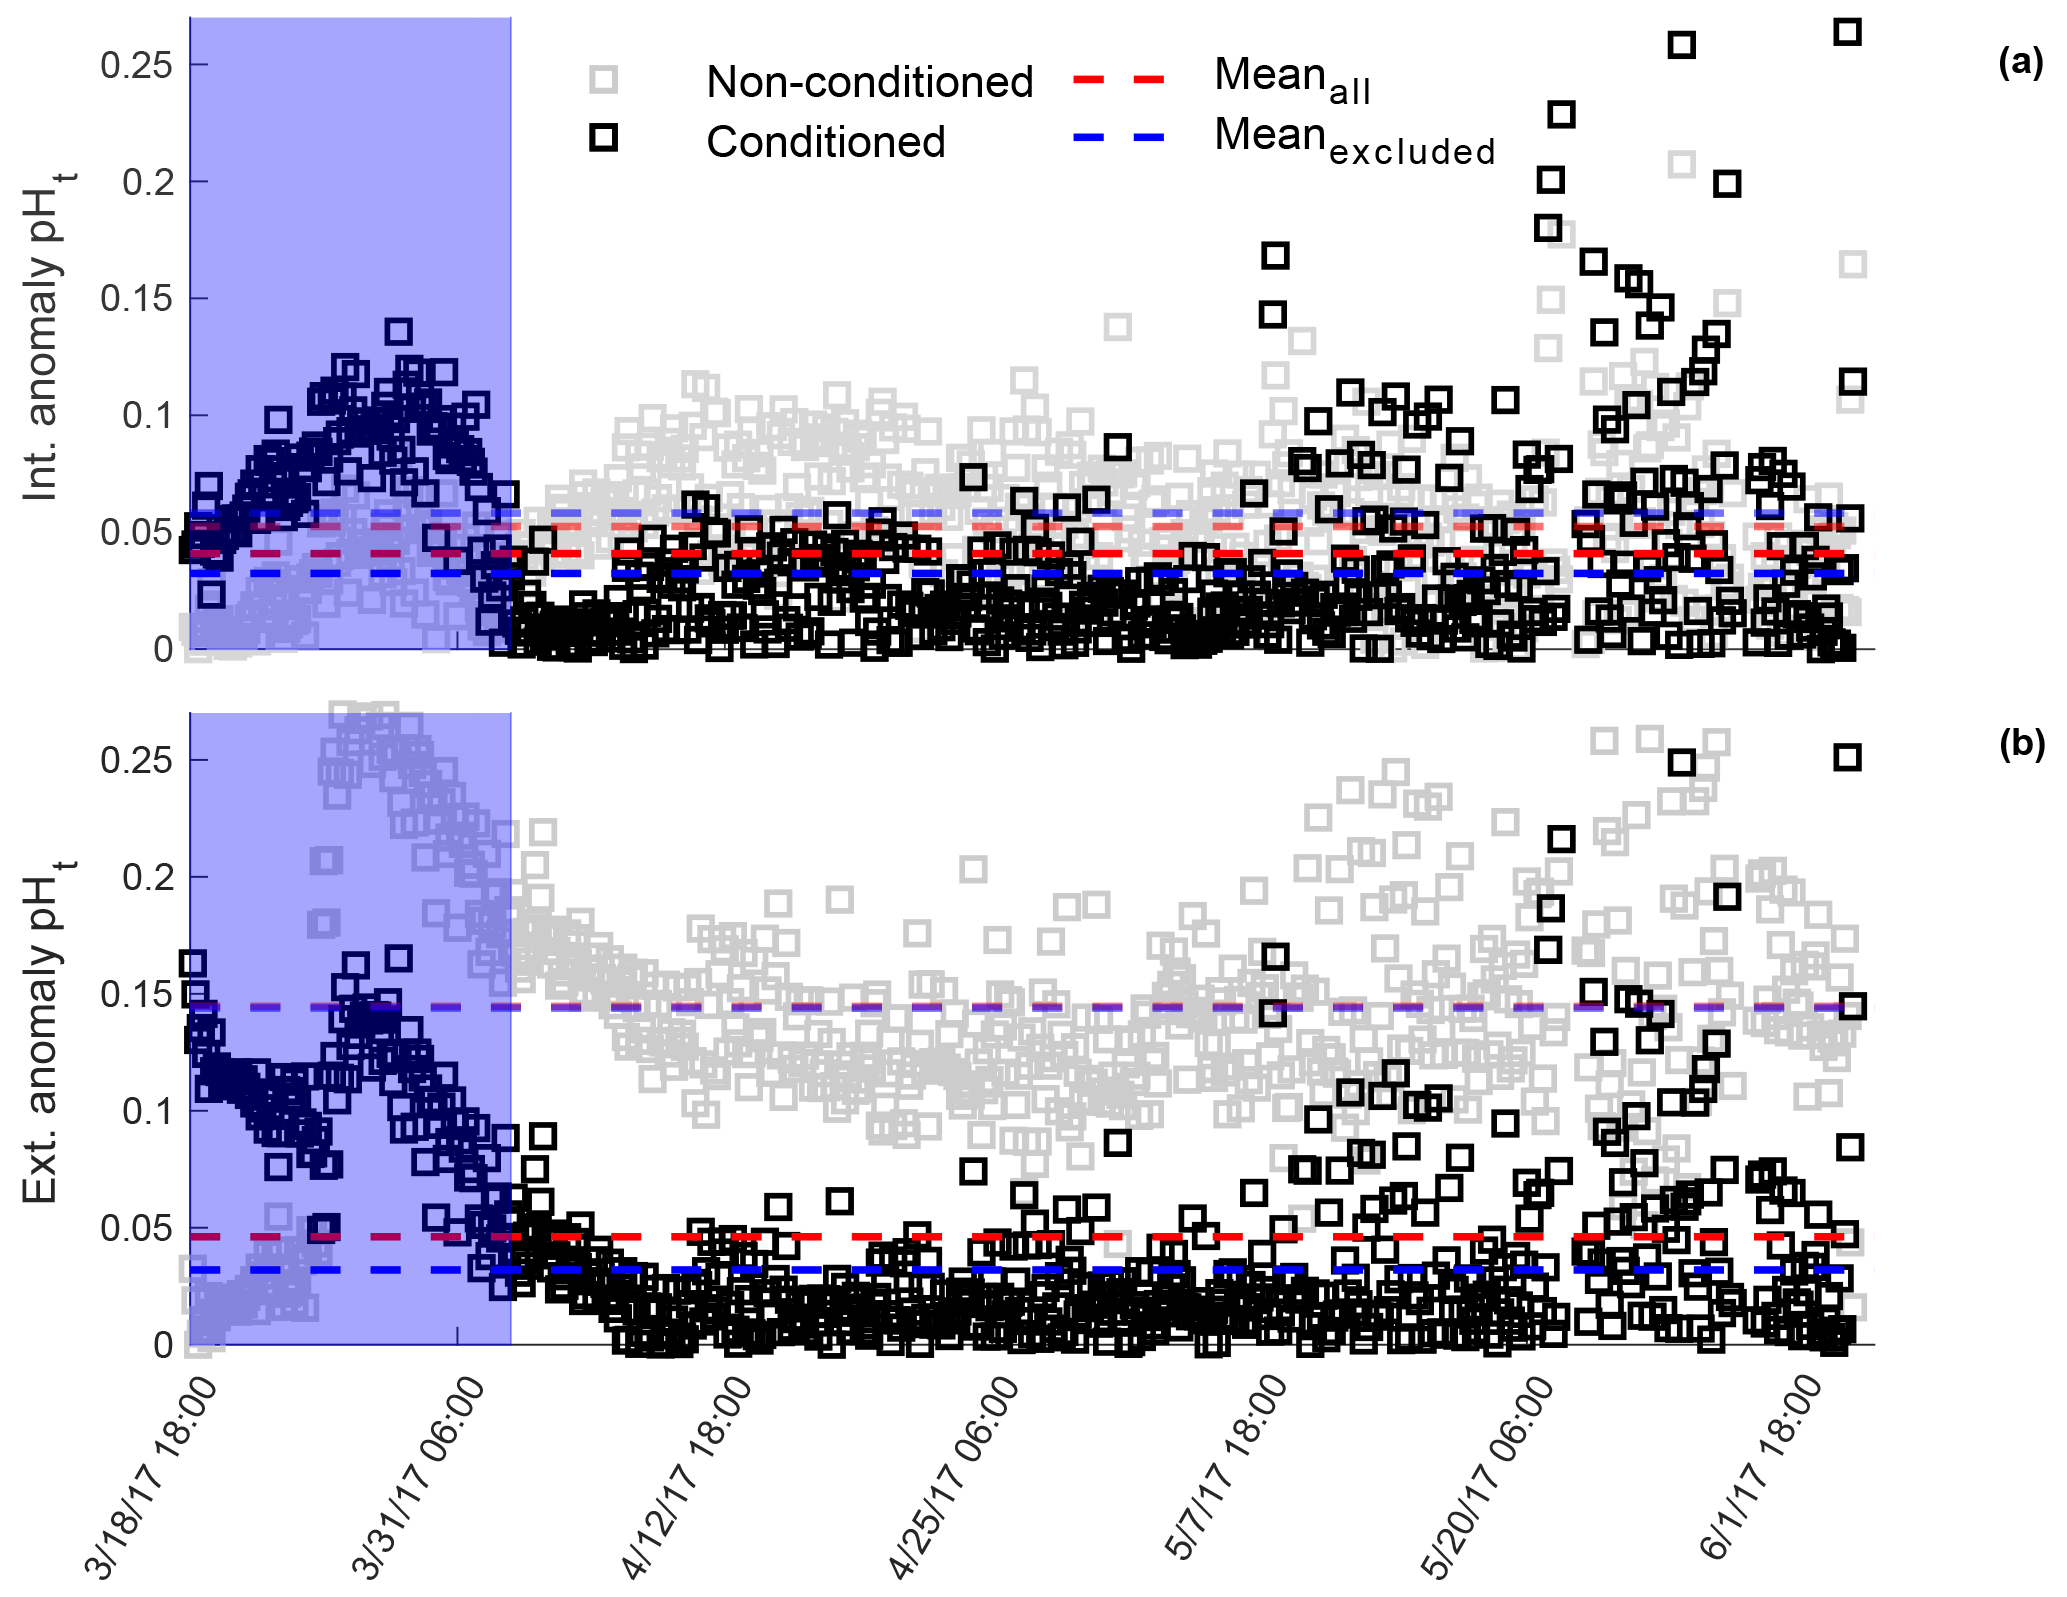
Figure 6Mean pHt anomaly between in situ single-point calibrated SeaFET™395 and SeaFET™396 internal (a) and external (b) electrodes during parallel deployment in Kasitsna Bay, AK. Intra-anomaly comparison based on calibration sample taken at initial deployment (<24 h non-conditioned, gray squares) and end of deployment (36 h pre-recovery, black squares). Shaded blue region indicates conditioning period. Data points in the blue region were omitted when mean anomaly was calculated (non-conditioned: transparent blue-dashed line; conditioned: bold blue-dashed line) compared to mean anomaly from entire data set (non-conditioned to environment: red-dashed line; conditioned: red-dashed line).
Thermistor readings on both sensors_395, 396 tracked the temperature at the Seldovia site well; however, errant spikes occurred around 18 April 2017 and again around 10 May 2017, and continued until the end of the deployment (Fig. 7). The absolute average difference between the thermistor values and the Seldovia data sonde was 0.281 ∘C (SD 0.295), nearly identical to the difference displayed during the test tank deployments, average 0.21 ∘C.
At Sentry Shoal, temperature and salinity seasonally fluctuated and ranged from 8.71 to 21.8 ∘C and from 23.4 to 29.4, respectively. Based on the overall accuracy of the internal and external electrodes, there was no clear distinction as to which provided the more robust measurement after in situ single-point calibration was performed. While the external electrode did display a lower pHt average uncertainty, this was based on only two reference points, one of which had a time discrepancy of 5 min (9 November 2016, 17:05 UTC). Only two reference samples were comparable against sensor_268 pHt due to the loss of salinity and temperature data on 23 August 2016, 17:00 UTC. Reference samples on 26 September and 9 November 2016 were, therefore, compared using the new calibration coefficients determined after redeployment on 27 August 2016. The average pHt uncertainty was <0.0115 units for both electrodes (Fig. 8) compared to average pHt uncertainties of 0.0244 and 0.0560 units for the internal and external electrodes, respectively, if initial calibration coefficients from 19 July 2016 were retained. The low pHt uncertainty (<0.0137 units) determined after the in situ single-point calibration, however, was still greater than the average pHt uncertainty under factory calibration: <0.005 units for both electrodes (Fig. 8).
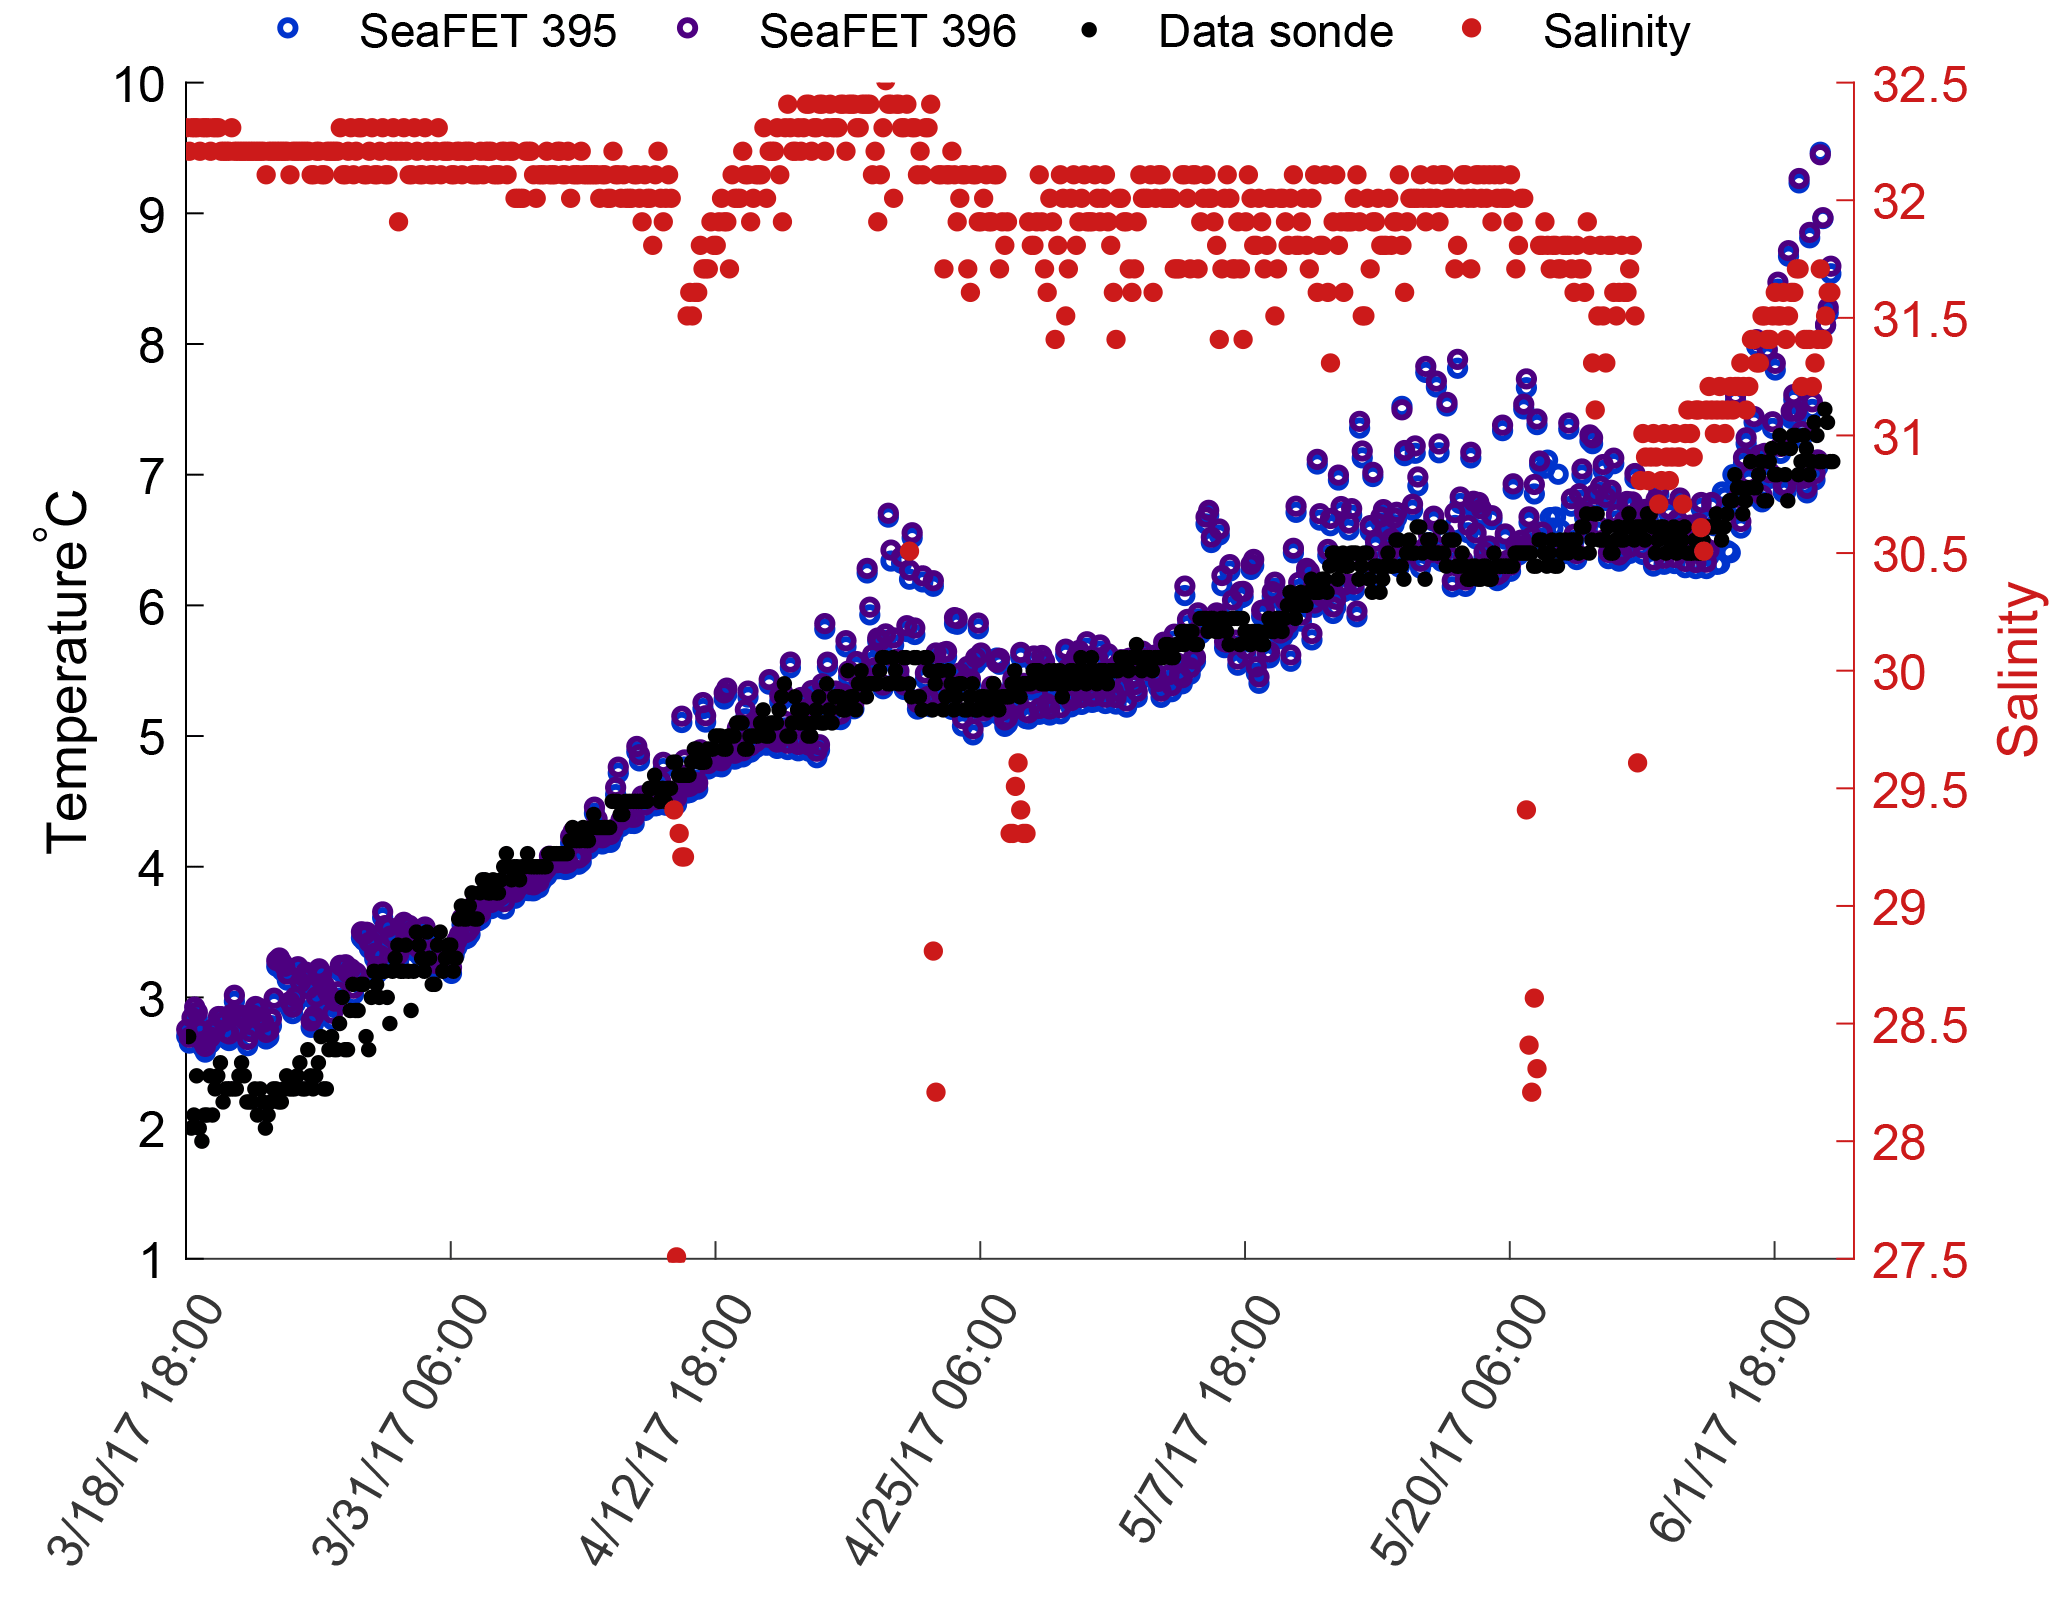
Figure 7Temperature derived from the internal thermistor on SeaFET™395 (blue) and SeaFET™396 (purple) compared against the temperature recorded by the Kachemak Bay National Estuarine Research Reserve data sonde. Salinity (Red circles) recorded by Kachemak Bay data sonde on the right y axis.
3.4 Spectral analysis
All sensors displayed a mixed semi-diurnal tidal response during all field deployments (Fig. 9). SeaFETs™395, 396 at Kasitsna Bay had a stronger amplitude response at a frequency of 2 cycles d−1, whereas sensor_397 had a greater amplitude at 1 cycle d−1 (Fig. 9a, c, d). All three sensors in Alaskan waters had a strong amplitude signal of 1 cycle every 21 days, with an additional signal of one cycle every 3 days for SeaFET™397. The amplitude signal for sensor_397 shifted depending on source of measurement (BoL, internal or external electrode); however, all measurement sources followed the same frequency pattern (Fig. 9a). Sensor_268 at Sentry Shoal displayed a strong signal at a frequency of 0 as well as at 1 and 2 cycles d−1 (Fig. 9a).
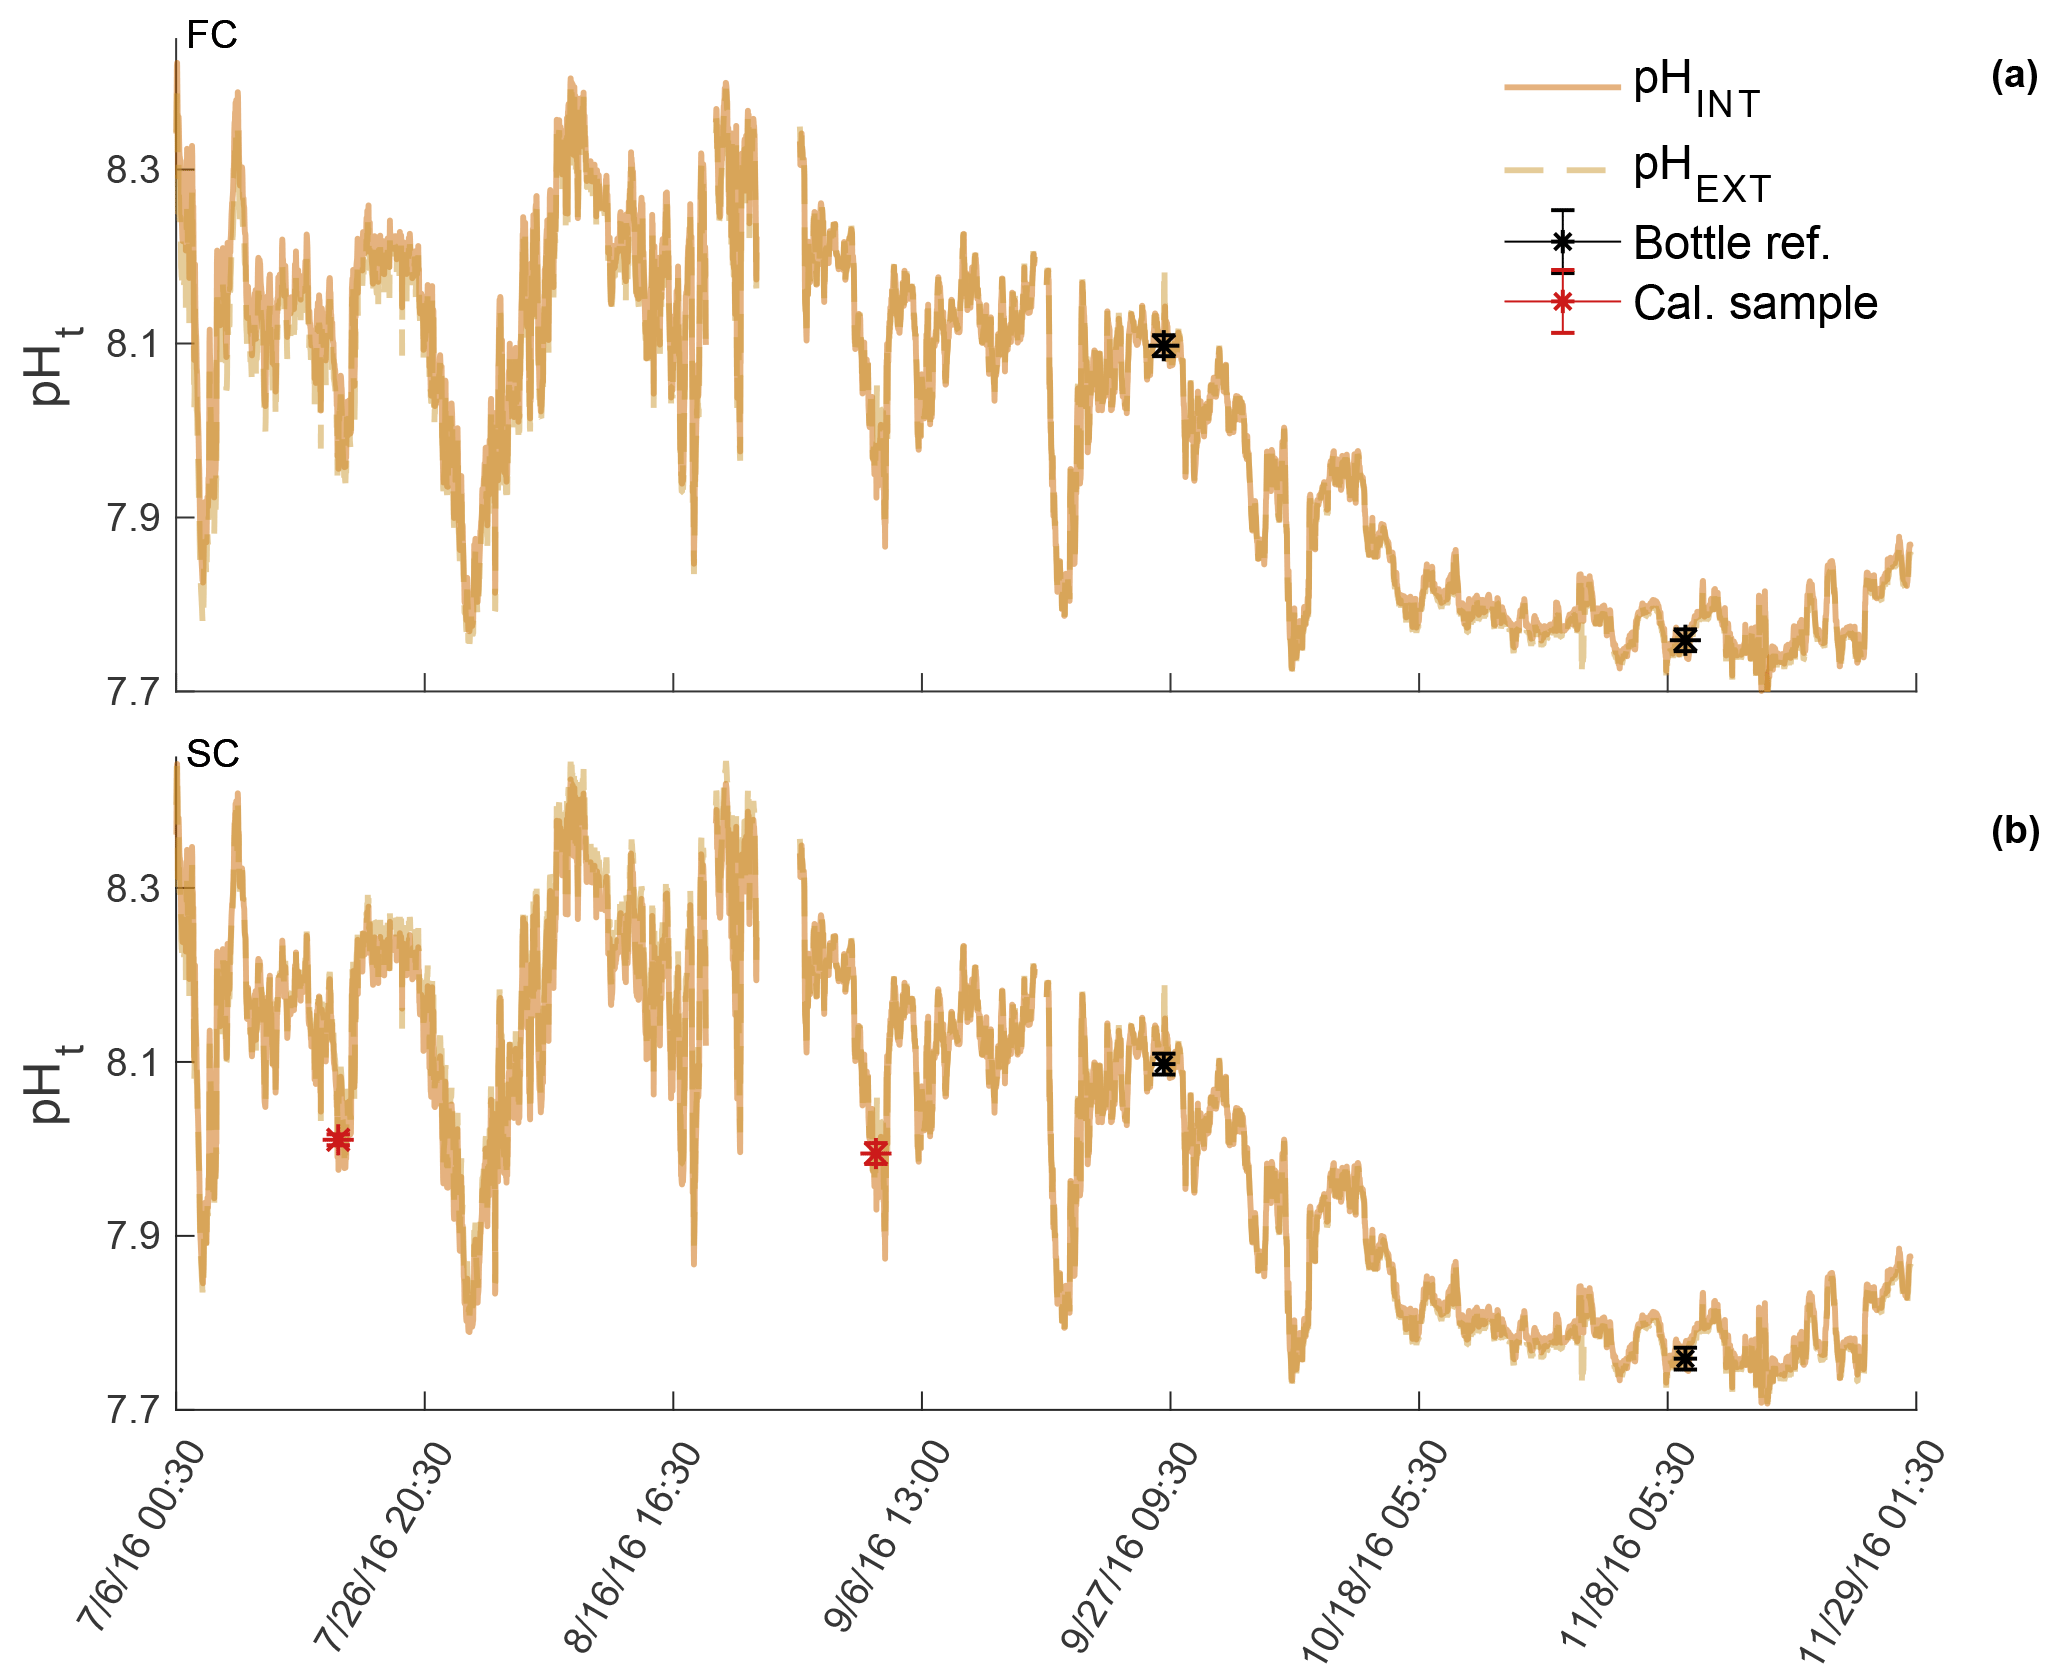
Figure 8pHt recorded by the internal (solid) and external (dashed) electrodes on SeaFET™268 deployed at the Sentry Shoal mooring. pHt from both electrodes is shown when derived using factory calibration (FC) coefficients (a) and in situ single-point (SC) calibration coefficients (b). Black asterisks are references samples taken after initial calibration and recalibration (red asterisk), where pHt was derived from TCO2 and pCO2 measurements made on the BoL at the Hakai Institute's Quadra Island Field Station.
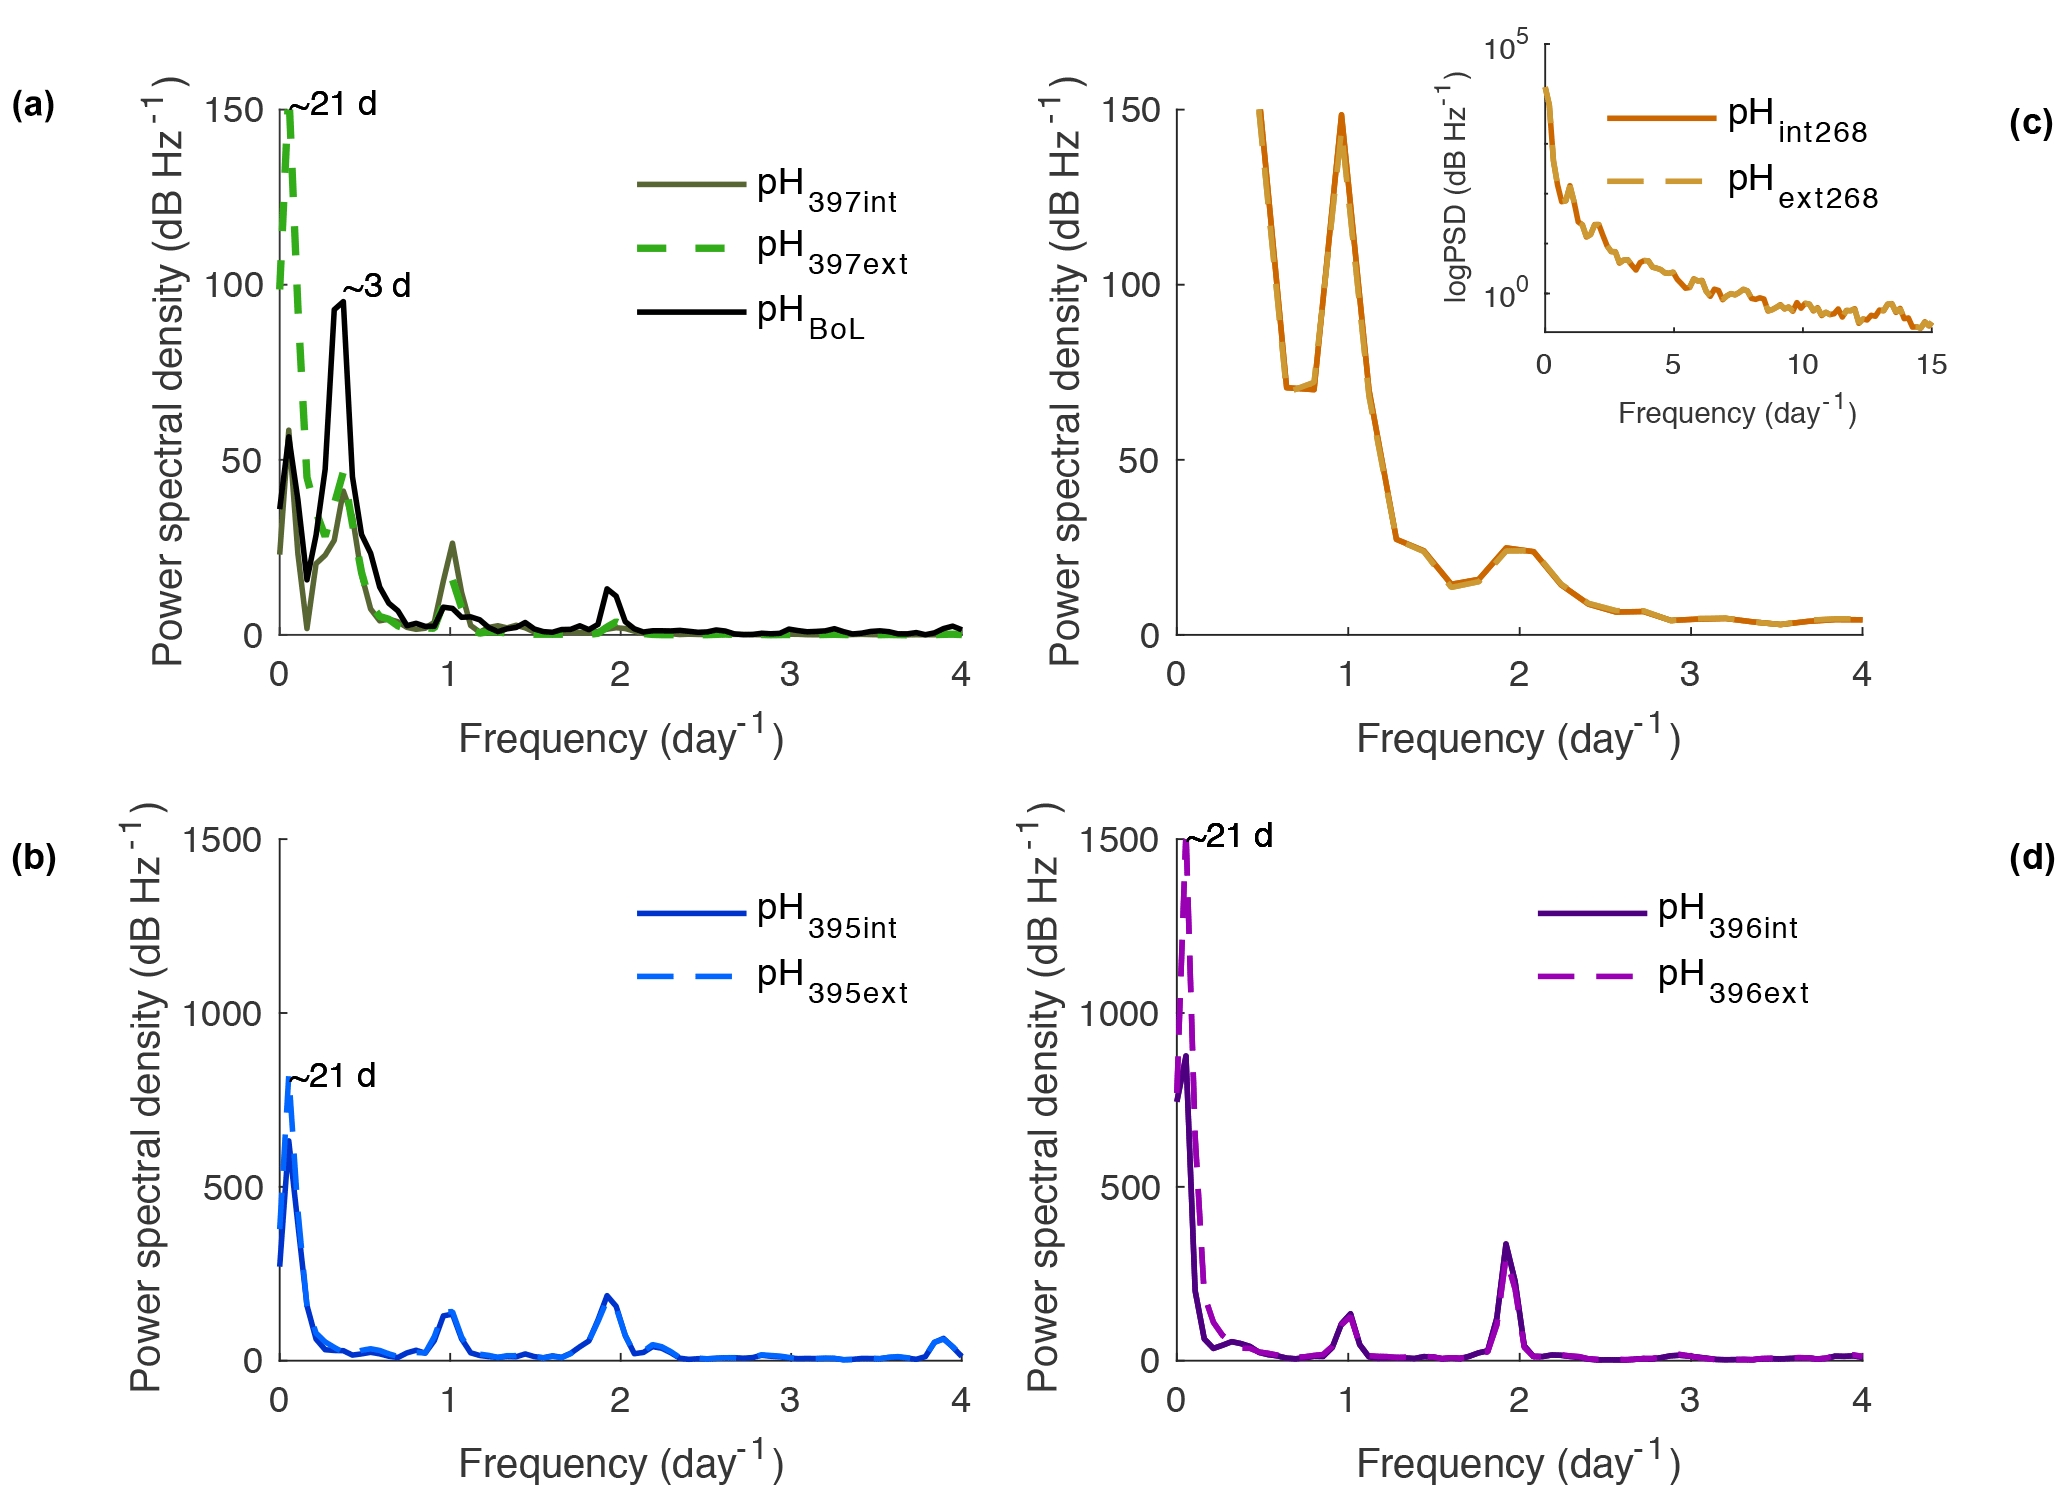
Figure 9Power spectral density (PSD) analysis of pHt in frequency per day for SeaFETs™ 397 (a), 268 (b), 395 (c), and 396 (d). Inset in (b) is log base 10 transformed PSD analysis of same data set. All internal electrodes marked as solid colored lines while external electrodes are colored dashed lines. BoL data set marked as solid black line (a).
3.5 Intrinsic uncertainty and accuracy
Among the calculated potential sources of uncertainty in pHt, inter-sensor variability (difference between SeaFET's™ pHt) and sensor accuracy produced the greatest uncertainty discrepancies for the internal and external electrodes under factory calibration (Fig. 10). The pHt uncertainty (i.e., overall sensor accuracy) for the internal electrode reduced to a greater degree than the external electrode at every ordinal calibration method: factory, in situ single-point, to in situ multi-point calibration (Fig. 10). However, this was not the case for the external electrode as the overall pHt accuracy was greater with a factory calibration compared to an in situ single-point calibration on the conditioned sensor. The thermistor uncertainty (i.e., uncertainty when calculating pHt based on the thermistor temperature rather than a more accurate temperature gauge) produced a pHt uncertainty of 0.0044 units, and was based on the recorded values by sensors_395, 396. Even though the temperature-derived values from the thermistor of sensors_395, 396 were compared against a data sonde 10 km away, the average Tdiff values were consistent with the Tdiff calculated from the test tank deployments (within 0.07 ∘C) and, therefore, provided an adequate resolution to determine a thermistor uncertainty value.
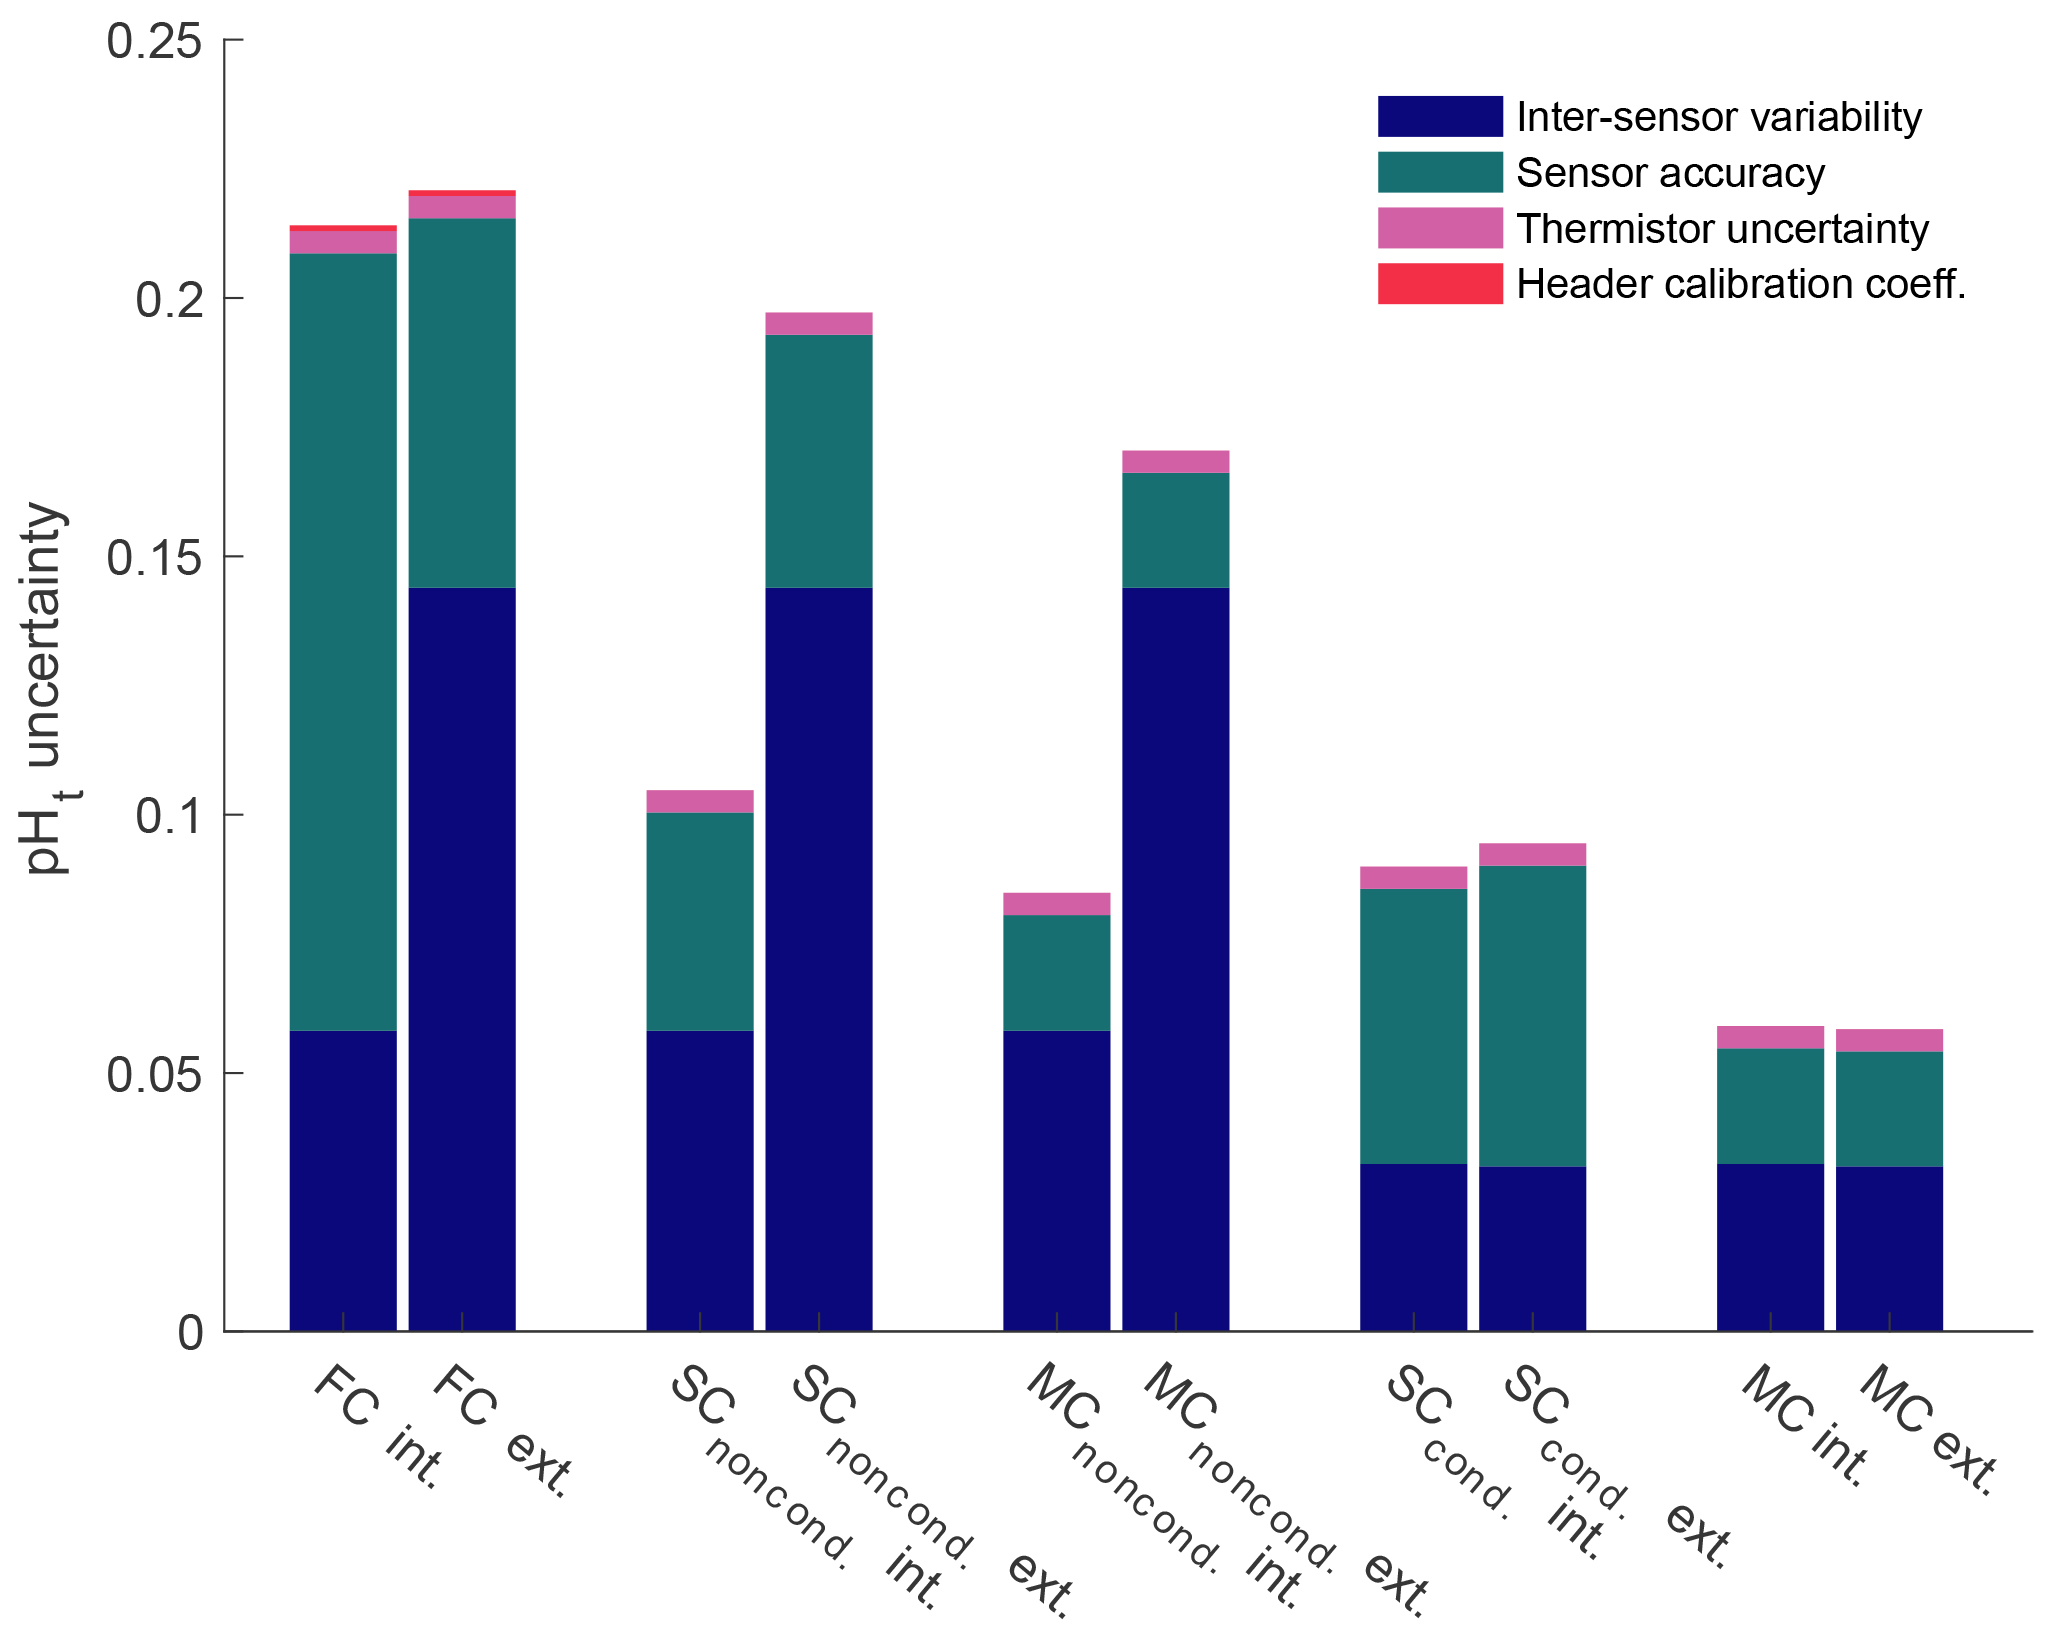
Figure 10Quantified uncertainties based on field deployments of all Sea-Bird SeaFETs™ separated by electrode calibration method (FC: factory; SC: single-point; MC: multi-point), and calibration time for SeaFETs™ 395 and 396 (i.e., non-conditioned to environment and conditioned). pHt accuracy uncertainty calculated as the mean difference when comparing the absolute difference between reference samples and SeaFETs™ 395 (non-conditioned to environment and conditioned), 396 (non-conditioned to environment and conditioned), and 268 as well as the average absolute difference between SeaFET™ 397 and the BoL. Inter-sensor variability uncertainty determined by comparing SeaFETs™ 395 (non-conditioned to environment and conditioned) and 396 (non-conditioned to environment and conditioned), deployed side-by-side in Kasitsna Bay. Thermistor uncertainty is calculated pHt error when using thermistor-derived temperature rather than external temperature sensor determined from SeaFETs™ 395 and 396. Header calibration coefficient uncertainty is the discrepancy in pHt when using SeaFETcom factory calibration coefficients from header file rather than disc file.
Obtaining accurate and precise measurements of pH in nearshore coastal waters is crucial for understanding changing trends, dynamics, and current baselines of acidification in these – “susceptible to change” – marine domains. For dynamic nearshore systems, the current standard of OA weather (carbonate chemistry variability on timescales of days to months) accuracy should have an uncertainty no greater than 0.02 units according to the Global Ocean Acidification Observing Network (Newton et al., 2015). Previous evaluations of the SeaFET™ sensor package have demonstrated accuracy for both electrodes to be better than 0.02 units, with a range between 0.01 and 0.04 units for the internal electrode in more dynamic environments (Bresnahan et al., 2014; Gonski, 2018; Martz et al., 2010). Based on our findings, we observed an accuracy range of 0.009–0.148 pHt units after sensors were conditioned and in situ single-point or multi-point calibrations were performed for the internal and external electrodes. This range decreased when SeaFETs™395, 396 from Kasitsna Bay were calibrated with reference samples taken at initial deployment (i.e., non-conditioned to environment). For SeaFET™397, the internal electrode's accuracy was nearly identical to that of the external electrode after an in situ multi-point calibration (Fig. 2), suggesting that the internal electrode can produce a highly precise pHt measurement comparable to the BoL with an accuracy meeting the standards of the OA weather measurements (Newton et al., 2015). This is not to suggest that the SeaFET™ can replace the BoL, particularly because the BoL can capture multiple carbonate chemistry measurements thereby fully constraining the system and identifying potential decoupling of the carbonate system in estuarine waters (Bandstra et al., 2006; Hales et al., 2016). Nonetheless, the SeaFET™ can provide an accurate measurement of pHt in nearshore waters when SeaFET™ operation is executed with high precision.
Sensors_397, 268 deployed at the APSH and at Sentry Shoal displayed the lowest uncertainty and greatest precision in pHt measurements (Figs. 2 and 8). In both instances, the sensors_397, 268 were adequately conditioned (i.e., subjected to in situ conditions for ∼50 days) before calibration was performed. The greater overall accuracy displayed by sensor_268 at Sentry Shoal may be due to the fact that the sensor was exposed to in situ conditions for a longer period of time and re-calibrated multiple times to the same environment. Further, calibration and reference sample pHt was derived from TCO2 and pCO2 processed by the BoL at Sentry Shoal and from pCO2 (also measured by BoL) and the TA–S relationship (Evans et al., 2015) at the APSH. It is unclear as to why the sensor accuracy of both Kasitsna Bay sensors_395, 396 was substantially less than the sensors_397, 268 at the APSH or Sentry Shoal. A potential reason for the low accuracy may be that sensors were calibrated at a reference point that was extreme relative to the time series pHt signal – that is, calibrated at a time of high variability. In this case, performing an in situ multiple-point calibration could have reduced the uncertainty and increased the accuracy. While previous studies have found that collection and preservation of calibration and reference samples can result in a decrease in accuracy depending on operator experience (McLaughlin et al., 2017), the operator in this study was considered to have substantial experience conducting such operations used in this evaluation. In addition, given the increased pHt variability over a short temporal period – which can be seen at the end of the Kasitsna Bay deployment (Figs. 4 and 5) – and the low discrepancy between duplicate reference samples, the former reasoning (i.e., calibrated to an extreme reference point) is a more reasonable explanation for the reduced accuracy by the Kasitsna Bay sensors_395, 396 than operator experience. We re-iterate here that reference sample temperature and salinity were used to calculate SeaFET™ pHt at the time points in which sensor pHt and reference sample pHt were compared, thus salinity was not a confounding factor.
Despite the lower accuracy of the Kasitsna Bay SeaFETs™395, 396, the two sensors provided a better insight of inter-sensor variability for electrodes non-conditioned and electrodes conditioned to the environment. After in situ single-point calibration for conditioned sensors, the average inter-sensor variability decreased for the internal electrode by ∼80 %, and > 300 % for the external electrode (Fig. 6). The inter-sensor variability reported here was still greater than previous findings (Kapsenberg et al., 2017), however, the comparison made in this study was done in the field compared to controlled laboratory conditions as in Kapsenberg et al. (2017). And while non-homogenized water could lead to anomalies in pHt measurements by the Kasitsna Bay sensors_395, 396, it is unlikely that water was consistently non-homogenized over the entirety of a deployment at a distance of <20 cm (distance between electrodes on each sensor). Furthermore, due to the dynamic nature of Kachemak Bay, where the tidal exchanges are extreme, averaging 4.73 m, it is unlikely that micro-heterogeneity of seawater is the driving force behind the observed differences in pHt measurements that were observed between sensors_395, 396. There was a tradeoff for a decrease in inter-sensor variability, as the in situ single-point calibration performed after sensors were conditioned resulted in a decrease in accuracy compared to an in situ single-point calibration performed for sensors not conditioned to the environment. It should be noted that we do not consider salinity to be a potential source of uncertainty for inter-sensor variability because the pHt difference using data sonde salinity compared to a fixed salinity resulted in an anomaly of <0.005 units.
The influence of rapid environmental variability should be acknowledged here as this can create uncertainty in autonomous sensor operation and accuracy (Tamburri et al., 2011).
While the temperature changes due to rapid environmental change in Kasitsna Bay equate to a potential 0.011 discrepancy in pH, previous evaluation of these sensors show that rapid response to temperature changes should be negligible and result in uncertainties below the accuracy assured when applying an average temperature coefficient (k2), which can result in discrepancies of <0.015 units (Bresnahan et al., 2014). Rapid changes in salinity could also result in uncertainties regarding SeaFET™ accuracy and may be responsible for the nosier signal observed by the external electrode for the sensors_395, 396 deployed in Kasitsna Bay. The greatest salinity change within a 3 h period observed in Kasitsna Bay was 3.90. Given that the mean salinity at the deployment site was 31.8, a mismatch in timing here, or lag in response, could equate to pH changes as great as 0.053 units – although this is likely not a realistic change as this was the maximum difference within a 3 h period. It should be noted that rapid salinity changes would only affect the external electrode as the internal electrode is insensitive to changes in salinity. Due to the uncertainties that can emerge from rapid environmental variability, we reiterate the benefits of an operator understanding the deployment site as this will enhance data collection by the SeaFET™.
The Sentry Shoal sensor_268 had the lowest average pHt uncertainty for both electrodes after in situ single-point calibration was performed; however, these were still greater than the pHt uncertainty determined using the factory calibration coefficients. This specific example highlights two possibilities: (1) the role of inter-sensor variability, as this may be a coincidental case given the uncertainty observed when quantifying inter-sensor variability and (2) the influence of variance within a calibration sample set. For the case of SeaFET™268, the replicate calibration samples collected on 19 July and 2 September 2016 for the first and second deployments had standard deviations of 0.016 and 0.005 pHt units, respectively. When factory and in situ calibrated data produce final pHt values in close agreement, it is important to recognize that the variance in the calibration sample set may contribute to better agreement between factory calibrated sensor pHt data and average discrete sample pHt measurements. It should also be noted that pre-deployment calibration can provide highly accurate measurements by the Honeywell Durafet (internal electrode); however, matching exact conditions to those at the field site are necessary (Johnson et al., 2017), and this was not likely the case for the factory provided calibration coefficients.
The evaluation of SeaFET™ performance presented here corroborates and contrasts with previous studies examining the overall accuracy and precision of pHt measurements made by these oceanographic instruments. While the accuracy of two sensors_397, 268 fall well within the range determined from previous studies, the accuracy of sensors_395, 396 at Kasitsna Bay lay outside the bounds of what has been reported in the primary literature (Bresnahan et al., 2014; Gonski et al., 2018; Johnson et al., 2017; Kapsenberg et al., 2017; Martz et al., 2010). For example, Bresnahan et al. (2014) describes intrinsic Durafet uncertainties of less than 0.03 units, but this varied depending on the validating reference source (e.g., spectrophotometric pH or estimated pH from O2). One reason as to why the Kasitsna Bay SeaFET's™ uncertainties differed from Bresnahan et al. (2014) may be due to the fact that calibration was performed ∼78 days after deployment. Thus, we suggest that in a highly dynamic area such as Kasitsna Bay, calibration should be performed immediately after conditioning. While there is no way to officially conclude that this could have reduced uncertainty, it is one potential source of discrepancy. Following current best practices in Bresnahan et al. (2014) may yield robust measurements; however, the utility of our assessment describes the importance of knowing when to take calibration samples as a means to decrease uncertainties. Nevertheless, it is relevant to report the potential uncertainties possible when operating SeaFETs™ as a multitude of factors can influence the overall accuracy (e.g., operator, sample preservation, electrode conditioning, calibration measurements); therefore, the potential uncertainties calculated in this study represent the upper limit of an average uncertainty compiled from four different SeaFETs™ (Fig. 10). The utility of such an analysis provides a confidence in SeaFET™ operation, and highlights all the potential uncertainties that need to be considered when deploying the sensors in the field. For example, we have included a thermistor uncertainty term determined from the test tank and field deployments of the Alaska sensors, even though a suitable solution around this issue would be to apply an offset to the thermistor temperature given it was compared to more robust temperature measurements conducted before field deployment. It should be noted, in this case, that the thermistor uncertainty observed from sensor_397 against the BoL was excluded as the lag time between thermistor response and tank residence time likely confounded the comparison. The potential pHt uncertainties presented here should serve as a guide for SeaFET™ operators in order to better understand the source of an uncertainty and take the necessary steps to improve SeaFET™ measurements. Bresnahan et al. (2014) acknowledged that relying on the SeaFET™ for an accurate pH measurement should be viewed cautiously if additional biogeochemical sensors are not co-deployed to cross-validate the stability and accuracy of the SeaFET's™ electrodes, therefore, being fully aware of all the potential uncertainties presented here will only further aid SeaFET™ operators.
The time series data provided by the SeaFET™ deployments in this study have expanded the extent of recorded pHt variability along the North American west coast. The sensors_395, 396 deployed in Kasitsna Bay provide some of the first high temporal resolution measurements of pHt in this region. During this spring deployment, it appears that semi-diurnal tidal fluctuations are the dominant contributor to pHt variability with an additional cycle occurring every 21 days coinciding with the seasonal spring and neap tides (Fig. 9). The sensor_268 at Sentry Shoal also displays a strong pHt response to the semi-diurnal mixed tidal cycle. A strong signal is also present at a frequency of zero, and is likely a result of the long, across-season, time series. That is, over the course of the entire deployment which went from summer into late fall, seasonal drivers of pHt (e.g., decrease in water temperature) confounded repetitive frequency patterns. In addition, Sentry Shoal may have a weaker tidal signature relative to other pHt modulators that do not follow a cyclical pattern such as water mass intrusion, inconsistent metabolic cycles from the end of summer into the fall season, and a shift to the rainy season.
As an elaboration on the power spectral density analysis, we suggest this form of frequency analysis can be utilized to better understand the system in which a SeaFET™ is deployed, thus informing the operator as to what the drivers of their system are, and when to calibrate the sensor. It is possible that in a highly dynamic setting, the sensor could re-condition over time periods not resolved in a multi-point calibration sampling scheme, and this could enhance sensor inaccuracies. For example, in Kasitsna Bay, a strong semi-diurnal tide cycle was present, so upon redeployment in this area, if possible, the best calibration approach would be an in situ multi-point calibration between the mixed semi-diurnal tidal cycle. Alternatively, if the system is not driven by a strong tidal signature (e.g., non-coastal region), an in situ single-point calibration may be a reasonable approach. It should be noted that while spectral analysis can be used as an additional tool to better calibrate the SeaFET™, specific coastal environments with dynamic storm frequencies or varying photosynthesis and respiration cycles could obscure a clear driving frequency of pH change. In these situations, capturing the dynamic range (i.e., multiple calibration samples over this period) of one of these events may be sufficient to provide the best approach for robust calibration.
The following evaluation of the Sea-Bird SeaFET™ helped elucidate the overall accuracy and highlighted the potential uncertainties and pitfalls of operating and obtaining pHt measurements by the internal and external electrode pair. We found that the internal electrode provided the more robust measurement in nearshore estuarine waters when an in situ multi-point calibration was performed (Fig. 10). The quantified potential pHt uncertainty is based specifically on our findings, whereas further results may minimize this uncertainty given additional evaluations. However, the results here provide an upper limit of the pHt uncertainty that may be observed when operating a Sea-Bird SeaFET™. Further, high temporal resolution pHt measurements in nearshore Canadian and Alaskan waters provide a better understanding of the drivers modulating pH on short timescales. Given the application, the Sea-Bird SeaFET™ can provide a reliable and accurate pHt measurement which can be utilized to broaden the coverage of understanding pH variability in nearshore and open-ocean waters.
At the current moment the authors have not made the data publicly accessible, but all interested parties can contact authors Cale A. Miller and Amanda L. Kelley for original data files.
CAM wrote the paper and performed all data analysis for the sensors deployed in Alaska. WE and KP collected and processed data for the sensor deployed at Sentry Shoal. ALK conceptualized the topic and direction of the paper. All others provided writing contributions.
The authors declare that they have no conflict of interest.
The authors would like to thank Jeff Hetrick and Jacqueline Ramsey at the
Alutiiq Pride Shellfish Hatchery for providing their facilities and services
for this evaluation. We would also like to thank Angela Doroff at the
Kasitsna Bay laboratory for providing facilities for SeaFET™
deployments. Funding for this project was provided in part by the University
of Alaska Fairbanks College of Fisheries and Ocean Sciences. Wiley Evans and Katie Pocock thank
the Pacific Salmon Foundation and Environment Canada for providing the
platform for deploying SeaFET 268, the University of Alaska Fairbanks Ocean
Acidification Research Center for the long-term use of SeaFET 268, and the
Tula Foundation for supporting their efforts with this work.
Edited by: Mario Hoppema
Reviewed by: two anonymous referees
Bandstra, L., Hales, B., and Takahashi, T.: High-frequency measurements of total CO2: Method development and first oceanographic observations, Mar. Chem., 100, 24–38, https://doi.org/10.1016/j.marchem.2005.10.009, 2006.
Barton, A., Hales, B., Waldbusser, G. G., Langdon, C., and Feely, R. A.: The Pacific oyster, Crassostrea gigas, shows negative correlation to naturally elevated carbon dioxide levels: Implications for near-term ocean acidification effects, Limnol. Oceanogr., 57, 698–710, https://doi.org/10.4319/lo.2012.57.3.0698, 2012.
Bresnahan, P. J., Martz, T. R., Takeshita, Y., Johnson, K. S., and LaShomb, M.: Best practices for autonomous measurement of seawater pH with the Honeywell Durafet, Methods Oceanogr., 9, 44–60, https://doi.org/10.1016/j.mio.2014.08.003, 2014.
Caldeira, K. and Wickett, M. E.: Anthropogenic carbon and ocean pH, Nature, 425, 365–365, https://doi.org/10.1038/425365a, 2003.
Chan, F., Barth, J. A., Blanchette, C. A., Byrne, R. H., Chavez, F., Cheriton, O., Feely, R. A., Friederich, G., Gaylord, B., Gouhier, T., Hacker, S., Hill, T., Hofmann, G., McManus, M. A., Menge, B. A., Nielsen, K. J., Russell, A., Sanford, E., Sevadjian, J., and Washburn, L.: Persistent spatial structuring of coastal ocean acidification in the California Current System, Sci. Rep., 7, 2526, https://doi.org/10.1038/s41598-017-02777-y, 2017.
Dickson, A. G., Sabine, C. L., and Christian, J. R.: Guide to Best Practices for Ocean CO2 Measurements, Report, North Pacific Marine Science Organization, available at: http://www.oceandatapractices.net:80/handle/11329/249 (last access: 30 July 2018, 2007.
Duarte, C. M., Hendriks, I. E., Moore, T. S., Olsen, Y. S., Steckbauer, A., Ramajo, L., Carstensen, J., Trotter, J. A., and McCulloch, M.: Is Ocean Acidification an Open-Ocean Syndrome? Understanding Anthropogenic Impacts on Seawater pH, Estuaries Coasts, 36, 221–236, https://doi.org/10.1007/s12237-013-9594-3, 2013.
Ekstrom, J. A., Suatoni, L., Cooley, S. R., Pendleton, L. H., Waldbusser, G. G., Cinner, J. E., Ritter, J., Langdon, C., van Hooidonk, R., Gledhill, D., Wellman, K., Beck, M. W., Brander, L. M., Rittschof, D., Doherty, C., Edwards, P. E. T., and Portela, R.: Vulnerability and adaptation of US shellfisheries to ocean acidification, Nat. Clim. Change, 5, 207–214, https://doi.org/10.1038/NCLIMATE2508, 2015.
Evans, W., Mathis, J. T., and Cross, J. N.: Calcium carbonate corrosivity in an Alaskan inland sea, Biogeosciences, 11, 365–379, https://doi.org/10.5194/bg-11-365-2014, 2014.
Evans, W., Mathis, J. T., Ramsay, J., and Hetrick, J.: On the Frontline: Tracking Ocean Acidification in an Alaskan Shellfish Hatchery, PLOS ONE, 10, e0130384, https://doi.org/10.1371/journal.pone.0130384, 2015.
Feely, R. A., Alin, S. R., Newton, J., Sabine, C. L., Warner, M., Devol, A., Krembs, C.. and Maloy, C.: The combined effects of ocean acidification, mixing, and respiration on pH and carbonate saturation in an urbanized estuary, Estuar. Coast. Shelf Sci., 88, 442–449, https://doi.org/10.1016/j.ecss.2010.05.004, 2010.
Feely, R. A., Alin, S. R., Carter, B., Bednaršek, N., Hales, B., Chan, F., Hill, T. M., Gaylord, B., Sanford, E., Byrne, R. H., Sabine, C. L., Greeley, D., and Juranek, L.: Chemical and biological impacts of ocean acidification along the west coast of North America, Estuar. Coast. Shelf Sci., 183, Part A, 260–270, https://doi.org/10.1016/j.ecss.2016.08.043, 2016.
Gonski, S. F., Cai, W.-J., Ullman, W. J., Joesoef, A., Main, C. R., Pettay, D. T., and Martz, T. R.: Assessment of the suitability of Durafet-based sensors for pH measurement in dynamic estuarine environments, Estuar. Coast. Shelf Sci., 200(Supplement C), 152–168, https://doi.org/10.1016/j.ecss.2017.10.020, 2018.
Hales, B., Suhrbier, A., Waldbusser, G. G., Feely, R. A., and Newton, J. A.: The Carbonate Chemistry of the “Fattening Line,” Willapa Bay, 2011–2014, Estuaries Coasts, 40, 1–14, https://doi.org/10.1007/s12237-016-0136-7, 2016.
Harris, K. E., DeGrandpre, M. D., and Hales, B.: Aragonite saturation state dynamics in a coastal upwelling zone, Geophys. Res. Lett., 40, 2720–2725, https://doi.org/10.1002/grl.50460, 2013.
Hofmann, G. E., Smith, J. E., Johnson, K. S., Send, U., Levin, L. A., Micheli, F., Paytan, A., Price, N. N., Peterson, B., Takeshita, Y., Matson, P. G., Crook, E. D., Kroeker, K. J., Gambi, M. C., Rivest, E. B., Frieder, C. A., Yu, P. C., and Martz, T. R.: High-Frequency Dynamics of Ocean pH: A Multi-Ecosystem Comparison, Plos One, 6, e28983, https://doi.org/10.1371/journal.pone.0028983, 2011.
Johnson, K. S., Plant, J. N., Coletti, L. J., Jannasch, H. W., Sakamoto, C. M., Riser, S. C., Swift, D. D., Williams, N. L., Boss, E., Haentjens, N., Talley, L. D., and Sarmiento, J. L.: Biogeochemical sensor performance in the SOCCOM profiling float array, J. Geophys. Res.-Oceans, 122, 6416–6436, https://doi.org/10.1002/2017JC012838, 2017.
Kapsenberg, L. and Hofmann, G. E.: Ocean pH time-series and drivers of variability along the northern Channel Islands, California, USA, Limnol. Oceanogr., 61, 953–968, https://doi.org/10.1002/lno.10264, 2016.
Kapsenberg, L., Kelley, A. L., Shaw, E. C., Martz, T. R., and Hofmann, G. E.: Near-shore Antarctic pH variability has implications for the design of ocean acidification experiments, Sci. Rep., 5, srep09638, https://doi.org/10.1038/srep09638, 2015.
Kapsenberg, L., Bockmon, E. E., Bresnahan, P. J., Kroeker, K. J., Gattuso, J.-P., and Martz, T. R.: Advancing Ocean Acidification Biology Using Durafet® pH Electrodes, Front. Mar. Sci., 4, 321, https://doi.org/10.3389/fmars.2017.00321, 2017.
Khoo, K. H., Ramette, R. W., Culberson, C. H., and Bates, R. G.: Determination of hydrogen ion concentrations in seawater from 5 to 40.degree.C: standard potentials at salinities from 20 to 45∘/00, Anal. Chem., 49, 29–34, https://doi.org/10.1021/ac50009a016, 1977.
Lueker, T. J., Dickson, A. G., and Keeling, C. D.: Ocean pCO(2) calculated from dissolved inorganic carbon, alkalinity, and equations for K-1 and K-2: validation based on laboratory measurements of CO2 in gas and seawater at equilibrium, Mar. Chem., 70, 105–119, https://doi.org/10.1016/S0304-4203(00)00022-0, 2000.
Martz, T., Send, U., Ohman, M. D., Takeshita, Y., Bresnahan, P., Kim, H.-J., and Nam, S.: Dynamic variability of biogeochemical ratios in the Southern California Current System, Geophys. Res. Lett., 41, 2496–2501, https://doi.org/10.1002/2014GL059332, 2014.
Martz, T. R., Connery, J. G., and Johnson, K. S.: Testing the Honeywell Durafet® for seawater pH applications, Limnol. Oceanogr.-Meth., 8, 172–184, https://doi.org/10.4319/lom.2010.8.172, 2010.
Martz, T. R., Daly, K. L., Byrne, R. H., Stillman, J. H., and Turk, D.: Technology for ocean acidification research: needs and availability, Oceanography, 28, 40–47, 2015.
Mathis, J. T., Cross, J. N., and Bates, N. R.: Coupling primary production and terrestrial runoff to ocean acidification and carbonate mineral suppression in the eastern Bering Sea, J. Geophys. Res. Oceans, 116, C02030, https://doi.org/10.1029/2010JC006453, 2011a.
Mathis, J. T., Cross, J. N., and Bates, N. R.: The role of ocean acidification in systemic carbonate mineral suppression in the Bering Sea, Geophys. Res. Lett., 38, L19602, https://doi.org/10.1029/2011GL048884, 2011b.
Mathis, J. T., Pickart, R. S., Byrne, R. H., McNeil, C. L., Moore, G. W. K., Juranek, L. W., Liu, X., Ma, J., Easley, R. A., Elliot, M. M., Cross, J. N., Reisdorph, S. C., Bahr, F., Morison, J., Lichendorf, T., and Feely, R. A.: Storm-induced upwelling of high pCO2 waters onto the continental shelf of the western Arctic Ocean and implications for carbonate mineral saturation states, Geophys. Res. Lett., 39, L07606, https://doi.org/10.1029/2012GL051574, 2012.
Mathis, J. T., Cross, J. N., Monacci, N., Feely, R. A., and Stabeno, P.: Evidence of prolonged aragonite undersaturations in the bottom waters of the southern Bering Sea shelf from autonomous sensors, Deep-Sea Res. Pt-II, 109, 125–133, https://doi.org/10.1016/j.dsr2.2013.07.019, 2014.
Mathis, J. T., Cross, J. N., Evans, W., and Doney, S. C.: Ocean Acidification in the Surface Waters of the Pacific-Arctic Boundary Regions, Oceanography, 28, 122–135, https://doi.org/10.5670/oceanog.2015.36, 2015a.
Mathis, J. T., Cooley, S. R., Lucey, N., Colt, S., Ekstrom, J., Hurst, T., Hauri, C., Evans, W., Cross, J. N., and Feely, R. A.: Ocean acidification risk assessment for Alaska's fishery sector, Prog. Oceanogr., 136, 71–91, https://doi.org/10.1016/j.pocean.2014.07.001, 2015b.
Matson, P. G., Martz, T. R., and Hofmann, G. E.: High-frequency observations of pH under Antarctic sea ice in the southern Ross Sea, Antarct. Sci., 23, 607–613, https://doi.org/10.1017/S0954102011000551, 2011.
McLaughlin, K., Dickson, A., Weisberg, S. B., Coale, K., Elrod, V., Hunter, C., Johnson, K. S., Kram, S., Kudela, R., Martz, T., Negrey, K., Passow, U., Shaughnessy, F., Smith, J. E., Tadesse, D., Washburn, L., and Weis, K. R.: An evaluation of ISFET sensors for coastal pH monitoring applications, Reg. Stud. Mar. Sci., 12, 11–18, https://doi.org/10.1016/j.rsma.2017.02.008, 2017.
Newton, J., Devol, A., Alford, M., Mickett, J., Sabine, C., and Sutton, A.: Nanoos Contributions to Understanding Ocean Acidification, J. Shellfish Res., 31, 327–327, 2012.
Newton J. A., Feely, R. A., Jewett, E. B., Williamson, P., and Mathis, J.: Global Ocean Acidification Observing Network: Requirements and Governance Plan. Second Edition, GOA-ON, http://goa-on.org/documents/resources/GOA-ON_2nd_edition_final.pdf (last access: 30 July 2018), 2015.
Orr, J. C., Fabry, V. J., Aumont, O., Bopp, L., Doney, S. C., Feely, R. A., Gnanadesikan, A., Gruber, N., Ishida, A., Joos, F., Key, R. M., Lindsay, K., Maier-Reimer, E., Matear, R., Monfray, P., Mouchet, A., Najjar, R. G., Plattner, G. K., Rodgers, K. B., Sabine, C. L., Sarmiento, J. L., Schlitzer, R., Slater, R. D., Totterdell, I. J., Weirig, M. F., Yamanaka, Y., and Yool, A.: Anthropogenic ocean acidification over the twenty-first century and its impact on calcifying organisms, Nature, 437, 681–686, https://doi.org/10.1038/nature04095, 2005.
Orr, J. C., Epitalon, J.-M., Dickson, A. G., and Gattuso, J.-P.: Routine uncertainty propagation for the marine carbon dioxide system, Mar. Chem., in preparation, 2018.
Riebesell, U. and Gattuso, J.-P.: Lessons learned from ocean acidification research, Nat. Clim. Change, 5, 12–14, https://doi.org/10.1038/nclimate2456, 2015.
Rudd, M. A.: What a Decade (2006–15) Of Journal Abstracts Can Tell Us about Trends in Ocean and Coastal Sustainability Challenges and Solutions, Front. Mar. Sci., 4, 170, https://doi.org/10.3389/fmars.2017.00170, 2017.
Steinhart, J. S. and Hart, S. R.: Calibration curves for thermistors, Deep-Sea Res., 15, 497–503, https://doi.org/10.1016/0011-7471(68)90057-0, 1968.
Sunda, W. G. and Cai, W.-J.: Eutrophication Induced CO2-Acidification of Subsurface Coastal Waters: Interactive Effects of Temperature, Salinity, and Atmospheric P-CO2, Environ. Sci. Technol., 46, 10651–10659, https://doi.org/10.1021/es300626f, 2012.
Takeshita, Y., Martz, T. R., Johnson, K. S., and Dickson, A. G.: Characterization of an Ion Sensitive Field Effect Transistor and Chloride Ion Selective Electrodes for pH Measurements in Seawater, Anal. Chem., 86, 11189–11195, https://doi.org/10.1021/ac502631z, 2014.
Tamburri, M. N., Johengen, T. H., Atkinson, M. J., Schar, D. W. H., Robertson, C. Y., Purcell, H., Smith, G. J., Pinchuk, A., and Buckley, E. N.: Alliance for Coastal Technologies, Mar. Technol. Soc. J., 45, 43–51, https://doi.org/10.4031/MTSJ.45.1.4, 2011.
Uppström, L. R.: The boron/chlorinity ratio of deep-sea water from the Pacific Ocean, Deep-Sea Res., 21, 161–162, https://doi.org/10.1016/0011-7471(74)90074-6, 1974.
Waldbusser, G. G. and Salisbury, J. E.: Ocean Acidification in the Coastal Zone from an Organism's Perspective: Multiple System Parameters, Frequency Domains, and Habitats, Annu. Rev. Mar. Sci., 6, 221–247, https://doi.org/10.1146/annurev-marine-121211-172238, 2014.
Yu, P. C., Matson, P. G., Martz, T. R., and Hofmann, G. E.: The ocean acidification seascape and its relationship to the performance of calcifying marine invertebrates: Laboratory experiments on the development of urchin larvae framed by environmentally-relevant pCO(2)/pH, J. Exp. Mar. Biol. Ecol., 400, 288–295, https://doi.org/10.1016/j.jembe.2011.02.016, 2011.