the Creative Commons Attribution 3.0 License.
the Creative Commons Attribution 3.0 License.
Wintertime dynamics in the coastal northeastern Adriatic Sea: the NAdEx 2015 experiment
Hrvoje Mihanović
Ivica Janeković
Cléa Denamiel
Pierre-Marie Poulain
Mirko Orlić
Natalija Dunić
Vlado Dadić
Mira Pasarić
Stipe Muslim
Riccardo Gerin
Frano Matić
Jadranka Šepić
Elena Mauri
Zoi Kokkini
Martina Tudor
Žarko Kovač
Tomislav Džoić
The paper investigates the wintertime dynamics of the coastal northeastern Adriatic Sea and is based on numerical modelling and in situ data collected through field campaigns executed during the winter and spring of 2015. The data were collected with a variety of instruments and platforms (acoustic Doppler current profilers, conductivity–temperature–depth probes, glider, profiling float) and are accompanied by the atmosphere–ocean ALADIN/ROMS modelling system. The research focused on the dense-water formation (DWF), thermal changes, circulation, and water exchange between the coastal and open Adriatic. According to both observations and modelling results, dense waters are formed in the northeastern coastal Adriatic during cold bora outbreaks. However, the dense water formed in this coastal region has lower densities than the dense water formed in the open Adriatic due to lower salinities. Since the coastal area is deeper than the open Adriatic, the observations indicate (i) balanced inward–outward exchange at the deep connecting channels of denser waters coming from the open Adriatic DWF site and less-dense waters coming from the coastal region and (ii) outward flow of less-dense waters dominating in the intermediate and surface layers. The latter phenomenon was confirmed by the model, even if it significantly underestimates the currents and transports in the connecting channels. The median residence time of the coastal area is estimated to be approximately 20 days, indicating that the coastal area may be renewed relatively quickly by the open Adriatic waters. The data that were obtained represent a comprehensive marine dataset that can be used to calibrate atmospheric and oceanic numerical models and point to several interesting phenomena to be investigated in the future.
- Article
(15850 KB) - Full-text XML
- BibTeX
- EndNote


Due to its geographical position and surrounding orography, the Adriatic Sea – a semi-enclosed 800 × 200 km basin located north of the Mediterranean (Fig. 1) – can be considered a unique test bed where a number of processes important for driving the circulation of the eastern Mediterranean Sea occur (Malanotte-Rizzoli et al., 2014). Dense-water formation (DWF) is one of these processes. In the Adriatic Sea, DWF occurs through both water column cooling and mixing on the shallow and wide northern Adriatic shelf (Vested et al., 1998) and through deep convection in the 1200 m deep circular South Adriatic Pit (Gačić et al., 2002). The cooling at both locations is a result of strong bora wind (Grubišić, 2004; Grisogono and Belušić, 2009), which may cause widespread heat losses of up to 1000 W m−2 (Supić and Orlić, 1999) and localized heat losses of up to 2000 W m−2 (Janeković et al., 2014). Although of secondary importance, bora-driven evaporation also contributes to high densities in the northern Adriatic (Mihanović et al., 2013). Adriatic dense waters are important for (i) replenishing deep waters in the eastern Mediterranean (Roether and Schlitzer, 1991; Bensi et al., 2013), (ii) changing or maintaining the internal vorticity of the northern Ionian (Gačić et al., 2010) and (iii) driving decadal oscillations of thermohaline and biogeochemical properties in the Adriatic (Buljan, 1953; Zore-Armanda, 1963; Gačić et al., 2010; Civitarese et al., 2010; Batistić et al., 2014).

Figure 1Geographical position and bathymetry of the coastal northeastern Adriatic, with indicated measurements conducted through the NAdEx 2015 experiment: stations A1 to A9 (black circles) where ADCP/SBE911 were moored at the bottom, stations 1 to 19 (black diamonds) where CTD probe profiling, ARVOR-C profiling (orange stars), and glider profiling have been executed (yellow stars). Locations G1 and G2 (red stars) have been used for computation of temporal changes in heat losses, buoyancy changes and thermohaline properties from the modelling system, while the definition of the bora episode has been based on ALADIN/HR wind modelled at the G1 location. Transects T1 to T6 and T789 are marked by red lines on which the fluxes and transports have been estimated; the transect labels are associated with the equivalent A station labels. Nested ROMS domain boundary is indicated by the dashed white line. Inset numbers 1, 2 and 3 denote the areas where dense-water formation is documented in the Adriatic Sea, while PS and SAP stand for Palagruža Sill and South Adriatic Pit, respectively.
Until 2012, it was thought that DWF in the northern Adriatic occurred only over open shelf areas (Vilibić and Supić, 2005). Therein, a pool of very dense waters is created by the double-gyre circulation driven by the spatial inhomogeneity of the bora wind and associated heat losses and river discharges (Zore-Armanda and Gačić, 1987; Supić et al., 1997; Beg Paklar et al., 2001; Kuzmić et al., 2006). The dense waters that are generated are gravitationally transported towards middle Adriatic depressions though a bottom density current (Nof, 1983) mostly along the western Adriatic slope due to the Coriolis force (Artegiani and Salusti, 1987; Vilibić and Mihanović, 2013). A portion of the water travels across the southern Palagruža Sill and, when it reaches the slope and canyons of the South Adriatic Pit, it is transported down the slope to the near-bottom layers (Querin et al., 2013, 2016; Langone et al., 2016). This concept has been supported by a number of numerical modelling studies (e.g. Beg-Paklar et al., 2001; Chiggiato and Oddo, 2008). However, this classical northern Adriatic DWF picture has been substantially changed following the exceptional DWF that occurred in the winter of 2012, when the formation of dense waters was also observed in the northeastern coastal area (Fig. 1) (Mihanović et al., 2013). Subsequent modelling studies implied that up to 40 % of the overall dense water that was generated in the northern Adriatic during the winter of 2012 originated from the eastern coastal areas (Janeković et al., 2014), and there was significant transport between the coastal and open Adriatic through a number of channels (Vilibić et al., 2016a). It should be emphasized that these two modelling studies were the first to use realistic freshwater discharges. Most previous modelling studies used old river climatology (Raicich, 1994), which overestimates real river discharges in the eastern Adriatic by an order of magnitude (Janeković et al., 2014), thus preventing the numerical reproduction of the DWF in the northeastern coastal areas and significantly impacting the rates of DWF over the northern Adriatic shelf areas (Vilibić et al., 2016a).
Interestingly, atmospheric processes over the northeastern coastal Adriatic areas have been thoroughly researched. The maximum of the cold and dry bora wind and its spatial and temporal variability have been reported to occasionally reach hurricane magnitudes in this area (Grubišić, 2004; Grisogono and Belušić, 2009; Kuzmić et al., 2015). As opposed to the meteorology, less is known about the oceanography of the area. For a long time, the coastal northeastern Adriatic has been considered an area where significant freshwater fluxes strongly affect the thermohaline properties (e.g. Orlić et al., 2000). These freshwater discharges normally come through occasional floods that accumulate over the 150 km long and 1600 m high mountain ridge of Velebit (Perica and Orešić, 1997) and a large number of submarine karstic springs (Sekulić and Vertačnik, 1996; Bonacci, 2001; Benac et al., 2003; Surić et al., 2015). Further, thanks to occasional oceanographic campaigns, the inner area of the Velebit Channel has been classified as a two-layer system, and the surface salinity exhibits much lower values (∼ 1.0) than that in the open Adriatic (Viličić et al., 2009). Additionally, it has been identified that a strong northern Adriatic thermohaline front (Lee et al., 2005; Poulain et al., 2011) has its starting point in the northeastern coastal Adriatic, specifically in Kvarner Bay, with coastal waters advected towards the open sea, particularly during strong bora events (Pullen et al., 2003; Lee et al., 2005; Beg Paklar et al., 2008). As it is topographically separated from the open Adriatic by a number of islands (Fig. 1), the northeastern coastal area was not considered to be eligible for wintertime processes such as dense-water formation before the winter of 2012, at least not at rates that may impact the overall dynamics of the northern Adriatic.
Until now, the winter of 2012 remains the only winter when dense-water formation was observed and modelled in the northeastern coastal Adriatic. The question remains whether this is due to (i) the exceptionality of the 2012 winter – implying that this was an extraordinary event, or (ii) a lack of observational campaigns and poor model performance in the area – pointing to a possibility of both regular dense-water formation in the area and omissions in previous research efforts. To bridge the lack of observations in the area, we envisioned and carried out the North Adriatic Dense Water Experiment 2015 (NAdEx 2015). A number of different platforms and instrumentations for data collection were utilized (Fig. 1), along with a state-of-the-art nested atmosphere–ocean modelling system, all during the winter–spring of 2015, i.e. before, during and after a common Adriatic DWF period. The experimental data and modelling results that were obtained allowed us to (i) document the processes in the northeastern Adriatic in great detail; (ii) to quantify the thermohaline, buoyancy and stratification changes occurring in the area, providing an insight to the DWF-related processes; and (iii) estimate the rate of exchange between the coastal and open Adriatic waters through several connecting passages.
Section 2 provides the details of the field experiment and data used in this paper, together with a description of the atmosphere–ocean modelling system. Section 3 documents the atmospheric conditions during the winter–spring of 2015. Section 4 describes the representative ocean observations, which is followed by a description of model verification in Sect. 5. Section 6 displays the thermohaline, stratification and buoyancy changes as reproduced by the model, which are followed by estimates of heat, salt, mass and volume transport at the boundaries of the region, including residence times. A thorough discussion and major conclusions are presented in Sect. 7.
2.1 The study area
The northeastern Adriatic is a coastal region consisting of many elongated channels and bays (Fig. 1). It interacts with the open Adriatic through several narrow (from one kilometre to a few kilometres) channels. The only exception is a wide opening that connects Kvarner Bay to the open Adriatic. Thus, Kvarner Bay may be considered as a crossing region between coastal and open Adriatic waters. The inner coastal region is deeper (80–100 m) than the open Adriatic (50–70 m). Only a few small river mouths are located in the area, and there is freshwater input from the hydropower plant near Senj. The combined inputs result in average freshwater input rates of approximately 80 m3 s−1 (Vilibić et al., 2016a). However, there are also many submarine springs that are quite active during and after prolonged precipitation events, which may double the freshwater load to the coastal area (Sekulić and Vertačnik, 1996). Furthermore, the climate of the region, particularly of Rijeka Bay, is characterized by significant precipitation driven by orography (Gajić-Čapka et al., 2015).
2.2 The field experiment
NAdEx 2015 was carried out between late autumn 2014 and summer 2015. The primary goal of the experiment was to study the DWF in the coastal northeastern Adriatic, which commonly occurs between January and March (Janeković et al., 2014). The temperature, salinity and current data were collected using several instruments and observing platforms deployed in the area (Fig. 1). The entire experiment was accomplished through the contributions and collaborative work of several research institutions: the Institute of Oceanography and Fisheries, Ruđer Bošković Institute, Geophysical Department of the Faculty of Science of the University of Zagreb, Meteorological and Hydrological Service, all from Croatia, and the National Institute of Oceanography and Experimental Geophysics, Italy. Thus, this study represents a unique effort in the Adriatic that may serve as a good example for future research activities in the region.
Currents over the water column were measured at stations A1 to A9 (Fig. 1) placed at the respective depths of 60, 83, 52, 56, 83, 89, 48, 48 and 46 m. RDI acoustic Doppler current profilers (ADCPs) were deployed between late November 2014 and early August 2015 (stations A7, A8, A9) or early July (station A4), while Nortek ADCPs were deployed between early December 2014 and mid-August 2015 (stations A1, A5, A6) or late May (station A2). The ADCP at station A3 malfunctioned after only 1 week of operation and did not measure any data after that. A Sea-Bird 911 conductivity–temperature–depth (CTD) probe accompanied the ADCPs at stations A3, A4, A7, A8 and A9 and provided the bottom temperature and salinity series at the respective depths of 52, 56, 48, 48 and 46 m between late November 2014 and early August 2015. Vertical profiles of temperature and salinity data were acquired by a Sea-Bird SBE 25 probe at 19 CTD stations during two cruise legs. The leg 1 cruise was carried out between 3 and 6 December 2014, and the leg 2 cruise was carried out between 26 and 29 May 2015. A Teledyne Webb Research Slocum glider was operated along the transect off Kvarner Bay in a campaign lasting from 24 to 27 February 2015, while an ARVOR-C profiling float was deployed on 19 February 2015 in the northern part of Kvarner Bay and was recovered on 15 March 2015 on the Istria coast near the entrance of the bay. The ARVOR-C profiling float regularly profiled the entire water column every 3 h (Gerin et al., 2015). The potential density anomaly (PDA, reference pressure equalling zero) was computed from the temperature and practical salinity data following TEOS-10 algorithms (described at http://www.teos-10.org). The complete setting of the experiment is illustrated in Fig. 1.
2.3 The modelling system and its setup
The atmosphere–ocean modelling system covering the entire Adriatic Sea was used as the NAdEx 2015 parent numerical model. The atmospheric part of the system is based on a hydrostatic version of the ALADIN numerical weather prediction (NWP) model used by the Meteorological and Hydrological Service of the Republic of Croatia (Tudor et al., 2013, 2015). The model is operationally integrated four times per day and has 37 vertical sigma levels and 8 km horizontal resolution, except for winds, which are dynamically downscaled to 2 km (Ivatek-Šahdan and Tudor, 2004). All variables were provided with a time step of 3 h. Although the bora wind may have substantial variability in periods from several minutes to a few hours, the previous modelling studies that used 3 h ALADIN/HR forcing provided reliable results (e.g. Janeković et al., 2014). The model is initialized with a 3D-Var run at 8 km resolution using the data available through the Global Telecommunication System (GTS) and local data exchange (Stanešić, 2011). The model uses sea surface temperature (SST) fields from the IFS (Integrated Forecast System) operational forecast run in the ECMWF (European Centre for Medium-Range Forecasts). These SSTs have a positive bias towards in situ measurements during the winter. Bias is however much lower in the open Adriatic when compared to the SST satellite observations. The mentioned bias affects the precipitation maxima (Ivatek-Šahdan et al., 2018) but does not significantly affect the wind speed, which is controlled by the surrounding topography (Tudor et al., 2017). Wind gusts were computed from ALADIN/HR output following the formulas in Brožkova et al. (2006), which have been tuned for oceanographic simulations in the Mediterranean. The ALADIN/HR simulations have been verified in the coastal northeastern Adriatic during severe bora events (Tudor and Ivatek-Šahdan, 2010; Tudor et al., 2013).
For the ocean part of the model, the Regional Ocean Modelling System (ROMS) was used. ROMS is a 3-D hydrostatic non-linear free-surface σ-coordinate time-splitting finite-difference primitive equation model (Shchepetkin and McWilliams, 2005, 2009). The horizontal resolution of the Adriatic model is 2 km, and there are 20 sigma layers in the vertical, following the studies by Janeković et al. (2014) and Benetazzo et al. (2014), which satisfactorily reproduced the DWF in the northern Adriatic. The open boundary conditions at the Otranto Strait (free surface, temperature, salinity and velocity) are taken from the Adriatic Regional model (AREG, Oddo et al., 2006), with a sponge layer at the boundary. The Flather scheme was used for the barotropic velocities, and a combination of Orlanski-type radiation boundary conditions with nudging (Marchesiello et al., 2001) was used for the baroclinic velocities and tracers (temperature and salinity). The long-term stability of the model run has been ensured by smoothing the bathymetry using a linear programming technique (Dutour Sikirić et al., 2009) that suppresses the horizontal pressure gradient errors that occur over complex bathymetries with steep slopes, such as in the Adriatic Sea, and during multi-year integrations (Haidvogel et al., 2000). The ALADIN/HR surface variables were introduced to the ROMS via bulk parameterization (Fairall et al., 1996). The most recent river discharge climatology was imposed at the freshwater point sources following Vilibić et al. (2016a) data, without changing the ambient temperature. More details on the modelling system can be found in Janeković et al. (2014) and Vilibić et al. (2016a).
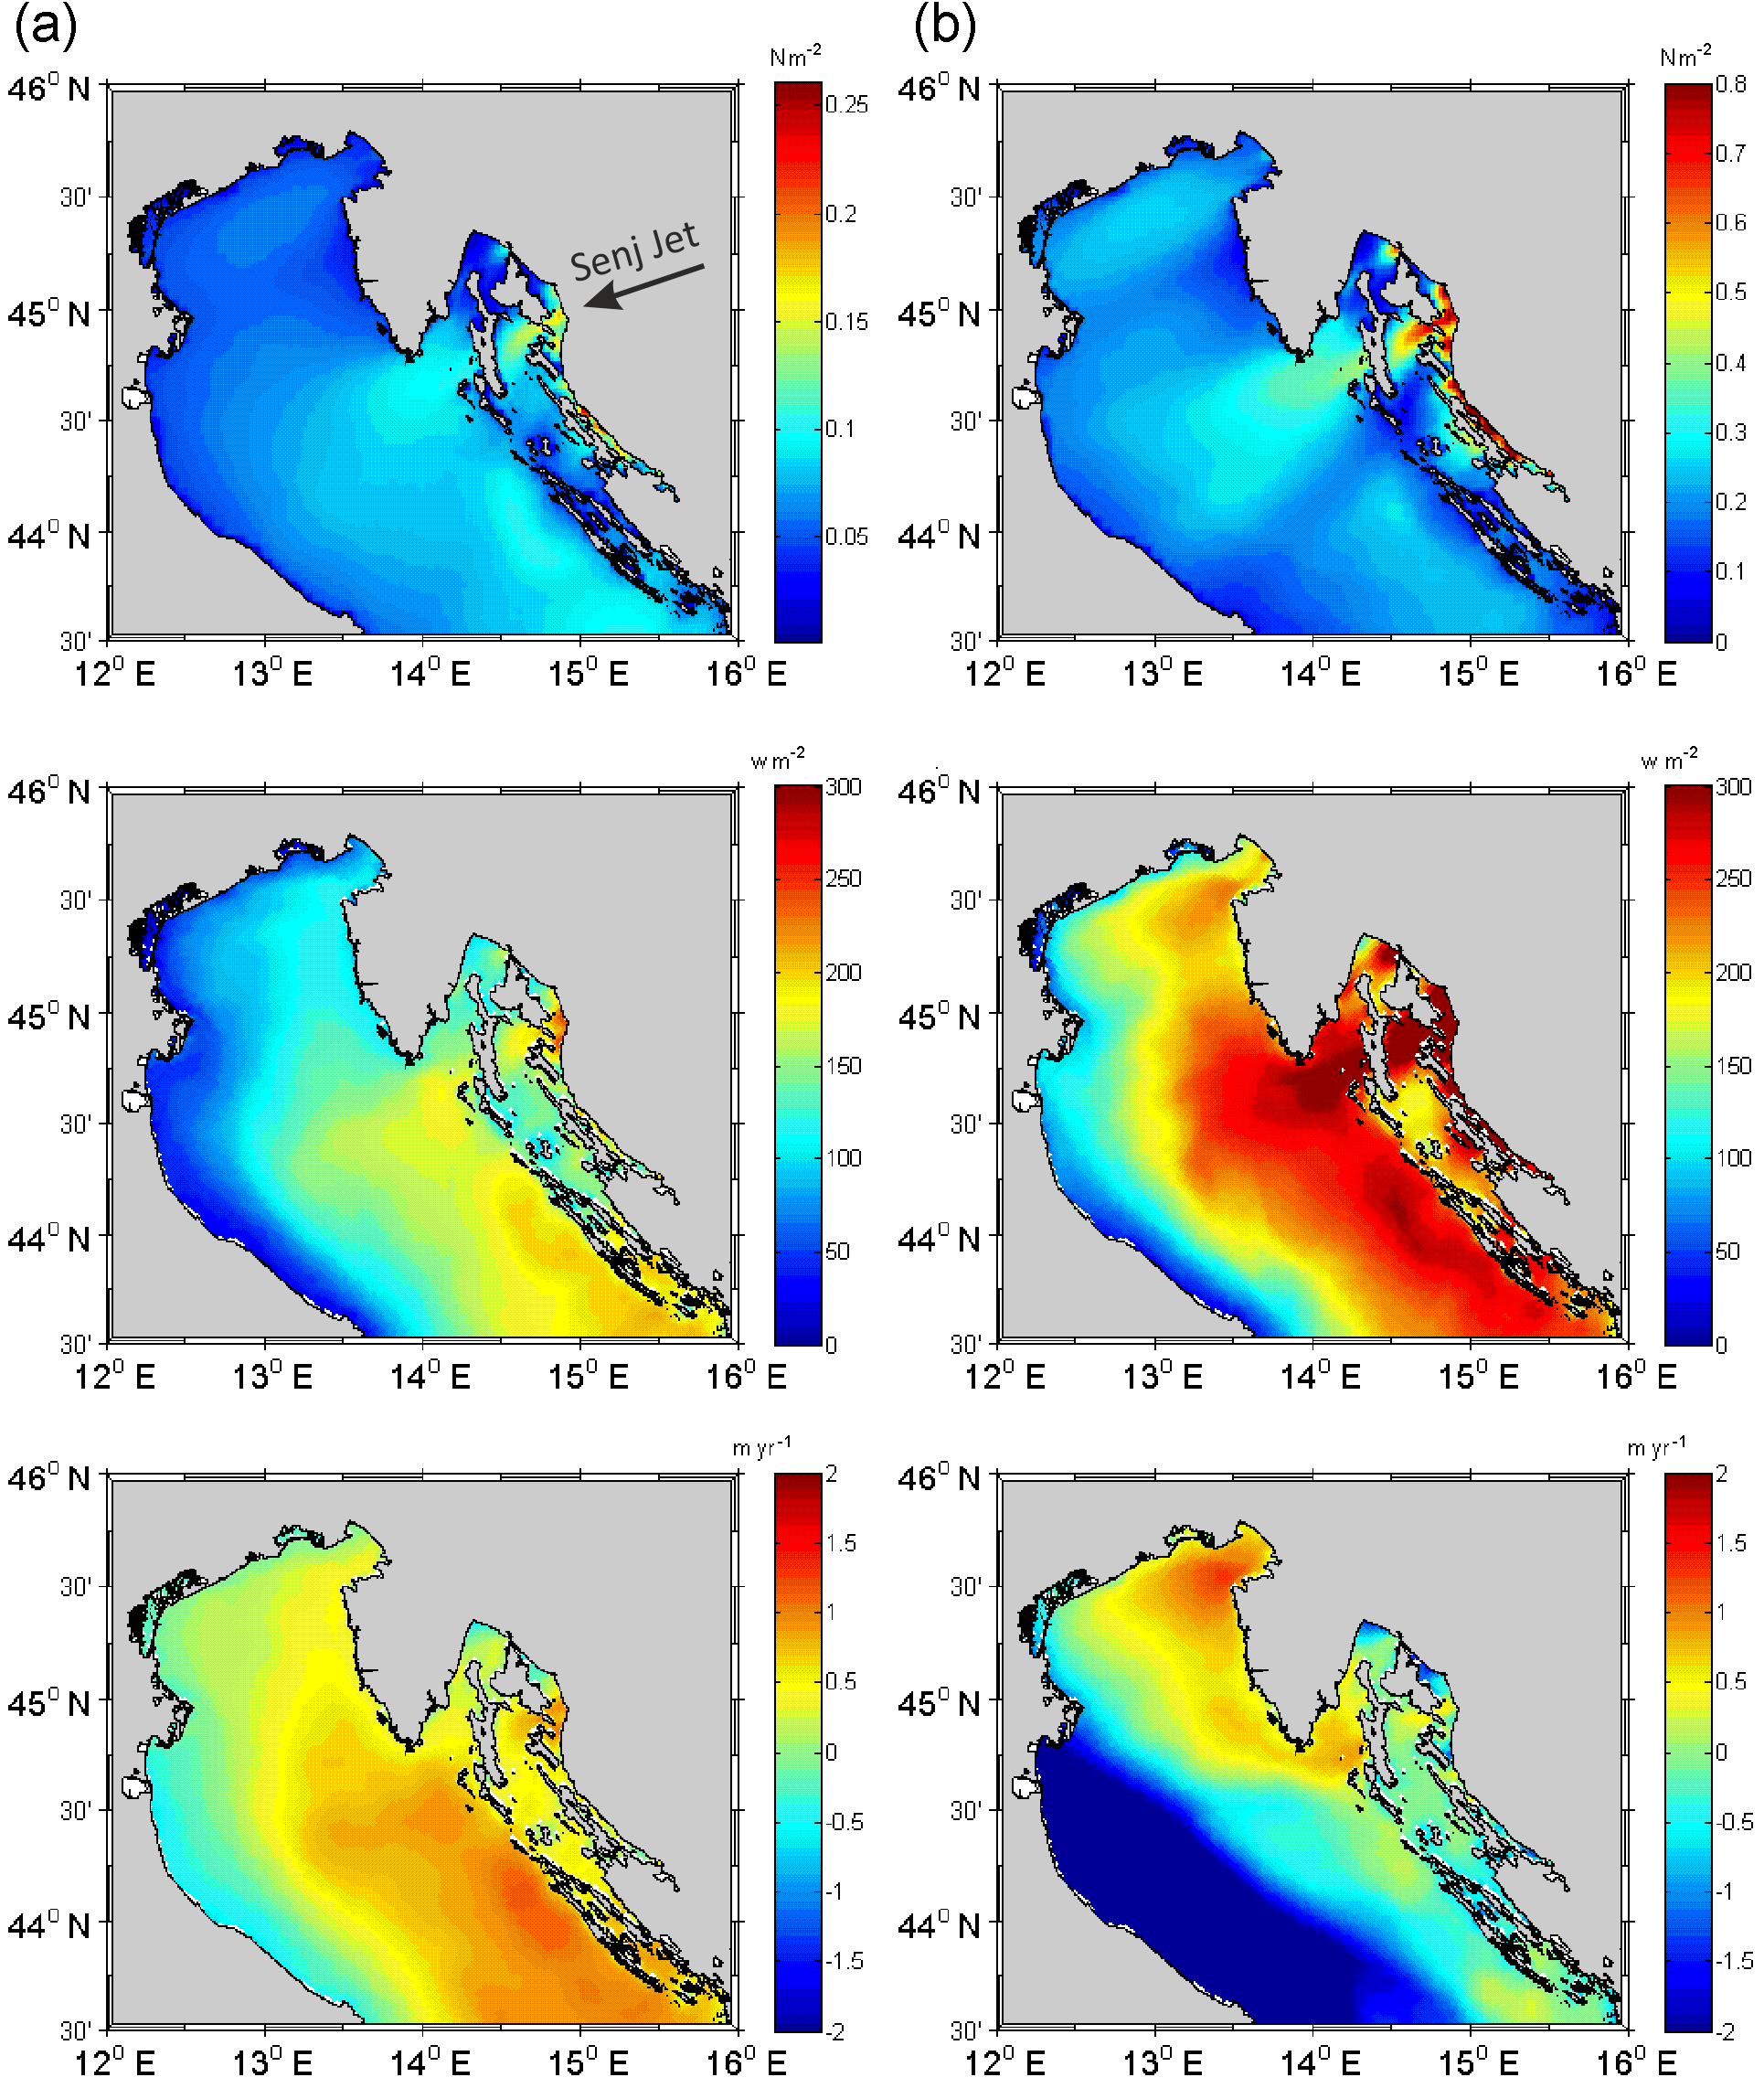
Figure 2Wind stress module (top), net heat flux (middle) and water (E−P) flux (bottom) in the middle and northern Adriatic averaged (a) between 15 January and 15 March 2015 and (b) over all bora episodes occurring between 15 January and 15 March 2015. Bora episodes are defined by a wind speed higher than 15 m s−1 blowing along the major wind axis (from ENE) at the G1 location.
In addition to the Adriatic model, a nested ocean model (also ROMS) was imposed on the NAdEx 2015 region to properly reproduce its complex bathymetry (Fig. 1). The nested domain was tilted by 45∘ to follow the orientation of the area. The nesting was performed using a 1 : 4 ratio in the horizontal – thus the nested model had a horizontal resolution of 500 m – and 20 sigma levels were maintained in the vertical. The nested ocean model was forced with the same ALADIN/HR operational fields as the parent model. Free-slip conditions were imposed at the boundaries.
The parent modelling system has been operationally integrated since 1 January 2008, while the nested simulation was run between 1 October 2014 and 30 September 2015, covering the experimental NAdEx 2015 period. Verification of the parent model was performed for the winter of 2012 (Janeković et al., 2014; Vilibić et al., 2016a). Basin-wide negative salinity bias has been found to exist and was presumed to come from the lateral boundaries of the AREG model (Janeković et al., 2014). In the AREG model, these boundaries exhibit basin-wide over-freshening coming from the old river climatology by Raicich (1994), thus also influencing our parent simulations. However, the model was found to be appropriate for the reproduction of thermohaline properties in the area (Vilibić et al., 2016a) and quantification of the DWF in both the open northern and coastal northeastern Adriatic (DWF sites 1 and 2 in Fig. 1).
The winter of 2015 (December 2014 through March 2015) was characterized by warmer-than-average conditions over the NAdEx area compared to the baseline climatological period of 1961–1990 (MHS, 2015, 2016). According to these reports, the highest positive monthly anomalies (91–98 percentile) in 2015 in comparison to the baseline period were recorded in December and January, followed by average temperatures in February and warm conditions (75–91 percentile) in March. The DJFM precipitation values (measured only above land) were close to the climatological values, with the highest positive anomalies measured in February. Regarding the average January–February net heat fluxes over the NAdEx area (as delimited by the nested domain boundaries in Fig. 1) – these two months are chosen as the DWF dominantly occurs at that time (Beg Paklar et al., 2001; Vilibić and Supić, 2005) the winter of 2015 may be classified as normal with respect to the other winters between 2008 and 2015. More precisely, the cumulative January–February net heat losses equalled 0.80 GJ m−2, which is slightly higher than the average for the 2008–2015 period (0.76 GJ m−2), approximately 50 % less than in the winter of 2012 (1.20 GJ m−2) and almost 2 times greater than in the winter of 2014 (0.49 GJ m−2).

Figure 3Temperature, salinity and PDA values measured at the Kvarnerić Channel transect during (a) the leg 1 cruise between 3 and 6 December 2014 and (c) the leg 2 cruise between 26 and 29 May 2015, together with model-to-observation difference (bias) in temperature and salinity estimated for the (b) leg 1 and (d) leg 2 cruises.
Several cooling events occurred during the winter of 2015, of which three bora episodes – preceding the new year, in early February and in early March – were particularly severe. The first severe bora episode lasted for several days (between 28 December 2014 and 1 January 2015), with gusts stronger than 50 m s−1 in the Velebit Channel and air temperatures falling below 0 ∘C. The bora event between 4 and 7 February 2015 was particularly strong over the NAdEx area, peaking during the night of 5/6 February with measured wind gusts of approximately 60 m s−1 in the northern Velebit Channel. Another strong bora event occurred along the eastern Adriatic coast 1 month later. However, the latter event was particularly pronounced over the middle Adriatic and southern part of the Velebit Channel, where the wind gusts peaked on 5 March with values of approximately 55 m s−1.
To better understand the impact of bora wind on the northeastern coastal Adriatic, we compared wind stress, net heat flux and water flux variables (all originating from the ALADIN model) averaged over all bora events with those averaged between 15 December 2014 and 15 March 2015 (Fig. 2). Herein, a bora event is defined as a period during which the wind blows from the ENE and exceeds 15 m s−1 at the ALADIN grid point off Senj (location G1 in Fig. 1). ENE represents the predominant direction of bora in that area (Zaninović et al., 2008). The maximum wind stress is modelled within the Senj Jet (marked by an arrow in Fig. 2), and the area of wind stress stretches from Kvarner Bay towards the western shore, which is the exact location where the major wind jet and frontal ocean zones are commonly found (Pullen et al., 2007; Beg Paklar et al., 2008; Kuzmić et al., 2015). The largest bora-driven heat loss was documented in the Velebit Channel and within the offshore jets, again reaching a maximum in the Senj Jet. Heat losses strongly decrease towards the western Adriatic coastline. Such bora-driven heat loss distribution largely follows the distribution associated with the extreme bora wind outbreak of the winter of 2012 (see Fig. 4 in Janeković et al., 2014). The pattern of bora heat losses also resembles the average net heat losses between 15 December 2014 and 15 March 2015, indicating that cooling of the northern Adriatic waters dominantly occurs during bora episodes.
As it is strongly dependent on wind speed and humidity, the evaporation patterns (not shown) driven by bora wind follow the net heat loss patterns, with maximum rates exceeding 10 mm day−1 off Senj. However, an interesting pattern is found in the water flux (E−P) associated with the bora episodes, with the highest negative values in the open Adriatic and particularly along the western coastline. Negative values may also be found in the NAdEx 2015 area. This implies that the bora wind – as defined using a single station at the core of the strongest jet – is associated with precipitation that appears at the back side of a cyclone, decreasing its rates towards the northwest, where maximum water uptake has been modelled.
We can conclude this section on atmospheric conditions by saying that, despite three strong bora events, no exceptional cooling events were observed during the winter of 2015. This gives us an opportunity to study coastal northeastern Adriatic dynamics during average wintertime atmospheric conditions.
The temperature and salinity data measured between 3 and 6 December 2014 (the leg 1 cruise) along the transect stretching over the NAdEx 2015 area (stations 1 to 19) exhibit a predominant two-layer thermohaline structure (Fig. 3a), with warmer (> 16 ∘C) and less-saline (< 37.0) waters in the surface and intermediate layers to depths of approximately 50–60 m. These depths were characterized by a sharp thermocline, under which a pool of colder (13–14 ∘C) and more saline (∼ 38.0) waters resided. The pool had a substantially higher density (potential density anomaly, PDA > 28. kg m−3) than the waters residing above (< 27.8 kg m−3). The thermocline and halocline followed each other in the first third of the transect (up to station 6), after which the halocline formed at shallower depths. The salinity maximum that stretched over the entire water column at stations 11 to 13 indicates an inflow of saline open Adriatic waters through connecting channels where the A3 and A4 ADCPs were moored.
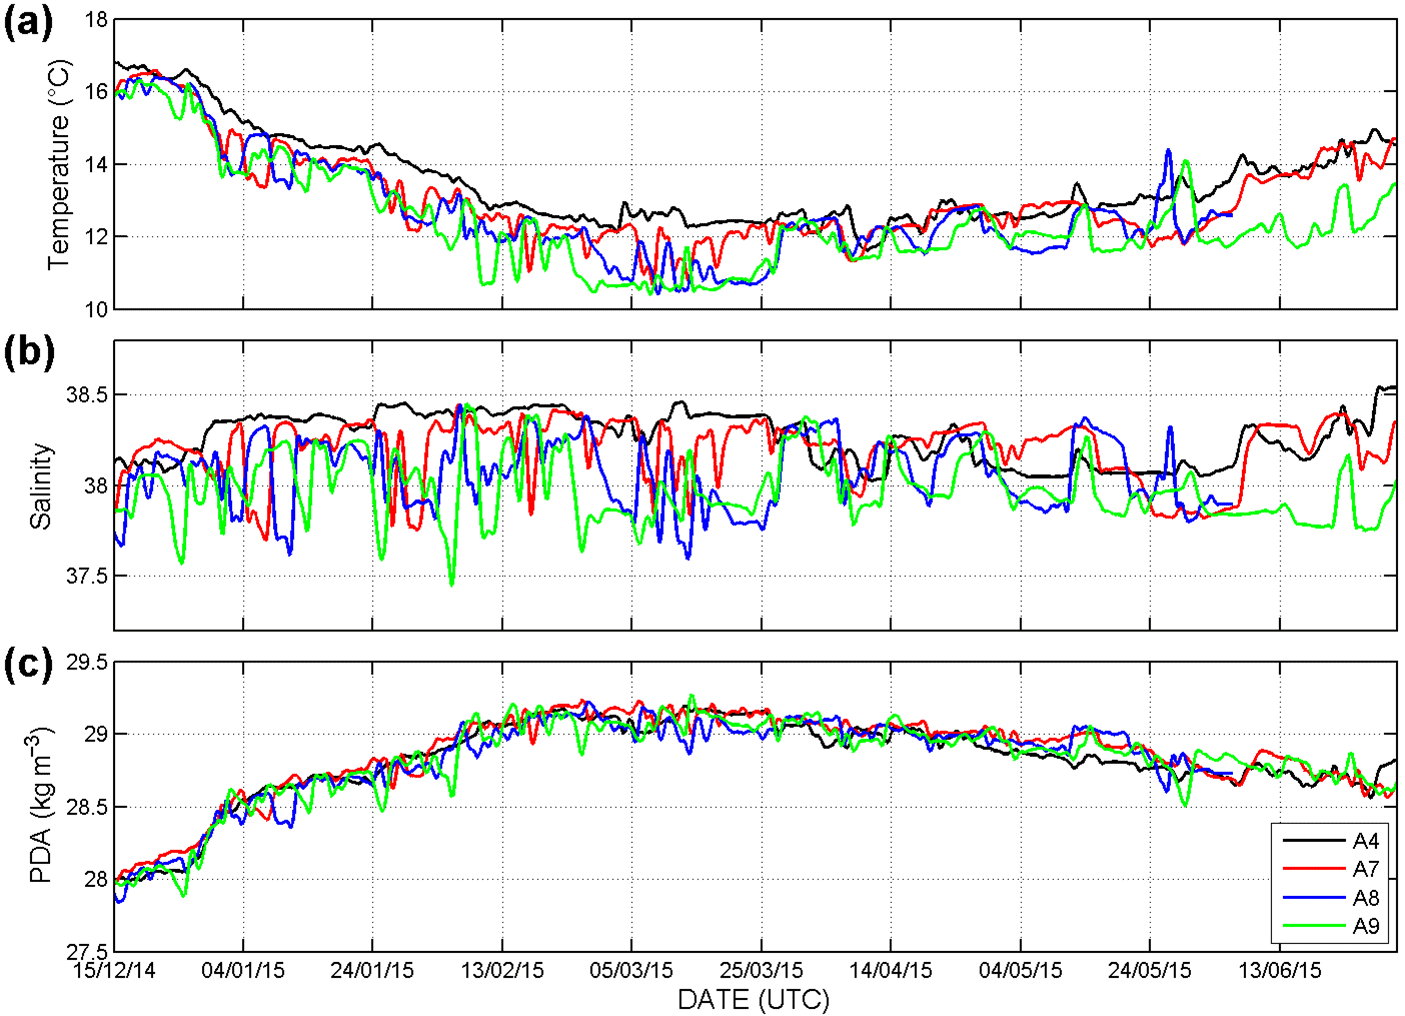
Figure 4(a) Temperature, (b) salinity and (c) PDA series measured at the bottom of stations A4, A7, A8 and A9. The series are filtered using a low-pass Kaiser–Bessel filter with a cut-off period at 33 h.
During the leg 2 cruise 6 months later, which was executed between 26 and 29 May 2015, the two-layer structure was still evident from the temperature data (Fig. 3b), but this time it was driven by seasonal heating during the spring (Buljan and Zore-Armanda, 1976). The thermocline was positioned at depths between 20 and 30 m. However, the salinity was homogenized over the entire transect, with substantially higher values (37.8–38.0) than observed during the leg 1 cruise, peaking again at stations 11 to 13. The salinity changes between the leg 1 and 2 cruises indicate an advection of high-salinity waters from the open Adriatic towards the entire NAdEx 2015 area, which may be a result of the DWF-driven thermohaline circulation, as found throughout the Adriatic Sea (Orlić et al., 2006) and in the Gulf of Trieste (Mihanović et al., 2013). The PDA distribution followed the temperature distribution, with much higher values present in deep layers (29.0–29.1 kg m−3) than during the leg 1 cruise. The latter indicates that, despite the lack of extreme cooling events, DWF did occur during the winter, although the observed temperatures were much higher and the salinities were lower than during the extreme winter of 2012 (Mihanović et al., 2013).
The thermohaline properties measured at the bottom of connecting channels, over which the transport between the coastal and open Adriatic area happens, reveal the rate of the wintertime cooling that occurred in the northern Adriatic (Fig. 4). A continuous decrease in temperature (Fig. 4a) from the beginning of the experiment (early December) to the end of March was recorded at all stations, with a weak step-like structure presumably associated with strong bora events. At station A4, the bottom temperatures were higher and did not decrease below 12 ∘C. The lowest temperature was observed in the northwestern part of the entrance to Kvarner Bay, at station A9, where a minimum of approximately 10.5 ∘C was reached in early February and remained through March. By contrast, these temperatures were observed at the neighbouring stations A8 and A7 1 month later, indicating a presence of a complex circulation and a deep thermohaline front within the bay. In support of the existence of the front, the differences between the temperature and salinity series measured at A7, A8 and A9 between 1 February and 31 March 2015 (in terms of their averages and variability assessed by applying a t test) are significant at the 99 % level. The existence of the wintertime thermohaline front through the water column can be clearly seen from the glider measurements performed off Kvarner Bay on 25 February (Fig. 5) when strong bora conditions were present in the area. However, the front weakened the day after, when the glider returned over approximately half of the same track (turnover occurred on 26 February around 02:00 CET). Kokkini et al. (2017) ascribed the variability in the front to wind forcing, where strong bora wind favours a sharp front. This front has also been observed and investigated during previous wintertime campaigns (Lee et al., 2005; Poulain et al., 2011).

Figure 5(a) Temperature, salinity and PDA profiles measured by Slocum glider between 24 and 27 February 2015 in front of Kvarner Bay, together with (b) model-to-observation difference (bias). Glider trajectory is plotted in the inset and Fig. 1. Grey blocks denote areas of no measurements.
The mean bottom salinity (Fig. 4b) values decreased northwestward, from station A4 to station A7, and again across the entrance to Kvarner Bay to station A9. In addition, strong salinity variability at the daily and weekly scales was embedded into the series, varying between 37.5 and 38.5 at stations A7 to A9. Such a pronounced variability indicates the presence of a thermohaline front that changes position over time. The variability was particularly strong during the winter (January–March 2015), but decreased during the spring. Although there were monthly variations, an overall increase in salinity was recorded at all stations between mid-December 2014 and early February 2015. The temperature and salinity changes along the outer NAdEx 2015 area are reflected in the PDA values (Fig. 4c), which increased from mid-December (∼ 28.0 kg m−3) to mid and late February (∼ 29.2 kg m−3). The maximum PDA values were sustained until late March, which is presumably associated with the near-bottom outflow or inflow of dense waters. The PDA values slowly decreased during the spring.
Pronounced spatial and temporal changes in the thermohaline properties of Kvarner Bay may be quantified by analysing the profiling float data (Fig. 6). The ARVOR-C float temperature and salinity profiles obtained from the inner part of Kvarner Bay show a weak stratification over the water column, except at the very bottom, where a thin layer of a few metres with substantially higher temperatures (∼ 0.8 ∘C) and salinities (∼ 0.5) was detected. This thin, near-bottom layer was not present over western central Kvarner Bay where the float was transported between 23 and 25 February (for the position of the float, see the inset and Fig. 1). The layer was, however, present at the outer western part of the bay where the float drifted between 3 and 5 March. The PDA values of this bottom layer reached 29.4 kg m−3, which were greater than the PDA values measured at the A stations or by the CTDs by approximately 0.3 kg m−3.

Figure 6(a) Temperature, salinity and PDA profiles measured between 19 February and 5 March 2015 by the ARVOR-C profiling float in Kvarner Bay, together with (b) model-to-observation difference (bias). Profiling float trajectory is plotted in the inset and Fig. 1. Grey areas denote no measurements.

Figure 7Mean residual currents and ellipses of standard deviations measured (red) and modelled (blue) at A1 to A9 stations between 1 February and 1 April 2015. Orientation of channel bathymetries in which stations have been moored is indicated by the red line in the left lower corner.
The assessment of the wintertime ADCP data (Fig. 7) revealed a substantial baroclinic component atop the barotropic circulation at all stations during 1 February–1 April 2015. Weaker currents at station A9 and strong outflow in the surface layers at stations A7 and A8 indicate the presence of an anticyclonic curl at the entrance of Kvarner Bay. The pattern in currents also resembles the patterns of the local wind stress and wind curl, which are pronounced off the southern tip of Istria (Pullen et al., 2003; Grubišić, 2004). Near-zero average currents and high standard deviation ellipses in the bottom layer of station A9 indicate occasional water inflow to Kvarner Bay in near-bottom layers. Near the bottom of stations A7 and A8, the mean flow is weak yet changeable over time, suggesting an interplay between dense waters coming from the coastal area and those coming from the northern Adriatic shelf in the Kvarner Bay area. At the same time, much stronger currents were observed in the surface and intermediate layers, indicating the predominant outflow of waters from the NAdEx area towards the open Adriatic. Going to the southeast, at station A4, the measured currents were parallel to the coastline. However, as it was deployed too far from the connecting channel, this station indeed did not measure the interchange between the coastal and open Adriatic waters but the Eastern Adriatic Current, which may be strong in that region (Orlić et al., 2006). The currents measured at station A2 exhibit a strong baroclinic pattern, pointing to an exchange of waters between the open and coastal Adriatic through a narrow channel: an outflow current is present in the surface layer, and an inflow current is present near the bottom. However, these currents are strongly affected by local bathymetry, probably resembling the effects of both a very narrow connecting channel (approximately 600 m in width) and the Eastern Adriatic Current modulated by the cape of Veli Rat (approximately 2 km south of station A2). Finally, the current data measured at station A1 document the predominant inflow of the open Adriatic waters, mostly in the surface layer. The inflow is likely driven by the orientation of the channel and the incoming Eastern Adriatic Current. Interestingly, the wintertime baroclinic circulation, with a predominant outflow from the Velebit Channel in the surface layer and inflow in the bottom layer, is also maintained in the inner channels (stations A5 and A6). This particularly refers to the currents measured at station A6 located near the Senj bora jet, implying that the currents at this station are likely principally wind driven.
In summary, the observations point to (i) a pronounced baroclinic component and strong variability in wintertime circulation in connecting passages; (ii) strong thermohaline fronts in some areas (Kvarner Bay); (iii) existence of near-bottom thin layers of different water masses; and (iv) advection of saline waters from the open sea towards coastal waters during the early spring period.
The modelling system was validated against available observations. The verification of the CTD data collected over the leg 1 cruise (Fig. 3b) reveals an underestimation of the temperature in the surface layer and an overestimation of the temperature in deep layers, where a pool of cold and dense waters was observed (Fig. 3a). Oppositely, the salinity was overestimated in the surface layers and underestimated in the near-bottom layers. An overestimation in temperature and salinity in the shallowest southeastern part of the transect (stations 14–19) might be either due to submarine springs that discharge freshwater from the neighbouring freshwater lake to the sea and are not introduced to the model or due to water mass advection from the southeast. Altogether, the model did not properly reproduce the observed two-layer structure, but rather reproduced a much more homogenized water column without a dense-water pool in the deepest parts of the NAdEx area. The thermohaline properties that were modelled during the leg 2 cruise (Fig. 3d) show better agreement with the observations, particularly salinity, where the bias is approximately 3 times lower than that for the leg 1 cruise. This result is particularly applicable to the surface layer (Fig. 8b). The temperature bias (Fig. 8a) was also smaller during the leg 2 cruise. However, a drawback was present in the reproduction of the thermocline, as the largest root-mean-square error is present at the exact depths of the thermocline (15–35 m, Fig. 8a). Nevertheless, the model successfully recreated the presence of a cold and saline bottom layer, as well as a two-layer structure observed during the leg 2 cruise, and both the bias and root-mean-square error remained low near the bottom. The bottom PDA values that were modelled on the dates corresponding to the leg 2 cruise were higher (approximately 29.0 kg m−3) than those on the dates corresponding to the leg 1 cruise (approximately 27.8 kg m−3).
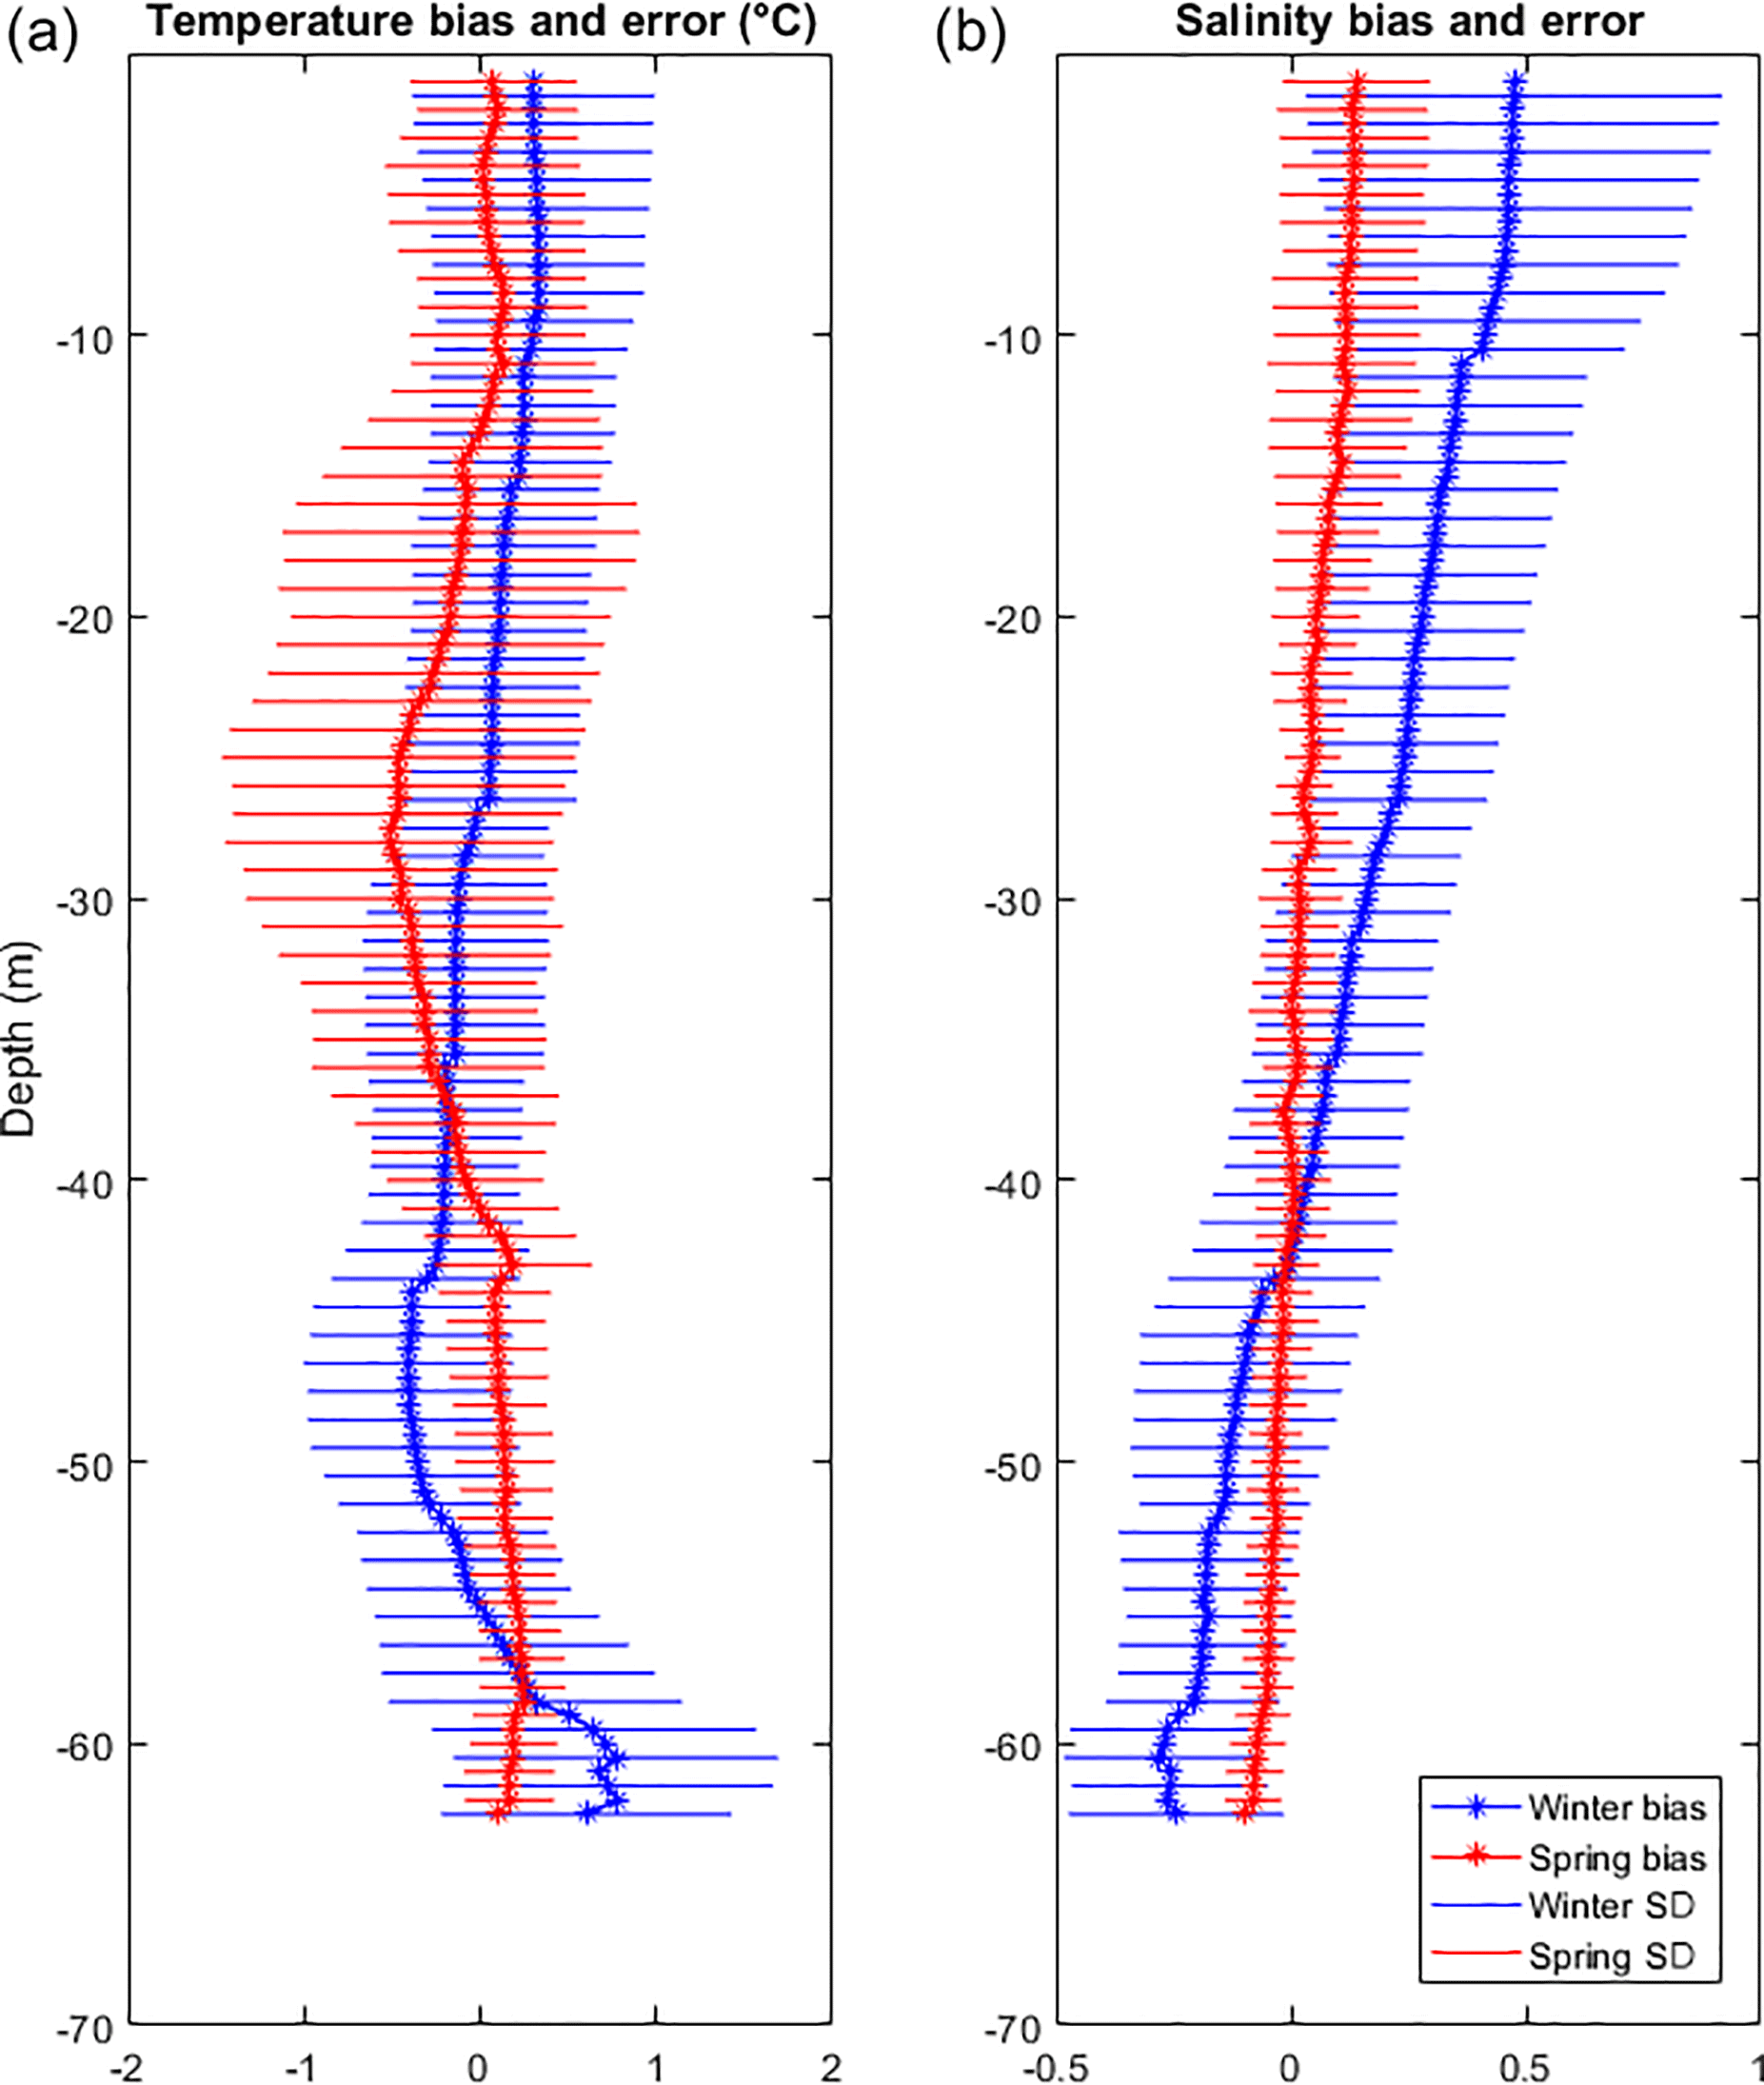
Figure 8Vertical profiles of the model-to-observation bias (thick vertical lines) and the root-mean-square error (horizontal lines) averaged over 1 m vertical bins over all CTD stations (1–19) during the leg 1 (winter, blue) and leg 2 (spring, red) cruises.
The results of the model verification performed on the float and glider data are shown in Figs. 5b and 6b. The float data were verified by the nested model simulation, while the parent model simulation was used to verify the glider measurements. An inspection of the results indicates that the model is able to reproduce the thermohaline properties observed inside Kvarner Bay. There are, however, several omissions: (i) both temperature and salinity show an increase in positive bias from the inner to the outer parts of the bay, and (ii) the model is not able to reproduce the narrow bottom density current. The latter omission is because the model does not have sufficient vertical resolution to reproduce such a thin bottom layer. Overestimation of both the temperature and salinity of the open Adriatic waters (positive bias) is visible in the model-to-observation differences along the glider pathway, where the parent model produces warmer and saltier water northwest from the measured thermohaline front. By contrast, the temperature and salinity biases were much lower in absolute values southwest of the front. These results imply two conclusions: (i) the position of the thermohaline front was not properly modelled, and (ii) the strength of the front in the model is much weaker than that captured by the glider observations.
The model-to-observation Q–Q plots of temperature and salinity that were constructed by comparing float, glider and CTD data (Fig. 9a, b) indicate that the temperature data were adequately reproduced over the inner NAdEx area (float and CTD), but not in the open Adriatic, i.e. in the area off Kvarner Bay (glider). The model overestimated salinity values less than 37.6 compared to the CTD measurements, while higher salinities were successfully reproduced. The salinities measured by the ARVOR-C profiler and glider were generally overestimated by the model over most of the percentile distribution, except for salinities of approximately 37.6 and the upper tail of the distribution (> 38.1). This particularly holds for salinities measured by the glider, i.e. for the salinities modelled by a lower-resolution parent model. In summary, the model reproduced the salinity in the interior of the basin best, while the reproductions were slightly worse in Kvarner Bay and much worse outside the bay.
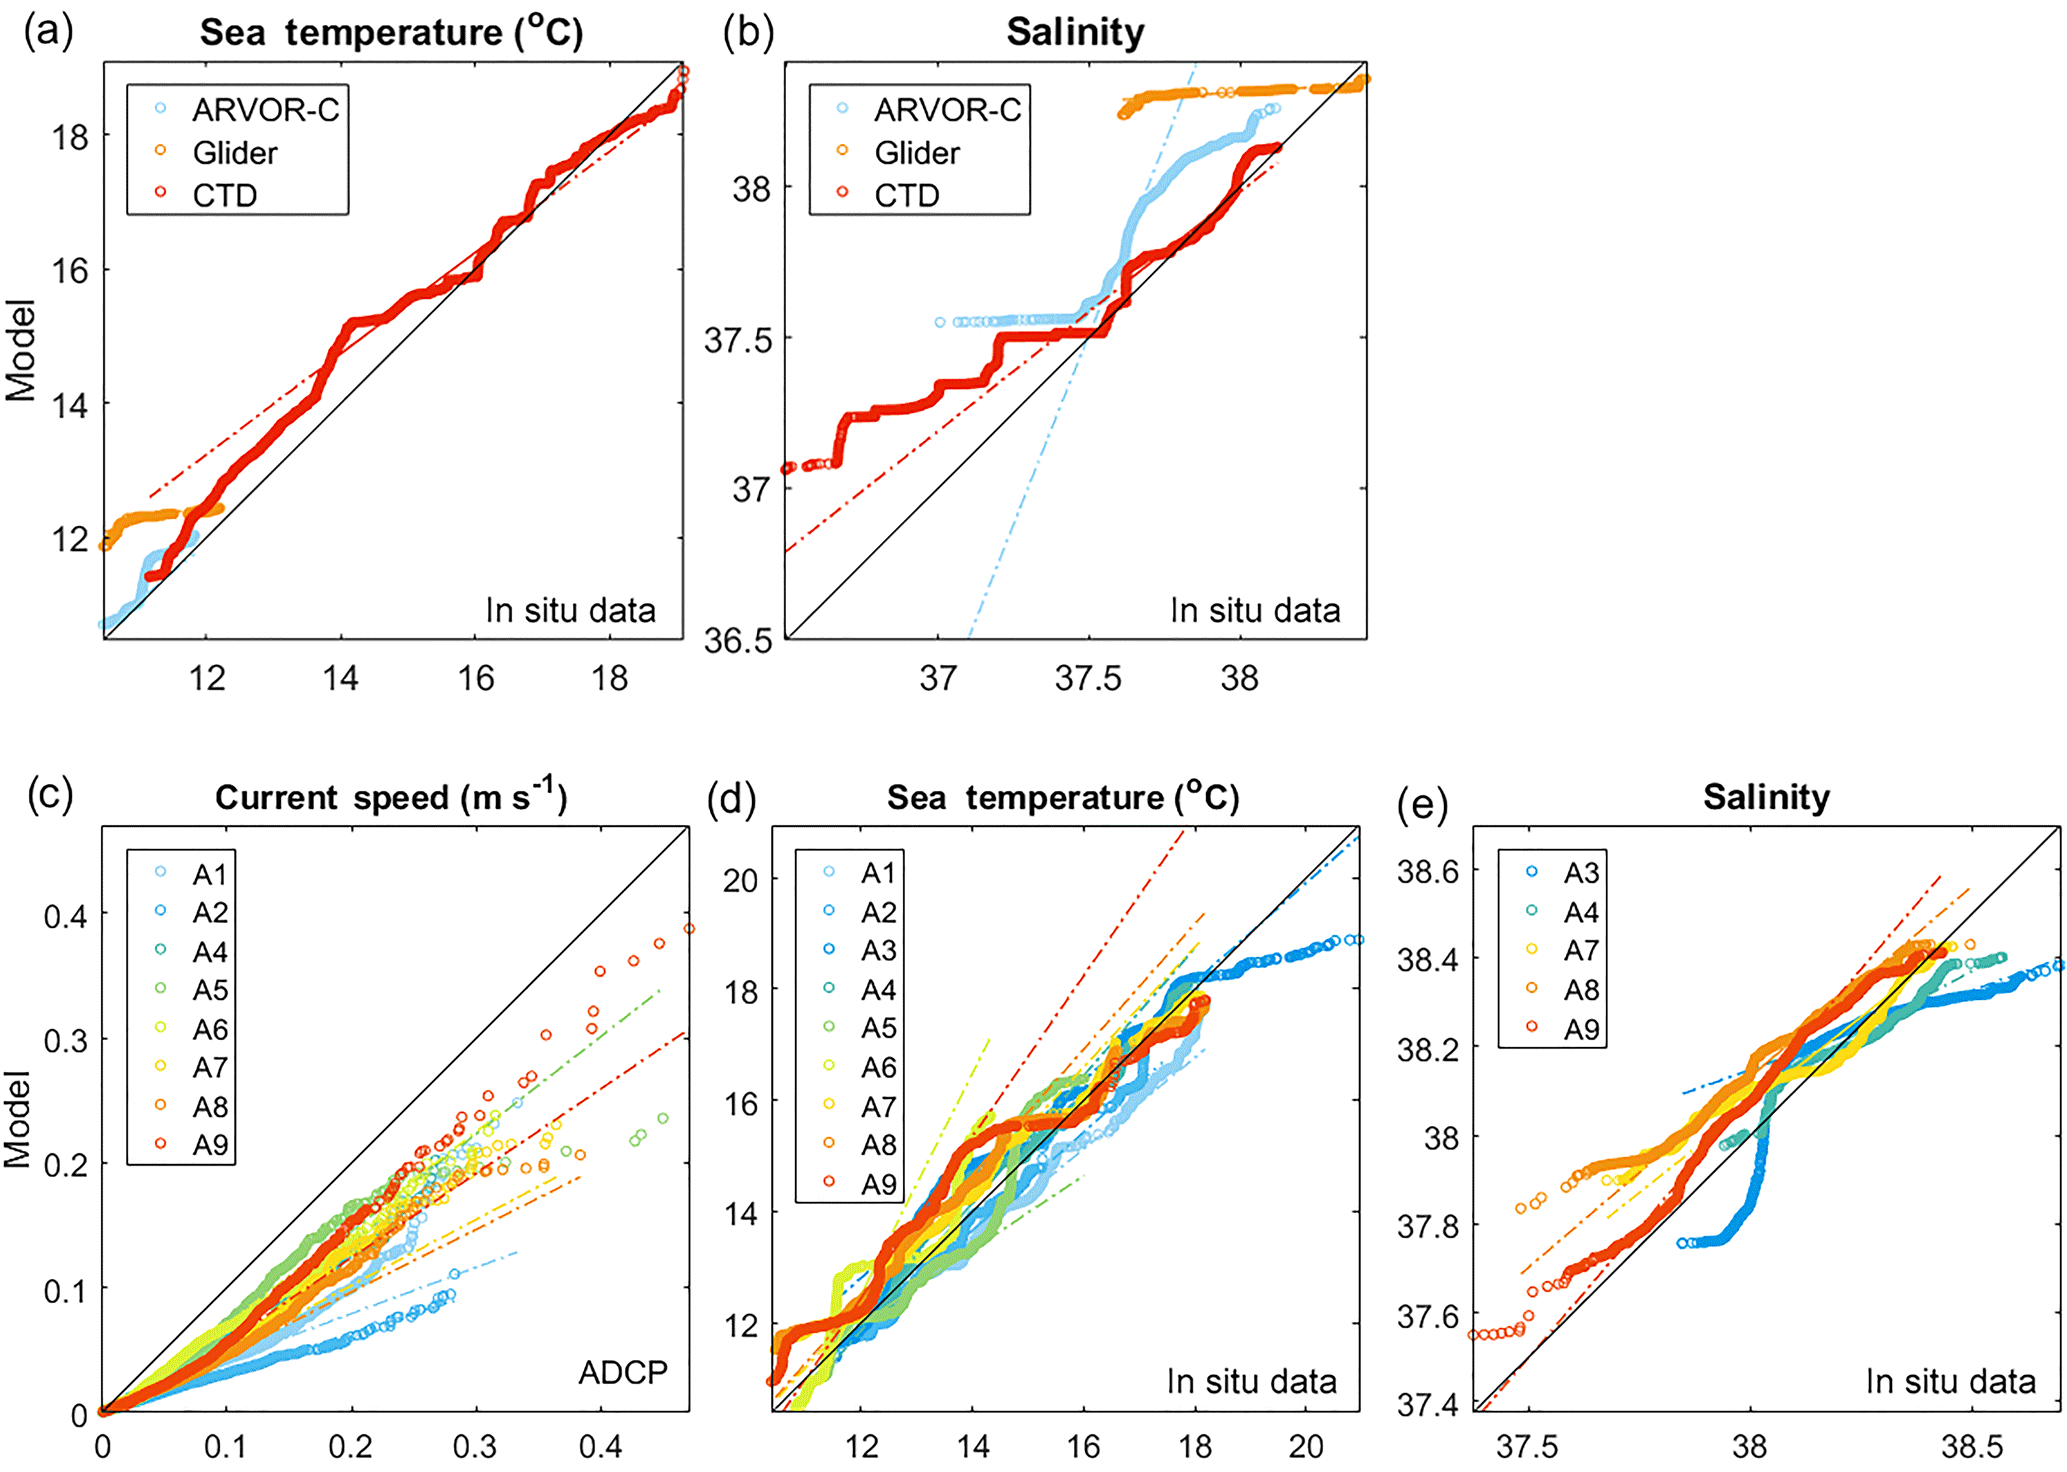
Figure 9Model-to-observation Q–Q plots of (a) temperature and (b) salinity measured by CTD, ARVOR-C profiling float and glider, and (c) current speed, (d) temperature and (e) salinity measured at the bottom of stations A1 to A9. In addition to the dataset distribution, dash–dot lines fit the second and third quartiles of each Q–Q distribution, while the black line corresponds to the model–observation line.
The comparison of the bottom temperature and salinity and the bottom current speed data as measured at stations A1 to A9 (Fig. 9c, d, e) indicates that the temperature and salinity were adequately reproduced by the model at all stations, differing by less than 1 ∘C and 0.3, respectively, except for a few observations. That also refers to the reproduction of thermohaline properties and changes in time (not shown), which exhibit low biases – particularly for temperature – at all stations over the entire measurement interval (not shown). The temperature trends matched the observations well; they were negative between December and February, then reached minimum temperatures in late February and March due to dense-water outflow, and finally showed a weak positive trend due to mixing and advection of open Adriatic waters. A significant decrease in the temperature and salinity properties in outer Kvarner Bay (stations A7 to A9) was also reproduced by the model. The biases are slightly larger at stations A7, A8 and A9, particularly in temperature (0.3–0.6 ∘C), as the model does not reproduce the thin near-bottom inflow of warmer and saltier waters in the outer part of Kvarner Bay as observed on the float data (Fig. 6a). However, these biases and the overall temperature, salinity and current biases at most of the A stations are smaller than the root-mean-square values (not shown). However, the current speeds were strongly underestimated by the model at all stations, between 50 and 80 % on average. There may be several reasons for those underestimations: (i) the horizontal resolution of the ocean model was too coarse, (ii) the resolution of the atmospheric model was insufficient and the bora-driven mesoscale variability was inappropriately reproduced or (iii) the boundary conditions were inappropriate. The reasons for this underestimation will be discussed in more detail in Sect. 7.
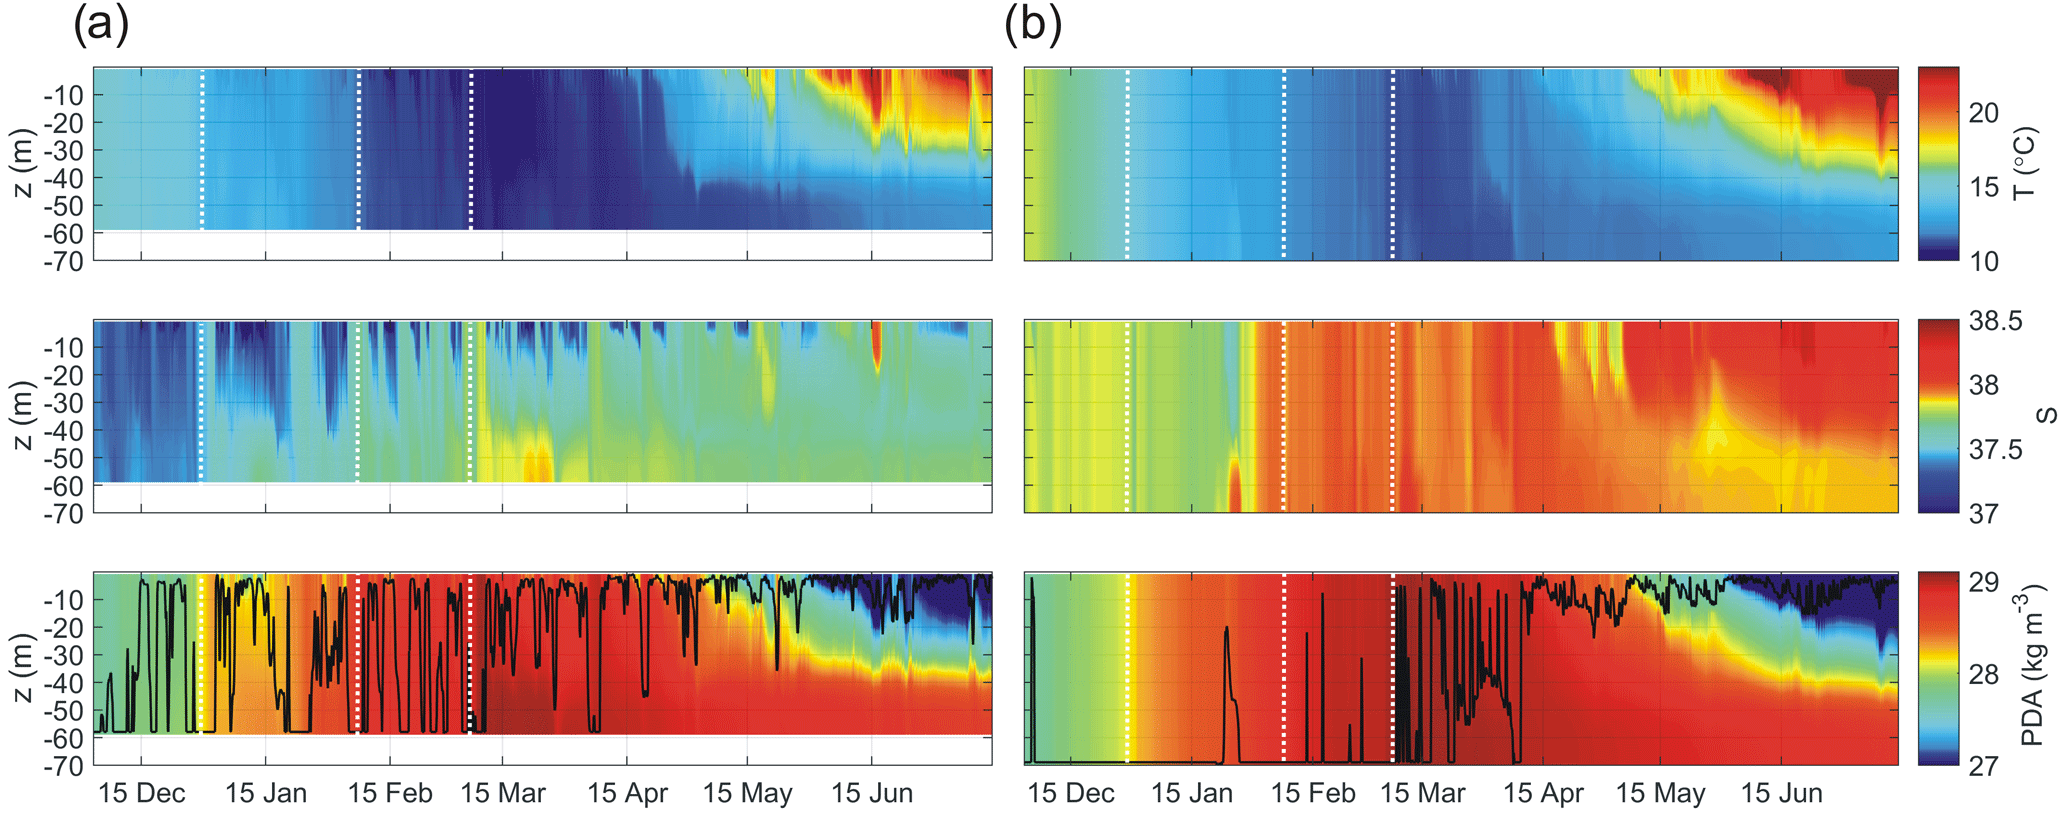
Figure 10Hovmöller plot of modelled temperature, salinity and PDA values at grid points (a) G1 and (b) G2. Vertical dashed lines indicate three severe bora episodes discussed in Sect. 3, while the thick black line in the PDA plot shows mixed-layer depth.
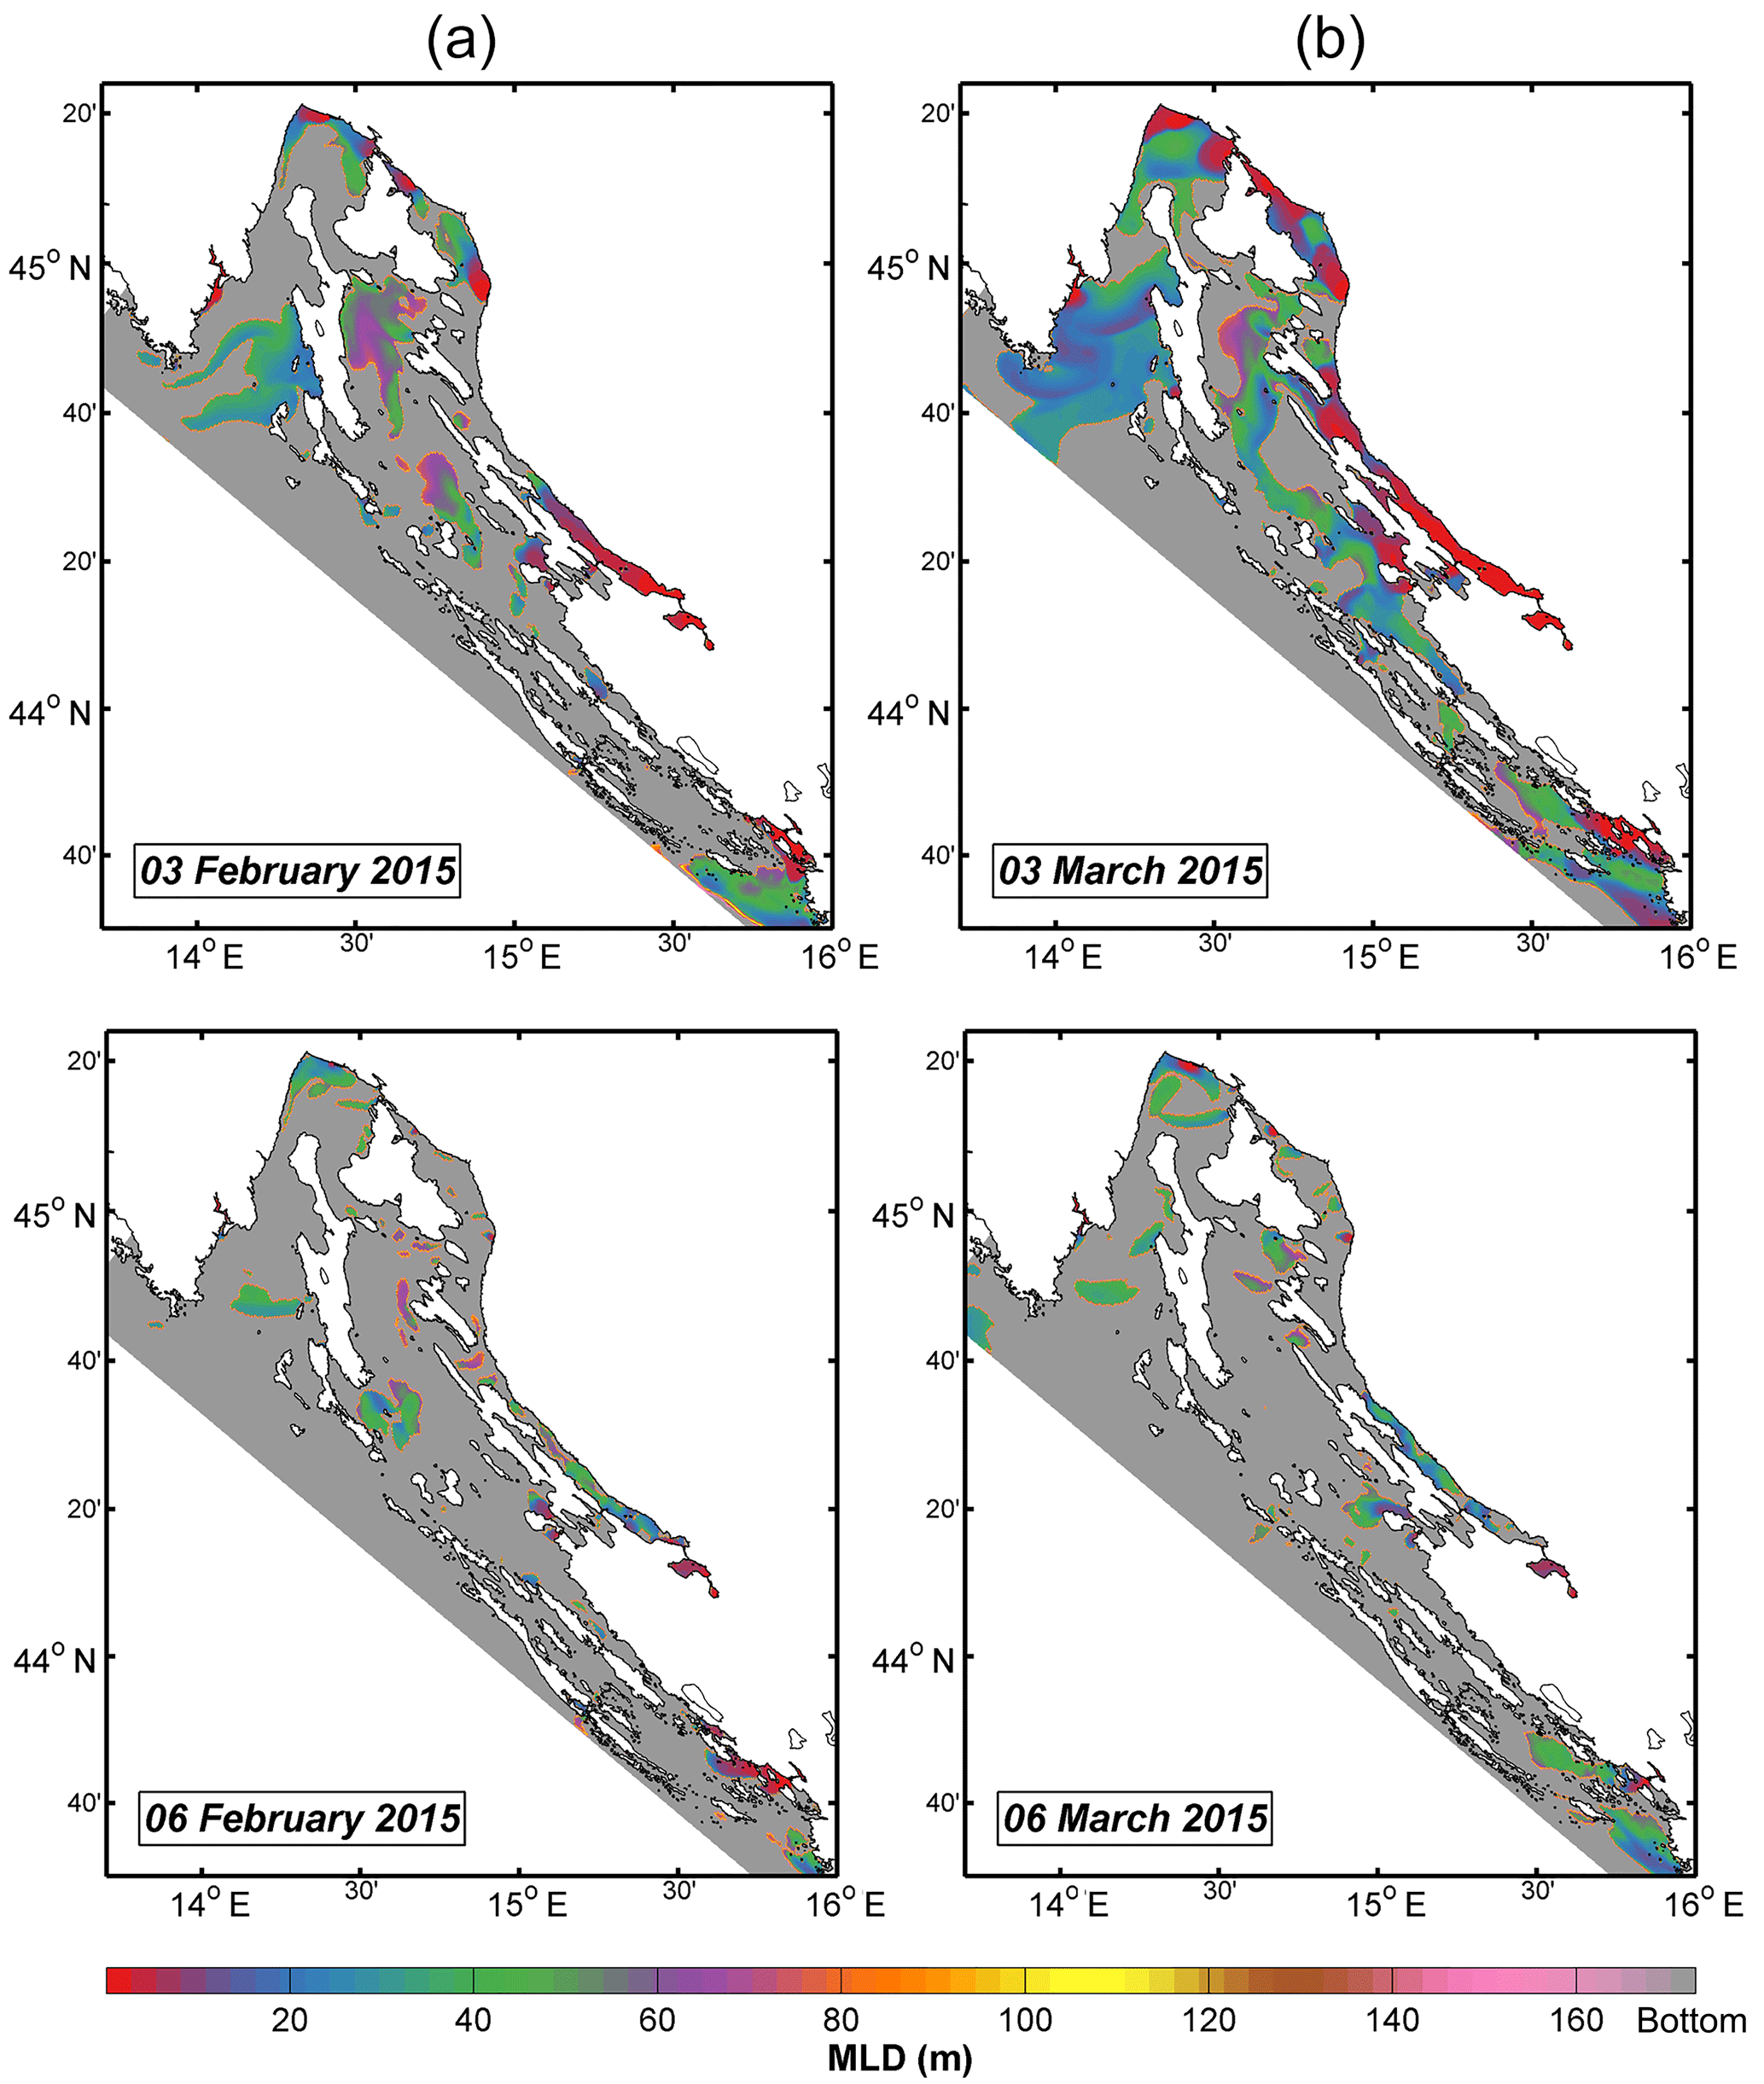
Figure 11Mixed-layer depth (MLD) computed for the nested model domain prior and after the major bora episodes: 3 and 6 February 2015 (left column) and 3 and 6 March 2015 (right column). Grey stands for MLD reaching the bottom.
Aside from the underestimation, the comparison of the mean currents and the associated standard deviation ellipses (Fig. 7) exhibit a number of differences between the modelled and observed currents, and these differences are largely the result of the complex bathymetry. The model-to-observation current speed differences averaged over the vertical and the entire period range from −4 cm s−1 at stations A5, A6, A8 and A9 to −6 cm s−1 at station A1, while the directional biases range from approximately −5 ∘ at A2 to approximately −15 ∘ at A4, A6 and A8 and reach approximately −25 ∘ at A1, A5 and A7, and 27 ∘ at A9. The vertical structures of the currents, i.e. the rate of change of the current speed over the vertical, was adequately reproduced at all stations except A2. The latter is a consequence of the complex bathymetry in the region, which is misrepresented by the model. The connecting channel off which station A2 was positioned towards the open sea is very narrow and is approximately 600 m wide in its deep section. Additionally, the station is located slightly off the channel, and a strong interaction between the Eastern Adriatic Current and the channel current presumably exists. At all other stations, the model reproduced either a surface maximum in the currents and a decrease towards the bottom (A1, A4, A7, A8, A9) or the maximum currents in the bottom layer (A5) or two-layer circulation (A6). The current direction is adequately reproduced at A1, A4, A5, A6 and A8, but the reproduction is much worse at A7 and A9 (plus A2).
In conclusion, the model reproduces the thermohaline properties and DWF in the coastal northeastern Adriatic (inner domain) fairly well and may thus be used to quantify the related processes and dynamics in the area. It should, however, be considered that a restricted (weaker than observed) water mass communication was reproduced between the coastal and open Adriatic through connecting passages.
6.1 Thermohaline, buoyancy and stratification changes
The modelled temporal changes of the thermohaline properties at location G1, which is positioned in the Velebit Channel at the core of the Senj bora jet, and at location G2, which is positioned in the outer Kvarnerić Channel, are displayed in Fig. 10. The mixed-layer depth (MLD), which was computed using the methodology from Houpert et al. (2015) with the temperature increment threshold set to 0.1 ∘C, continuously reaches the bottom at G2 until early April. Later, a surface thermocline developed, deepening to approximately 30–40 m in early July. The salinity series at the G1 location exhibited pronounced daily and weekly changes in the upper layer, as it was influenced by the nearby freshwater discharge from the Senj hydropower plant. However, the vertical homogeneity and MLD reaching the bottom were present in this area during the cooling events on approximately 30 December 2014, 5 February and 5 March 2015 – this is due to the position of this station on the track of the Senj bora jet. Between bora events, the ocean began to relax through horizontal advection and slightly increasing stratification due to radiative forcing.
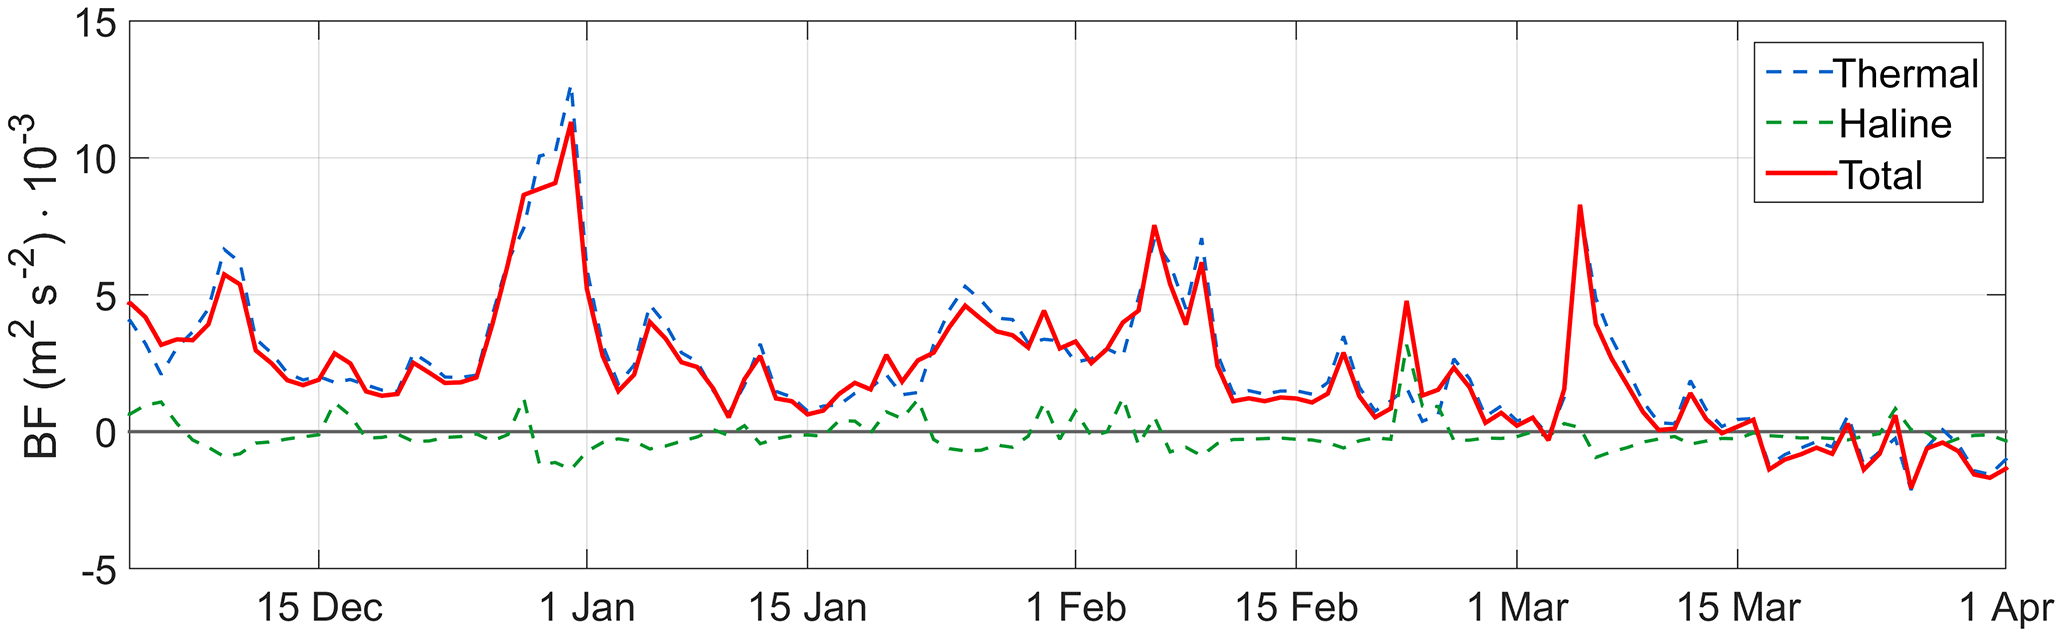
Figure 12Daily integral values of surface buoyancy fluxes (BFs) and its components averaged over the nested model domain.
Most of the coastal area was vertically homogeneous prior to the early February and early March bora events (Fig. 11), and MLD reached the bottom in most of the region. The only exceptions were the coastal waters near river mouths, such as the eastern Velebit Channel and off the Senj power plant (where station G1 is positioned), and the areas characterized by strong thermohaline fronts, such as Kvarner Bay. However, both boras were substantially strong and evenly mixed these regions to the bottom, allowing for DWF to occur throughout the coastal region.
A simple box model (e.g. Gill, 1982) of energy balance was applied to these locations, relating the decrease in the ocean temperature ΔT in a box to surface heat losses:
where Q is the surface heat flux in the time interval between t1 and t2 and H is the ocean depth. The specific heat of seawater, c, and seawater density, ρ0, was approximated by constant values of 3990 J kg−1 K and 1027.5 kg m−3, respectively. This model assumes no lateral exchange of energy between the box and the adjacent sea, which is a fair approximation for short and transient events, such as the bora. At station G1, this simplified formula gives , −0.48 and −0.03 ∘C for the three bora events (the third bora was very weak at G1), respectively, while the respective cooling rates provided by the model are −1.04, −0.51 and −0.07 ∘C. Given the assumptions of this simple box model, one can conclude that the cooling in the area is dominantly driven by the heat loss induced by the bora wind.
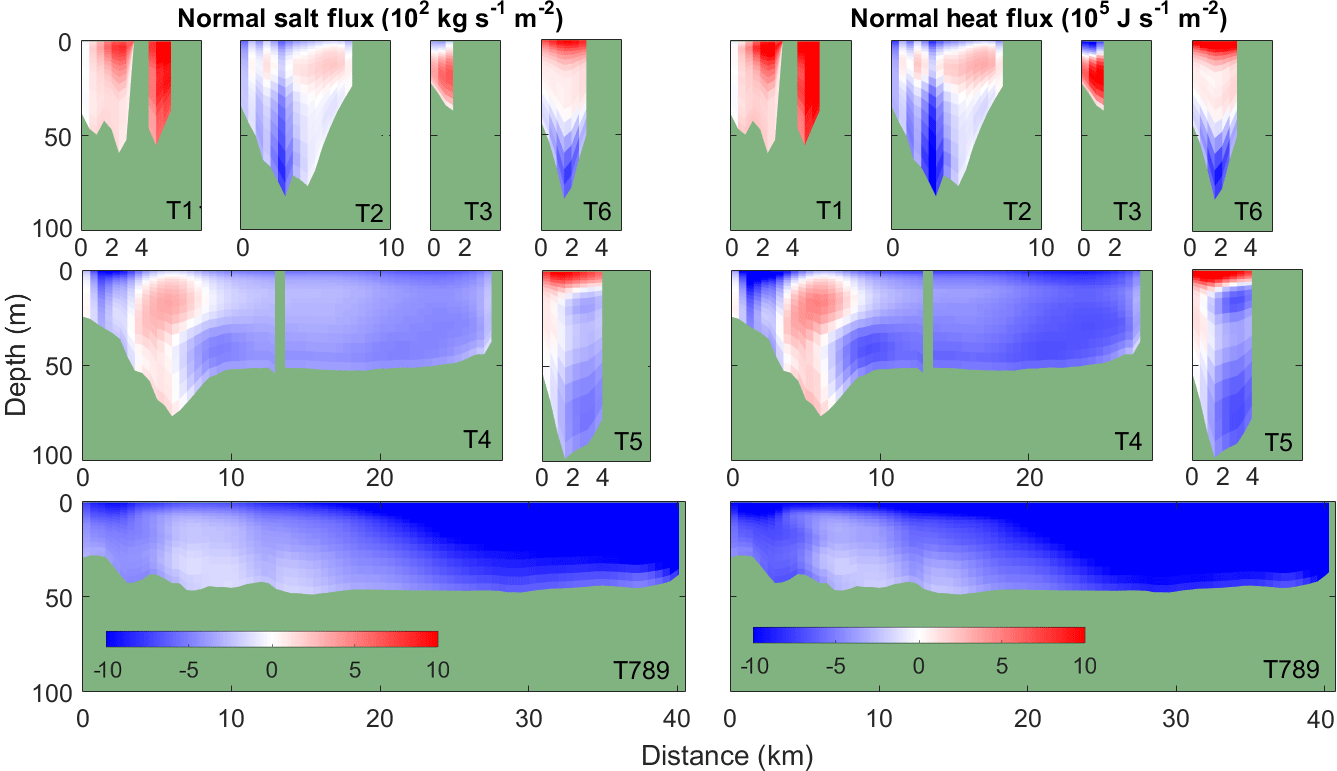
Figure 13Modelled heat and salinity fluxes normal to transects T1 to T789 and averaged between 15 December 2014 and 15 May 2015. Positive fluxes are oriented northeastward over the T2, T3, T4 and T789 transects and northwestwards over the T1, T5 and T6 transects. Green areas denote the bathymetry.
The density persistently increased at both locations until mid-March, when the maximum PDA values were modelled at both the G1 and G2 locations. This maximum is a result of the severe bora wind episode that peaked in some parts of the area on 5/6 March (see Sect. 3). As a consequence, the thermohaline circulation strengthened, and the open-Adriatic saline waters were advected to the coastal area, particularly to the outer parts (G2 location). An increase in salinity occurred in the coastal area and intensified in May, which was presumably driven by the lagging thermohaline circulation of the Adriatic–Ionian basin (Orlić et al., 2006).
Surface buoyancy fluxes, which were estimated following Marshall and Schott (1999) over the nested model domain, document buoyancy loss that dominantly occurred during bora outbreaks (Fig. 12). The most pronounced buoyancy loss occurred on approximately 30 December 2014 and was largest in the inner areas of the Velebit Channel, slightly lower along the bora jets (Senj Jet, Pašman Jet; Janeković et al., 2014), and lowest in the wake of the bora wind (e.g. G2 location). Buoyancy loss was predominantly driven by heat loss, while the haline-driven buoyancy changes were of minor importance. Buoyancy losses during the bora events decreased the stratification of the area, which can be clearly seen through an increase in the MLD and in the areas where the MLD reached the bottom (Fig. 11). This particularly applies to the inner Velebit Channel, where maximum buoyancy losses with rates high enough to homogenize the entire water column were modelled.
In conclusion, the model results indicate cooling, vertical homogenization and ventilation of the most of the NAdEx domain during the winter of 2015, driven largely by the three strong bora events. Knowing this, we can study dense-water dynamics in the area and the interchange between inner coastal and open Adriatic waters in more detail.
6.2 Lateral boundary fluxes, residence and flushing times
The modelled heat and salinity fluxes normal to transects T1 to T789 (notation follows the numeration of stations A1 to A9) and averaged between 15 December 2014 and 15 May 2015 are shown in Fig. 13. Positive fluxes are considered if directed towards the northeast at T2, T3, T4 and T789, and towards the northwest at T1, T5 and T6. The predominance of negative fluxes, occurring mostly through Kvarner Bay, may be perceived through summing the transports over the transects and the outer lateral boundary (Table 1) (Touter = T1 + T2 + T3 + T4 + T789). The heat fluxes indicate that the coastal northeastern Adriatic gained energy mostly over transects T1 and T3. This particularly applies to the surface layers of T1 and the bottom layers of T3, while the near-surface heat fluxes were in the opposite direction at the T3 transect. The fluxes at the T2 transect also show an inward–outward structure, with the strongest outward values modelled near the bottom. The fluxes were predominantly weakly negative along the T4 transect and strongly negative along the T789 transect, indicating that the coastal area was losing energy and salt through the northern connecting passages, particularly through Kvarner Bay.
Table 1Average heat, salt and volume transports at transects T1 to T789, as well as sum of transports at the outer (T1 + T2 + T3 + T4 + T789) and inner (T5 + T6) boundaries of coastal waters.
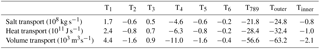

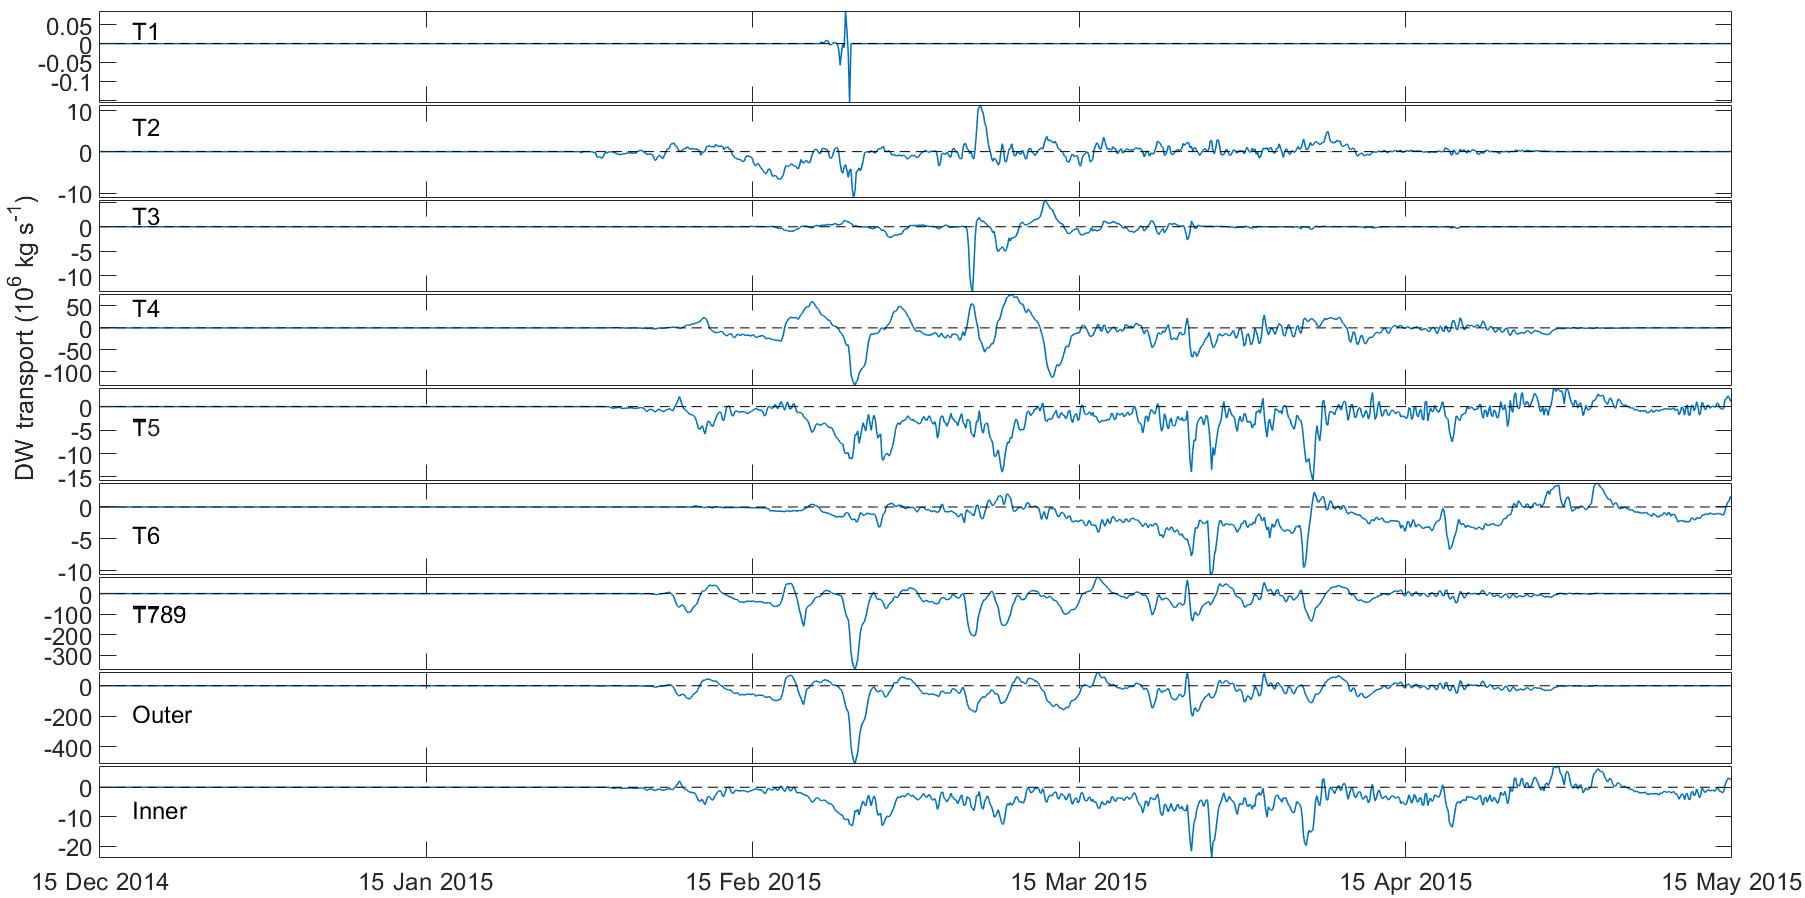
Figure 14Time series of heat and salt transports normal to and integrated over transects T1 to T789 between 15 December 2014 and 15 May 2015. Transports across the outer (T1 + T2 + T3 + T4 + T789) and inner (T5 + T6) domains are plotted too.
The normal modelled fluxes at the inner transects (T5 and T6, Fig. 16) were mostly directed northwestward in the surface layer, presumably due to bora-driven currents. The fluxes were in the opposite direction in the bottom layer, following two-layer circulation. The total inner transports (Tinner = T5 + T6) show the transport of energy, salt and mass towards the inner coastal area of the Velebit Channel (Table 1). However, this transport is much weaker than the transport modelled at the outer boundaries of the coastal waters.
The modelled fluxes and transports are highly variable with time (Fig. 14), particularly over the outer lateral boundaries. Both average heat and salt transports during six peak events are approximately 6 and 2 times larger than the average transports over the outer and inner lateral boundaries, respectively. As they occur over the largest transect by far, the transports at the T789 transect dominate the Touter transports. It is interesting that during some peak events, such as those on 28 December 2014 and 22 February 2015, the T1 inward transport peaks simultaneously as the outward transport at transects T2, T4 and T789. Therefore, the peak inflow at the southern boundary of the NAdEx 2015 area, which is under the influence of the Eastern Adriatic Current (occasionally directed towards the inner waters southeast of the transect T1), is balanced by the strong outflow at the northwestern lateral boundaries. By contrast, there are situations when the peak transports are localized over smaller parts of the domain. For example, the peak outward transports at transects T2 and T3 are balanced by the inward transport at T1 on 5 March 2015. These transports were presumably driven by a strong bora that strongly blew in the southeastern part of the NAdEx 2015 domain, increasing its speed towards the southeast (central Adriatic). The transports at the lateral boundaries became much weaker after the early March bora, and the values were lower in April and May.
The average dense-water mass flux (Fig. 15), defined as a flow of water with a PDA > 29.2 kg m−3 normal to the transects (Janeković et al., 2014), was largest at the outer lateral boundaries at transects T3 and T789. As expected, the mass flux is directed towards the open Adriatic, but the values were higher in the surface layer than near the bottom, as wind-driven transport is stronger there. Additionally, the near-bottom minima can be a sign of a sporadic penetration of dense waters coming from the open sea, i.e. the northern Adriatic shelf, towards the deep coastal area, which is also supported by the profiling float data (Fig. 6). That dense-water flow may reverse, particularly at the northern outer transects T4 and T789, which is clearly seen in Fig. 16. The strongest dense-water outflow event was modelled to occur on approximately 22 February, approximately 2 weeks after the early February severe bora events, through all outer lateral boundary transects except T3. During the peak dense-water outflow, the dense-water volume transport over the outer boundaries reached the maximum value of 0.4 Sv, which is comparable with the peak dense-water outflow modelled during the extreme winter of 2012 (Janeković et al., 2014). The dense-water transport across the inner transects is also interesting, as it is directed towards the inner coastal area on average. However, the inflow is stronger at transect T5 in late February and late March, while the maximum inflow occurred at transect T6 during late March and April.
Residence times are computed for both outer and inner coastal areas and for a period between 15 December 2014 and 15 May 2015. The residence time was computed by applying the formula
where is the density of the water at each point (x,y) and for each depth z of the domain, while is the normal outward velocity along the contour C of the domain. Such an approach assumes that (i) only the velocities at the border of the domain are used to calculate the residence time, (ii) only the outflow of water at the border is taken into account and (iii) the residence time is calculated with a time step of 3 h over the period of the studied event, assuming a steady state of the dynamic conditions at each time step. Box–whisker statistics were computed for the total (TRT) and dense-water (DWRT) residence times (Fig. 17). The median TRT for the entire coastal basin (bordered by the outer transects T1, T2, T3, T4 and T789) was estimated to be 19 days, although it appeared to be much shorter during strong wind outbreak episodes (down to 7 days) and much longer during the low mass exchange between the coastal and open Adriatic waters (up to 40 days). The DWRTs (waters with PDA > 29.2 kg m−3) are much lower, with a median value of 11 days and normally not longer than 35 days. The DWRT is smaller than the TRT as the volume of the generated dense waters is much smaller than the volume of the entire coastal area, while the dense-water outflow was substantial and occurred over a large portion of the transects, not just at the bottom.
In summary, the coastal northeastern Adriatic lost energy, salt and mass through lateral boundaries during the winter–spring of 2015, particularly through the boundary of Kvarner Bay. The outflow peaked during strong bora events. Strong bora increases the exchange between coastal and open waters, lowering the residence time of the coastal area from a few weeks to a week.
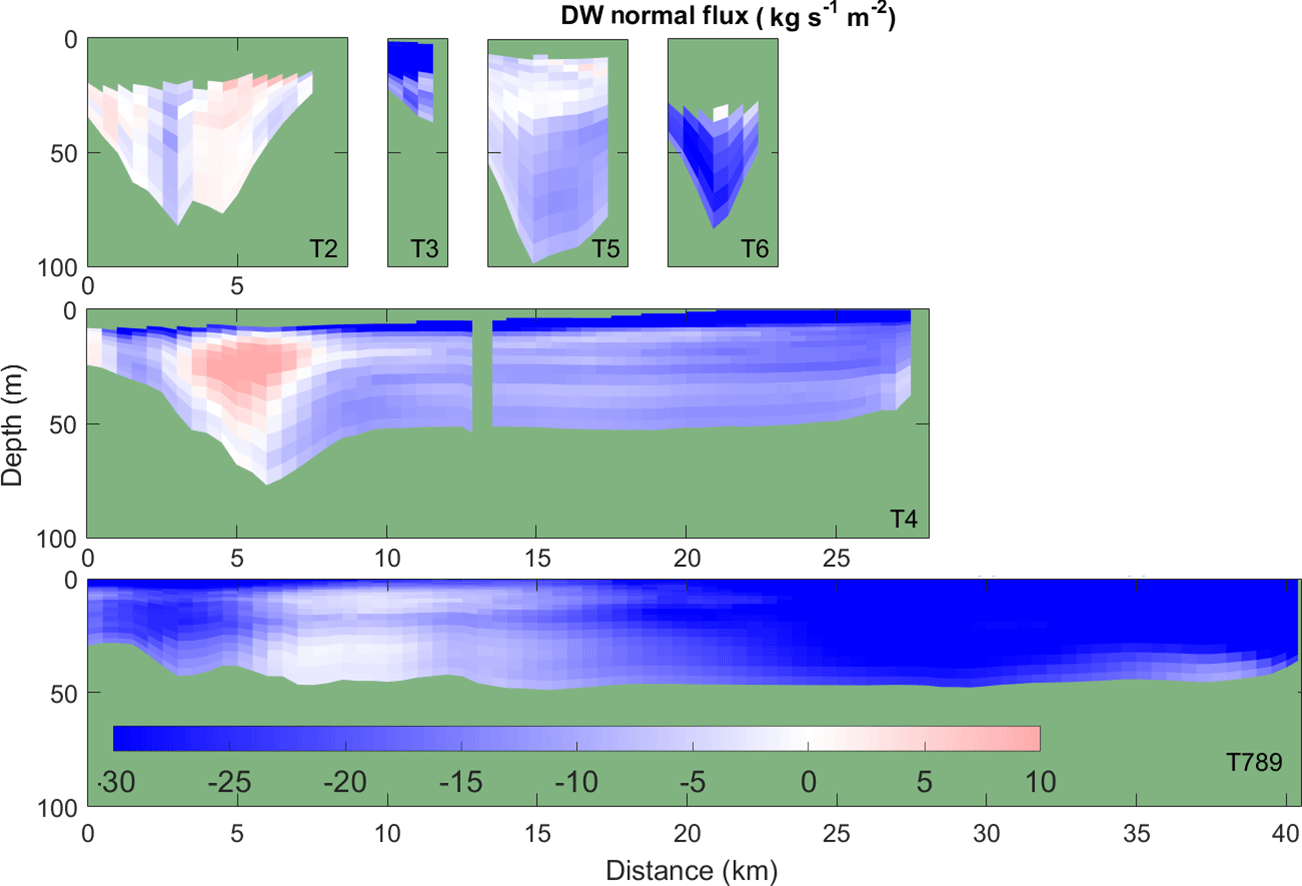
Figure 15As in Fig. 13, but for dense-water mass fluxes. Green areas denote the bathymetry and model cells where no dense water is modelled. T1 is omitted from the figure, as almost no dense-water transport occurred there
The coastal northeastern Adriatic is one of the least-investigated Adriatic regions. There are several reasons for this: (i) it is considered to not have a substantial influence on the overall dynamics of the Adriatic, as it is separated from the open Adriatic by several long islands that physically restrict water exchange, (ii) the area is positioned far away from research institutes, whose monitoring activities have not encompassed the area (see published data catalogues by Buljan and Zore-Armanda, 1966, 1979, and Zore-Armanda et al., 1991), and (iii) satellite remote sensing does not perform well in the region, as numerous channels and complex topography impair the quality of the data (Klemas, 2011). In addition, this area has wrongly been treated as a basin with strong freshwater fluxes, particularly of riverine origin (Raicich, 1994). Recently, it has been found that this old climatology of river discharge overestimates the real river discharges by almost an order of magnitude (Janeković et al., 2014; Vilibić et al., 2016a). Only limited parts of the coastal northeastern Adriatic have been previously investigated (e.g. Rijeka Bay in the early 1980s, Gačić et al., 1983, outer Kvarner Bay during the winter of 2002/2003, Lee et al., 2005; Poulain et al., 2011). The NAdEx 2015 is the first and the only current experiment that systematically approached the monitoring of the northeastern coastal Adriatic, including the communication between the open Adriatic and the coastal area through connecting channels. The NAdEx 2015 was accomplished through a strong collaboration and engagement between different institutions, resulting in a multi-platform marine dataset that can serve as a baseline for future investigations in the area. The experiment also includes the introduction of a state-of-the-art measuring platform that provides insight into the processes not previously documented with such details, such as the first deployment of an ARVOR-C profiling float that captured near-bottom thin layers of dense waters. The choice of the experimental area – the coastal northeastern Adriatic – emerged from the events in the winter of 2012, when it exhibited an unprecedented heat loss (up to 2000 W m−2) and DWF rates that strongly contributed to the overall Adriatic dense-water dynamics (Mihanović et al., 2013; Janeković et al., 2014).
We have provided an overview of the observations and estimated rates of selected basic processes using both an extensive set of measured data and a nested ocean model forced by an operational atmospheric model. We reached the following conclusions: (i) the DWF may occur in the coastal northeastern Adriatic during average winters (in terms of wintertime heat losses), as was the case in 2015; (ii) the generated waters in the winter of 2015 were of much lower density than the waters generated at the open Adriatic; (iii) observations at connecting channels reveal a balanced near-bottom inward–outward transport of dense waters, while the outward transport was mostly concentrated in the intermediate and surface layers; (iv) the modelling results show the domination of outward transport from the NAdEx area; and (v) the residence time was found to vary from 1 week to a few weeks and was shorter during strong wind conditions.
These results are also in line with the previous modelling results by Janeković et al. (2014), who also modelled the outflow of dense waters in connecting passages during the winter of 2012. However, the densities of waters generated during the winter of 2012 were much higher than of winter of 2015 and almost equalled the densities of the waters coming from the open Adriatic DWF site. There are several reasons for the difference: (i) preconditioning in the winter of 2012 includes a prolonged period of dry conditions (MHS, 2014, 2015), which may increase the salinity of the inner coastal waters to values equal to those observed in the open Adriatic (Mihanović et al., 2013); these conditions were not present during the preconditioning in the winter of 2015, and (ii) the wintertime cooling and heat losses in the winter of 2015 were not as pronounced as in the winter of 2012. Although weaker, the DWF of 2015 excited the thermohaline circulation in the basin, which was detected by an increase in salinity over time. Still, the question remains if the intrusion of the open Adriatic saline waters to the coastal northeastern Adriatic during the late winter and spring of 2015 was the result of the open Adriatic thermohaline circulation driven by the DWF in the coastal northeastern Adriatic or a consequence of the broader open-Adriatic thermohaline circulation.
Aside from documenting the processes by measurements, these data may be particularly useful for fine-tuning numerical models, which is a foreseen direction of future investigations in the Adriatic, in both coastal and open-ocean areas – particularly as the model in this study strongly underestimated the measured currents, especially in the narrowest connecting passages (Fig. 10). The tuning should also include a densification of the sigma layers near the bottom, where bottom density currents may appear (Vilibić and Mihanović, 2013). In our modelling system 20 sigma layers were not able to satisfactorily reproduce the observations in the near-bottom layers, such as those from the ARVOR-C profiling float; yet, this number of layers was previously found to satisfactorily reproduce the overall dense-water dynamics over the northern Adriatic shelf (e.g. Benetazzo et al., 2014). The estimated variables proportional to currents were also underestimated (e.g. heat, salt, mass and volume fluxes at connecting passages), while the residence times were likely overestimated. However, the thermohaline properties of the coastal area were reproduced fairly well, pointing to the fairness of the model results in reproducing the DWF processes and associated dynamics.
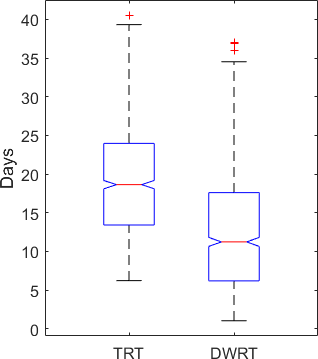
Figure 17Box–whisker statistics of total (TRT) and dense-water (DWRT) residence times for the coastal northeastern Adriatic bordered by transects T1, T2, T3, T4 and T789.
The underestimation of the water exchange between the coastal and open Adriatic waters may be a result of several factors. The first and the most obvious factor is the horizontal resolution of the ocean model. A resolution of 500 m may not be high enough to reproduce the cross-channel processes that occur in channels that are only a few kilometres wide, such as those approximated by the T2 and T3 transects. This hypothesis is supported by the fact that currents were least underestimated in wider channels and areas, e.g. at the T4 and T789 transects. Surface forcing is the next culprit in the list since an 8 km mesoscale ALADIN model with a 2 km dynamical downscaling of surface wind might not be sufficient for realistic ocean forcing in such a complex area. This constraint applies to both ocean and atmospheric processes, considering that the bora wind in the area is driven by an interaction of the synoptic flow with the complex orography of Velebit Mountain while being modified by the topography of the islands (Grisogono and Belušić, 2009). Thus, spatial variability in atmospheric processes is not reproduced fully. Other factors like parametrization of wind forcing, vertical diffusivity, lack of wave models and slip conditions at the coastline might play a role as well.
Recent investigations of different types of bora by TerraSAR-X images (Kuzmić et al., 2015) conclude that different bora types embed several small spatial structures in its flow at the kilometre and even sub-kilometre spatial scales. The structures are particularly developed during severe bora outbreaks when large differences between relatively high SST and very cold overflowing air are present. These differences can trigger secondary bora jets and extensive orographic breaking waves that propagate over the entire coastal northeastern area and over much of the open Adriatic, as was the case during the winter of 2012. Last but not least, the role of air–sea feedback during bora events is not negligible, as was shown through the comparison of two-way coupled atmosphere–ocean models vs. uncoupled simulations (Pullen et al., 2006, 2007; Ličer et al., 2016): air–sea feedback influences the position and strength of jet-like structures, it decreases the heat losses in the area, and it reduces the ocean currents in a jet by approximately 10–20 % during bora events, therefore suppressing ocean mixing. In summary, an improvement in the reproduction of wintertime dynamics in a complex area such as the coastal northeastern Adriatic should be based on (i) an increase in the horizontal resolution of an ocean model, (ii) the implementation of a high-resolution (1 km horizontal resolution at maximum) non-hydrostatic atmospheric model, and (iii) two-way coupling of ocean and atmospheric models. This concept does not include the effects of waves, which are known to affect the DWF in the open Adriatic (Benetazzo et al., 2014); yet, sensitivity modelling studies of waves have not been performed in complex coastal regions, which are characterized by limited fetch and strong deformation of waves due to strong gustiness of bora wind.
To emphasize the importance of the NAdEx 2015, we should add that the preliminary analyses of the observations (Vilibić et al., 2016b) revealed a number of interesting phenomena and processes other than those presented in this paper. For example, it seems that the dynamics of the thermohaline front that stretches from Kvarner Bay towards the open Adriatic (Lee et al., 2005; Kuzmić et al., 2006; Poulain et al., 2011) are highly variable over time, resembling near-diurnal wave-like oscillations. The question remains of whether these oscillations are driven by diurnal tides (Cushman-Roisin and Naimie, 2002), Adriatic seiches (Cerovečki et al., 1997), inertial oscillations (Orlić, 1987) or some other phenomena that may induce significant oscillatory currents in the region (Kokkini et al., 2017). In addition, as seen from glider measurements, the front may completely change and even vanish over a daily timescale and may have a strong impact on the thermohaline and dense-water dynamics in the region. Last but not least, high-frequency phenomena were observed in coastal waters, which are presumably the result of inertial, tidal (barotropic and baroclinic), topographic (the Adriatic seiche of 21.5 h) and advective processes that are strongly influenced by the complex coastal topography. These processes may influence the Adriatic-scale phenomena, similar to how the exchange between the Venice Lagoon and the Adriatic modulates the Adriatic diurnal tides (Ferrarin et al., 2015). Further investigations of all these processes are envisaged through in-depth analyses of the collected NAdEx 2015 dataset and process-oriented atmosphere–ocean modelling at high resolutions.
The data can be accessed by contacting the corresponding author.
The authors declare that they have no conflict of interest.
We are indebted to the crew members of R/Vs BIOS DVA and
VILA VELEBITA, and all researchers, engineers and technicians engaged in data collection
through different observing platforms, instrumentations and data processing.
The comments raised by the two anonymous reviewers are warmly appreciated. The
work has been supported by a number of research and technology projects:
ADAM-ADRIA (HRZZ grant IP-2013-11-5928), CARE (HRZZ grant IP-2013-11-2831),
SCOOL (HRZZ grant IP-2014-09-5747), ADIOS (HRZZ grant IP-06-2016-1955),
MARIPLAN (HRZZ grant IP-2014-09-3606), EuroFLEETS-II (FP7 grant 312762),
BALMAS (IPA CBC grant 1∘ STR/0005) and by the Euro-Argo-Italy
programme.
Edited by: Simon Josey
Reviewed by: two anonymous referees
Artegiani, A. and Salusti, E.: Field observation of the flow of dense water on the bottom of the Adriatic Sea during the winter of 1981, Oceanol. Acta, 10, 387–391, 1987.
Batistić, M., Garić, R., and Molinero, J. C.: Interannual variations in Adriatic Sea zooplankton mirror shifts in circulation regimes in the Ionian Sea, Clim. Res., 61, 231–240, 2014.
Beg-Paklar, G., Isakov, V., Koračin, D., Kourafalou, V., Orlić, M.: A case study of bora-driven flow and density changes on the Adriatic shelf (January 1987), Cont. Shelf Res., 21, 1751–1783, 2001.
Beg Paklar, G., Žagar, N., Žagar, M., Vellore, R., Koračin, D., Poulain, P. -M., Orlić, M., Vilibić, I., and Dadić, V.: Modeling the trajectories of satellite–tracked drifters in the Adriatic Sea during a summertime bora event, J. Geophys. Res., 113, C11S04, https://doi.org/10.1029/2007JC004536, 2008.
Benac, Č., Rubinić, J., and Ožanić, N.: The origine and evolution of coastal and submarine springs in Bakar Bay, Acta Carsologica, 32, 157–171, 2003.
Benetazzo, A., Bergamasco, A., Bonaldo, D., Falcieri, F. M., Sclavo, M., Langone, L., and Carniel, S.: Response of the Adriatic Sea to an intense cold air outbreak: dense water dynamics and wave-induced transport, Prog. Oceanogr., 128, 115–138, 2014.
Bensi, M., Cardin, V., Rubino, A., Notarstefano, G., and Poulain, P. M.: Effects of winter convection on the deep layer of the Southern Adriatic Sea in 2012, J. Geophys. Res., 118, 6064–6075, 2013.
Bonacci, O.: Analysis of the maximum discharge of karst springs, Hydrogeol. J., 9, 328–338, 2001.
Brožková, R., Derková, M., Belluš, M., and Farda, A.: Atmospheric forcing by ALADIN/MFSTEP and MFSTEP oriented tunings, Ocean Sci., 2, 113–121, https://doi.org/10.5194/os-2-113-2006, 2006.
Buljan, M.: Fluctuations of salinity in the Adriatic, Izvještaj Republičke ribarstveno-biološke ekspedicije “Hvar” 1948–1949, Acta Adriat., 2, 1–64, 1953.
Buljan, M. and Zore-Armanda, M.: Hydrographic data on the Adriatic Sea collected in the period from 1952 through 1964, Acta Adriat., 12, 1–438, 1966.
Buljan, M. and Zore-Armanda, M.: Oceanographic properties of the Adriatic Sea, Oceanogr. Mar. Biol. Rev., 14, 11–98, 1976.
Buljan, M. and Zore-Armanda, M.: Hydrographic properties of the Adriatic Sea in the period from 1965 through 1970, Acta Adriat., 20, 1–368, 1979.
Cerovečki, I., Orlić, M., and Hendershott, M. C.: Adriatic seiche decay and energy loss to the Mediterranean, Deep-Sea Res. Pt. I, 44, 2007–2029, 1997.
Chiggiato, J. and Oddo, P.: Operational ocean models in the Adriatic Sea: a skill assessment, Ocean Sci., 4, 61–71, https://doi.org/10.5194/os-4-61-2008, 2008.
Civitarese, G., Gačić, M., Lipizer, M., and Eusebi Borzelli, G. L.: On the impact of the Bimodal Oscillating System (BiOS) on the biogeochemistry and biology of the Adriatic and Ionian Seas (Eastern Mediterranean), Biogeosciences, 7, 3987–3997, https://doi.org/10.5194/bg-7-3987-2010, 2010.
Cushman-Roisin, B. and Naimie, C. E.: A 3D finite-element model of the Adriatic tides, J. Mar. Syst., 37, 279–297, 2002.
Dutour Sikirić, M., Janeković, I., and Kuzmić, M.: A new approach to bathymetry smoothing in sigma-coordinate ocean models, Ocean Modell., 29, 128–136, 2009.
Fairall, C. W., Bradley, E. F., Rogers, D. P., Edson, J. B., and Young, G. S.: Bulk parameterization of air-sea fluxes for tropical ocean-global atmosphere coupled-ocean atmosphere response experiment, J. Geophys. Res., 101, 3747–3764, 1996.
Ferrarin, C., Tomasin, A., Bajo, M., Petrizzo, A., and Umgiesser, G.: Tidal changes in a heavily modified coastal wetland, Cont. Shelf. Res., 101, 22–33, 2015.
Gačić, M., Orlić, M., Dadić, V., and Karabeg, M.: Temporal variations of current field in Rijeka Bay, Les Journées Etud. Pollutions – Cannes 1982, 165–171, 1983.
Gačić, M., Civitarese, G., Miserocchi, S., Cardin, V., Crise, A., and Mauri, E.: The open-ocean convection in the Southern Adriatic: a controlling mechanism of the spring phytoplankton bloom, Cont. Shelf Res., 22, 1897–1908, 2002.
Gačić, M., Eusebi Borzelli, G. L., Civitarese, G., Cardin, V., and Yari, S.: Can internal processes sustain reversals of the ocean upper circulation?, The Ionian Sea example, Geophys. Res. Lett., 37, L09608, https://doi.org/10.1029/2010GL043216, 2010.
Gajić-Čapka, M., Cindrić, K., and Pasarić, Z.: Trends in precipitation indices in Croatia, 1961–2010, Theor. Appl. Climatol., 121, 167–177, 2015.
Gerin, R., Pacciaroni, M., Kokkini, Z., Bussani, A., Mauri, E., Zuppelli, P., Kuchler, S., and Poulain, P.-M.: The north Adriatic experiment (Kvarner area, February 2015), Rel. 2015/64 OCE 19 MAOS, OGS, Trieste, 22 pp., 2015.
Gill, A. E.: Atmosphere-Ocean Dynamics, Academic Press, Orlando, 662 pp, 1982.
Grisogono, B. and Belušić, D.: A review of recent advances in understanding the meso- and microscale properties of the severe Bora wind, Tellus A, 61, 1–16, 2009.
Grubišić, V.: Bora-driven potential vorticity banners over the Adriatic, Q. J. Roy. Meteor. Soc., 130, 2571–2603, 2004.
Haidvogel, D. B., Arango, H., Hedström, K., Beckmann, A., Malanotte-Rizzoli, P., and Shchepetkin, A.: Model evaluation experiments in the North Atlantic Basin: simulations in nonlinear terrain-following coordinates, Dyn. Atmos. Oceans, 32, 239–281, 2000.
Houpert, L., Testor, P,. de Madron, X. D., Somot, S., D'Ortenzio, F., Estournel, C., and Lavigne, H.: Seasonal cycle of the mixed layer, the seasonal thermocline and the upper-ocean heat storage rate in the Mediterranean Sea derived from observations, Prog. Oceanogr., 132, 333–352, 2015.
Ivatek-Šahdan, S. and Tudor, M.: Use of high-resolution dynamical adaptation in operational suite and research impact studies, Meteorol. Z., 13, 99–108, 2004.
Ivatek-Šahdan, S., Stanešić, A., Tudor, M., Plenković Odak, I., and Janeković, I.: Impact of SST on heavy rainfall events on the eastern Adriatic during SOP1 of HyMeX, Atmos. Res., 200, 36–59, 2018.
Janeković, I., Mihanović, H., Vilibić, I., and Tudor, M.: Extreme cooling and dense water formation estimates in open and coastal regions of the Adriatic Sea during the winter of 2012, J. Geophys. Res., 119, 3200–3218, 2014.
Klemas, V.: Remote sensing techniques for studying coastal ecosystems: An overview, J. Coast. Res., 27, 2–17, 2011.
Kokkini, Z., Gerin, R., Poulain, P.-M., Mauri, E., Pasarić, Z., Janeković, I., Pasarić, M., Mihanović, H., and Vilibić, I.: A multiplatform investigation of Istrian Front dynamics (north Adriatic Sea) in winter 2015, Medit. Mar. Sci., 18, 344–354, 2017.
Kuzmić, M., Janeković, I., Book, J. W., Martin, P. J., and Doyle, J. D.: Modeling the northern Adriatic double-gyre response to intense bora wind: a revisit, J. Geophys. Res., 111, C03S13, https://doi.org/10.1029/2005JC003377, 2006.
Kuzmić, M., Grisogono, B., Li, X., and Lehner, S.: Examining deep and shallow Adriatic bora events, Q. J. Roy. Meteor. Soc., 141, 3434–3438, 2015.
Langone, L., Conese, I., Miserocchi, S., Boldrin, A., Bonaldo, D., Carniel, S., Chiggiato, J., Turchetto, M., Borghini, M., and Tesi, T.: Dynamics of particles along the western margin of the Southern Adriatic: Processes involved in transferring particulate matter to the deep basin, Mar. Geol., 375, 28–43, 2016.
Lee, C. M., Askari, F., Book, J. W., Carniel, S., Cushman-Roisin, B., Dorman, C., Doyle, J., Flament, P., Harris, C. K., Jones, B. H., Kuzmić, M., Martin, P., Ogston, A., Orlić, M., Perkins, H., Poulain, P.-M., Pullen, J., Russo, A., Sherwood, C., Signell, R. P., and Thaler, D.: Northern Adriatic response to a wintertime bora wind Event, EOS, 86, 157–168, 2005.
Ličer, M., Smerkol, P., Fettich, A., Ravdas, M., Papapostolou, A., Mantziafou, A., Strajnar, B., Cedilnik, J., Jeromel, M., Jerman, J., Petan, S., Malačič, V., and Sofianos, S.: Modeling the ocean and atmosphere during an extreme bora event in northern Adriatic using one-way and two-way atmosphere-ocean coupling, Ocean Sci., 12, 71–86, https://doi.org/10.5194/os-12-71-2016, 2016.
Malanotte-Rizzoli, P., Artale, V., Borzelli-Eusebi, G. L., Brenner, B., Crise, A., Gačić, M., Kress, N., Marullo, S., Ribera d'Alcalà, M., Sofianos, S., Tanhua, T., Theocharis, A., Alvarez, M., Ashkenazy, Y., Bergamasco, A., Cardin, V., Carniel, S., Civitarese, G., D'Ortenzio, F., Font, J., Garcia-Ladona, E., Garcia-Lafuente, J. M., Gogou, A., Gregoire, M., Hainbucher, D., Kontoyannis, H., Kovačević, V., Kraskapoulou, E., Kroskos, G., Incarbona, A., Mazzocchi, M. G., Orlić, M., Ozsoy, E., Pascual, A., Poulain, P.-M., Roether, W., Rubino, A., Schroeder, K., Siokou-Frangou, J., Souvermezoglou, E., Sprovieri, M., Tintoré, J., and Triantafyllou, G.: Physical forcing and physical/biochemical variability of the Mediterranean Sea: a review of unresolved issues and directions for future research, Ocean Sci., 10, 281–322, https://doi.org/10.5194/os-10-281-2014, 2014.
Marchesiello, P., McWilliams, J. C., and Shchepetkin, A. F.: Open boundary conditions for long term integration of regional oceanic models, Ocean Modell., 3, 1–20, 2001.
Marshall, J. and Schott, F.: Open-ocean convection: Observations, theory, and models, Rev. Geophys., 37, 1–64, 1999.
MHS: Reviews No 25: Climate Assessment and Monitoring for 2014, Meteorological and Hydrological Service, Zagreb, 38 pp., 2015.
MHS: Reviews No 26: Climate Assessment and Monitoring for 2015, Meteorological and Hydrological Service, Zagreb, 37 pp., 2016.
MHS: Reviews No 27: Climate Assessment and Monitoring for 2016, Meteorological and Hydrological Service, Zagreb, 37 pp., 2017.
Mihanović, H., Vilibić, I., Carniel, S., Tudor, M., Russo, A., Bergamasco, A., Bubić, N., Ljubešić, Z., Viličić, D., Boldrin, A., Malačič, V., Celio, M., Comici, C., and Raicich, F.: Exceptional dense water formation on the Adriatic shelf in the winter of 2012, Ocean Sci., 9, 561–572, https://doi.org/10.5194/os-9-561-2013, 2013.
Nof, D.: The translation of isolated cold eddies along a sloping bottom, Deep-Sea Res., 30, 171–182, 1983.
Oddo, P., Pinardi, N., Zavatarelli, M., and Coluccelli, A.: The Adriatic basin forecasting system, Acta Adriat., 47, 169–184, 2006.
Orlić, M.: Oscillations of the inertia period on the Adriatic Sea shelf, Cont. Shelf Res., 7, 577–598, 1987.
Orlić, M., Leder, N., Pasarić, M., and Smirčić, A.: Physical properties and currents recorded during September and October 1998 in the Velebit Channel (East Adriatic), Period. Biol., 102, 31–37, 2000.
Orlić, M., Dadić, V., Grbec, B., Leder, N., Marki, A., Matić, F., Mihanović, H., Beg Paklar, G., Pasarić, M., Pasarić, Z., and Vilibić, I.: Wintertime buoyancy forcing, changing seawater properties, and two different circulation systems produced in the Adriatic, J. Geophys. Res., 111, C03S07, https://doi.org/10.1029/2005JC003271, 2006.
Perica, D. and Orešić, D.: A contribution to the Velebit climate (in Croatian), Acta Geogr. Croat., 32, 45–68, 1997.
Poulain, P. -M., Lee, C., Mauri, E., Notarstefano, G., and Ursella, L.: Observations of currents and temperature-salinity-pigment fields in the northern Adriatic Sea in winter 2003, Boll. Geofis. Teor. Appl., 52, 149–174, 2011.
Pullen, J., Doyle, J. D., Hodur, R., Ogston, A., Book, J. W., Perkins, H., and Signell, R.: Coupled ocean-atmosphere nested modeling of the Adriatic Sea during winter and spring 2001, J. Geophys. Res., 108, 3320, https://doi.org/10.1029/2003JC001780, 2003.
Pullen, J., Doyle, J. D., and Signell, R. P.: Two-way air-sea coupling: A study of the Adriatic, Mon. Weather Rev., 134, 1465–1483, 2006.
Pullen, J., Doyle, J. D., Haack, T., Dorman, C., Signell, R. P., and Lee, C. M.: Bora event variability and the role of air-sea feedback, J. Geophys. Res., 112, C03S18, https://doi.org/10.1029/2006JC003726, 2007.
Querin, S., Cossarini, G., and Solidoro, C.: Simulating the formation and fate of dense water in a midlatitude marginal sea during normal and warm winter conditions, J. Geophys. Res., 118, 885–900, 2013.
Querin, S., Bensi, M., Cardin, V., Solidoro, C., Bacer, S., Mariotti, L, Stel, F., and Malačič, V.: Saw-tooth modulation of the deep-water thermohaline properties in the southern Adriatic Sea, J. Geophys. Res., 121, 4585–4600, 2016.
Raicich, F.: Notes on the flow rates of the Adriatic rivers. Technical Report RF 02/94, 8 pp., CNR, Istituto sperimentale talassografico, Trieste, Italy, 1994.
Roether, W. and Schlitzer, R.: Eastern Mediterranean deep water renewal on the basis of chlorofluoromethane and tritium data, Dyn. Atmos. Oceans, 15, 333–354, 1991.
Sekulić, B. and Vertačnik, A.: Balance of Average Annual Fresh Water Inflow into the Adriatic Sea, Int. J. Water Resour. D., 12, 89–98, 1996.
Shchepetkin, A. F. and McWilliams, J. C.: The regional oceanic modeling system: a split-explicit, free-surface, topography-following coordinate ocean model, Ocean Modell., 9, 347–404, 2005.
Shchepetkin, A. F. and McWilliams, J. C.: Correction and commentary for “Ocean forecasting in terrain-following coordinates: Formulation and skill assessment of the regional ocean modeling system” by Haidvogel et al., J. Comput. Phys., 227, 3595–3624, J. Comput. Phys., 228, 8985–9000, 2009.
Stanešić, A.: Assimilation system at DHMZ: Development and first verification results, Croat. Meteorol. J., 44/45, 3–17, 2011.
Supić, N. and Orlić, M.: Seasonal and interannual variability of the northern Adriatic surface fluxes, J. Mar. Syst., 20, 205–229, 1999.
Supić, N., Orlić, M., and Degobbis, D.: Small-scale spatial variability of surface heat flux over the northern Adriatic, Period. Biol., 99, 169–179, 1997.
Surić, M., Lončarić, R., Buzjak, N., Schultz, S. T., Sangulin, J., Maldini, K., and Tomas, D.: Influence of submarine groundwater discharge on seawater properties in Rovanjska-Modrič karst region (Croatia), Environ. Earth Sci., 74, 5625–5638, 2015.
Tudor, M. and Ivatek-Šahdan, S.: The case study of bura of 1 and 3 February 2007, Meteorol. Z., 19, 453–466, 2010.
Tudor, M., Ivatek-Šahdan, S., and Stanešić, A.: February 2012 winter conditions in Croatia, 6th HymMeX Workshop, Primošten, available at: https://www.researchgate.net/publication/283897781_February_2012_winter_conditions_in_Croatia (last access: 18 March 2018), 2012.
Tudor, M., Ivatek-Šahdan, S., Stanešinić, A., Horvath, K., and Bajić, A.: Forecasting weather in Croatia using ALADIN numerical weather prediction model, in: Climate Change and Regional/Local Responses, edited by: Zhang, Y. and Ray, P., InTech, Rijeka, Croatia, 59–88, 2013.
Tudor, M., Ivatek-Šahdan, S., Stanešic, A., Horvath, K., Hrastinski, M., Odak Plenković, I., Bajić, A., and Kovačić, T.: Changes in the ALADIN operational suite in Croatia in the period 2011–2015, Croat. Meteorol. J., 50, 71–89, 2015.
Tudor, M., Ivatek-Šahdan, S., and Stanešić, A.: Sea surface temperature in operational forecast (example of Adriatic Sea), ALADIN/HIRLAM Newsletter, 8, 23–32, 2017.
Vested, H. J., Berg, P., and Uhrenholdt, T.: Dense water formation in the Northern Adriatic, J. Mar. Syst., 18, 135–160, 1998.
Vilibić, I. and Mihanović, H.: Observing the bottom density current over a shelf using an Argo profiling float, Geophys. Res. Lett., 40, 910–915, https://doi.org/10.1002/grl.50215, 2013.
Vilibić, I. and Supić, N.: Dense water generation on a shelf: the case of the Adriatic Sea, Ocean Dyn., 55, 403–415, 2005.
Vilibić, I., Mihanović, H., Janeković, I., and Šepić, J.: Modelling the formation of dense water in the northern Adriatic: sensitivity studies, Ocean Modell., 101, 17–29, 2016a.
Vilibić, I., Poulain, P.-M., Orlić, M., Janeković, I., Dadić, V., Gerin, R., Kokkini, Z., Kovač, Ž., Mauri, E., Mihanović, H., Pasarić, M., Pasarić, Z., Šepić, J., and Tudor, M.: The 2015 Northern Adriatic Experiment: Preliminary results, Rapports et procés-verbaux des réunions CIESM, CIESM, Monaco, 41, 2016b.
Viličić, D., Kuzmić, M., Bosak, S., Šilović, T., Hrustić, E., and Burić, Z.: Distribution of phytoplankton along the thermohaline gradient in the north-eastern Adriatic channel; winter aspect, Oceanologia, 51, 495–513, 2009.
Zaninović, Z., Gajić-Čapka, M., Perčec Tadić, M., Vučetić, M., Milković, J., Bajić, A., Cindrić, K., Cvitan, L., Katušin, Z., Kaučić, D., Likso, T., Lončar, E., Lončar, Ž., Mihajlović, D., Pandžić, K., Patarčić, P., Srnec, L., and Vučetić, V.: Climate atlas of Croatia 1961–1990, 1971–2000, Meteorological and Hydrological Service, Zagreb, 200 pp., 2008.
Zore-Armanda, M.: Les masses d'eau de la mer Adriatique, Acta Adriat., 10, 5–88, 1963.
Zore-Armanda, M. and Gačić, M.: Effects of Bora on the circulation in the North Adriatic, Ann. Geophys., 5B, 93–102, 1987.
Zore-Armanda, M., Bone, M., Dadić, V., Morović, M., Ratković, D., Stojanoski, L., and Vukadin, I.: Hydrographic properties of the Adriatic Sea in the period from 1971 through 1983, Acta Adriat., 32, 1–547, 1991.