the Creative Commons Attribution 4.0 License.
the Creative Commons Attribution 4.0 License.
 | 18 Mar 2025
River discharge impacts coastal southeastern tropical Atlantic sea surface temperature and circulation: a model-based analysis
Joke F. Lübbecke
Peter Brandt
Franziska U. Schwarzkopf
Arne Biastoch
The southeastern tropical Atlantic (SETA) coastal region sustains highly productive fisheries and marine ecosystems, thus having immeasurable socio-economic importance for southwestern African coastal countries. It is characterized by high sea surface temperature (SST) variability and significant freshwater input from land mainly due to Congo River discharge. In this study, using high-resolution ocean model sensitivity experiments, we show that the presence of low-salinity waters from the river discharge increases the mean state SST in the SETA coastal fringe by about 0.26 °C on average and by up to 0.9 °C from south of the Congo River to the Angola–Benguela Front (ABF). North of the Congo River up to about 4° S, this input significantly reduces the mean state SST by more than 1 °C. We demonstrate that the impact of river discharge on SST is associated with a halosteric effect, which modifies the sea surface height gradient and alters geostrophic currents, producing a southward coastal geostrophic flow, with an onshore geostrophic component to the south of the Congo River. Hence, advective warming and downwelling are generated south of the river mouth. Furthermore, the southward advection generated by the low-salinity waters pushes the ABF further south. Concomitantly north of the Congo's mouth, the sea surface height gradient generates a northward geostrophic coastal current with an offshore geostrophic component, which is associated with advective cooling and upwelling north of 6° S. These results draw attention to the freshwater impact on SSTs and ocean surface dynamics, especially in the projected climate change scenario of continuously increasing land-to-ocean discharge.
- Article
(6418 KB) - Full-text XML
-
Supplement
(2156 KB) - BibTeX
- EndNote


The southeastern tropical Atlantic (SETA; Fig. 1) is an eastern boundary upwelling region that features high biological productivity encompassing the tropical Angolan and northern and southern Benguela upwelling systems (Jarre et al., 2015). This area sustains productive marine ecosystems and fisheries, with high socio-economic and food security importance for southwestern African coastal countries (FAO, 2022; Kirkman et al., 2016; Sowman and Cardoso, 2010). Within the SETA, the thermal Angola–Benguela Front (ABF, Fig. 1a), which is characterized by the convergence of tropical warm waters from the north and cool subtropical waters from the south, is located at around 17–18° S, where the southward Angola Current (AC) encounters the northward Benguela Coastal Current (BCC) (Koseki et al., 2019). Due to the strong meridional sea surface temperature (SST) gradient in the ABF, its migration to the north and south is decisive for SST changes off Angola and plays a major role in determining seasonal and interannual SST variability in the region (Lübbecke et al., 2010).
The source of riverine freshwater input in the SETA involves the outflow of three southwestern African coastal rivers (Fig. 1): the Congo River, with its mouth at 6.0° S, 12.4° E; the Cuanza River at 9.3° S, 13.2° E; and the Kunene River at 17.3° S, 11.8° E. The major input comes by far from the Congo River, which is the second-largest river system in the world and has a mean flow rate of about 40 000 m3 s−1 (Dai and Trenberth, 2002; Campbell, 2005). The Congo River discharge (CRD) peaks during November–January, has a secondary maximum in April–May and minima during March and August (Fig. S1 in the Supplement). The discharge seasonality is governed by the precipitation over the Congo River basin, which is mainly related to the movement of the Intertropical Convergence Zone (ITCZ) (Sorí et al., 2017; Munzimi et al., 2019). The CRD is the greatest contributor to the sea surface salinity (SSS) mean state and variability in the eastern tropical Atlantic (Martins and Stammer, 2022; Chao et al., 2015; Denamiel et al., 2013; Hopkins et al., 2013; Materia et al., 2012). Recently, both the CRD and the SSS in the area were linked to the occurrence of the Indian Ocean Dipole (IOD), with positive IOD events leading to increased moisture convergence over the Congo Basin and subsequently enhanced CRD (Jarugula and McPhaden, 2023; McPhaden et al., 2024). The Congo River plume and the low SSS signal spread usually westward, driven mainly by zonal advection (Houndegnonto et al., 2021; Martins and Stammer, 2022). From February to April, however, the plume reaches its seasonal southernmost extension up to 12° S, controlled by the meridional advection of the Angola Current (Kopte et al., 2017; Awo et al., 2022; Martins and Stammer, 2022). In some specific years, the low SSS signal can reach as far south as 18° S (Aroucha et al., 2024; McPhaden et al., 2024; Gammelsrød et al., 1998).
River-related low SSS has been associated with increased SST in the eastern tropical Atlantic. Materia et al. (2012) used observations to correlate freshwater discharge and SST increase in the Gulf of Guinea via mixed layer shoaling, while Martins and Stammer (2022) showed that the low-SSS waters associated with CRD strongly increase stratification in the region. Moreover, it has been recently shown that freshwater input also contributes to boosting strong anomalously warm coastal events off the Angola coast, the so-called Benguela Niños (Shannon et al., 1986; Florenchie et al., 2004), via reduced turbulent heat loss due to increased stratification (Lübbecke et al., 2019; Aroucha et al., 2024). The intensification of these extreme coastal events through the CRD is also linked to the occurrence of IOD events (McPhaden et al., 2024). One of the main conditions for the low SSS influence on these events is that the freshwater plume from the CRD is advected to the Angolan–Namibian coasts, much further south than climatologically expected (Awo et al., 2022). These studies are based on the mechanism of the low-salinity shoaling in the mixed layer, which generates barrier layers between the density-stratified mixed layer and the temperature-stratified isothermal layer. The barrier layer presence weakens the vertical temperature gradient between the fresh mixed layer and the waters below it, reducing the impact of vertical mixing and turbulent heat loss, which then contributes to increasing SSTs.
On the other hand, the modelling study by White and Toumi (2014) did not find a substantial influence of the barrier layer generation on increasing the SST mean state off the Congo River mouth. Using different simulations with and without the river presence, the authors showed that although the CRD generates barrier layers up to 6 m thick, the shoaling of the mixed layer is such that the penetration of the solar shortwave radiation is not trapped within this layer. Hence, the cooling effect from the reduced shortwave absorption exceeds the warming impact of the reduced vertical mixing (White and Toumi, 2014). However, their simulations showed a significant coastal warming impact from the CRD south of the river mouth (Fig. 5 in White and Toumi, 2014). At the same time, model simulations have shown that freshwater input and variability can indeed increase the mean state SST in other tropical regions. Zhang and Busalacchi (2009) pointed to the increase in positive SST anomalies due to amplified freshwater fluxes in the Tropical Pacific, while Topé et al. (2023) showed a similar effect in the Gulf of Guinea due to the presence of the Niger River. It has been demonstrated that the Niger River creates an additional onshore geostrophic flow in the Gulf of Guinea to the west of the river mouth. However, changes in upwelling due to the Niger presence were not significant since the river-induced reduced mixed layer depth (MLD) compensated for this onshore flow intensification (Alory et al., 2021). Additionally, recent climate projections have identified changes in the onshore geostrophic flow as a key factor controlling long-term trends in eastern boundary upwelling systems (Jing et al., 2023), highlighting the potential influence of the CRD on the future dynamics of the SETA upwelling system.
Overall, it is clear that river plumes affect not only the SST mean state but also its variability in tropical regions. For the SETA, specifically, they can amplify extreme warm events, impacting fisheries, marine ecosystems, and the socio-economics of African countries. Hence, it is crucial to better recognize the mechanisms by which freshwater input influences SST changes. This comprehension becomes even more important in view of future warming scenarios, which show amplified river runoff around the world (Müller et al., 2024; Aloysius and Saiers, 2017). In the present study, we aim to understand the impact of the freshwater input in particular on the mean state SST, focusing on the SETA region. For this, we use three sensitive experiments from a nested ocean general circulation model: a control experiment with an interannual varying freshwater discharge from land to ocean (CTRL), a sensitivity experiment with a climatological freshwater runoff (CLIMA), and one with no runoff at all (NORIV). More details are given in Sect. 2.
This paper is organized as follows: in Sect. 2 we present the model configuration, the experiments, the datasets, and the methods for upwelling indices, advection term, and barrier layer calculation; in Sect. 3 we compare the model output against observational datasets and describe the differences between the experiments and the mechanisms responsible for these differences; and in Sect. 4 we discuss our main findings and present concluding remarks.
2.1 INALT20
In this study we used the INALT20 model configuration (Schwarzkopf et al., 2019), which is based on the Nucleus for European Modelling of the Ocean (NEMO) v3.6 ocean general circulation model (Madec and the NEMO team, 2016). It consists of a high-resolution (°) nest covering the South Atlantic and the West Indian oceans (63° S–10° N, 70° W–70° E; Fig. 2 in Schwarzkopf et al., 2019) embedded into the coarser-resolution (°) global host grid ORCA025 via a two-way nesting approach, allowing the host to provide boundary conditions to the nest as well as receiving information from the nest. INALT20 has a vertical grid consisting of 46 z levels, with 6 m resolution near the surface and 14 levels in the upper 200 m. Although the uppermost level represents a 6 m thick layer with horizontal velocities, temperature, and salinity defined at its centre (∼ 3 m depth), we consider those surface values. More details on INALT20 can be found in Schwarzkopf et al. (2019). The model is forced at the surface with momentum, heat, and freshwater fluxes from the atmospheric product JRA55-do (Tsujino et al., 2018). It has been recently shown that the use of JRA55-do as the forcing product performs better in the Benguela upwelling region in comparison to other datasets (Small et al., 2024).
2.1.1 Model experiments
The study is based on three simulations that only differ in their prescribed river runoff. In the reference (control) simulation (CTRL) an interannually varying daily runoff forcing from JRA55-do (Tsujino et al., 2018) is applied. This simulation has been previously used and described also by Schmidt et al. (2021), Biastoch et al. (2021) (therein referred to as INALT20-JRA-long), and Rühs et al. (2022) (SIMJRA). The sensitivity experiment CLIMA is forced with a monthly climatology of the years 2000 to 2019 built from the JRA55-do runoff. In the second sensitivity experiment (NORIV), no runoff forcing was applied. For CLIMA and CTRL, vertical mixing is enhanced where runoff enters the ocean. The hindcast simulation from 1958 to 2019 (CTRL) is preceded by a 30-year-long spin-up integration initialized with temperature and salinity data from the World Ocean Atlas (WOA) (Huang et al., 2021; Levitus et al., 1998). CLIMA and NORIV branch off from CTRL in 2000, spanning from the period from 2000–2018. We analyse 5 d averaged output data, except for sea surface height (SSH) and freshwater runoff, for which daily outputs are used. Modelled SSH fields are detrended by removing the global average at each location and time slice.
2.2 Observational and reanalysis datasets
To assess the model performance in representing the mean state and variability of key variables, we compared CTRL outputs against a variety of datasets ranging from satellite and reanalysis products to in situ measurements. The datasets are described below. We used monthly averages of all these products for the time period from 2000–2018 to have a consistent comparison with the corresponding model output. Exceptions are mentioned below. Finally, all gridded datasets were interpolated onto the INALT20 ° spatial grid. Interannual variability is calculated as the monthly standard deviation of the variable anomalies.
A blend of satellite and in situ measurements of SST was obtained from the high-resolution National Oceanic and Atmospheric Administration (NOAA) Optimum Interpolation SST (OISST) (Huang et al., 2021; Reynolds et al., 2007). The data have ° spatial resolution and is available from 1981 to the present day at the National Centers for Environmental Information.
For salinity, we took SSS v03.21 measurements from the European Space Agency Sea Surface Salinity Climate Change Initiative (ESA CCI) (Boutin et al., 2021). It consists of composites of bias-corrected SSS from the satellite missions Soil Moisture and Ocean Salinity (SMOS; 2010–2019), NASA Aquarius (2012–2015), and Soil Moisture Active Passive (SMAP; 2015–present), with the data available from 2010 to 2018.
SST and SSS as well as zonal and meridional ocean velocities were obtained also from the GLORYS12 reanalysis product (Lellouche et al., 2021). It is based on the NEMO with atmospheric forcing by ERA-Interim and ERA5 with assimilated in situ profiles of temperature and salinity from the CORAv4.1 database. It has a ° horizontal resolution and 50 vertical levels and covers the period from 1993 to the present. The product is distributed by the EU Copernicus Marine Service (CMEMS). Although GLORYS12 is forced by climatological river runoff, it has shown good performance in the SETA region in reproducing the temperature and salinity mean state and variability at both the surface and depth (Aroucha et al., 2024).
To validate the freshwater input data from the model, we use CRD data at Kinshasa–Brazzaville station, Republic of Congo, from the ORE-HYBAM observatory. Daily values are available from 1947 to 2023.
Finally, we used current velocity measurements from 45 to 500 m depth from a moored acoustic Doppler current profiler (ADCP) off Angola at 10°50′ S, 13° E, 77 km away from the coast (Kopte et al., 2017). The data are available from 2014 to 2021. Alongshore and cross-shore velocities were derived by rotating 34° anticlockwise from the north. To complement the mooring measurements at the surface, we obtained monthly total current velocities from the GlobCurrent dataset (Rio et al., 2014), which consists of zonal and meridional velocities at the surface and 15 m depth from combined CMEMS satellite geostrophic currents and modelled Ekman currents. This dataset is available at 0.25° resolution from 1993–2022 and is also distributed by the CMEMS.
2.3 Mixed layer depth, isothermal layer depth, and barrier layer thickness definitions
The isothermal layer depth (ILD) is here defined by a 0.2 °C threshold referenced to the temperature value at 3 m depth (first vertical level of the model), T3 m, while the mixed layer depth (MLD) is the depth at which the potential density (σ0) referenced to its value at 3 m depth (σ3 m) is increased by an amount equivalent to a 0.2 °C temperature change at the local salinity (Δσ0) as follows:
where S3 m and P0 are salinity and pressure at 3 m depth and the ocean surface, respectively. The barrier layer thickness (BLT) is the difference between the ILD and MLD: BLT=ILD−MLD. These fields were calculated based on 5 d averaged temperature and salinity vertical profiles, and these definitions, which ensure that salinity changes at the surface are particularly considered for shoaling the mixed layer and generating barrier layers, have been extensively used during the last few years (e.g. Aroucha et al., 2024; Gévaudan et al., 2021; Saha et al., 2021). In addition, the squared Brunt–Väisälä frequency (N2) fields were obtained by averaging from surface to 50 m depth the N2 at each depth level calculated from the monthly temperature and salinity vertical profiles since the MLD in this region is usually shallower than 50 m (Körner et al., 2023; Aroucha et al., 2024).
2.4 Horizontal advection
To investigate whether SST differences between the simulations stem from changes in surface dynamics and consequently surface advection, we calculated the surface horizontal advection as
where v and ∇T are the 5 d averaged surface horizontal current vector and temperature gradient, respectively. Advection was calculated individually for each experiment, where v and ∇T were both taken from the same experiment (e.g. ). Values within 20 km off the coast were neglected due to the large calculation errors close to the coast.
2.5 Upwelling indices
Following Alory et al. (2021) and Marchesiello and Estrade (2010), we define dynamical upwelling indices to evaluate the freshwater input impact on the competing effects of geostrophic flow and Ekman transport on coastal upwelling. The effect of convergence/divergence of the geostrophic flow at the coast on vertical velocities is described by the geostrophic coastal upwelling index (GCUI):
where Lu represents the cross-shore width where upwelling occurs, here defined as 50 km (see Fig. 5), uG is the cross-shore surface geostrophic current (defined below) averaged within the Lu and MLD is the mixed layer depth. Defining Lu as 50 km fits to the width of the minimum cross-shore temperature gradient in this area, which is located at the shelf break (Körner et al., 2023) and is close to the Rossby radius of deformation in the region (Chelton et al., 1998).
The Ekman coastal upwelling index (ECUI) is a function of Lu, the alongshore wind stress, τa, averaged within Lu; the water density, ρ; and the Coriolis parameter, f, and is defined as follows:
The ECUI represents the vertical velocities due to the convergence/divergence of the Ekman transport at the coast. Positive (negative) values of both GCUI and ECUI represent upward (downward) vertical velocities, indicating upwelling (downwelling). The total upwelling is represented by the sum of both indices.
The surface cross-shore (uG) and alongshore (vG) geostrophic currents were calculated from the sea surface height (SSH) fields based on the following equations:
where g is the gravitational acceleration, here taken as 9.8 m s−2, and f is the Coriolis parameter. Both the geostrophic currents and the upwelling indices were calculated based on 5 d data averages and by considering the alongshore wind stress, SSH, MLD, and ρ individually for each model experiment.
3.1 Model validation
Figure 1a shows the CTRL mean SST for 2000–2018 in the SETA compared to the mean SST for the same period for both OISST and GLORYS12. Overall, the SST spatial mean state from CTRL compares well to the mean SST of both products (Fig. 1a), although CTRL overestimates the SST in almost the whole SETA (Fig. 1b and c). The highest and most considerable biases are within the ABF and the coastal upwelling regions (i.e. from 15 to 30° S). In CTRL, the ABF is located too far south, creating a warm bias at 17–18° S of around 2.5 and 2.0 °C compared to OISST (Fig. 1b) and GLORYS12 (Fig. 1c), respectively. In the Benguela upwelling region (∼ 19–30° S), the coastal warm biases to both products are of similar spatial pattern and magnitude.
In the coastal Angola–Benguela area (CABA; 10–20° S, 200 km away from coast), CTRL depicts well the SST anomalies as presented by the satellite and the reanalysis product (Fig. 1d), although they are underestimated in specific years – especially during Benguela Niño events (e.g. 2001 and 2011). In fact, the SST variability from CTRL is lower within the whole SETA region (Fig. S4a–c) relative to both products, mainly in the CABA and ABF regions. The highest SST variability in the model simulation is restricted to a thin coastal band, while the OISST and GLORYS12 highest variabilities are observed from 8° E to the coast (Fig. S4a–c). Regarding the SST seasonality, CTRL nicely agrees with both OISST and GLORYS12 products (Fig. 1e). As previously mentioned, a warm bias is indeed present in the CABA, being stronger when compared to the satellite product than the reanalysis. It is noteworthy that for both CABA SST interannual variability and seasonality, there is no substantial difference between CTRL and CLIMA (blue lines mostly overlap green lines in Fig. S2a–b). The reasons for this are further discussed. However, in the seasonal climatologies, a constant offset of ∼ 0.3 °C is observed between the simulations with (CTRL and CLIMA) and without (NORIV) freshwater input at the coastal Angola–Benguela region (Fig. S2b), already indicating that this input could create an SST mean state difference.
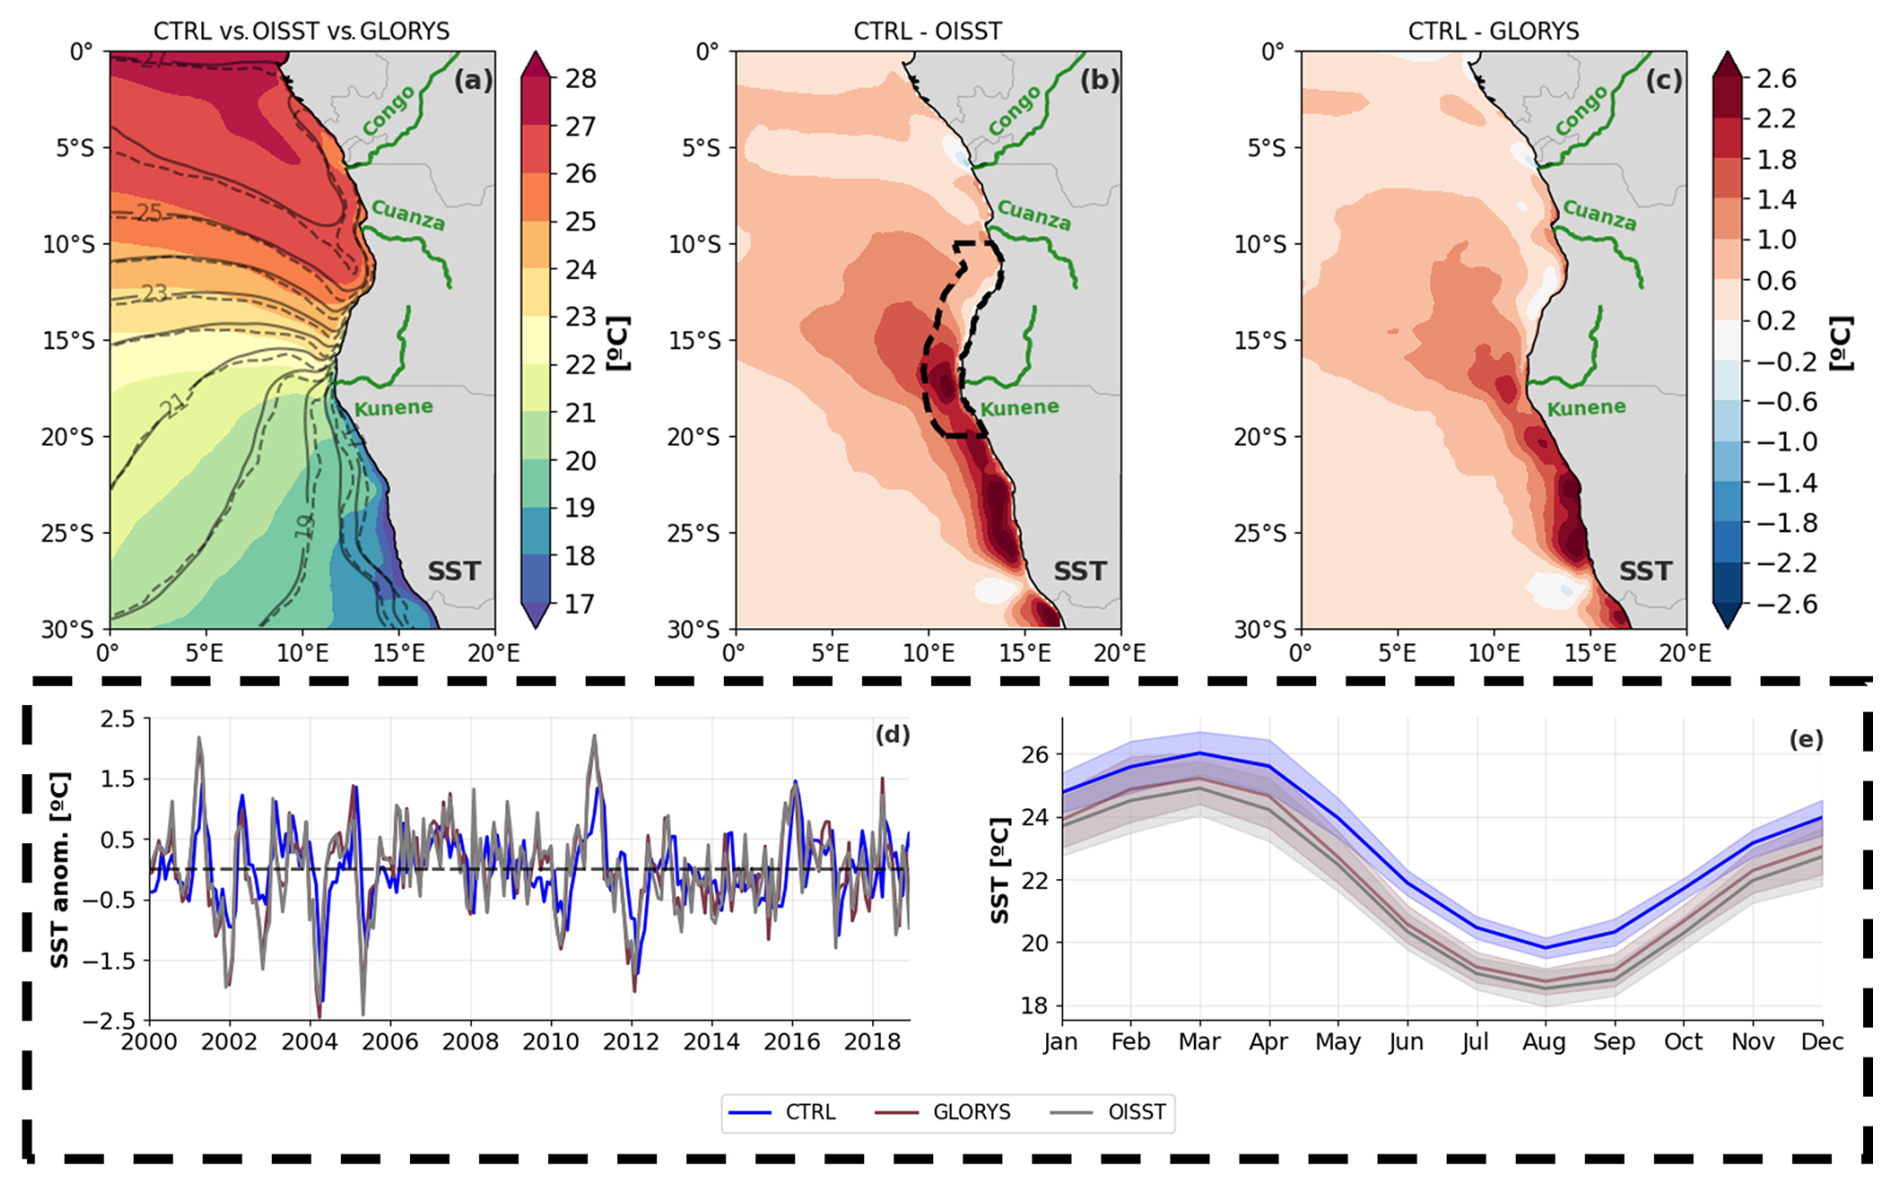
Figure 1Comparison of simulated SST against observations and reanalysis. (a) Mean SST from CTRL (shading), OISST (solid contours), and GLORYS (dashed contours) averaged from 2000–2018. Contour interval is 1 °C. (b) Difference between CTRL and OISST mean SST. The dashed black contour indicates the coastal Angola–Benguela area (CABA, 10–20° S, 200 km away from coast). (c) Difference between CTRL and GLORYS mean SSTs. (d) SST anomalies averaged for CABA shown for CTRL (in blue) and datasets (GLORYS in brown and OISST in grey). (e) Same as (d) but for the monthly climatologies. Shading indicates monthly standard deviations.
For the model validation with respect to SSS (Fig. 2), we focus on two different regions: the previously cited CABA region (where the highest SST variability is present in the SETA, i.e. the region where Benguela Niños occur) and the Congo River mouth area (CRMA; solid black contour in Fig. 2b, 2–10° S, 200 km away from coast), which represents the area of major freshwater input to the SETA. Overall, the SSS mean state from CTRL compares well against both ESA CCI and GLORYS12 products with the lowest salinity values present within the CRMA as a response to the CRD. However, there are SSS biases when comparing CTRL to both products. North of 10° S and compared to ESA CCI, CTRL slightly overestimates the offshore SSS up to ∼ 5° S, while close to the coast it presents salinity values more than 1.0 lower than observed with satellites (Fig. 2b). North of 5° S CTRL presents a fresh bias in relation to ESA CCI, both at the coast and offshore (Fig. 2b). The fresh bias at the coast of CTRL compared to ESA CCI occurs from October to May in particular (Fig. 2g). On the other hand, when comparing the simulated SSS north of 10° S to the GLORYS12 product, the model simulation shows mean coastal SSS values exceeding those of the reanalysis product by more than 1.5, while there is a fresh bias west of 12° E (Fig. 1c). At the coast, CTRL presents higher SSS values than GLORYS12 mainly from June to September (Fig. 2g). Besides the observed differences, the SSS seasonal cycles at the CRMA are similar within the three products, with the lowest (highest) salinity values coinciding with the season of highest (lowest) CRD – i.e. austral summer (winter) (Fig. 2g).
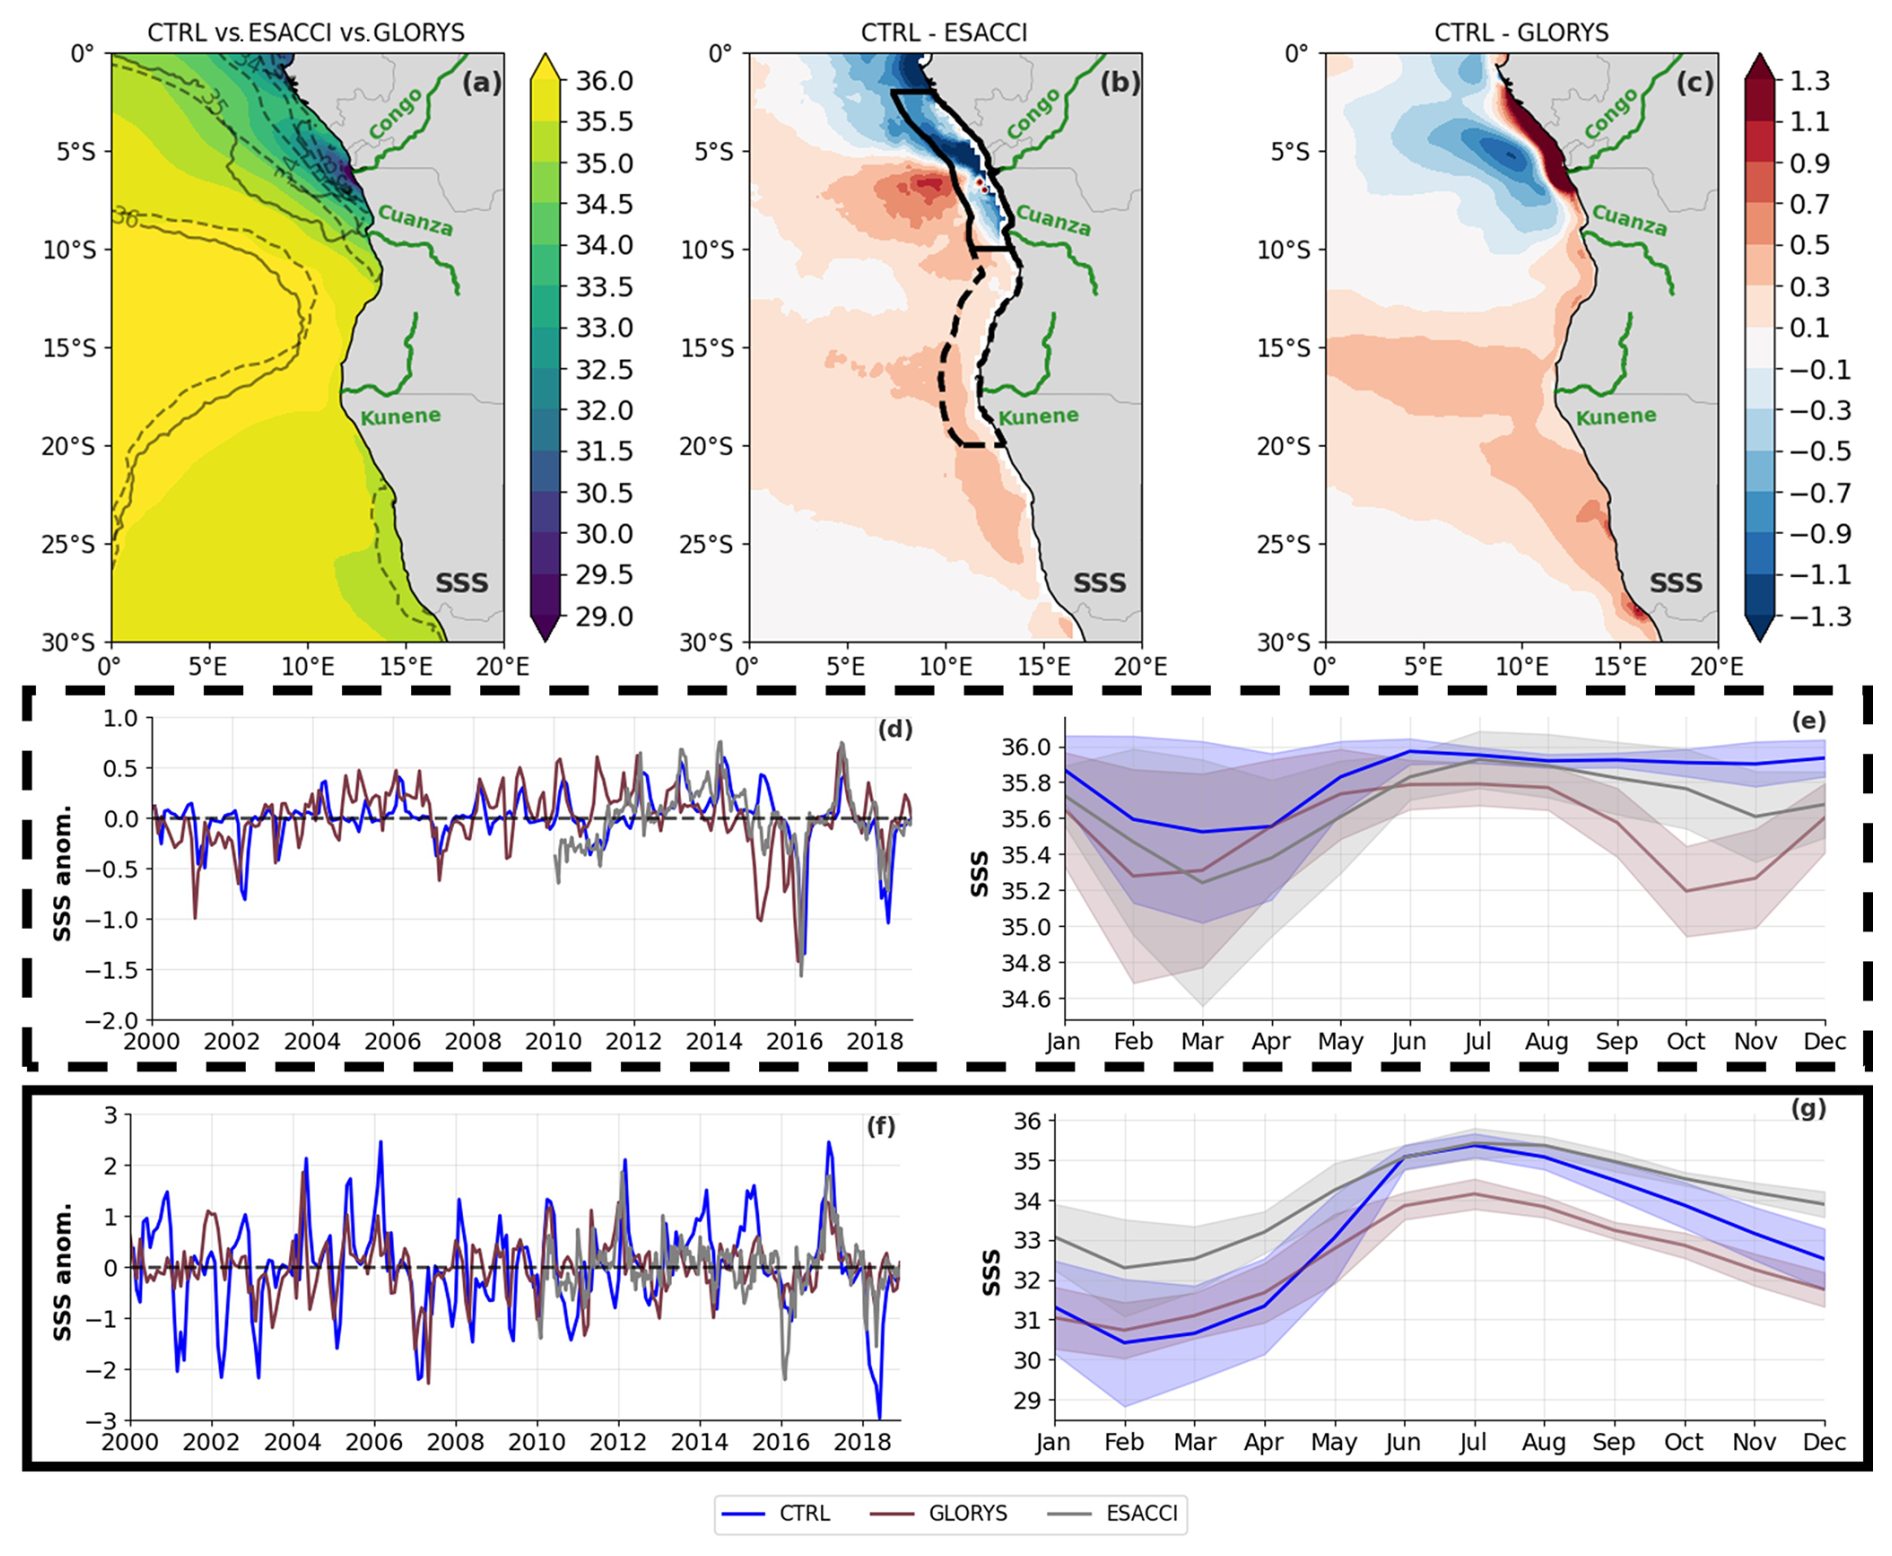
Figure 2Comparison of simulated SSS against observations and reanalysis. (a) Mean SSS from CTRL (shading), ESA CCI (solid contours), and GLORYS (dashed contours; contour interval is 1). Both CTRL and GLORYS are averaged from 2000–2018, while ESA CCI is averaged from 2010–2018. (b) Difference between CTRL and ESA CCI mean SSS from 2010–2018. The dashed black contour indicates the coastal Angola–Benguela area (CABA; 10–20° S, 200 km away from coast). The solid black contour shows the Congo River mouth area (CRMA; 2–10° S, 200 km away from coast). (c) Difference between the CTRL and GLORYS mean SSS from 2000–2018. (d) SSS anomalies averaged for CABA for the CTRL (in blue) and datasets (GLORYS in brown and ESA CCI in grey). (e) Same as (d) but for the seasonal climatologies. Shading indicates monthly standard deviations. Panels (f) and (g) are the same as panels (d) and (e) but for CRMA.
Regarding the CABA region, both ESA CCI and GLORYS12 present similar SSS mean values and spatial patterns. When comparing these products to CTRL, we see a salty bias ranging from 0.1 to 0.7 extending from 10° S further south (Fig. 2b, c). It is an indication that the CRD freshwater influence on the SSS in CTRL is restricted to further north than what is observed in satellite and reanalysis products. The difference is even higher from September to November (Fig. 2e). As a consequence, the CTRL output presents a higher (lower) SSS variability north (south) of 10° S in comparison to both products (Fig. S4d–f). The CTRL SSS variability is especially weaker in the CABA (Figs. 2d and S4d–f) when compared to both reanalysis and satellite, which could partly explain the same area of weaker CTRL SST variability in comparison to the standard deviations of OISST and GLORYS SST's (Fig. S4a–c) since SSS has been shown to influence extreme warm events in the CABA (Lübbecke et al., 2019; Aroucha et al., 2024). Finally, it is important to highlight that CTRL and CLIMA, similarly to what was observed for SST, show very similar SSS anomalies and seasonal climatologies, especially in the CABA (Fig. S3a–d, blue and green lines overlapping).
In terms of freshwater input, it is central to bear in mind that the model freshwater input considers not just the freshwater from the Congo River, but all freshwater input from land to the ocean given by JRA55-do. To check how much of this input can be attributed to the CRD, we averaged the CTRL freshwater input for a coastal box at the Congo mouth and compared it to the discharge at the Kinshasa–Brazzaville station, which represents 98 % of the total CRD (Alsdorf et al., 2016) (Fig. S1). In terms of magnitude, the seasonality of both freshwater inputs is similar (Fig. S1e). The seasonal climatology of the CTRL input compares well with the in situ station from December to April in particular, while from June to October it shows lower freshwater input into the ocean (Fig. S1e). Although the seasonality is well represented by CTRL, the interannual variability of the freshwater input is not as highly correlated to the Kinshasa–Brazzaville station (i.e. r = 0.46; Fig. S1d). Similar discrepancies were observed in the study by Chandanpurkar et al. (2022).
Furthermore, the alongshore and cross-shore current velocities from CTRL were checked against the 11° S mooring measurements taken in the CABA (Fig. S5). The mooring velocities were complemented at the surface with data from GlobCurrent (see Sect. 2.2). In general, the Angola Current is underestimated by CTRL throughout the year, especially from January to May (Angola Current core is located around 30–70 m depth) (Fig. S5b, d). Further, the model presents a much stronger northward surface coastal jet than what is observed at the mooring position. Since advection plays a major role in the SSS distribution in the region, it is likely that a stronger (weaker) than observed northward (southward) current traps the low SSS further north in CTRL. This would explain the previously identified increased (reduced) SSS variability north (south) of 10° S (Fig. S4d–f). It would also mean that the freshwater transport to south of 12° S is nearly absent in the model experiments. Still, at the surface, CTRL seems to well represent the seasonality of the GlobCurrent velocities at the mooring position, with a stronger southward (northward) current from January to February (March to August) and September to October (November to December) (Fig. S5b, d).
Overall, we believe that CTRL represents the major aspects of the mean state and seasonality of the variables discussed here. Moreover, the initial analysis of NORIV already points out the impact of freshwater input on both SST and SSS. Still, it seems that in the simulations no significant differences result from interannual vs. climatological land-to-ocean discharges, indicating an insignificant impact of the interannual freshwater input variability on the variables analysed here. In the following, we analyse the differences between the three experiments.
3.2 Impacts of freshwater input
3.2.1 Differences between the experiments
To understand whether the freshwater input into the ocean impacts the SST near the southwestern African coast, we first look at the mean SST differences between the three experiments (Fig. S6). The freshwater presence significantly affects the SST mean state in the coastal SETA region regardless of using an interannual (CTRL) or climatological (CLIMA) runoff (Fig. S6a, b); similar SST differences between these two experiments with discharge and the one without (NORIV) are observed in terms of not only the spatial pattern but also the magnitude of those differences. At the same time, no significant mean SST difference was observed between CTRL and CLIMA experiments (Fig. S6c), as also seen in Fig. S2a–b. Additionally, CTRL and CLIMA did not significantly differ in the mean SSS fields (Fig. S6f). Regarding SST variability, our experiments show no significant influence of freshwater input on monthly standard deviations of SST anomalies (Fig. S7). We thus conclude that the presence of a land-to-ocean discharge alone generates the observed SST differences, with no further impact of an interannual varying discharge. Hence, in the following, we focus on the effects of the climatological freshwater runoff presence on the SST mean state in the SETA.
Figure 3 depicts the mean state difference between CLIMA and NORIV for SST, SSS, SSH, ocean currents, and horizontal advection (Adv). The freshwater input significantly warms the southwestern Africa coastal fringe, south of the Congo River mouth. By including the discharge, the mean SST is increased by up to 0.9 °C near the coast at about 13° S, and 0.26 °C on average in the CABA (Fig. 3a–d). With freshwater input, strong warming is also observed at the Kunene River mouth (Fig. 3c). This pattern of positive SST differences is observed along the whole coast, from the Congo River mouth at ∼ 6° S extending to ∼ 28° S. Concomitantly, freshwater discharge generates a significant cooling north of the Congo River (i.e. change in SST of up to −1.9 °C at 6° S), with a maximum negative SST difference from ∼ 6 to ∼ 4° S (Fig. 3a).
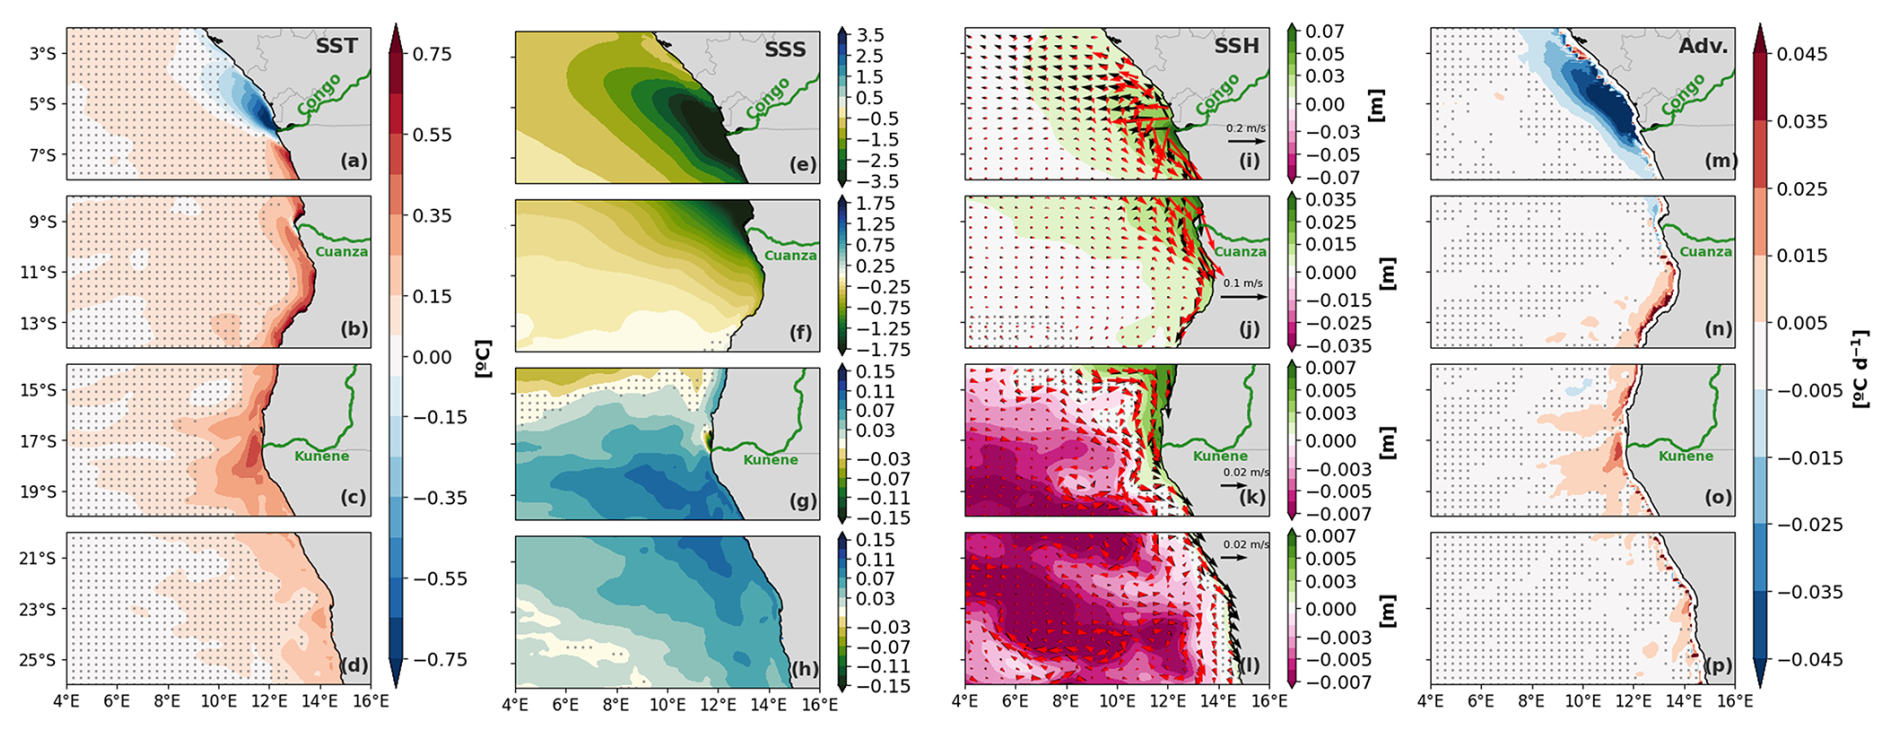
Figure 3Differences between CLIMA and NORIV mean states (CLIMA−NORIV) for SST (a–d), SSS (e–h), SSH (i–l), and horizontal advection (m–p). Stippled grey areas indicate where the difference is not significant at a 95 % confidence level. Black (red) arrows from (i)–(l) depict total (geostrophic) current difference between experiments. Note that colour scales change for individual subplots for SSS and SSH.
In order to understand this difference in SST, we investigate the dynamic effects of the river presence. A land-to-ocean discharge significantly reduces the SSS in the whole SETA up to ∼ 15° S (Fig. 3e–g). The magnitude of freshening is stronger at the Congo's mouth, where differences reach −6 and decrease towards the south (note that colour scale limits change from Fig. 3e–g). Although different rivers flow into the Atlantic at the southwestern African coast, the discharge rate from the Congo River is by far the largest and completely dominates the SSS differences observed between the model simulations. Still, a lower-magnitude SSS reduction is also observed at the Kunene River mouth (Fig. 3g). The mean low-SSS plume from the Congo River spreads towards the west-northwest, consistent with the main direction of the CRD dispersion shown in previous studies (Houndegnonto et al., 2021; Awo et al., 2022; Martins and Stammer, 2022). From 17° S to the south, however, an overall increase in SSS is noted when including the discharge in the experiments. Even though the magnitude of the SSS increase is only ∼ 5 % of the SSS decrease further north, it is still significant (Fig. 3g–h). An SSS decrease due to the freshwater presence is accompanied by a similar pattern of increasing SSH (Fig. 3i–l). This inverse relation is a consequence of the halosteric effect in the water volume, i.e. an expansion (contraction) of a water volume via the density reduction (increase) owing to the lower (higher) salinities. The SSH increase patterns in the SETA coincide with not only the strong changes in SSS due to the CRD but also the regions at the coast, where the model's freshwater input into the ocean takes place (Fig. S1). Differences in SSH reach up to 7 cm at the Congo's mouth (i.e. ∼ 6° S; Fig. 3i) and are ∼ 10 times smaller at Kunene River mouth, although they are still significant (Fig. 3k).
As a consequence of the changes in SSH, the freshwater input changes the dynamics of the coastal SETA. The red (black) arrows depicted in Fig. 3i–l represent the difference between CLIMA and NORIV in the geostrophic (total) currents. By including the land-to-ocean discharge, a strong coastal southward jet is generated at the southwestern African coast south of 6° S. This current is mainly geostrophic and follows the SSH gradients to ∼ 17° S. South of this latitude the ageostrophic component is stronger, but geostrophy still seems to play a role in the southward current (Fig. 3l). In contrast, north of the Congo's mouth we observe a northwestward geostrophic current, also following the northernmost extension of the high-SSH dome generated by the low-SSS plume (Fig. 3i), flowing parallel to the coastline. Acting on the strong mean state meridional temperature gradient present in the region (Fig. 1a), these shifts in the surface coastal currents lead to changes in horizontal temperature advection. The differences in horizontal temperature advection (Fig. 3m–p) closely resemble those in SST (Fig. 3a-d). Except for the coastal stripe from 6 to 11° S, freshwater-induced horizontal advection appears to be responsible for the increased coastal SST in CLIMA. The relative effects of changes in surface currents and in the surface horizontal temperature gradients present in the area (Fig. 1a) are investigated further in the next section.
Finally, by calculating the BLT and the squared Brunt–Väisälä frequency, N2, we also assess the freshwater input impacts on the mean stratification and stability of the water column. BLT and N2 differences among the experiments (Fig. S8) show extremely similar patterns to the ones observed in SSS (Fig. 3e–h), with a significant negative (positive) SSS difference implying a significant positive (negative) difference in both BLT and N2 averaged from surface to 50 m. It represents an increase in the water column stratification and a generation of barrier layers at the Congo plume via freshwater discharge in the SETA. Along with at the Congo River plume, a similar response to the freshening is observed at the Kunene River mouth, but with a smaller magnitude (i.e. BLT larger than 8 m at 6° S and ∼ 3 m at 17° S). Further, the barrier layer induced by a freshwater input does not fully correspond with the region of increased SST. It is expected that a combination of stronger stratification with a weaker vertical temperature gradient within the BLs could isolate the surface from the deeper water column layers, reducing the mixing and contributing to an SST increase. However, it has been shown that this might not always be the case in the SETA due to the counteracting effect of solar radiation penetrating through the very shallow mixed layer (White and Toumi, 2014). However, at the Kunene River mouth the pattern of lower SSS and thick barrier layer seems to boost the SST differences, creating an area of higher SST differences at 17° S (Fig. 3c).
Overall, we find that including a freshwater discharge in the experiments leads to significant changes in the dynamic and thermodynamic mean state of the SETA. These effects are characterized by the CRD freshwater input reducing the SSS followed by a halosteric increase in SSH, thereby generating poleward coastal currents south of the river mouth and equatorward coastal currents north of it, advecting warmer waters to further south and cooler waters to the north of the Congo's mouth. Although the observed differences south of the area of the major Congo influence (i.e. south of 13° S) are small when compared to the river's mouth region (i.e. ∼ 6° S), they are still significant. Albeit small, the change in the 2000–2018 mean state indicates that the effects presented above are constantly and continuously present. In fact, the isotherms' outcropping latitudes are shifted towards the south in CLIMA compared to NORIV (Fig. S8) as a consequence of this mean state change. Likely due to the constant southward coastal jet, the presence of a freshwater discharge moves the isotherm's position further south. Therefore, the position of the ABF, a front of strong temperature gradient, is also pushed towards the south in the experiment with the freshwater input present. This shift in the ABF location might have substantial impacts on the environmental conditions around this region, which is further discussed in Sect. 4. In the following section, we detail the warming from advection in the CABA.
3.2.2 Advection warming the coastal Angola–Benguela area
In this section, we disentangle the cascade of events described in Sect. 3.2.1 by showing the role of the freshwater-induced dynamical change in increasing the SST at the southwestern African coast. Figure 4 statistically shows the SSH response to the SSS change, the horizontal advection response to the SSH change, and the SST response to the advection change from the CRMA region to the CABA. Each point corresponds to one of the 228 analysed months, indicating significant correlations throughout the year and representing mean state permanent responses.
The difference in SSH in the CRMA is strongly and inversely correlated to the SSS change in the same region (r = −0.82, p<0.05; Fig. 4a), highlighting the crucial role of the halosteric effect in increasing the SSH at the Congo's mouth. At the same time, a positive and significant correlation is observed between a CRMA SSH change and the horizontal advection in the CABA (Fig. 4b). A 5 cm increase in SSH implies a ∼ 6 W m−2 increase in horizontal temperature advection in the CABA. Finally, differences in both horizontal temperature advection and SST in the SETA coastal area are also positively and significantly correlated (Fig. 4c), indicating that the stronger advection in CLIMA leads to increased SST compared to NORIV.
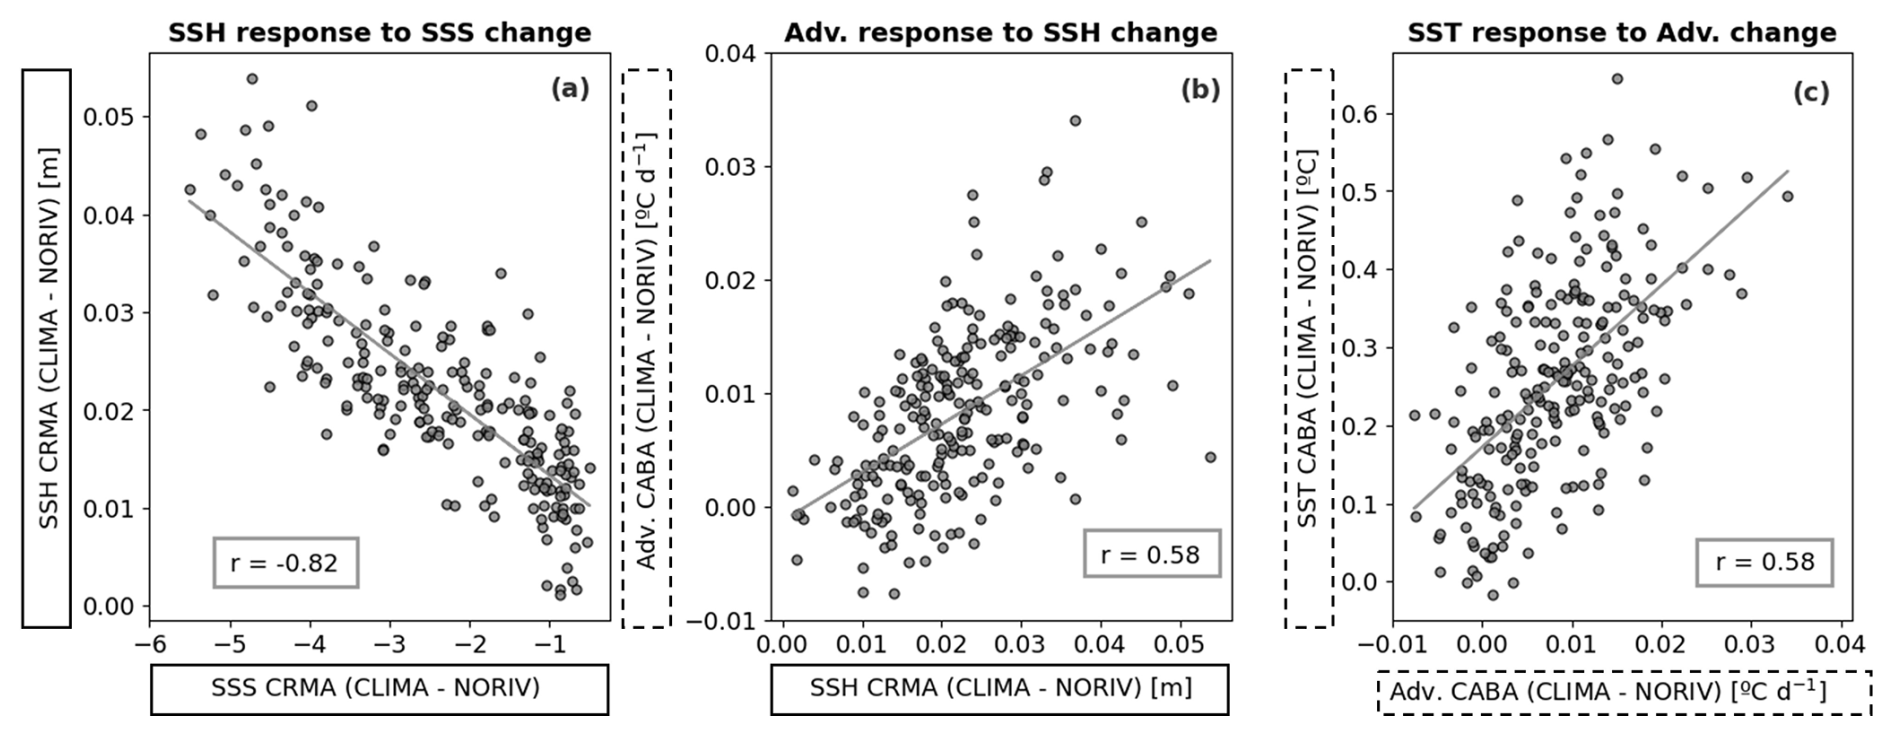
Figure 4Ocean response to land-to-ocean discharge. (a) Linear regression of monthly SSS differences upon monthly SSH differences (CLIMA−NORIV) averaged for CRMA. (b) Linear regression of monthly SSH differences upon monthly advection differences (CLIMA−NORIV) averaged for CRMA and CABA, respectively. (c) Linear regression of monthly advection differences upon monthly SST differences (CLIMA−NORIV) averaged for the CABA area. CRMA and CABA are defined in Fig. 2.
To investigate if the causes of the horizontal temperature advection differences observed between the model experiments stem from changes in the surface currents or from shifts in the horizontal temperature gradients, we calculated the terms by only varying one of these parameters and then compared the results. Figure S9a depicts total horizontal temperature advection differences similar to Fig. 3m–p, Fig. S9b shows the effect by only changing the temperature gradient (i.e. ), and Fig. S9c displays the influence related to changes only in the horizontal velocity (i.e. ). From Fig. S9 we can see that by changing only the horizontal velocity in the calculation (Fig. S9c), we generate a spatial pattern and magnitude that mostly resembles the total advection difference (Fig. S9a). The dynamical effect on the advection term generates a similar warming (cooling) signal by the freshwater presence south (north) of the Congo's mouth (i.e. ∼ 6° S). The difference pattern resulting from only changing the current also depicts a stronger advection extending to ∼ 28° S even though the mean state current change at this location is considerably weaker than the strength of this shift at around 6° S (Fig. 3i). The maximum positive difference in Fig. S9c is located in the ABF region (i.e. 15–18° S), supporting the argument that the stronger southward current created by the freshwater input from land pushes the ABF further to the south (Fig. S8).
Finally, it is likely that, by changing the geostrophic dynamics at the southwestern African coast, a freshwater discharge can shift the surface waters distribution in the SETA. For instance, an increased southward transport in the CLIMA experiment implies that warmer and saltier tropical waters push cooler and fresher subtropical waters to further south with the freshwater input. This can be seen by not only the isotherm's outcropping position southward shift in Fig. S8 but also the increase in SSS south of 17° S (i.e. a region which is usually not reached by Congo River waters) (Fig. 3). Indeed, both temperature and salinity horizontal gradients present in the SETA (see Figs. 1a and 2a) are important to these southward shifts; however, the strongest differences between the experiments are only significant due to a dynamical change in the surface geostrophic currents. Besides the advective effects in the CABA, it is still unclear, however, from which mechanisms the freshwater input can generate the coastal warming from 6 to 11° S. In addition, we wonder whether a shift in the surface geostrophic currents might also impact the local geostrophic upwelling. In Sect. 3.2.3 we attempt to answer these questions.
3.2.3 Changes in upwelling
In the previous sections, we show that the presence of a land-to-ocean freshwater discharge leads to an intensification of the surface geostrophic currents in the SETA dominantly in alongshore direction, especially close to the Congo River mouth. The strengthening of the geostrophic dynamics in this region by the freshwater input also generates cross-shore currents. Offshore geostrophic flows (Fig. 3i, j) favour coastal upwelling, while onshore flows are related to downwelling. In fact, it has been recently shown that an additional onshore geostrophic flow is generated by the Niger River presence in the Gulf of Guinea to the west of the river mouth even though no significant impact on upwelling was attributed to this onshore geostrophic flow (Alory et al., 2021). To investigate if this is also the case along the southwestern African coast, we calculate dynamical upwelling indices for the CLIMA and NORIV experiments.
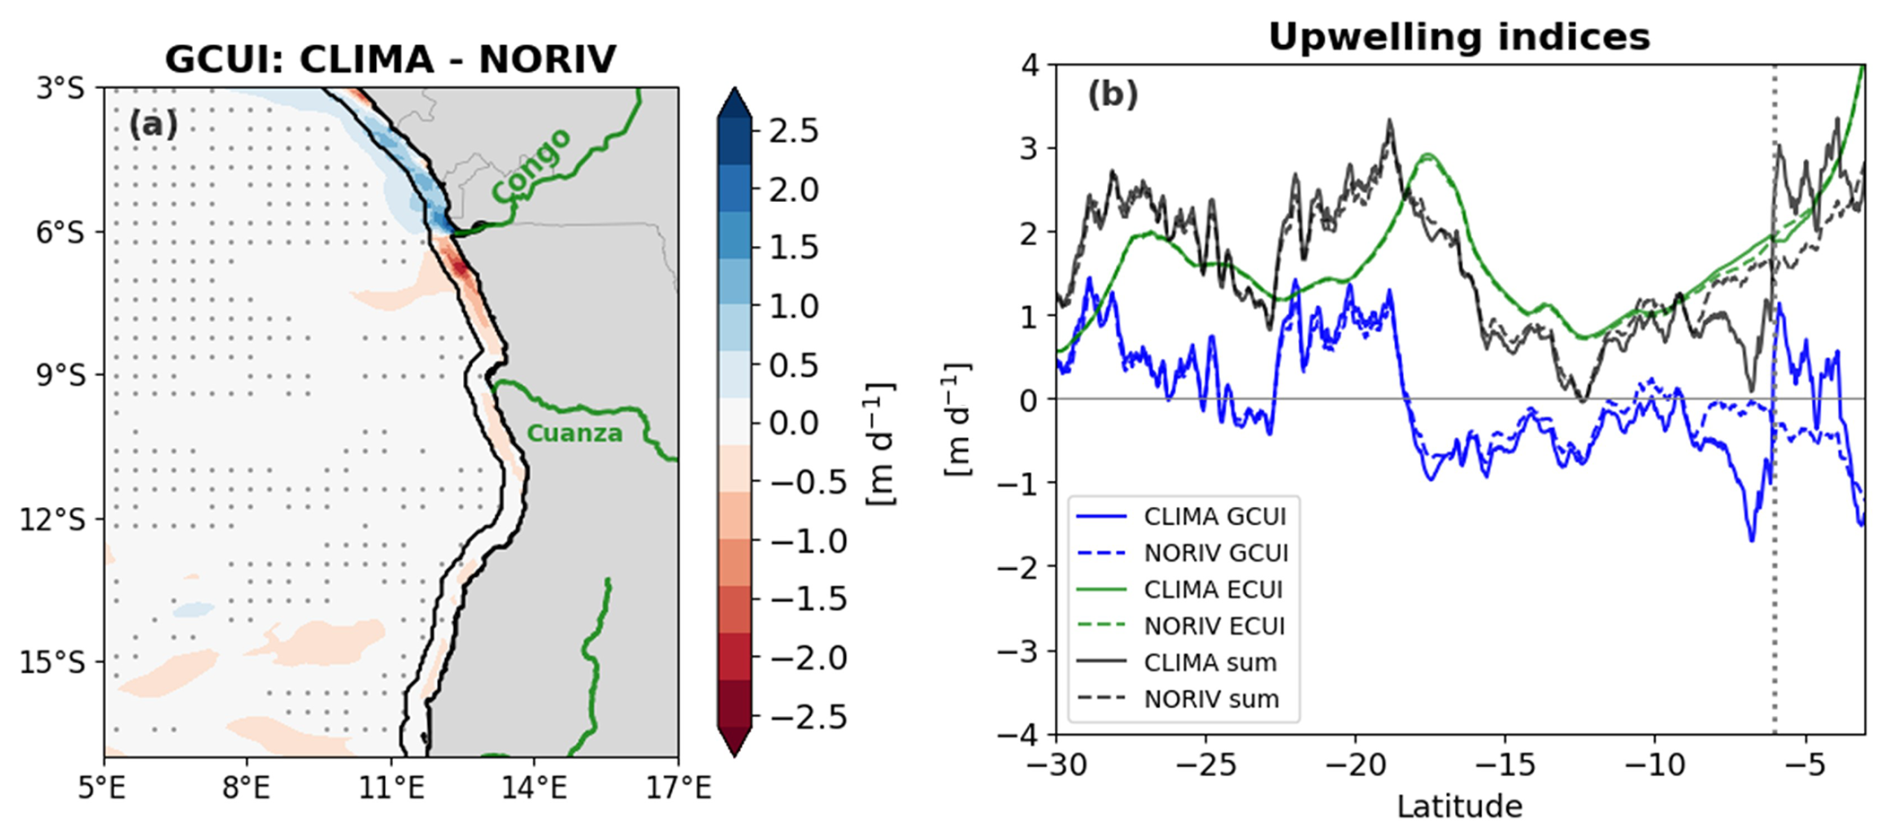
Figure 5Freshwater input impact on upwelling. (a) Difference between CLIMA and NORIV for the mean geostrophic coastal upwelling index (GCUI). Coastal mask in (a) marks the points 50 km away from coast, indicating the region where upwelling occurs (i.e. Lu; Eqs. 5, 6). (b) Mean upwelling indices averaged for coastal mask depicted in (a). Solid (dashed) lines indicate CLIMA (NORIV) indices. GCUI, ECUI, and the sum of the indices are represented by blue, green, and black lines, respectively. The pointed line in 6° S indicates the position of the Congo River mouth. Positive (negative) values in both (a) and (b) represent upwelling (downwelling).
Figure 5 shows the mean state differences between CLIMA and NORIV in the calculated upwelling indices. No changes between the experiments were found for ECUIs (Fig. 5b, green lines) along the southwestern African coast. This result was expected since both experiments are based on an ocean-only model with the same atmospheric wind forcing. Overall, the ECUI dominates the total upwelling intensity along the southwestern African coast, especially in the Benguela upwelling system, south of 17° S (Fig. 5b). In this area, the GCUI is much weaker and close to zero from ∼ 28 to 23° S. It is widely known that wind-driven upwelling dominates this eastern boundary system (e.g. Bordbar et al., 2021; Brandt et al., 2024; Fennel, 1999). North of 17° S, ECUI still dominates but to a lesser extent. An onshore geostrophic flow counteracts the wind-driven upwelling from 17 to 6° S (i.e. negative values for GCUI). It has recently been shown that at this location, in the Angolan upwelling system, upwelling and high productivity are not governed by the wind forcing but were shown to be mixing-driven and related to the passage of coastally trapped waves (Brandt et al., 2024; Körner et al., 2024). Still, from 30 to 10° S no large differences were observed between the upwelling indices from the different simulations.
However, from 10° S to further north, and especially around the Congo river mouth, strong and significant differences in the GCUI are found between the experiments. From the NORIV experiment, the coastal geostrophic upwelling is nearly absent around the area of Congo River influence (Fig. 5b). On the other hand, by including land-to-ocean freshwater input, an offshore (onshore) geostrophic flow resulting from the low-salinity water discharge generates coastal divergence (convergence) from 6 to 4° S (8 to 6° S) (Fig. 5a, b). The resulting upwelling (downwelling) corresponds to reduced (increased) SST in CLIMA when compared to NORIV (Fig. 3a). Thus, the freshwater-induced downwelling might explain the warming signal from 6 to 10° S, which is not explained by the strengthened coastal southward advection.
In this study, we have shown the effects and mechanisms of the freshwater input presence on the mean state SST in the southwestern African coastal region. To do that, we focused on comparing two model experiments: one with climatological freshwater discharge (CLIMA) and one without any discharge from land to ocean (NORIV). The processes are summarized in Fig. 6. Including a land-to-ocean freshwater discharge results in a strong reduction in SSS near the coast, which generates a halosteric effect in the water column, increasing the SSH and creating a geostrophic surface circulation. The halosteric SSH increase as a result of the CRD creates a primary alongshore SSH gradient that is in balance with a cross-shore geostrophic current, which, in turn, generates a secondary cross-shore SSH gradient (Fig. 6). While the primary alongshore gradient is associated with cross-shore geostrophic currents, upwelling north of the Congo River mouth and downwelling south of it, the secondary gradient drives the alongshore geostrophic current related to the alongshore advection that reduces and increases the SST north and south of 6° S, respectively (Fig. 6). While this advective signal can propagate southward (Fig. 6) due to the coastally trapped wave adjustment and affect regions further south, in the north it must be limited to the region close to the Congo River mouth as there is no equatorward wave propagation. It is also in agreement with the fact that the SSH maximum is at the coast south of the river's mouth and moves away from the coast north of it (Fig. 3). In summary, the halosteric increase in SSH at the Congo's mouth produces a southward coastal geostrophic flow, with an onshore geostrophic component south of 6° S. The generated southward coastal jet advects warmer waters further south, from ∼ 10 to ∼ 25° S. Concomitantly, the onshore geostrophic components significantly reduce the upwelling from 6 to 10° S. North of 6° S the opposite occurs. The halosteric increase in SSH generates a northward geostrophic current at the coast which advects cooler waters to the north at the same time that the offshore component of this geostrophic flow is associated with a significant increase in upwelling from 6 to 4° S. Hence, the climatological freshwater discharge simultaneously generated downwelling and advection that increases the mean state SST south of the River mouth; and upwelling and cooling from advection, reducing the SST mean state north of it. Furthermore, the southward advection likely pushes the Angola–Benguela Front further south. Overall, it seems that changes in stratification did not play a major role in altering the surface temperatures, especially at the Congo River mouth. In the following, we discuss the main findings and caveats of our study.
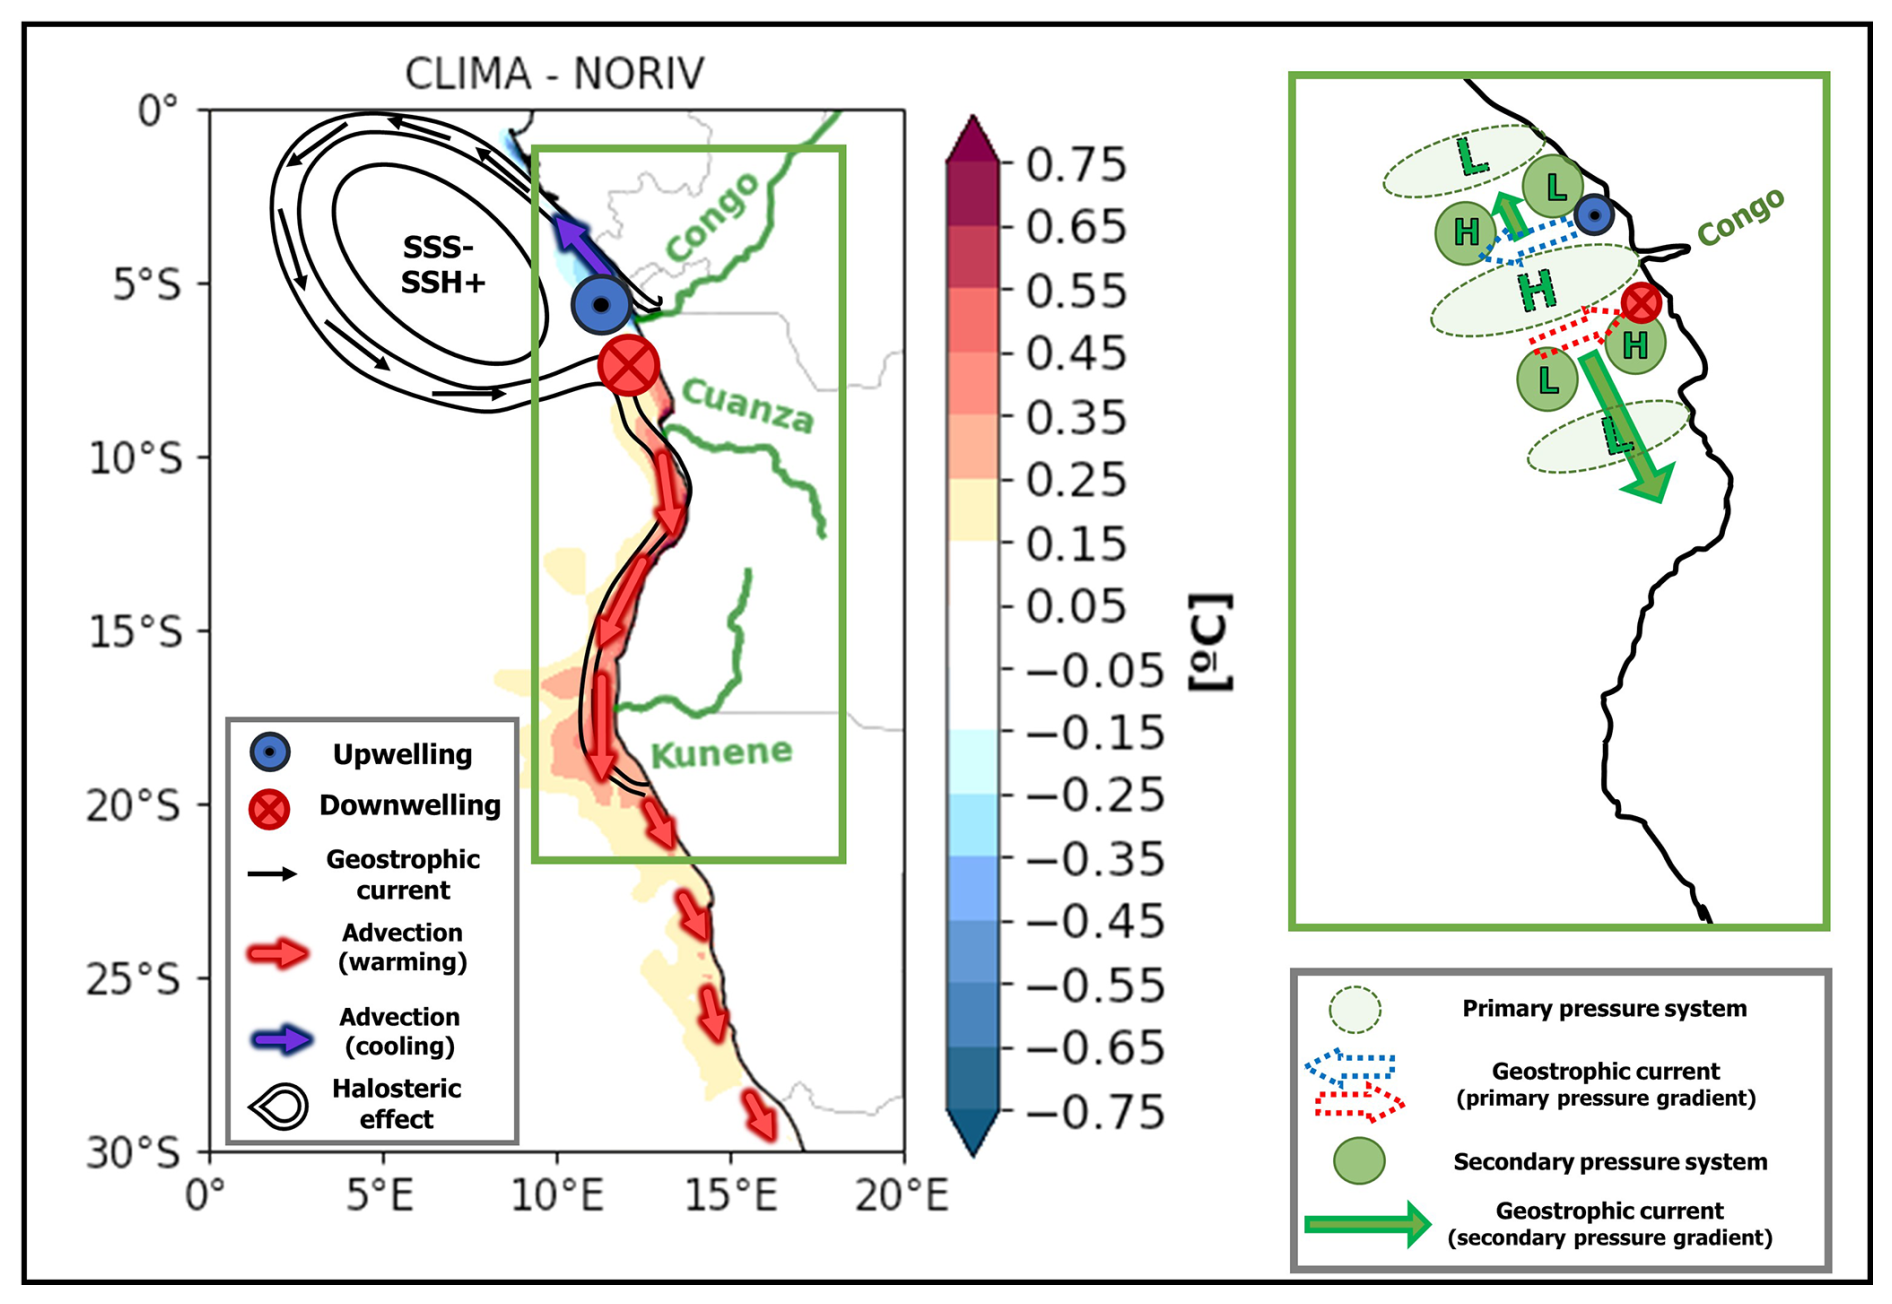
Figure 6Schematic summarizing the processes related to the freshwater input effect on mean state SST at the southwestern African coast. The halosteric effect generates the primary alongshore pressure gradient, producing cross-shore geostrophic currents associated with upwelling (downwelling) north (south) of the Congo's mouth, which creates a secondary cross-shore pressure gradient. The secondary gradient drives the alongshore flow responsible for the advection. This signal propagates southward due to coastally trapped wave adjustment, while in the north it is restricted to a region close to river's mouth since there is no equatorward wave propagation. H (L) indicates a high-pressure (low-pressure) area.
The CTRL mean SST presented a warm bias when compared to satellite and reanalysis products. The warm SST bias is indeed an established and long-standing issue in both climate and regional ocean model simulations along the eastern boundary upwelling systems (e.g. Farneti et al., 2022; Small et al., 2024). Weak upwelling velocities and equatorward surface flow, poor representation of clouds, and model spatial resolution have been discussed as some of the causes of these errors (e.g. Richter, 2015; Bonino et al., 2019; Small et al., 2024). Within the SETA, the Benguela upwelling system appears to be even more challenging to simulate, likely due to the convergence of significantly distinct water masses, the unique spatial structure of the wind field, and its influence on the dynamics of these coastal waters (Bonino et al., 2019; Kurian et al., 2021). For instance, the ABF location and the strength of the Angola Current have been pointed out as major causes of warm biases in general circulation models (Koseki et al., 2018). At the same time, De La Vara et al. (2020) showed that the warm bias in the region is decreased by increasing the oceanic model resolution. Furthermore, Small et al. (2024) recently showed that using the higher-resolution JRA55-do as atmospheric forcing in an ocean model also contributes to reducing the SST bias in the Benguela upwelling region since it can better represent the alongshore winds and its associated downwind surface currents in comparison to the lower-resolution CORE even though a substantial bias relative to observations remains. Finally, the direct comparison between CTRL and the satellite product could present some caveats since in this case we are comparing measurements at different depths (satellite skin layer temperature vs. 3 m depth as the first level in the model).
Simultaneously, there are also difficulties in well representing SSS fields, especially near the coast and close to river mouths, due to its high variability, strong vertical gradients, and low sampling rates in those regions (Boutin et al., 2021; Martins and Stammer, 2022; Nyadjro et al., 2022). However, both ESA CCI and GLORYS12 products have been used and validated in the southwestern African coastal region against independent in situ measurements (Tchipalanga et al., 2018; Martins and Stammer, 2022; Aroucha et al., 2024). Overall, they seem to perform well, with the larger uncertainties located at the Congo mouth as expected (Martins and Stammer, 2022). In this study, the highest differences between the model SSS and both the satellite and reanalysis products were also found in the SETA coastal region. As previously mentioned for temperature, the ESA CCI satellite measurement of skin layer salinity can also likely differ from the 3 m depth first level of CTRL, considered here to be the surface. Further, in regions of strong vertical stratification such as river mouths, the depth level difference between products creates even larger SSS biases, as shown in the Gulf of Guinea by Nyadjro et al. (2022). Furthermore, the uncertainty in JRA55-do CRD is not well defined and might be substantial. Large discrepancies between this reanalysis forcing and the Brazzaville–Kinshasa gauge measurements have been attributed to the Congo Basin complex hydrology and the lack of field observations of climate variables in the region (Chandanpurkar et al., 2022; Hua et al., 2019). Hence, discrepancies between model and satellite SSS data within this region could be mainly related to the fidelity of these estimates (Chandanpurkar et al., 2022).
Additionally, the SSS variability in the coastal SETA is determined by not only freshwater input from the CRD but also the subsequent horizontal advection of the low-SSS water by surface currents, with the river plume usually spreading west-northwestward, while some fractions of it are also advected southward along the coast (Houndegnonto et al., 2021; Awo et al., 2022; Ngakala et al., 2023). This southward alongshore advection is subject to interannual variability mainly driven by the Angola Current and the propagation of coastally trapped waves (Awo et al., 2022; Martins and Stammer, 2022). Therefore, the SSS differences between the model simulation and the analysed datasets are also likely explained by shifts in the freshwater input and more importantly by the surface circulation difference between the three products. In the latter case, the CTRL low SSS from the CRD is confined to further north (i.e. to ∼ 10° S) than what is observed for both ESA CCI and GLORYS (Fig. 2).
Regarding SST variability, patterns of SST anomalies standard deviations from CTRL resemble those in observations (Fig. 2c). Besides the reduced amplitude for extreme events in CTRL, the interannual anomalies are overall well represented. The reason for the reduced SST variability in the model simulation remains uncertain (Fig. S4b–c). Recently, Prigent and Farneti (2024) showed that using JRA55-do atmospheric forcing improved the SST variability simulation in eastern boundary upwelling systems, including the CABA (see their Fig. 10), when compared to the use of CORE-II forcing. Hence, it is believed that the cause of the variability underestimation in our case is not in the atmospheric forcing. One possible explanation, for SSS as well, could be an overly weak southward current in CTRL. Similar to the SSS variability, extreme events of SST in the region are also forced by coastally trapped wave propagation and a southward advection mechanism related to equatorial and local dynamics, usually peaking in boreal spring (e.g. Aroucha et al., 2024; Bachèlery et al., 2020; Imbol Koungue et al., 2019; Rouault et al., 2007, 2018; Florenchie et al., 2004). Therefore, a weaker representation of the Angola Current might generate reduced SST anomalies during extreme events. In fact, Benguela Niños, for which southward advection played an important forcing role, such as in 2001 and 2011 (Rouault et al., 2007, 2018), were shown to have reduced SST anomalies in CTRL (Fig. 1c). At the same time, the January–May alongshore southward current is underestimated by the model in relation to the mooring measurements (Fig. S5). This fact also implies the reduced SSS variability in the CABA in CTRL, which is another likely reason for the underestimated CTRL SST variability, since low-SSS waters have been linked to extreme positive SST events in the region (Aroucha et al., 2024; Lübbecke et al., 2019).
In this study, we focused on the climatological runoff impact on the SST mean state (i.e. CLIMA vs. NORIV) since no significant differences in the SST means were observed between the simulations with climatological vs. interannually varying runoff (i.e. CTRL vs. CLIMA; Fig. S6). This does not necessarily imply, however, that an interannually varying runoff does not influence the SST variability in the region. It has been recently shown through observational datasets that a freshwater input in the Angola–Benguela area (ABA; 10–20° S, 8° E to the coast) could indeed boost extreme warm events in this area through increasing stratification and reducing vertical mixing (Aroucha et al., 2024; Lübbecke et al., 2019). For this, a combination of anomalously high CRD with stronger southward advection and the passage of a coastally trapped wave is required to bring the low-SSS waters close to the ABF region (Martins and Stammer, 2022). In the 19 simulated years (2000–2018), however, the southernmost extension of a coastal SSS difference between CTRL and CLIMA was ∼ 14° S (−0.1 in December 2010, not shown), which is still too far north for the expected influence to take place. Hence, from the experiments analysed here, not much can be said regarding CRD anomalies influencing SST variability in the ABA. Nevertheless, relevant outcomes regarding the freshwater influence on the SST mean state in the SETA can be concluded from the present study.
During the last few years, modelling studies have been addressing the processes by which a freshwater discharge could impact SSTs. The main argument is that increasing the input of low-salinity waters into the ocean would increase SSTs by strengthening the stratification and inhibiting the upwelling of cold waters (e.g. Topé et al., 2023; Zhang and Busalacchi, 2009). On the other hand, at the Congo River mouth, the work from White and Toumi (2014) pointed to no significant influence of an increased stratification by freshwater in warming the sea surface. Instead, they showed that the mixed layer shoaling due to the Congo discharge generated a considerable heat loss to beneath this thin layer, which then exceeded the reduced vertical mixing impact even though barrier layers were formed (White and Toumi, 2014). In fact, this latter result agrees with what we find in this study. In spite of the significant barrier layer difference between CLIMA and NORIV at the river plume, the barrier layer generation area differs from the observed spatial warming pattern (solely concentrated at the coast, south of 6° S). We hypothesize that this is due to the same argument presented by White and Toumi (2014), i.e. the surface heat loss due to the very shallow MLD at the river mouth. Additionally, their simulations demonstrated a significant coastal warming impact south of 6° S (White and Toumi, 2014). Although the authors did not explore this further, they suggested that a change in ocean dynamics due to the river's presence is responsible for the observed coastal warming pattern. Here we dig into this mechanism, showing that indeed the coastal warming was a consequence of modified ocean dynamics via a change in geostrophic currents. Furthermore, we show that those changes in SST are restricted to the coast since the geostrophic current strengthening reflects the location of the coastal freshwater input.
It has been long known that river discharges can impact oceanic SSH (e.g. Meade and Emery, 1971; Piecuch et al., 2018; Chandanpurkar et al., 2022). To the best of our knowledge, however, this is the first study to report that a halosteric change in SSH and its gradients due to a freshwater discharge can impact the mean state coastal SST at an eastern boundary upwelling system via a change in geostrophic currents, subsequently altered horizontal temperature advection, and upwelling. The lateral salinity-generated pressure gradient at river plumes can induce surface geostrophic flows projecting at the coast (Fong and Geyer, 2002). Alory et al. (2021) found an additional onshore geostrophic flow in the Gulf of Guinea due to the Niger River input, also pointing to the possibility of a similar effect next to other large river plumes. The authors, however, observed that, with the river presence, the MLD was reduced and compensated for the increase in the onshore geostrophic flow without having an overall significant impact on the coastal geostrophic upwelling (Alory et al., 2021). Here we show that the Congo River can not only change the surface geostrophic flow but also limit upwelling to the south of its estuary by this generated onshore geostrophic current, at the same time that it can induce upwelling north of the river plume via an offshore component of this geostrophic flow (Fig. 5) as the changes in the MLD are here less significant than the changes in the coastal current. This work highlights the importance of properly understanding the impact of high freshwater input in ocean mixing and stratification as well as in the coastal dynamics. The results presented here might become even more relevant in the future when considering recent studies showing upwelling shifts at the southwestern African coast due to wind-related geostrophic deviations in climate change scenarios (Ayissi et al., 2024; Jing et al., 2023). The role of geostrophic flows in eastern boundary upwelling systems mean state and long-term changes is more prominent in the Atlantic basin when compared to the Pacific (Jing et al., 2023). In addition, Jing et al. (2023) recall an ongoing discussion of the interaction between upwelling and other greenhouse warming-related processes (e.g. stratification and mesoscale activity) in these regions. As river runoffs are expected to be amplified in the future (Müller et al., 2024; Aloysius and Saiers, 2017), halosteric-related shifts in geostrophic flows can appear as an additional mechanism in this debate.
Furthermore, as we show that the freshwater presence pushes the ABF southward, we wonder if the future runoff amplification could also contribute to the recently observed trend of warming off the Angolan coast, where fresher and warmer tropical waters are moving poleward due to an Angola Current intensification (Roch et al., 2021; Tomety et al., 2024). Finally, the mechanism shown here could also play a role in Benguela Niño events in this area. Most of the advective warming from the southward geostrophic current is located within the CABA, where these events occur. Hence, in years of increased freshwater discharge, these warming events could be boosted by different mechanisms: the reduced vertical mixing via increased stratification (Aroucha et al., 2024) and the strengthening of the southward advection and downwelling due to the halosteric SSH increase, as shown in this work.
The data and scripts that support the findings of this study are available through GEOMAR at https://hdl.handle.net/20.500.12085/2b927bcd-afab-4bc6-ba97-634d09435daa (Aroucha and Schwarzkopf, 2024). Experiments identifiers are INALT20.L46-KFS104 (CTRL), INALT20.L46-KFS111 (CLIMA), and INALT20.L46-KFS106 (NORIV). Other datasets used in this work are publicly available under the following links: OISST (https://psl.noaa.gov/data/gridded/data.noaa.oisst.v2.highres.html, Huang et al., 2021; Reynolds et al., 2007), GLORYS12 (https://data.marine.copernicus.eu/product/GLOBAL_MULTIYEAR_PHY_001_030/download, Lellouche et al., 2021), ESA CCI (https://data.ceda.ac.uk/neodc/esacci/sea_surface_salinity/data/v03.21/30days, Boutin et al., 2021), Congo River discharge (https://hybam.obs-mip.fr/data/, SO-HYBAM, 2024), Current velocities from mooring data (https://doi.org/10.1594/PANGAEA.870917 (Krahmann, 2017), https://doi.org/10.1594/PANGAEA.909911 (Brandt and Krahmann, 2019), https://doi.org/10.1594/PANGAEA.909913 (Dengler and Krahmann, 2019), https://doi.org/10.1594/PANGAEA.939249 (Hummels et al., 2021), https://doi.org/10.1594/PANGAEA.962193 (Brandt et al., 2023)), and GlobCurrent data (https://data.marine.copernicus.eu/product/MULTIOBS_GLO_PHY_MYNRT_015_003/download?dataset=cmems_obs_mob_glo_phy-cur_my_0.25deg_P1M-m_202311, Rio et al., 2014).
The supplement related to this article is available online at https://doi.org/10.5194/os-21-661-2025-supplement.
LCA and JFL took part in conceptualizing and outlining the paper. LCA wrote the first draft and produced the figures. FUS and AB developed and ran the sensitivity experiments. All authors contributed to the discussion of the results and the writing of the manuscript.
The contact author has declared that none of the authors has any competing interests.
Publisher’s note: Copernicus Publications remains neutral with regard to jurisdictional claims made in the text, published maps, institutional affiliations, or any other geographical representation in this paper. While Copernicus Publications makes every effort to include appropriate place names, the final responsibility lies with the authors.
Léo C. Aroucha acknowledges the German Academic Exchange Service (DAAD). The model integrations were made possible by the provision of computing resources on the high-performance computing system JUWELS at the Jülich Supercomputing Centre (JSC) in the framework of the Earth System Modelling Project (ESM) and at the North German Supercomputing Alliance (HLRN). We thank Klaus Getzlaff for his help with the model data archive and the two anonymous reviewers and the editor for their helpful comments on the paper.
This research has been supported by the Deutscher Akademischer Austauschdienst (grant no. 57552340) and the Bundesministerium für Bildung und Forschung (grant no. 03F0796A).
The article processing charges for this open-access publication were covered by the GEOMAR Helmholtz Centre for Ocean Research Kiel.
This paper was edited by Karen J. Heywood and reviewed by two anonymous referees.
Alory, G., Da-Allada, C. Y., Djakouré, S., Dadou, I., Jouanno, J., and Loemba, D. P.: Coastal Upwelling Limitation by Onshore Geostrophic Flow in the Gulf of Guinea Around the Niger River Plume, Front. Mar. Sci., 7, 607216, https://doi.org/10.3389/fmars.2020.607216, 2021.
Aloysius, N. and Saiers, J.: Simulated hydrologic response to projected changes in precipitation and temperature in the Congo River basin, Hydrol. Earth Syst. Sci., 21, 4115–4130, https://doi.org/10.5194/hess-21-4115-2017, 2017.
Alsdorf, D., Beighley, E., Laraque, A., Lee, H., Tshimanga, R., O'Loughlin, F., Mahé, G., Dinga, B., Moukandi, G., and Spencer, R. G. M.: Opportunities for hydrologic research in the Congo Basin, Rev. Geophys., 54, 378–409, https://doi.org/10.1002/2016RG000517, 2016.
Aroucha, L. C. and Schwarzkopf, F. U.: Supplementary Data to: River discharge impacts coastal Southeastern Tropical Atlantic sea surface temperature and circulation: a model-based analysis, GEOMAR Helmholtz Centre for Ocean Research Kiel [data set], https://hdl.handle.net/20.500.12085/2b927bcd-afab-4bc6-ba97-634d09435daa (last access: 10 January 2025), 2024.
Aroucha, L. C., Lübbecke, J. F., Körner, M., Imbol Koungue, R. A., and Awo, F. M.: The Influence of Freshwater Input on the Evolution of the 1995 Benguela Niño, J. Geophys. Res.-Oceans, 129, e2023JC020241, https://doi.org/10.1029/2023JC020241, 2024.
Awo, F. M., Rouault, M., Ostrowski, M., Tomety, F. S., Da-Allada, C. Y., and Jouanno, J.: Seasonal Cycle of Sea Surface Salinity in the Angola Upwelling System, J. Geophys. Res.-Oceans, 127, e2022JC018518, https://doi.org/10.1029/2022JC018518, 2022.
Ayissi, F. F. B. K., Da-Allada, C. Y., Baloïtcha, E., Worou, L. O., and Tilmes, S.: Changes in coastal upwelling in the northern Gulf of Guinea under Stratospheric Aerosol Injection, Reg. Stud. Mar. Sci., 76, 103607, https://doi.org/10.1016/j.rsma.2024.103607, 2024.
Bachèlery, M. L., Illig, S., and Rouault, M. Interannual coastal trapped waves in the Angola-Benguela upwelling system and Benguela Niño and Niña events, J. Marine Syst., 203, 103262, https://doi.org/10.1016/j.jmarsys.2019.103262, 2020.
Biastoch, A., Schwarzkopf, F. U., Getzlaff, K., Rühs, S., Martin, T., Scheinert, M., Schulzki, T., Handmann, P., Hummels, R., and Böning, C. W.: Regional imprints of changes in the Atlantic Meridional Overturning Circulation in the eddy-rich ocean model VIKING20X, Ocean Sci., 17, 1177–1211, https://doi.org/10.5194/os-17-1177-2021, 2021.
Bonino, G., Masina, S., Iovino, D., Storto, A., and Tsujino, H.: Eastern Boundary Upwelling Systems response to different atmospheric forcing in a global eddy-permitting ocean model, J. Marine Syst., 197, 103178, https://doi.org/10.1016/j.jmarsys.2019.05.004, 2019.
Bordbar, M. H., Mohrholz, V., and Schmidt, M.: The relation of wind-driven coastal and offshore upwelling in the Benguela Upwelling System, J. Phys. Oceanogr., 51, 3117–3133, https://doi.org/10.1175/JPO-D-20-0297.1, 2021.
Boutin, J., Reul, N., Koehler, J., Martin, A., Catany, R., Guimbard, S., Rouffi, F., Vergely, J. L., Arias, M., Chakroun, M., Corato, G., Estella-Perez, V., Hasson, A., Josey, S., Khvorostyanov, D., Kolodziejczyk, N., Mignot, J., Olivier, L., Reverdin, G., Stammer, D., Supply, A., Thouvenin-Masson, C., Turiel, A., Vialard, J., Cipollini, P., Donlon, C., Sabia, R., and Mecklenburg, S.: Satellite-Based Sea Surface Salinity Designed for Ocean and Climate Studies, J. Geophys. Res.-Oceans, 126, e2021JC017676, https://doi.org/10.1029/2021JC017676, 2021.
Brandt, P., Bordbar, M. H., Coelho, P., Koungue, R. A. I., Körner, M., Lamont, T., Lübbecke, J. F., Mohrholz, V., Prigent, A., Roch, M., Schmidt, M., Van Der Plas, A. K., and Veitch, J.: Physical Drivers of Southwest African Coastal Upwelling and Its Response to Climate Variability and Change, in: Sustainability of Southern African Ecosystems under Global Change, vol. 248, edited by: Von Maltitz, G. P., Midgley, G. F., Veitch, J., Brümmer, C., Rötter, R. P., Viehberg, F. A., and Veste, M., Springer International Publishing, Cham, 221–257, https://doi.org/10.1007/978-3-031-10948-5_9, 2024.
Brandt, P. and Krahmann, G.: Physical oceanography (ADCP) from mooring KPO_1107, PANGAEA [data set], https://doi.org/10.1594/PANGAEA.909911, 2019.
Brandt, P., Imbol Koungue, R. A., Krahmann, G., and Dengler, M.: Physical oceanography from mooring KPO_1235, PANGAEA [data set], https://doi.org/10.1594/PANGAEA.962193, 2023.
Campbell, D.: The Congo River basin, in: The World's Largest Wetlands: Ecology and Conservation, edited by: Fraser, L. H. and Keddy, P. A., Cambridge University Press, Cambridge, 149–165, https://doi.org/10.1017/CBO9780511542091.006, 2005.
Chandanpurkar, H. A., Lee, T., Wang, X., Zhang, H., Fournier, S., Fenty, I., Fukumori, I., Menemenlis, D., Piecuch, C. G., Reager, J. T., Wang, O., and Worden, J.: Influence of Nonseasonal River Discharge on Sea Surface Salinity and Height, J. Adv. Model. Earth Sy., 14, e2021MS002715, https://doi.org/10.1029/2021MS002715, 2022.
Chao, Y., Farrara, J. D., Schumann, G., Andreadis, K. M., and Moller, D.: Sea surface salinity variability in response to the Congo river discharge, Cont. Shelf Res., 99, 35–45, https://doi.org/10.1016/j.csr.2015.03.005, 2015.
Chelton, D. B., deSzoeke, R. A., Schlax, M. G., El Naggar, K., and Siwertz, N.: Geographical Variability of the First Baroclinic Rossby Radius of Deformation, J. Phys. Oceanogr., 28, 433–460, https://doi.org/10.1175/1520-0485(1998)028<0433:GVOTFB>2.0.CO;2, 1998.
Dai, A. and Trenberth, K. E.: Estimates of Freshwater Discharge from Continents: Latitudinal and Seasonal Variations, J. Hydrometeorol., 3, 660–687, https://doi.org/10.1175/1525-7541(2002)003<0660:EOFDFC>2.0.CO;2, 2002.
De La Vara, A., Cabos, W., Sein, D. V., Sidorenko, D., Koldunov, N. V., Koseki, S., Soares, P. M. M., and Danilov, S.: On the impact of atmospheric vs oceanic resolutions on the representation of the sea surface temperature in the South Eastern Tropical Atlantic, Clim. Dynam., 54, 4733–4757, https://doi.org/10.1007/s00382-020-05256-9, 2020.
Denamiel, C., Budgell, W. P., and Toumi, R.: The Congo River plume: Impact of the forcing on the far-field and near-field dynamics, J. Geophys. Res.-Oceans, 118, 964–989, https://doi.org/10.1002/jgrc.20062, 2013.
Dengler, M. and Krahmann, G.: Physical oceanography (ADCP) from mooring KPO_1153, PANGAEA [data set], https://doi.org/10.1594/PANGAEA.909913, 2019.
FAO: Fishery and Aquaculture Country Profiles, Angola, 2020, Country Profile Fact Sheets, Fisheries and Aquaculture Division, Rome, https://www.fao.org/fishery/en/facp/ago?lang= en (last access: 22 July 2024), updated 7 February 2022.
Farneti, R., Stiz, A., and Ssebandeke, J. B.: Improvements and persistent biases in the southeast tropical Atlantic in CMIP models, npj Clim. Atmos. Sci., 5, 42, https://doi.org/10.1038/s41612-022-00264-4, 2022.
Fennel, W.: Theory of the Benguela Upwelling System, J. Phys. Oceanogr., 29, 177–190, https://doi.org/10.1175/1520-0485(1999)029<0177:TOTBUS>2.0.CO;2, 1999.
Florenchie, P., Reason, C. J. C., Lutjeharms, J. R. E., Rouault, M., Roy, C., and Masson, S.: Evolution of Interannual Warm and Cold Events in the Southeast Atlantic Ocean, J. Climate, 17, 2318–2334, https://doi.org/10.1175/1520-0442(2004)017<2318:EOIWAC>2.0.CO;2, 2004.
Fong, D. A. and Geyer, W. R.: The Alongshore Transport of Freshwater in a Surface-Trapped River Plume, J. Phys. Oceanogr., 32, 957–972, https://doi.org/10.1175/1520-0485(2002)032<0957:TATOFI>2.0.CO;2, 2002.
Gammelsrød, T., Bartholomae, C. H., Boyer, D. C., Filipe, V. L. L., and O'Toole, M. J.: Intrusion of warm surface water along the Angolan-Namibian coast in February–March 1995: the 1995 Benguela Nino, S. Afr. J. Marine Sci., 19, 41–56, https://doi.org/10.2989/025776198784126719, 1998.
Gévaudan, M., Jouanno, J., Durand, F., Morvan, G., Renault, L., and Samson, G.: Influence of ocean salinity stratification on the tropical Atlantic Ocean surface, Clim. Dynam., 57, 321–340, https://doi.org/10.1007/s00382-021-05713-z, 2021.
Hopkins, J., Lucas, M., Dufau, C., Sutton, M., Stum, J., Lauret, O., and Channelliere, C.: Detection and variability of the Congo River plume from satellite derived sea surface temperature, salinity, ocean colour and sea level, Remote Sens. Environ., 139, 365–385, https://doi.org/10.1016/j.rse.2013.08.015, 2013.
Houndegnonto, O. J., Kolodziejczyk, N., Maes, C., Bourlès, B., Da-Allada, C. Y., and Reul, N.: Seasonal Variability of Freshwater Plumes in the Eastern Gulf of Guinea as Inferred From Satellite Measurements, J. Geophys. Res.-Oceans, 126, e2020JC017041, https://doi.org/10.1029/2020JC017041, 2021.
Hua, W., Zhou, L., Nicholson, S. E., Chen, H., and Qin, M.: Assessing reanalysis data for understanding rainfall climatology and variability over Central Equatorial Africa, Clim. Dynam., 53, 651–669, https://doi.org/10.1007/s00382-018-04604-0, 2019.
Huang, B., Liu, C., Banzon, V., Freeman, E., Graham, G., Hankins, B., Smith, T., and Zhang, H.-M.: Improvements of the Daily Optimum Interpolation Sea Surface Temperature (DOISST) Version 2.1, J. Climate, 34, 2923–2939, https://doi.org/10.1175/JCLI-D-20-0166.1, 2021.
Hummels, R., Imbol Koungue, R. A., Brandt, P., and Krahmann, G.: Physical oceanography from mooring KPO_1215, PANGAEA [data set], https://doi.org/10.1594/PANGAEA.939249, 2021.
Imbol Koungue, R. A., Rouault, M., Illig, S., Brandt, P., and Jouanno, J. Benguela Niños and Benguela Niñas in forced ocean simulation from 1958 to 2015, J. Geophys. Res.-Oceans, 124, 5923–5951, https://doi.org/10.1029/2019JC015013, 2019.
Jarre, A., Hutchings, L., Kirkman, S. P., Kreiner, A., Tchipalanga, P. C. M., Kainge, P., Uanivi, U., Van Der Plas, A. K., Blamey, L. K., Coetzee, J. C., Lamont, T., Samaai, T., Verheye, H. M., Yemane, D. G., Axelsen, B. E., Ostrowski, M., Stenevik, E. K., and Loeng, H.: Synthesis: climate effects on biodiversity, abundance and distribution of marine organisms in the Benguela, Fisheries Ocean., 24, 122–149, https://doi.org/10.1111/fog.12086, 2015.
Jarugula, S. and McPhaden, M. J.: Indian Ocean Dipole affects eastern tropical Atlantic salinity through Congo River Basin hydrology, Commun. Earth Environ., 4, 366, https://doi.org/10.1038/s43247-023-01027-6, 2023.
Jing, Z., Wang, S., Wu, L., Wang, H., Zhou, S., Sun, B., Chen, Z., Ma, X., Gan, B., and Yang, H.: Geostrophic flows control future changes of oceanic eastern boundary upwelling, Nat. Clim. Change, 13, 148–154, https://doi.org/10.1038/s41558-022-01588-y, 2023.
Kirkman, S., Blamey, L., Lamont, T., Field, J., Bianchi, G., Huggett, J., Hutchings, L., Jackson-Veitch, J., Jarre, A., Lett, C., Lipiński, M., Mafwila, S., Pfaff, M., Samaai, T., Shannon, L., Shin, Y.-J., Van Der Lingen, C., and Yemane, D.: Spatial characterisation of the Benguela ecosystem for ecosystem-based management, Afr. J. Mar. Sci., 38, 7–22, https://doi.org/10.2989/1814232X.2015.1125390, 2016.
Kopte, R., Brandt, P., Dengler, M., Tchipalanga, P. C. M., Macuéria, M., and Ostrowski, M.: The Angola Current: Flow and hydrographic characteristics as observed at 11° S: THE ANGOLA CURRENT AS OBSERVED AT 11° S, J. Geophys. Res.-Oceans, 122, 1177–1189, https://doi.org/10.1002/2016JC012374, 2017.
Körner, M., Brandt, P., and Dengler, M.: Seasonal cycle of sea surface temperature in the tropical Angolan Upwelling System, Ocean Sci., 19, 121–139, https://doi.org/10.5194/os-19-121-2023, 2023.
Körner, M., Brandt, P., Illig, S., Dengler, M., Subramaniam, A., Bachèlery, M.-L., and Krahmann, G.: Coastal trapped waves and tidal mixing control primary production in the tropical Angolan upwelling system, Sci. Adv., 10, eadj6686, https://doi.org/10.1126/sciadv.adj6686, 2024.
Koseki, S., Keenlyside, N., Demissie, T., Toniazzo, T., Counillon, F., Bethke, I., Ilicak, M., and Shen, M.-L.: Causes of the large warm bias in the Angola–Benguela Frontal Zone in the Norwegian Earth System Model, Clim. Dynam., 50, 4651–4670, https://doi.org/10.1007/s00382-017-3896-2, 2018.
Koseki, S., Giordani, H., and Goubanova, K.: Frontogenesis of the Angola–Benguela Frontal Zone, Ocean Sci., 15, 83–96, https://doi.org/10.5194/os-15-83-2019, 2019.
Krahmann, G.: Physical oceanography from mooring KPO_1106 and KPO_1107, PANGAEA [data set], https://doi.org/10.1594/PANGAEA.870917, 2017.
Kurian, J., Li, P., Chang, P., Patricola, C. M., and Small, J.: Impact of the Benguela coastal low-level jet on the southeast tropical Atlantic SST bias in a regional ocean model, Clim. Dynam., 56, 2773–2800, https://doi.org/10.1007/s00382-020-05616-5, 2021.
Lellouche, J.-M., Greiner, E., Bourdallé Badie, R., Garric, G., Melet, A., Drévillon, M., Bricaud, C., Hamon, M., Le Galloudec, O., Regnier, C., Candela, T., Testut, C-E., Gasparin, F., Ruggiero, G., Benkiran, M., Drillet, Y. and Le Traon, P-Y.: The copernicus global 1/12 oceanic and sea ice GLORYS12 reanalysis, Front. Earth Sci., 9, 1–27, https://doi.org/10.3389/feart.2021.698876, 2021.
Levitus, S., Boyer, T. P., Conkright, M. E., Brien, T. O., Antonov, J., Stephens, C., Stathoplos, L., Johnson, D., and Gelfeld, R.: NOAA Atlas NESDIS 18, World Ocean Database 1998: Volume 1: Introduction, U.S. Gov. Printing Office, Wash., D.C., gov.noaa.nodc:0095184, 0095184 1998.
Lübbecke, J. F., Böning, C. W., Keenlyside, N. S., and Xie, S.: On the connection between Benguela and equatorial Atlantic Niños and the role of the South Atlantic Anticyclone, J. Geophys. Res., 115, 2009JC005964, https://doi.org/10.1029/2009JC005964, 2010.
Lübbecke, J. F., Brandt, P., Dengler, M., Kopte, R., Lüdke, J., Richter, I., Sena Martins, M., and Tchipalanga, P. C. M.: Causes and evolution of the southeastern tropical Atlantic warm event in early 2016, Clim, Dynam., 53, 261–274, https://doi.org/10.1007/s00382-018-4582-8, 2019.
Madec, G. and the NEMO team: NEMO ocean engine – version 3.6, Note du Pôle de modélisation, Institut Pierre-Simon Laplace (IPSL), France, 406 pp., ISSN 1288-1619, 2016.
Marchesiello, P. and Estrade, P.: Upwelling limitation by onshore geostrophic flow, J. Mar. Res., 68, 37–62, https://doi.org/10.1357/002224010793079004, 2010.
Martins, M. S. and Stammer, D.: Interannual Variability of the Congo River Plume-Induced Sea Surface Salinity, Remote Sens., 14, 1013, https://doi.org/10.3390/rs14041013, 2022.
Materia, S., Gualdi, S., Navarra, A., and Terray, L.: The effect of Congo River freshwater discharge on Eastern Equatorial Atlantic climate variability, Clim. Dynam., 39, 2109–2125, https://doi.org/10.1007/s00382-012-1514-x, 2012.
McPhaden, M. J., Jarugula, S., Aroucha, L. C., and Lübbecke, J.: Indian Ocean Dipole intensifies Benguela Niño through Congo River discharge. Commun Earth Environ 5, 779, https://doi.org/10.1038/s43247-024-01955-x, 2024.
Meade, R. H. and Emery, K. O.: Sea Level as Affected by River Runoff, Eastern United States, Science, 173, 425–428, https://doi.org/10.1126/science.173.3995.425, 1971.
Müller, O. V., McGuire, P. C., Vidale, P. L., and Hawkins, E.: River flow in the near future: a global perspective in the context of a high-emission climate change scenario, Hydrol. Earth Syst. Sci., 28, 2179–2201, https://doi.org/10.5194/hess-28-2179-2024, 2024.
Munzimi, Y. A., Hansen, M. C., and Asante, K. O.: Estimating daily streamflow in the Congo Basin using satellite-derived data and a semi-distributed hydrological model, Hydrolog. Sci. J., 64, 1472–1487, https://doi.org/10.1080/02626667.2019.1647342, 2019.
Ngakala, R. D., Alory, G., Da-Allada, C. Y., Kom, O. E., Jouanno, J., Rath, W., and Baloïtcha, E.: Joint observation–model mixed-layer heat and salt budgets in the eastern tropical Atlantic, Ocean Sci., 19, 535–558, https://doi.org/10.5194/os-19-535-2023, 2023.
Nyadjro, E. S., Foli, B. A. K., Agyekum, K. A., Wiafe, G., and Tsei, S.: Seasonal Variability of Sea Surface Salinity in the NW Gulf of Guinea from SMAP Satellite, Remote Sens. Earth Syst. Sci., 5, 83–94, https://doi.org/10.1007/s41976-021-00061-2, 2022.
Piecuch, C. G., Bittermann, K., Kemp, A. C., Ponte, R. M., Little, C. M., Engelhart, S. E., and Lentz, S. J.: River-discharge effects on United States Atlantic and Gulf coast sea-level changes, P. Natl. Acad. Sci. USA, 115, 7729–7734, https://doi.org/10.1073/pnas.1805428115, 2018.
Prigent, A. and Farneti, R.: An assessment of equatorial Atlantic interannual variability in Ocean Model Intercomparison Project (OMIP) simulations, Ocean Sci., 20, 1067–1086, https://doi.org/10.5194/os-20-1067-2024, 2024.
Reynolds, R. W., Smith, T. M., Liu, C., Chelton, D. B., Casey, K. S., and Schlax, M. G.: Daily High-Resolution-Blended Analyses for Sea Surface Temperature, J. Climate, 20, 5473–5496, https://doi.org/10.1175/2007JCLI1824.1, 2007.
Richter, I.: Climate model biases in the eastern tropical oceans: causes, impacts and ways forward, WIREs Clim. Change, 6, 345–358, https://doi.org/10.1002/wcc.338, 2015.
Rio, M.-H., Mulet, S., and Picot, N.: Beyond GOCE for the ocean circulation estimate: Synergetic use of altimetry, gravimetry, and in situ data provides new insight into geostrophic and Ekman currents, Geophys. Res. Lett., 41, 8918–8925, https://doi.org/10.1002/2014GL061773, 2014.
Roch, M., Brandt, P., Schmidtko, S., Vaz Velho, F., and Ostrowski, M.: Southeastern Tropical Atlantic Changing From Subtropical to Tropical Conditions, Front. Mar. Sci., 8, 748383, https://doi.org/10.3389/fmars.2021.748383, 2021.
Rouault, M., Illig, S., Bartholomae, C., Reason, C. J. C., and Bentamy, A.: Propagation and origin of warm anomalies in the Angola Benguela upwelling system in 2001, J. Marine Syst., 68, 473–488, https://doi.org/10.1016/j.jmarsys.2006.11.010, 2007.
Rouault, M., Illig, S., Lübbecke, J., and Koungue, R. A. I.: Origin, development and demise of the 2010–2011 Benguela Niño, J. Marine Syst., 188, 39–48, https://doi.org/10.1016/j.jmarsys.2017.07.007, 2018.
Rühs, S., Schmidt, C., Schubert, R., Schulzki, T., Schwarzkop, F., U., Le Bars, D., and Biastoch, A.: Robust estimates for the decadal evolution of Agulhas leakage from the 1960s to the 2010s, Commun. Earth Environ., 3, 318, https://doi.org/10.1038/s43247-022-00643-y, 2022.
Saha, A., Serra, N., and Stammer, D.: Growth and Decay of Northwestern Tropical Atlantic Barrier Layers, J. Geophys. Res.-Oceans, 126, e2020JC016956, https://doi.org/10.1029/2020JC016956, 2021.
Schmidt, C., Schwarzkopf, F. U., Rühs, S., and Biastoch, A.: Characteristics and robustness of Agulhas leakage estimates: an inter-comparison study of Lagrangian methods, Ocean Sci., 17, 1067–1080, https://doi.org/10.5194/os-17-1067-2021, 2021.
Schwarzkopf, F. U., Biastoch, A., Böning, C. W., Chanut, J., Durgadoo, J. V., Getzlaff, K., Harlaß, J., Rieck, J. K., Roth, C., Scheinert, M. M., and Schubert, R.: The INALT family – a set of high-resolution nests for the Agulhas Current system within global NEMO ocean/sea-ice configurations, Geosci. Model Dev., 12, 3329–3355, https://doi.org/10.5194/gmd-12-3329-2019, 2019.
Shannon, L. V., Boyd, A. J., Brundrit, G. B., and Taunton-Clark, J.: On the existence of an El Niño-type phenomenon in the Benguela System, J. Mar. Res., 44, 495–520, https://doi.org/10.1357/002224086788403105, 1986.
Small, R. J., Kurian, J., Chang, P., Xu, G., Tsujino, H., Yeager, S., Danabasoglu, G., Kim, W. M., Altuntas, A., and Castruccio, F.: Eastern Boundary Upwelling Systems in Ocean–Sea Ice Simulations Forced by CORE and JRA55-do: Mean State and Variability at the Surface, J. Climate, 37, 2821–2848, https://doi.org/10.1175/JCLI-D-23-0511.1, 2024.
SO-HYBAM: Amazon Basin water resources observation service, https://hybam.obs-mip.fr/, last access: 25 June 2024.
Sorí, R., Nieto, R., Vicente-Serrano, S. M., Drumond, A., and Gimeno, L.: A Lagrangian perspective of the hydrological cycle in the Congo River basin, Earth Syst. Dynam., 8, 653–675, https://doi.org/10.5194/esd-8-653-2017, 2017.
Sowman, M. and Cardoso, P.: Small-scale fisheries and food security strategies in countries in the Benguela Current Large Marine Ecosystem (BCLME) region: Angola, Namibia and South Africa, Mar. Policy, 34, 1163–1170, https://doi.org/10.1016/j.marpol.2010.03.016, 2010.
Tchipalanga, P., Dengler, M., Brandt, P., Kopte, R., Macuéria, M., Coelho, P., Ostrowski, M., Keenlyside, N. S. Eastern boundary circulation and hydrography off Angola: Building Angolan oceanographic capacities, B. Am. Meteorol. Soc., 99, 1589–1605, https://doi.org/10.1175/BAMS-D-17-0197.1, 2018.
Tomety, F. S., Illig, S., Ostrowski, M., Awo, F. M., Bachèlery, M.-L., Keenlyside, N., and Rouault, M.: Long-term climatological trends driving the recent warming along the Angolan and Namibian coasts, Clim. Dynam., 62, 7763–7782, https://doi.org/10.1007/s00382-024-07305-z, 2024.
Topé, G. D. A., Alory, G., Djakouré, S., Da-Allada, C. Y., Jouanno, J., and Morvan, G.: How does the Niger river warm coastal waters in the northern Gulf of Guinea?, Front. Mar. Sci., 10, 1187202, https://doi.org/10.3389/fmars.2023.1187202, 2023.
Tsujino, H., Urakawa, S., Nakano, H., Small, R. J., Kim, W. M., Yeager, S. G., Danabasoglu, G., Suzuki, T., Bamber, J. L., Bentsen, M., Böning, C. W., Bozec, A., Chassignet, E. P., Curchitser, E., Boeira Dias, F., Durack, P. J., Griffies, S. M., Harada, Y., Ilicak, M., Josey, S. A., Kobayashi, C., Kobayashi, S., Komuro, Y., Large, W. G., Le Sommer, J., Marsland, S. J., Masina, S., Scheinert, M., Tomita, H., Valdivieso, M., and Yamazaki, D.: JRA-55 based surface dataset for driving ocean–sea-ice models (JRA55-do), Ocean Modell., 130, 79–139, https://doi.org/10.1016/j.ocemod.2018.07.002, 2018.
White, R. H. and Toumi, R.: River flow and ocean temperatures: The Congo River, J. Geophys. Res.-Oceans, 119, 2501–2517, https://doi.org/10.1002/2014JC009836, 2014.
Zhang, R.-H. and Busalacchi, A. J.: Freshwater Flux (FWF)-Induced Oceanic Feedback in a Hybrid Coupled Model of the Tropical Pacific, J. Climate, 22, 853–879, https://doi.org/10.1175/2008JCLI2543.1, 2009.