the Creative Commons Attribution 4.0 License.
the Creative Commons Attribution 4.0 License.
Integrating wide-swath altimetry data into Level-4 multi-mission maps
Maxime Ballarotta
Clément Ubelmann
Valentin Bellemin-Laponnaz
Florian Le Guillou
Guillaume Meda
Cécile Anadon
Alice Laloue
Antoine Delepoulle
Yannice Faugère
Marie-Isabelle Pujol
Ronan Fablet
Gérald Dibarboure
Real-time observation of ocean surface topography is essential for various oceanographic applications. Historically, these observations have mainly relied on satellite nadir altimetry data, which were limited to observation scales greater than approximately 60 km. However, the recent launch of the wide-swath Surface Water Ocean Topography (SWOT) mission in December 2022 marks a significant advancement, enabling the two-dimensional global observation of finer-scale oceanic scales (∼ 15 km). While the direct analysis of the two-dimensional content of these swaths can provide valuable insights into ocean surface dynamics, integrating such data into mapping systems presents several challenges. This study focuses on integrating the SWOT mission into multi-mission mapping systems. Specifically, it examines the contribution of the SWOT mission to both the current nadir altimetry constellation (six/seven nadirs) and a reduced nadir altimetry constellation (three nadirs). Our study indicates that within the current nadir altimetry constellation, SWOT's impact is moderate, as existing nadir altimeters effectively constrain surface dynamics. However, in a hypothetical scenario where a reduced nadir altimetry constellation is envisioned to be operational by 2030, the significance of wide-swath data in mapping becomes more pronounced. Alternatively, we found that data-driven and dynamical mapping systems can significantly participate in refining the resolution of the multi-mission gridded products. Consequently, integrating high-resolution ocean surface topography observations with advanced mapping techniques can enhance the resolution of satellite-derived products, providing promising solutions for studying and monitoring sea-level variability at finer scales. However, to fully exploit SWOT's capabilities, future research will need to focus on innovations in data gridding and assimilation to extend mapping beyond geostrophically balanced flows.
- Article
(9249 KB) - Full-text XML
- BibTeX
- EndNote
Real-time observation of ocean surface topography is crucial for various oceanographic applications (marine navigation, marine safety, climate research, etc.). Since the 1990s, in addition to in situ observations, the use of nadir radar altimetry has revolutionized operational oceanography and enhanced our understanding of ocean surface dynamics on a global scale (Le Traon, 2013). Over the years, advancements in altimetry technologies and increased sampling have significantly improved the precision and accuracy of altimetry products, and the wide-swath altimeter/interferometer technology currently being tested as part of the Surface Water Ocean Topography (SWOT) mission has the potential to significantly enhance oceanographic observation.
The SWOT mission (Fu and Rodriguez, 2004; Morrow et al., 2019), resulting from a collaboration between the National Aeronautics and Space Administration (NASA), the Centre National d'Études Spatiales (CNES), the Canadian Space Agency (CSA), and the UK Space Agency, was launched in December 2022. The main objective of the SWOT mission is to observe and track water surface elevation on Earth for the first time in 2D and with unprecedented resolution. Unlike conventional altimetry missions, SWOT relies on a wide swath, the KaRIn instrument, enabling the observation of fine oceanic surface topography scales with a resolution up to 15 km, whereas conventional altimeters are often limited to resolutions of 60 km (Dufau et al., 2016; Vergara et al., 2023). In addition to the swath, SWOT also features a nadir altimeter on board.
Nadir (1D) and KaRIn (2D) altimetry data can sometimes pose complexities for the oceanographic community, which prefers the use of gridded, spatially and temporally continuous data, such as Level-4 multi-mission maps (e.g., AVISO/DUACS multi-mission maps, Ducet et al., 2000; MEaSUREs maps, Beckley et al., 2010; GLORYS12v1 maps, Lellouche et al., 2021). These maps are produced through interpolation, modeling, and/or assimilation techniques and have been regarded as the reference for monitoring and understanding the ocean surface dynamics over the last 3 decades. However, resolving variability at length scales smaller than approximately 150–200 km with these mapping methods is challenging (Ballarotta et al., 2019). Operational oceanography now seeks to incorporate increasingly finer spatial and temporal scales into its products, including, for example, mesoscale and sub-mesoscale dynamics.
Advancing our understanding of fine-scale ocean processes is essential for improving ocean models and predictions and for gaining deeper insights into ocean surface dynamics. Although large mesoscale eddies have been extensively studied over the past 30 years using multi-mission gridded altimetry products and are identified as key contributors to the horizontal transport of heat, nutrients and carbon (Dong et al., 2014; Zhang et al., 2014), sub-mesoscale variability and its role in ocean dynamics remain poorly observed and understood. The SWOT mission thus represents an excellent opportunity to better understand the role of sub-mesoscale eddies and enhance the spatial resolution of the altimeter products, and it paves the way for new challenges in the utilization, validation, and integration of these data into mapping systems. Since April 2023, the SWOT mission has been able to be integrated into the current altimetry constellation including Jason-3, Sentinel-3A, Sentinel-3B, SARAL/AltiKa, CryoSat-2 and Haiyang-2B (Fig. 1). So far, mainly simulations through observing system simulation experiments (OSSEs) have been conducted to study the contribution of wide-swath systems (like SWOT) to mapping systems (e.g., Benkiran et al., 2021; Tchonang et al., 2021; Ubelmann et al., 2015; Le Guillou et al., 2021a, b). In this study, we aim to investigate and assess the impact of these new wide-swath data on a global mapping system through the use of observing system experiments (OSEs). The main objective of this study is to quantify the contribution of wide swath in mapping systems.
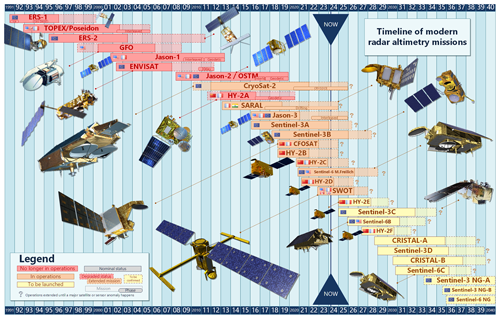
Figure 1Past, present and future altimetry constellation. Timeline of modern radar altimetry missions. https://doi.org/10.24400/527896/A02-2022.001 (Aviso+, 2022).
The paper is organized as follows: Sect. 2 outlines the data sources and mapping techniques used in this study. Section 3 presents the experiments and validation metrics. The key results are then presented in Sect. 4. Lastly, the potential of wide-swath altimetry in both contemporary and future altimeter constellations is discussed, along with the current limitations observed in our mapping process. A discussion on the benefits and limitations of OSSEs as well as a first analysis of alternative regional mapping methods is given in the Appendix.
2.1 Data
The mapping method used in this study takes input data from several remote sensing observations, which are summarized in Table 1 and described below.
2.1.1 Nadirs sea-level anomaly Level-3 products
To produce the gridded sea-level maps, we used the global ocean sea-level anomaly observations from the near-real-time (NRT) Level-3 altimeter satellite along-track data distributed by the EU Copernicus Marine Service (product reference SEALEVEL_GLO_PHY_L3_NRT_ 008_044; Pujol et al., 2023), specifically for the Jason-3, Sentinel-3A, Sentinel-3B, Sentinel-6A, SARAL/AltiKa, CryoSat-2 and Haiyang-2B missions. This dataset covers the global ocean and is available at a sampling rate of 1 Hz (approximately 7 km spatial spacing). The quality of this dataset is ensured through the implementation of homogenization and cross-validation procedures aimed at eliminating residual orbit errors, long-wavelength errors, large-scale biases, and discrepancies among different data streams. A description of the geophysical and environmental corrections applied to the dataset can be found in the quality information document (Pujol et al., 2023) and is summarized in Eq. (1). In this study, we focus on unfiltered sea-level anomalies (SLAs) corrected with dynamic atmospheric correction (dac) and on ocean tide.
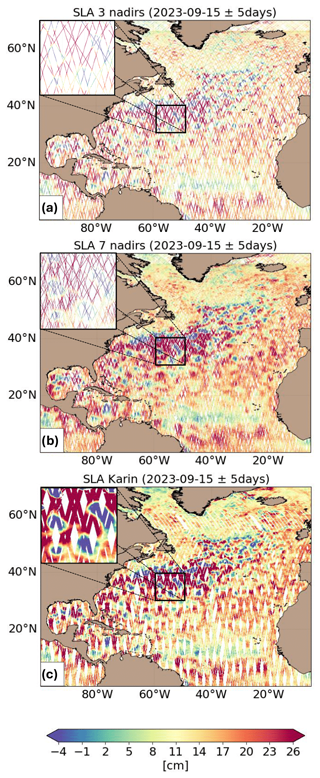
with ∑ (environmental corrections) comprising wet tropospheric, dry tropospheric, ionospheric and sea-state bias corrections and ∑ (geophysical corrections) comprising solid Earth tide, load tide, ocean tide, pole tide and dynamic atmospheric corrections. The spatial coverage of the nadir altimeter constellation is illustrated in Fig. 2a for a reduced constellation of three nadirs and Fig. 2b for a constellation of six nadir altimeters. Specifically, the figure shows differences in sampling density within the various constellations.
2.1.2 SWOT sea-level anomaly Level-3 products
In addition to the nadir altimetry constellation previously mentioned, we conducted experiments involving the integration of SWOT Level-3 Ocean product (specifically referencing SWOT_L3_SSH) during the 21 d phase of the mission. The SWOT_L3_SSH product combines ocean topography measurements collected from both the SWOT KaRIn and the nadir altimeter instruments, consolidating them into a unified variable with 2 km spatial grid spacing. For our investigation, we used version 1.0 of the product accessible through the AVISO+ portal (AVISO/DUACS, 2024a). These data were derived from the Level-2 “Beta Pre-Validated” KaRIn Low Rate Ocean product (NASA Jet Propulsion Laboratory (JPL) and CNES). The processing methodology for SWOT Level-3 products is described in Dibarboure et al. (2024), following a sequence including Level-2 correction (e.g., homogenization with other satellites in terms of geophysical correction), editing (e.g., detection of spurious measurements) and multi-mission calibration (data-driven calibration to mitigate residual biases between all sensors in the constellation). The spatial coverage of the SWOT instrument is shown in Fig. 2c, demonstrating high spatial sampling in certain regions (particularly at high latitudes), as well as moderate spatial sampling in other regions due to low revisit times at those latitudes .
2.2 Mapping method
The global maps produced in this study are based on the Multiscale Inversion of Ocean Surface Topography (MIOST) technique (Ubelmann et al., 2021, 2022). This mapping approach is specifically designed to manage large volumes of observational data, such as those from the 2 km SWOT Level-3 KaRIn data at the global scale, and to capture various modes of variability in ocean surface topography and currents. MIOST constructs multiple independent components – e.g., geostrophy, equatorial waves, and barotropic components – representing each in a reduced space through wavelet decomposition. This allows the system to effectively capture specific temporal and spatial scales in defining covariance models for each component.
In this study, the focus is mainly on the geostrophic mode, which represents the geostrophically balanced evolution of sea surface height (SSH). MIOST is capable of incorporating observational data from diverse sources, including altimetry datasets and in situ surface currents; however, this study only considers altimetry data. The solution is obtained by integrating all components in a reduced space and using a preconditioned conjugate gradient method to solve the mapping problem (Ubelmann et al., 2021). This iterative approach progressively refines the solution until convergence. Once the final reduced solution is reached, it is projected back onto the full spatial grid using wavelet-based transformations specific to each component.
The quality of the MIOST gridded products has been accessed through both idealized and real observational systems (Ubelmann et al., 2021, 2022; Ballarotta et al., 2023), demonstrating their effectiveness in mapping global surface topography and currents. Specifically, these studies have shown that MIOST captures the ocean surface circulation more accurately than the operational system DUACS, with mapping errors reduced by up to 10 % in regions with energetic currents. Overall, the effective resolution of the map produced by the MIOST ranges from more than 500 km at the Equator to about 100 km at the poles. MIOST is thus not able to retrieve very small sub-mesoscale structures.
This study employs delayed-time (DT) mode processing, which integrates both past and future observations to enhance the interpolation process. Similarly to the optimal interpolation techniques used in operational context (e.g., Le Traon et al., 1998, 2003; Ducet et al., 2000; Pujol et al., 2016), MIOST operates within a linear and Gaussian framework. Additionally, experimental regional mapping was conducted using non-linear approaches, such as the 4DvarQG (Le Guillou et al., 2024) and 4DvarNET (Fablet et al., 2021) approaches, with a detailed evaluation of these techniques provided in Appendix B.
3.1 Experiments
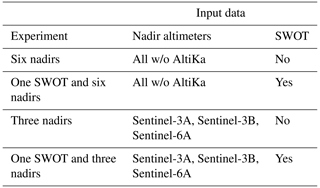
We conducted several experiments (as summarized in Table 2) to investigate the impact of wide-swath altimetry on mapping constrained by present-day and future altimeter constellations.
In the baseline experiment (six nadirs), SSH maps covering the period from 27 July 2023 to 1 May 2024 were generated using data from six altimeters: Jason-3, CryoSat-2, Sentinel-3A, Sentinel-3B, Sentinel-6A and Haiyang-2B. To ensure independent evaluations, one altimeter (SARAL/AltiKa) was omitted from the mapping process. This experiment is representative of the present-day nadir-only altimeter constellation. A second experiment (one SWOT and six nadirs) aimed to evaluate the integration of SWOT into the existing altimeter constellation. SSH maps for the same time frame were generated using data from the six aforementioned altimeters along with SWOT Level-3 (L3) SSH data. Similarly to the six-nadir experiment, SARAL/AltiKa data were excluded for independent assessments. A third experiment (three nadirs) was conducted considering a reduced altimeter constellation scenario comprising only three altimeters (Sentinel-3A, Sentinel-3B, Sentinel-6A). Finally, a fourth experiment (one SWOT and three nadirs) was conducted to assess the integration of SWOT in a future altimeter constellation. For this experiment, data from three altimeters (Sentinel-3A, Sentinel-3B, Sentinel-6A) and SWOT L3 SSH data were considered.
3.2 Validation metrics
The validation metrics are based on statistical and spectral analysis.
One quantitative assessment involves comparing SSH maps with independent SSH along-track data. This diagnostic follows three main steps: (1) interpolating the gridded SSH data to the locations of the independent along-track SSH, (2) calculating the mapping error SSHerror = SSHmap − SSHalongtrack and (3) performing a statistical analysis on the SSHerror. Prior to the statistical analysis, a filter may be applied to focus on specific spatial scales, such as the 65–200 km range, which is relevant to short mesoscale signals and representative of the scale on which SWOT is expected to have a significant impact. The validation metrics are based on the error standard deviation scores in 1°×1° longitude × latitude boxes (or averaged over the specific region of interest), defined as
where x is the longitudinal position of an along-track measurement, y is the latitudinal position of an along-track measurement, t the time position of an along-track measurement, N is the total number of SSH measurements in the box (or area of interest) and the overbar indicates the sample statistical mean.
The comparison of the error standard deviation score between two experiments informs us about the gain or reduction Δ of the mapping error; for example,
The previous diagnostic was conducted in physical space. For a wavelength-specific assessment and to avoid spatio-temporal filtering issues, diagnostics can be performed in frequency space using spectral analysis. As described for example in Ballarotta et al. (2019), this involves
-
interpolating the gridded SSH data to the locations of the independent along-track SSH
-
dividing the data into segments (1500 km long segment)
-
storing these segments with their median coordinates
-
performing spectral analysis of the segments found in 10°×10° boxes.
For each box, we compute the mean power spectral densities of the independent signal (SSHalongtrack) and the mapping error (SSHmap − SSHalongtrack). The signals are detrended and windowed with a Hann function before spectral calculation. The signal-to-noise ratio (SNR, Eq. 4) is derived from the power spectral densities, and the effective resolution is determined as the wavelength λs where the SNR(λs) is 2 (Eq. 5), i.e., the wavelength where the SSHerror is 2 times lower than the signal SSHalongtrack.
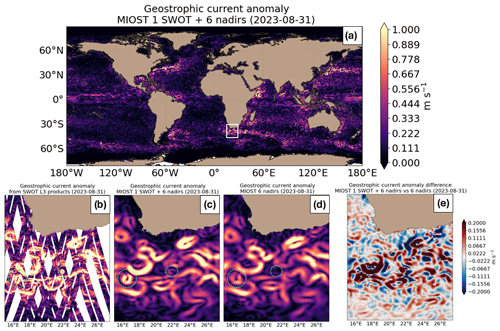
Figure 3Example of geostrophic current reconstruction on 31 August 2023 (a) with MIOST at a global scale, (b) with a view from KaRIn L3 products over the Cape Agulhas region, (c) from MIOST reconstruction integration with one SWOT and six nadirs, (d) from MIOST reconstruction integration with six nadirs, and (e) showing the difference in MIOST reconstructions between integration with one SWOT and six nadirs vs. six nadirs only.
4.1 Qualitative assessment
The impact of integrating L3 SWOT KaRIn data into the MIOST system is qualitatively illustrated in Fig. 3 with a snapshot of the magnitude of the geostrophic current calculated from the SLA map for 31 August 2023. The current intensity appears to be underestimated in the mapping products (Fig. 3c and d) compared to the intensity derived from the SWOT KaRIn products (Fig. 3b). Due to its filtering properties, the mapping method cannot resolve the fine-scale filaments present in the KaRIn data. Nevertheless, the difference between maps constructed with one SWOT and six nadirs and those constructed with only six nadirs (Fig. 3e) reveals that some structures are more intense in the maps using the KaRIn data. Additionally, the positions of these structures are more precisely constrained by the 2D KaRIn data, leading to better-defined fronts and structures.
4.2 Contribution of wide-swath altimetry in the present-day altimeter constellation
The mapping errors arising from using the present-day altimeter constellation (six-nadir experiment) are shown in Fig. 4. The most significant error in SSH mapping peaks at 7 cm in the western boundary surface current and along continental plateaus (Fig. 4a and b). In offshore regions with low SSH variability, the error standard deviation remains below 3 cm. Figure 4c and d illustrate the difference in mapping error between the experiment of one SWOT and six nadirs and that of six nadirs for all spatial scales and those smaller than 200 km, respectively. A blue (red) pattern indicates a decrease (increase) in mapping error when incorporating SWOT into the mapping process. For all spatial scales, SWOT helps to reduce mapping errors, notably at mid-latitudes, with an average decrease of 4 %. The most significant decrease takes place in regions characterized by high SSH variability. Mapping results with and without SWOT exhibit similar outcomes in coastal, offshore low-variability and equatorial regions.
For spatial scales smaller than 200 km, the relative impact of SWOT is more prominent, as expected from the short spatial scales observed by SWOT. This leads to a reduction in mapping errors by approximately 11 %, particularly pronounced in regions with high SSH variability. Table 3 outlines the comparative outcomes across various regions of interest (coastal, equatorial band, low-variability region and high-variability regions). Overall, the integration of the SWOT data mainly contributes to reducing mapping errors in energetic ocean currents such as the Gulf Stream, the Kuroshio and the Antarctic Circumpolar Current (ACC). Certain regions are prone to degradation in mapping quality when integrating SWOT, particularly those characterized by tropical rainfall and wet troposphere, as well as areas affected by storm tracks or internal tides.
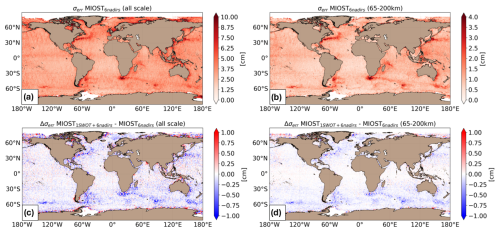
Figure 4Standard deviation of the difference SSHmap − SSHalongtrack computed for the six-nadir experiment, considering (a) all spatial scales and (b) spatial scales between 65 and 200 km. The gain/loss of the mapping error standard deviation of SLA in the experiment of one SWOT and six nadirs relative to the six-nadir experiment mapping error standard deviation for (c) all spatial scales and (d) scales between 65 and 200 km. The blue color means a reduction in error when SWOT is included in the mapping.
Table 3The regionally averaged mapping error standard deviation (“Err”) for the six-nadir experiment and the experiment of one SWOT and six nadirs. The score in parentheses is the gain/reduction in error standard deviation applied to the SSH variable between the experiment of one SWOT and six nadirs and that of six nadirs.

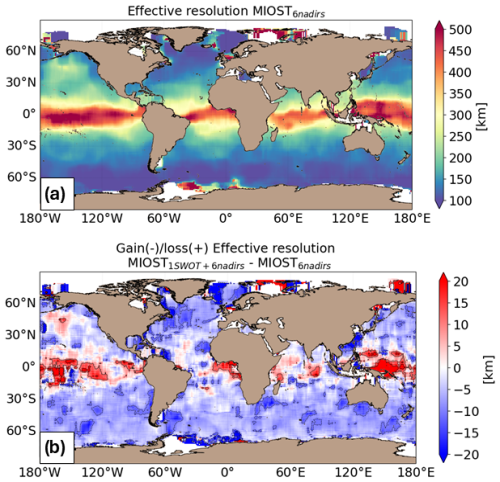
Figure 5a illustrates the effective resolution of maps generated using six nadir altimeters, while Fig. 5b shows the enhancement in resolution achieved through the integration of SWOT into the mapping process. Maps produced with six nadir altimeters have resolutions ranging from approximately 100 km at high latitude to 500 km in the equatorial region. SWOT contributes to refining map resolutions at mid-latitudes, resulting in local improvements of up to 20 km and an average enhancement of around 5–10 km (see Fig. 5b). Degraded resolutions with SWOT are found in the equatorial band and North Pacific basin.
4.3 Contribution of wide-swath altimetry in a future altimeter constellation
The mapping errors in using a constellation of three nadir altimeters are shown in Fig. 6. In this reduced nadir altimeter constellation, the mapping errors are more than 14 % larger in high-variability regions and about 5 %–10 % larger in other regions compared to six-nadir-altimeter constellation mapping. The largest SSH mapping errors are found in the western boundary surface current and over the continental plateaus (Fig. 6a and b). In the offshore low-variability region, the error standard deviation is between 3 and 5 cm. Figure 6c and d show the difference in mapping error between the experiment of one SWOT and three nadirs and that of three nadirs for all spatial scales and the spatial scales smaller than 200 km, respectively. A blue (red) pattern means a reduction (increase) of the mapping error when SWOT is included in the mapping. As with the six-nadir-altimeter constellation, for all spatial scales considered, SWOT allows us to reduce the mapping errors, especially at mid-latitudes. The largest reduction in mapping error (∼ 12 %) is found in regions of high variability. In the coastal, offshore low-variability and equatorial regions, the mapping error reduction is moderate (∼ 4 %) when including SWOT in the mapping. For spatial scales smaller than 200 km, SWOT allows us to reduce the mapping errors by ∼ 17 %, particularly in the high-variability region. Table 4 summarizes the results of the comparison over different regions of interest (coastal, equatorial band, low-variability region and high-variability region). Overall, the SWOT instrument mainly contributes to reducing the mapping error in energetic ocean currents, such as the Gulf Stream, the Kuroshio and the ACC. As with the experiment of one SWOT and six nadirs, certain regions are prone to degradation in mapping quality when integrating SWOT, particularly regions characterized by tropical rainfall and a wet troposphere, as well as areas affected by storm tracks or internal tides. Comparing the three-nadir experiment to the six-nadir experiment enables quantification of the advantage of using three nadir altimeters in the mapping process. As shown in Table 4, the mapping errors for maps constructed with six nadirs are relatively similar to those for maps constructed with one SWOT and three nadirs. This indicates that incorporating a SWOT mission into Level-4 products could provide observational capabilities equivalent to integrating three to four altimeters, which is consistent with the conclusions drawn by Pujol et al. (2012).
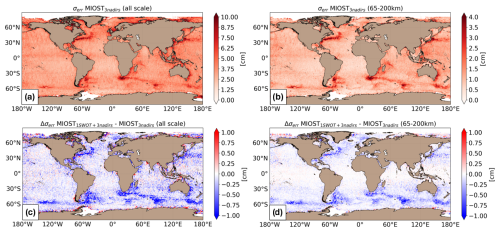
Figure 6Standard deviation of the difference SSHmap − SSHalongtrack computed for the three-nadir experiment and in considering (a) all spatial scales and (b) spatial scales between 65 and 200 km. The gain/loss of the mapping error standard deviation of SLA in the experiment of one SWOT and three nadirs relative to the three-nadir experiment mapping error standard deviation for (c) all spatial scales and (d) scales between 65 and 200 km. The blue color means a reduction in error when SWOT is included in the mapping.
Table 4Regionally averaged mapping error standard deviation for the three-nadir experiment, the experiment of one SWOT and three nadirs, and that of six nadirs. The score in parentheses is the gain/reduction in error standard deviation applied to the SSH variable between the experiment of one SWOT and three nadirs and that of three nadirs (middle columns) and between the six-nadir and three-nadir experiments (right columns).

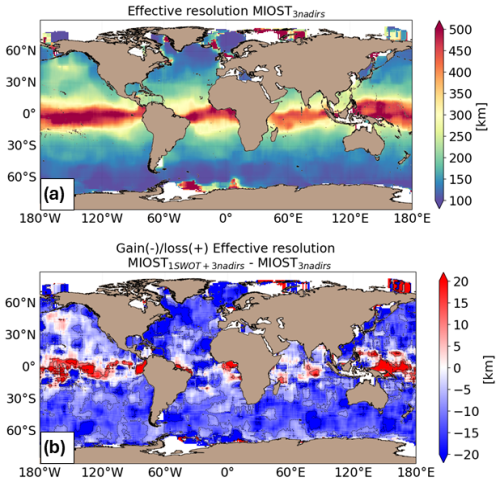
Figure 7a shows the effective resolution of maps generated using three nadir altimeters, while Fig. 7b depicts the enhancement in resolution achieved through the integration of SWOT into mapping processes. Maps created with three nadir altimeters have resolutions ranging from approximately 100 km at high latitude to 500 km in the equatorial region. SWOT helps in refining map resolutions at mid-latitudes, locally improving them by up to 50 km and on average providing an enhancement of around 10–20 km (see Fig. 7b). The integration of SWOT in the mapping seems to degrade the resolution in the equatorial band and North Pacific basin.
This study proposes a global analysis of the integration of wide-swath altimetry data into an ocean surface topography mapping system. More specifically, our focus has been on quantifying the added value of wide-swath data, such as those currently produced by SWOT, within a dense constellation of nadir altimeters (the current constellation comprises six to seven nadirs) and within a reduced constellation of three nadirs, representative of a future constellation envisioned by 2030 (see Fig. 1).
The results obtained in the current nadir altimeter constellation show a moderate contribution of KaRIn data to our MIOST mapping system. Although SWOT helps reduce mapping errors in energetic currents, this reduction remains moderate (10 %) because the six nadir altimeters currently in flight already effectively constrain surface dynamics. Consequently, the surface topography products incorporating SWOT data will benefit from slightly improved spatial resolution (<10 km on average), particularly at mid-latitudes. Some regions where the integration of SWOT appears to alter mapping require better understanding. These regions are characterized by specific atmospheric and oceanic conditions, such as tropical rainfall, a wet troposphere, and areas affected by storm tracks or internal tides. Improved understanding and processing of KaRIn data in these regions will likely mitigate these deficiencies in future reprocessing efforts.
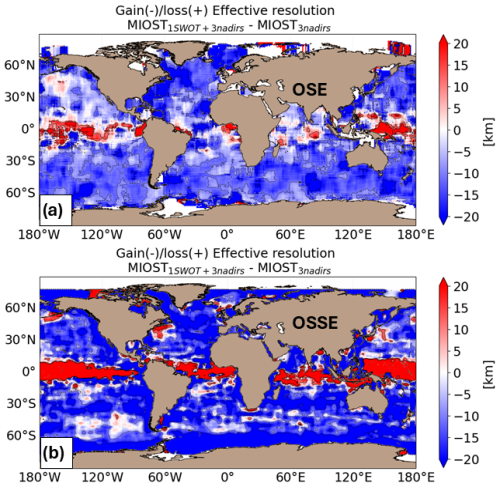
The European Space Agency (ESA) is currently exploring various combinations of nadir and wide-swath altimeters for the upcoming Sentinel-3 Next Generation (S3NG) constellation, planned for launch around 2030 (Fig. 1). Ongoing studies undertaken in an OSSE framework, such as those reported in the papers by Benkiran et al. (2024) and King et al. (2024), aim to provide insights into the impact of these different altimeter constellations on operational ocean forecasts. Based on the experiments conducted for our own study, here we propose to discuss the impact of including a wide-swath altimeter in a constellation of three nadirs, which could potentially be operational by 2030, although it does not strictly align with the constellation scenarios envisioned by ESA (either 12 nadirs or 2 wide swaths). The mapping results obtained in a reduced nadir altimeter constellation show more contrasting conclusions about the contribution of KaRIn data to mapping. Indeed, the impact of KaRIn data is more significant in the reduced constellation since only three nadirs constrain the SSH variability less effectively than a six-nadir constellation does. With SWOT, the mapping errors are reduced by ∼ 20 % in energetic regions and the gain in effective resolution at mid-latitudes reaches more than 20 km. Additionally, the comparison between the experiment of one SWOT and three nadirs and that of six nadirs suggests that integrating a SWOT mission into Level-4 products could offer an observational capacity equivalent to integrating three to four altimeters, in line with the conclusions drawn in an OSSE framework by Pujol et al. (2012) and Bellemin-Laponnaz et al. (2022). It is also important to emphasize that we currently have only one SWOT instrument in the altimetric constellation, resulting in a significant imbalance between high spatial resolution and low temporal resolution in certain regions. This gap is largely addressed within the framework of S3NG when considering scenarios involving two wide-swath instruments. Furthermore, it is relevant to stress the preliminary nature of this initial mapping attempt, and additional studies within the scenarios envisaged in the S3NG project will need to be conducted and rigorously analyzed with OSSEs. The first experiments aiming to quantify the contribution of wide-swath altimeter data were conducted within the framework of OSSEs. These OSSEs have allowed us both to prepare the mapping system for KaRIn data and to assess the contribution of KaRIn data to mapping. Even though OSSEs may be based on simplifying assumptions, we believe they provide a valuable framework for quantifying mapping performance under different observing system scenarios. We present a comparison of the contribution of KaRIn data in the OSE and OSSE frameworks in Appendix A, demonstrating satisfactory agreement between the results of each experiment and the crucial role of OSSEs in guiding decisions concerning the design of future altimeter constellation configurations.
Furthermore, the global experiments presented here were carried out with the MIOST mapping system. It is worth noting that the MIOST mapping approach represents one of several potential methods for integrating SWOT data into Level-4 gridded products and improving the space and time resolutions of the maps. Our study shows that refinement in the mapping method is required to effectively map fine-scale ocean structures. Various alternative approaches have been explored to retrieve finer-scale oceanic structures, encompassing assimilation of altimetric data into both simple ocean models (e.g., BFN-QG, Le Guillou et al., 2021a, 2023; 4DvarQG, Le Guillou et al., 2024) or dynamic interpolation methods (Ubelmann et al., 2015; Ballarotta et al., 2020a) and more complex ocean models (Benkiran et al., 2021; Tchonang et al., 2021; Archer et al., 2022; Benkiran et al., 2024; King et al., 2024; Souopgui et al., 2020; Zhou et al., 2024). Additionally, data-driven techniques (Fablet et al., 2021; Beauchamp et al., 2023; Martin et al., 2023, 2024; Archambault et al., 2023, 2024) and the local polynomial fitting approach by Lilly (2023) have been examined for spatial and temporal interpolation of altimetric data. Certain of these methods have demonstrated advantages in effectively mapping the complex structures of turbulent and intense ocean currents at fine scales and have proved to be very efficient for accounting for the imbalance between the high spatial resolution of SWOT data and their sparse temporal sampling at certain latitudes. Preliminary experiments aimed at exploring the potential of SWOT in 4DvarNET and 4DvarQG systems have just been conducted and appear to indicate that these systems are capable of better representing the nonlinear dynamics of ocean surface topography. Appendix B focuses on the capability of the 4DvarQG and 4DvarNET mapping approaches to capture finer structures. These alternative mapping methods have been tested at the regional scale, and initial analyses of their results show relatively good performance compared to the MIOST reconstruction, with significant gains in effective resolution of more than 20 km compared to equivalent MIOST products. These studies show that using dynamical constrains in the mapping procedure helps to improve the space and time resolutions of the maps. Overall, the 4DvarNET and 4DvarQG methods seem to be good alternative mapping approaches to the MIOST solution. The current constraint with both the 4DvarNET and the 4DvarQG methodologies is their inability to offer a global-scale solution for mapping SSH, but efforts are underway to address this limitation.
It is important to note that the conclusion regarding SWOT's contribution is only partially realized due to the limitations imposed by the existing gridding framework and validation data. In this study, we focused solely on reconstructing the geostrophically balanced ocean surface circulation. However, SWOT L3 data encompass a broader range of ocean surface dynamics, including nonlinear eddy dynamics and both linear and nonlinear internal waves. These small-scale phenomena cannot be captured by nadir altimeters, regardless of the number of conventional satellites, nor can they be captured with the current mapping approaches tested here. Consequently, SWOT's potential contribution may be even greater, highlighting the need for new frameworks that fully utilize its capabilities, particularly in capturing sub-mesoscale dynamics that are beyond the reach of nadir altimeters.
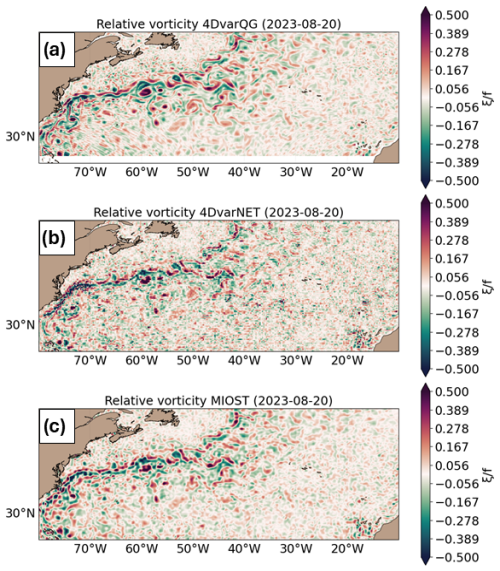
This broader perspective is essential, as the ocean surface circulation results from a complex interplay of phenomena occurring across various spatial and temporal scales, ranging from the slowly evolving large mesoscale eddies to more rapidly changing surface waves, sub-mesoscale eddies, filaments and fronts (see, for example, Fig. 3 in Chelton, 2001). Mesoscale eddies have been studied for over 30 years using multi-mission gridded altimetry products and are recognized as key drivers in the horizontal transport of heat, nutrients, and carbon (Wolfe et al., 2008; Klein and Lapeyre, 2009; Griffies et al., 2015; Dong et al., 2014). In contrast, sub-mesoscale variability and its role in ocean dynamics remain poorly observed and understood. These smaller-scale eddies may also play a crucial role in turbulent transport, mixing and energy dissipation, and their impact on ocean dynamics may be particularly significant in the context of climate change, as they influence the ocean's uptake of heat and CO2 (Zhang et al., 2023). Our analysis indicates that integrating high-resolution ocean surface observations with dynamically constrained mapping approaches could significantly enhance the accuracy of operational sea-level gridded products. From a physical oceanography perspective, these refined products are likely to improve our analysis of coherent vortices, increase our understanding of fine-scale ocean processes, which is essential for improving climate models and predictions. An analysis of the relative vorticity fields (detailed in Appendix B) reveals, for example, significant differences between mapping methods, particularly in the small-scale structures, fronts and filaments, which seem to be more pronounced in the 4DvarQG solution than the MIOST and 4DvarQG solutions. From an operational oceanography perspective, the refined products would participate in enhancing decision-making processes related to ocean safety, marine pollution management, ship routing and the sustainable utilization of fishing resources. By providing more accurate data, these products would enable more effective responses to environmental challenges and contribute to the overall safety and sustainability of maritime activities.
Before the launch of SWOT and the acquisition of the first KaRIn data, only observing system simulation experiments (OSSEs) had been conducted to study the contribution of wide swaths in mapping systems (Benkiran et al., 2021; Tchonang et al., 2021; Ubelmann et al., 2015; Ballarotta et al., 2020b; Le Guillou et al., 2021a, b; Bellemin Laponnaz et al., 2022). An OSSE is a method to assess the potential impact of new observing systems or changes to existing ones on data assimilation or mapping systems. In an OSSE, synthetic observations are generated to simulate the data that would be collected by a proposed observing system. These synthetic observations are then integrated into mapping systems to evaluate the impact on the resulting analyses or forecasts. By comparing the results from the OSSE with and without the proposed observing system, one can assess the potential benefits and limitations of the new observations. However, questions arise regarding the reliability and validity of studies conducted within the idealized framework of OSSEs. Here we propose to discuss the robustness of the results obtained in OSSEs with SWOT KaRIn data.
To prepare the MIOST mapping system for real KaRIn data, we conducted several OSSEs based on a 1-year-long realistic ocean numerical simulation. Specifically, we used SSH data from the global simulation GLORYS12v1 (Lellouche et al., 2021). The GLORYS12v1 reanalysis is a global ocean dataset generated by assimilating historical observations into the NEMO ocean model, driven at the surface by ECMWF ERA-Interim data. This reanalysis covers the entire globe and is provided on a regular grid.
We produced three datasets for nadir altimeters by interpolating model outputs onto each mission ground track. Similarly, we employed the SWOT Simulator (Gaultier et al., 2016) for generating SWOT data. Subsequently, we conducted two mapping experiments: one using the three-nadir constellation and one using the three-nadir constellation and one SWOT as input data, similar to the experiment of three nadirs and that of one SWOT and three nadirs previously described in the paper within an OSE framework.
These OSSEs are based on several simplifying assumptions; one can mention the following:
-
Measurement noise applied to the data is idealized (for example, 3 cm standard deviation Gaussian noise is added to the simulated nadir data).
-
Some long-wavelength biases present in real data have not been accounted for in the simulated data.
-
While real data are sometimes edited due to poor quality, no editing is applied to the simulated data.
-
In this GLORYS12v1 simulation, barotropic tides and internal tides are not explicitly resolved. Therefore, the pseudo-observations extracted from this simulation do not capture the residuals of these signals, unlike real altimetric data.
Despite these assumptions, the comparison of mapping enhancements resulting from the integration of the SWOT KaRIn instrument demonstrates relatively good agreement between the OSSE and OSE frameworks, as depicted in Fig. A1. The areas where the integration of SWOT into OSEs and OSSEs leads to error reductions are generally similar, although the extent of these improvements may vary locally. Specifically, notable differences between OSSEs and OSEs appear to manifest in certain regions, where it is likely that the content of simulated data is too idealized within the chosen OSSEs (for example due to the absence of internal wave residuals). Therefore, the use of more realistic numerical simulations, such as those integrating tidal waves in very high-resolution simulations like eNATL60 (Brodeau et al., 2020) or MITgcm (Marshall et al., 1997; Su et al., 2018), seems to be a better option for designing OSSEs. Overall, the largest error reductions when incorporating KaRIn are found in regions of high SSH variability (western boundary currents, ACC). The same conclusions are drawn concerning the effective resolution derived from OSSE and OSE frameworks (Fig. A2). This good agreement between OSE and OSSE results seems to indicate that OSSEs can play a significant role in shaping decisions regarding future altimeter constellation scenarios.
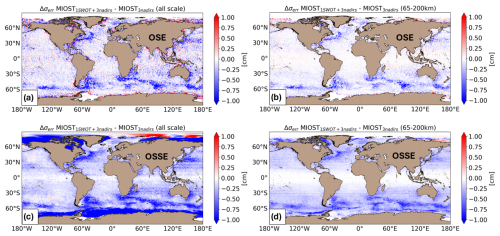
Figure A1The gain/loss of the mapping error standard deviation of SLA when integrating SWOT into a three-altimeter constellation for (a) all spatial scales in an OSE, (b) scales <200 km in an OSE, (c) all spatial scales in an OSSE and (d) scales <200 km in an OSSE. The blue color means a reduction in error standard deviation when SWOT is included in the mapping.
Various alternative mapping approaches exist to retrieve finer-scale oceanic structures. Here we propose to illustrate the performance of two alternative mapping methods that we specifically tested for our study: one based on an assimilated quasi-geostrophic model (4DvarQG) and another based on a data-driven approach (4DvarNET).
The 4DvarQG mapping technique (https://github.com/leguillf/MASSH) (last access: 10 January 2025) (Le Guillou et al., 2024) integrates a four-dimensional variational (4DVAR) scheme with a quasi-geostrophic (QG) model. The method integrates a weakly constrained, reduced-order 4DVAR scheme with a 1.5-layer QG model. An error term is optimized to align the QG dynamics with the observations. This term is projected onto a reduced basis consisting of space–time wavelets to ensure the convergence of the optimization process. The structure of the wavelet elements and their expected variances are carefully selected to represent the SSH variability in the AVISO/DUACS multi-mission product.
The 4DvarNET mapping algorithm (https://github.com/CIA-Oceanix/4dvarnet-core) (last access: 10 January 2025) (Fablet et al., 2021; Beauchamp et al., 2023) is a data-driven approach combining a data assimilation scheme associated with a deep learning framework. This neural network framework involves the joint training of the representation of the ocean dynamics, as well as of the solver of the data assimilation problem. The 4DvarNET algorithm is trained using a supervised learning strategy in an OSSE context, taking the SSH variable of an ocean model as ground truth. Once trained in an OSSE, the 4DvarNET algorithm is ready to perform SSH reconstructions with real altimetric data as input. For our study, 4DvarNET was trained on the eNATL60-BLB002 realistic high-resolution simulation (https://github.com/ocean-next/eNATL60, last access: 10 January 2025) over a portion of the Gulf Stream region ([32, 47° N] and [66° W, 51° W]). Pseudo-observations were generated from this numerical simulation to represent the present-day nadir altimeter constellation as well as KaRIn swath.
Specific experiments similar to the experiments of six nadirs and of one SWOT and six nadirs (see Table 2) were carried out over the North Atlantic basin ([25° N, 50° N] and [80° W, 10° W]) to estimate the impact of the SWOT swath and the performance of each method relative to the MIOST mapping approach.
Figures B1 and B2 focus on the impact of KaRIn data in each method. The KaRIn data primarily enable the reduction in mapping errors within the main Gulf Stream current. The integration of KaRIn into these mapping algorithms results in an average error reduction of 0.7 cm for the 4DvarQG method, 0.7 cm for the 4DvarNET method and 0.6 cm for the MIOST method. In terms of effective resolution gain, the impact of KaRIn varies depending on the mapping methods employed: the gain is moderate (<10 km) with the 4DvarQG method, more significant (10–20 km) with 4DvarNET and intermediate with MIOST (∼ 10 km). This suggests that linear interpolation methods such as MIOST or model dynamics-based methods like 4DvarQG are less sensitive to dense KaRIn observations compared to the data-driven method 4DvarNET, which manages to exploit more content from the KaRIn swath.
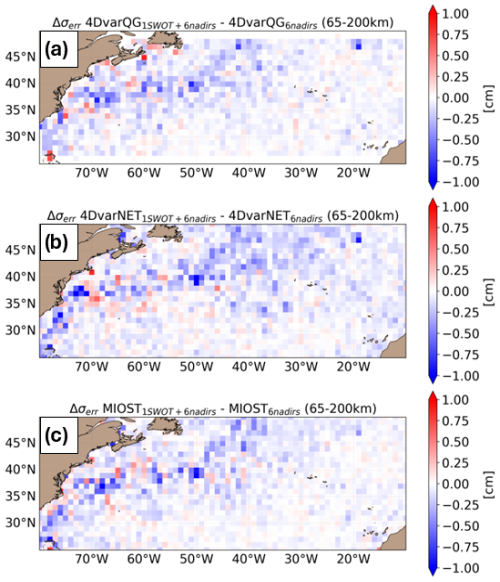
Figure B1The gain/loss of the mapping error standard deviation of SLA in the experiment of one SWOT and six nadirs relative to the six-nadir experiment mapping error standard deviation for scales between 65 and 200 km in (a) the 4DvarQG mapping method, (b) the 4DvarNET mapping approach and (c) the MIOST approach. The blue color means a reduction in error standard deviation when SWOT is included in the mapping.
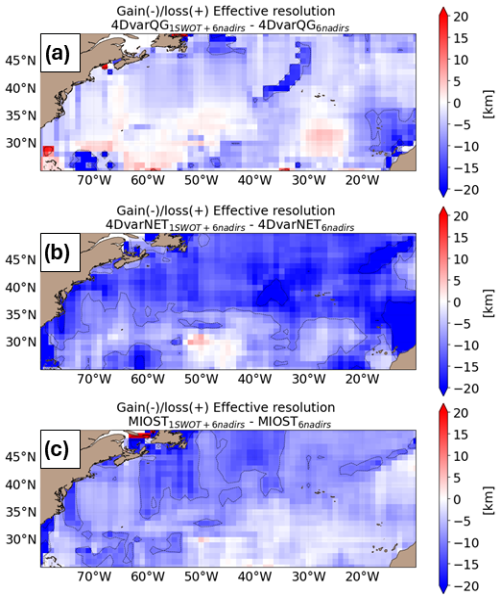
Figure B2The gain/loss of effective resolution (in km) between the experiment of one SWOT and six nadirs and that of six nadirs for (a) the 4DvarQG mapping method, (b) the 4DvarNET mapping approach and (c) the MIOST approach. Blue means finer resolution when SWOT is included in the mapping.
Figures B3 and B4 intercompare the performance of the 4DvarNET and 4DvarQG methods relative to the MIOST approach. These intercomparisons demonstrate that the 4DvarQG and 4DvarNET methods provide better surface topography reconstructions than the MIOST method, particularly in the main pathway of the Gulf Stream where nonlinear energetic dynamics dominate (see Fig. B3a and b). The average error reduction is 1.4 cm for the 4DvarQG method and 0.7 cm for the 4DvarNET method compared to the MIOST solution. In regions of low oceanic variability, the 4DvarQG and MIOST methods are relatively equivalent, whereas the 4DvarNET method appears to degrade the solution in these areas, likely due to the fact that the 4DvarNET model was trained only on a limited region of the Gulf Stream. This results in a significant improvement in resolution with the 4DvarNET and 4DvarQG methods, particularly in the main current of the Gulf Stream, where resolution gains of over 20 km are observed. The comparison between the 4DvarNET and 4DvarQG methods shows that the dynamical 4DvarQG method is able to map finer scales than the 4DvarNET in this part of the North Atlantic basin.
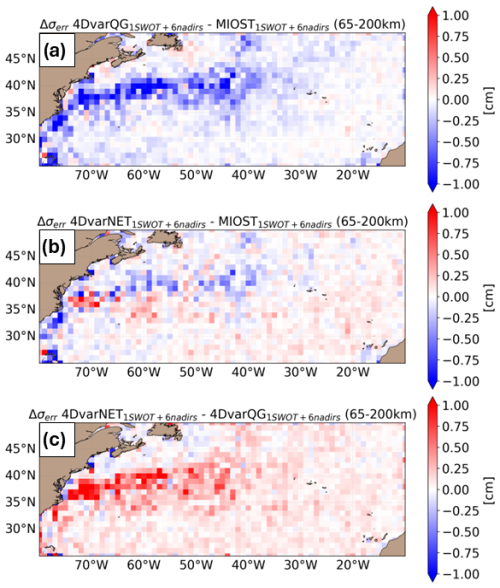
Figure B3The gain/loss of the mapping error standard deviation (for spatial scales <200 km) of SLA (a) in the experiment of one SWOT and six nadirs between 4DvarQG and MIOST (blue color means error reduction with 4DvarQG) (b) between 4DvarNET and MIOST (blue color means error reduction with 4DvarNET), and (c) between 4DvarNET and 4DvarQG (blue color means error reduction with 4DvarQG).
Qualitative assessments can also highlight differences between each method, particularly when analyzing the relative vorticity maps derived from the SSH gridded field. Figure B5 presents the relative vorticity maps on 30 August 2023 over the Gulf Stream region for each method. There are notable disparities in the structure of the relative vorticity fields, especially in the small-scale structures, fronts and filaments, which are more pronounced in the 4DvarQG solutions. These features, crucial for surface energy transfer, horizontal and vertical transport, and heat and carbon uptake (Wolfe et al., 2008; Klein and Lapeyre, 2009; Griffies et al., 2015), are difficult to map accurately with current operational mapping algorithms and appear more realistic and coherent with the 4DvarQG approach.
Overall, the 4DvarNET and 4DvarQG methods seem to be good alternative mapping approaches of the MIOST solution. The current constraint with both the 4DvarNET and the 4DvarQG methodologies is their inability to offer a global-scale solution for mapping SSH, but efforts are underway to address this limitation.
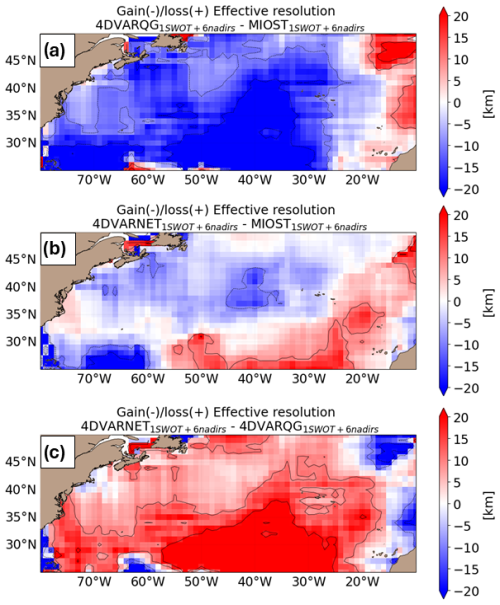
Figure B4The gain/loss of effective resolution (in km) between (a) the 4DvarQG and MIOST mapping methods (blue means finer resolution with 4DvarQG), (b) the 4DvarNET and MIOST mapping methods (blue means finer resolution with 4DvarNET), and (c) the 4DvarNET and 4DvarQG mapping methods (blue means finer resolution with 4DvarNET).
The code used to compute the metrics discussed in this study is available through the following Ocean Data Challenge (Ballarotta and Metref, 2024): https://doi.org/10.5281/zenodo.14187279 and https://github.com/ocean-data-challenges/2024_DC_SSH_mapping_SWOT_OSE (last access: 10 January 2025).
The SWOT_L3_LR_SSH product, derived from the L2 SWOT KaRIn Low Rate Ocean data products (NASA JPL and CNES), is produced and made freely available by AVISO and DUACS teams as part of the DESMOS Science Team project (https://doi.org/10.24400/527896/A01-2023.018, AVISO/DUACS, 2024a).
The near-real-time (NRT) Level-3 altimeter satellite along-track data are distributed by the EU Copernicus Marine Service (product reference SEALEVEL_GLO_PHY_L3_NRT_008_044, https://doi.org/10.48670/moi-00147, Pujol et al., 2023).
The gridded sea-level height and geostrophic-velocity products computed with nadirs and wide-swath altimetry and presented in this study are made freely available by the AVISO and DUACS teams as part of the DESMOS Science Team project. These products were processed by SSALTO/DUACS and distributed by AVISO (https://www.aviso.altimetry.fr, last access: 10 January 2025), supported by CNES: https://doi.org/10.24400/527896/a01-2004.007 (AVISO/DUACS, 2024b).
Specific maps (excluding SARAL/AltiKa) made for this study are made available in a collaborative data challenge: https://github.com/ocean-data-challenges/2024_DC_SSH_mapping_SWOT_OSE (last access: 10 January 2025) and https://doi.org/10.5281/zenodo.14187279 (Ballarotta and Metref, 2024).
MB designed the experiments, conducted the MIOST mapping and analysis, and wrote the manuscript with contributions from all co-authors. VBL carried out the initial work on OSSEs. GM, CA and AL handled the 4DvarNET mapping and analysis, while FLG conducted the 4DvarQG mapping and analysis. AD optimized the MIOST code. GD, YF, RF and MIP acquired funding and managed the project. All authors reviewed and edited the draft version.
The contact author has declared that none of the authors has any competing interests.
Publisher's note: Copernicus Publications remains neutral with regard to jurisdictional claims made in the text, published maps, institutional affiliations, or any other geographical representation in this paper. While Copernicus Publications makes every effort to include appropriate place names, the final responsibility lies with the authors.
The authors would like to thank the reviewers Jinbo Wang and Peter Oke for their feedback and constructive suggestions, which have greatly contributed to improving the quality of this paper. We extend our thanks to CNES for providing access to their high-performance computing facilities, which were essential for the development and completion of this research. We would also like to thank Sammy Metref for developing and maintaining the ocean-data-challenge platform.
This paper was edited by Ilker Fer and reviewed by Jinbo Wang and Peter Oke.
Archambault, T., Filoche, A., Charantonnis, A., and Béréziat, D.: Multimodal unsupervised spatio-temporal interpolation of satellite ocean altimetry maps, InVISAPP, 2023.
Archambault, T., Filoche, A., Charantonis, A., Béréziat, D., and Thiria, S.: Learning Sea Surface Height Interpolation From Multi-Variate Simulated Satellite Observations, JAMES, 16, https://doi.org/10.1029/2023MS004047, 2024.
Archer, M. R., Li, Z., Wang, J., and Fu, L.: Reconstructing fine-scale ocean variability via data assimilation of the SWOT pre-launch in situ observing system, J. Geophys. Res.-Oceans, 127, e2021JC017362, https://doi.org/10.1029/2021JC017362, 2022.
Aviso+: Timeline of modern radar altimetry missions, version 2024/01, https://doi.org/10.24400/527896/A02-2022.001, 2022.
AVISO/DUACS: SWOT Level-3 KaRIn Low Rate SSH Expert (v1.0), CNES [data set], https://doi.org/10.24400/527896/A01-2023.018, 2024a.
AVISO/DUACS: SALTO/DUACS Mutlimission Experimental Level-4 maps, computed with SWOT Level-3 products (using both KaRIn and nadir instruments) (v1.0), CNES [data set], https://doi.org/10.24400/527896/a01-2004.007, 2024b.
Ballarotta, M. and Metref, S.: ocean-data-challenges/2024_DC_SSH_mapping_SWOT_OSE: Material for SWOT SSH mapping data challenge, Zenodo [code], https://doi.org/10.5281/zenodo.14187279, 2024.
Ballarotta, M., Ubelmann, C., Pujol, M.-I., Taburet, G., Fournier, F., Legeais, J.-F., Faugère, Y., Delepoulle, A., Chelton, D., Dibarboure, G., and Picot, N.: On the resolutions of ocean altimetry maps, Ocean Sci., 15, 1091–1109, https://doi.org/10.5194/os-15-1091-2019, 2019.
Ballarotta, M., Ubelmann, C., Rogé, M., Fournier, F., Faugère, Y., Dibarboure, G., Morrow, R., and Picot, N: Dynamic Mapping of Along-Track Ocean Altimetry: Performance from Real Observations, J. Atmos. Ocean. Tech., 37, 1593–1601, https://doi.org/10.1175/JTECH-D-20-0030.1, 2020a.
Ballarotta, M., Cosme, E., and Albert, A: ocean-data-challenges/2020a_SSH_mapping_NATL60: Material for SSH mapping data challenge (Version v1), Zenodo, https://doi.org/10.5281/zenodo.4045400, 2020b.
Ballarotta, M., Ubelmann, C., Veillard, P., Prandi, P., Etienne, H., Mulet, S., Faugère, Y., Dibarboure, G., Morrow, R., and Picot, N.: Improved global sea surface height and current maps from remote sensing and in situ observations, Earth Syst. Sci. Data, 15, 295–315, https://doi.org/10.5194/essd-15-295-2023, 2023.
Beauchamp, M., Febvre, Q., Georgenthum, H., and Fablet, R.: 4DVarNet-SSH: end-to-end learning of variational interpolation schemes for nadir and wide-swath satellite altimetry, Geosci. Model Dev., 16, 2119–2147, https://doi.org/10.5194/gmd-16-2119-2023, 2023.
Beckley, B. D., Zelensky, N. P., Holmes, S. A., Lemoine, F. G., Ray, R. D., Mitchum, G. T., Desai, S., and Brown, S. T.: Assessment of the Jason-2 Extension to the TOPEX/Poseidon, Jason-1 Sea-Surface Height Time Series for Global Mean Sea Level Monitoring, Mar. Geod., 33, 447–471, https://doi.org/10.1080/01490419.2010.491029, 2010.
Bellemin Laponnaz, V., Faugere, Y., Ballarotta, M., and Pegliasco, C.: SWOT global SSH maps performances using OSSEs, Swot Science Team Meeting, 2022, https://swotst.aviso.altimetry.fr/fileadmin/user_upload/SWOTST2022/FR_Wednesday_AM_Ocean/WG4/04_SWOT ST Valentin Bellemin Laponnaz.pdf (last access: 28 March 2024), 2022.
Benkiran, M., Ruggiero, G., Greiner, E., Le Traon, P.-Y., Rémy, E., Lellouche, J. M., Bourdallé-Badie, R., Drillet, Y., and Tchonang B.: Assessing the impact of the assimilation of SWOT observations in a global high-resolution analysis and forecasting system. Part 1: method, Front. Mar. Sci., 8, 691955, https://doi.org/10.3389/fmars.2021.691955, 2021.
Benkiran, M., Le Traon, P.-Y., Rémy, E., and Drillet, Y.: Impact of two high resolution altimetry mission concepts for ocean forecasting, Front. Mar. Sci., 11, 1465065, https://doi.org/10.3389/fmars.2024.1465065, 2024.
Brodeau, L., Le Sommer, J., and Albert, A.: ocean-next/eNATL60: Material describing the set-up and the assessment of NEMO-eNATL60 simulations (Version v1), Zenodo, https://doi.org/10.5281/zenodo.4032732, 2020.
Chelton, D.: Report of the High-Resolution Ocean Topography Science Working Group Meeting, Oregon State University, College of Oceanic and Atmospheric Sciences, https://ceoas.oregonstate.edu/hotswg (last access: 25 November 2024), 2001.
Dibarboure, G., Anadon, C., Briol, F., Cadier, E., Chevrier, R., Delepoulle, A., Faugère, Y., Laloue, A., Morrow, R., Picot, N., Prandi, P., Pujol, M.-I., Raynal, M., Treboutte, A., and Ubelmann, C.: Blending 2D topography images from SWOT into the altimeter constellation with the Level-3 multi-mission DUACS system, EGUsphere [preprint], https://doi.org/10.5194/egusphere-2024-1501, 2024.
Dong, C., McWilliams, J., Liu, Y., and Chen, D.: Global heat and salt transports by eddy movement, Nat. Commun., 5, 3294, https://doi.org/10.1038/ncomms4294, 2014.
Ducet, N., Le Traon, P. Y., and Reverdin, G.: Global high-resolution mapping of ocean circulation from the combination of T/P and ERS-1/2, J. Geophys. Res., 105, 19477–19498, https://doi.org/10.1029/2000JC900063, 2000.
Dufau, C., Orsztynowicz, M., Dibarboure, G., Morrow, R., and Le Traon, P.-Y.: Mesoscale resolution capability of altimetry: present and future, J. Geophys. Res.-Oceans, 121, 4910–4927, https://doi.org/10.1002/2015JC010904, 2016.
King, R. R., Martin, M. J., Gaultier, L., Waters, J., Ubelmann, C., and Donlon, C.: Assessing the impact of future altimeter constellations in the Met Office global ocean forecasting system, Ocean Sci., 20, 1657–1676, https://doi.org/10.5194/os-20-1657-2024, 2024.
Fablet, R., Beauchamp, M., Drumetz, L., and Rousseau, F.: Joint Interpolation and Representation Learning for Irregularly Sampled Satellite-Derived Geophysical Fields, Front. Appl. Math. Stat., 7, 655224, https://doi.org/10.3389/fams.2021.655224, 2021.
Fu, L. L. and Rodriguez, E.: High-Resolution Measurement of Ocean Surface Topography by Radar Interferometry for Oceanographic and Geophysical Applications, in: The State of the Planet: Frontiers and Challenges in Geophysics, IUGG Geophysical Monograph, American Geophysical Union: Washington, DC, USA, 19, 209–224, https://doi.org/10.1029/150GM17, 2004.
Gaultier, L., Ubelmann, C., and Fu, L.-L.: The challenge of using future SWOT data for oceanic field reconstruction, J. Atmos. Ocean. Tech., 33, 119–126, https://doi.org/10.1175/JTECH-D-15-0160.1, 2016.
Griffies, S. M., Winton, M., Anderson, W. G., Benson, R., Delworth T. L., Dufour, C. O., Dunne, J. P., Goddard, P., Morrison, A. K., Rosati, A., Wittenberg, A. T., Yin, J., and Zhang, R.: Impacts on ocean heat from transient mesoscale eddies in a hierarchy of climate models, J. Climate, 28, 952–977, https://doi.org/10.1175/JCLI-D-14-00353.1, 2015.
Klein, P. and Lapeyre, G.: The oceanic vertical pump induced by mesoscale and submesoscale turbulence, Annu. Rev. Mar. Sci., 1, 351–375, https://doi.org/10.1146/annurev.marine.010908.163704, 2009.
Le Guillou, F., Metref, S., Cosme, E., Ubelmann, C., Ballarotta, M., Le Sommer, J., and Verron, J.: Mapping Altimetry in the Forthcoming SWOT Era by Back-and-Forth Nudging a One-Layer Quasigeostrophic Model, J. Atmos. Ocean. Tech., 38, 697–710, https://doi.org/10.1175/JTECH-D-20-0104.1, 2021a.
Le Guillou, F., Lahaye, N., Ubelmann, C., Metref, S., Cosme, E., Ponte, A., Le Sommer, J., Blayo, E., and Vidard, A.: Joint estimation of balanced motions and internal tides from future wideswath altimetry, J. Adv. Model. Earth Sy., 13, e2021MS002613, https://doi.org/10.1029/2021MS002613, 2021b.
Le Guillou, F., Gaultier, L., Ballarotta, M., Metref, S., Ubelmann, C., Cosme, E., and Rio, M.-H.: Regional mapping of energetic short mesoscale ocean dynamics from altimetry: performances from real observations, Ocean Sci., 19, 1517–1527, https://doi.org/10.5194/os-19-1517-2023, 2023.
Le Guillou, F., Chapron, B., and Rio, M.-H.: VarDyn: Dynamical joint-reconstructions of Sea Surface Height and Temperature from multi-sensor satellite observations, ESS Open Archive, https://doi.org/10.22541/essoar.172616118.81277809/v1, 2024.
Lellouche, J.-M., Eric, G., Romain, B. B., Gilles, G., Angelique, M., Marie, D. Bricaut, C., Hamon, M., Le Galloudec, O., Regnier, C., Candela, T., Testut, C. E., Gasparin, F., Ruggiero, G., Benkiran, M., Drillet, Y., and Le Traon, P. Y.: The copernicus global 1/12° oceanic and sea ice GLORYS12 reanalysis, Front. Earth Sci., 9, 698876, https://doi.org/10.3389/feart.2021.698876, 2021.
Le Traon, P. Y.: From satellite altimetry to Argo and operational oceanography: three revolutions in oceanography, Ocean Sci., 9, 901–915, https://doi.org/10.5194/os-9-901-2013, 2013.
Le Traon, P.-Y., Nadal, F., and Ducet, N.: An Improved Mapping Method of Multisatellite Altimeter Data, J. Atmos. Ocean. Tech., 15, 522–534, https://doi.org/10.1175/1520-0426(1998)015<0522:AIMMOM>2.0.CO;2, 1998.
Le Traon, P.-Y., Faugere, Y., Hernandez, F., Dorandeu, J., Mertz, F., and Ablain, M.: Can We Merge GEOSAT Follow-On with TOPEX/Poseidon and ERS-2 for an Improved Description of the Ocean Circulation?, J. Atmos. Ocean. Tech., 20, 889–895, https://doi.org/10.1175/1520-0426(2003)020<0889:CWMGFW>2.0.CO;2, 2003.
Lilly, J.: Optimal parameters for mapping along-track altimetry: Ocean Surface Topography Science Team Meeting, San Juan, Puerto Rico, https://www.jmlilly.net/talks/lilly23-ostst/index.html#0 (last access: 10 January 2025), 2023.
Marshall, J., Adcroft, A., Hill, C., Perelman, L., and Heisey, C.: A finite-volume, incompressible Navier Stokes model for studies of the ocean on parallel computers, J. Geophys. Res.-Oceans, 102, 5753–5766, https://doi.org/10.1029/96jc02775, 1997.
Martin, S. A., Manucharyan, G. E., and Klein, P.: Synthesizing sea surface temperature and satellite altimetry observations using deep learning improves the accuracy and resolution of gridded sea surface height anomalies, J. Adv. Model. Earth Sy., 15, e2022MS003589, https://doi.org/10.1029/2022ms003589, 2023.
Martin, S. A., Manucharyan, G. E., and Klein, P.: Deep Learning Improves Global Satellite Observations of Ocean Eddy Dynamics, Geophys. Res. Lett., 51, 17, https://doi.org/10.1029/2024GL110059, 2024.
Morrow, R., Fu, L. L., Ardhuin, F., Benkiran, M., Chapron, B., Cosme, E., d'Ovidio, F., Farrar, J. T., Gille, S. T., Lapeyre, G., Le Traon, P.-Y., Pascual, A., Ponte, A., Qiu, B., Rascle, N., Ubelmann, C., Wang, J., and Zaron, E. D.: Global observations of fine-scale ocean surface topography with the surface water and ocean topography (SWOT) mission, Front. Mar. Sci., 6, 232, https://doi.org/10.3389/fmars.2019.00232, 2019.
Pujol, M. I., Dibarboure, G., Le Traon, P. Y., and Klein, P.: Using high-resolution altimetry to observe mesoscale signals, J. Atmos. Ocean. Tech., 29, 1409–1416, https://doi.org/10.1175/JTECH-D-12-00032.1, 2012.
Pujol, M.-I., Faugère, Y., Taburet, G., Dupuy, S., Pelloquin, C., Ablain, M., and Picot, N.: DUACS DT2014: the new multi-mission altimeter data set reprocessed over 20 years, Ocean Sci., 12, 1067–1090, https://doi.org/10.5194/os-12-1067-2016, 2016.
Pujol, M.-I., Taburet, G., and DUACS Team: Quality information document, Sea Level TAC – DUACS Products, Copernicus Marine Service, https://doi.org/10.48670/moi-00147, 2023.
Souopgui, I., D'Addezio, J. M., Rowley, C. D., Smith, S. R., Jacobs, G. A., Helber, R. W., and Osbome, J. J.: Multi-scale assimilation of simulated SWOT observations, Ocean Model., 154, 101683, https://doi.org/10.1016/j.ocemod.2020.101683, 2020.
Su, Z., Wang, J., Klein, P., Thompson, A. F., and Menemenlis, D.: Ocean submesoscales as a key component of the global heat budget, Nat. Commun., 9, 775, https://doi.org/10.1038/s41467-018-02983-w, 2018.
Tchonang, B. C., Benkiran, M., Le Traon, Y. P., Van Gennip, S. J., Lellouche, J. M., and Ruggiero, G.: Assessing the impact of the assimilation of SWOT observations in a global high-resolution analysis and forecasting system. Part 2: results, Front. Mar. Sci., 8, 687414, https://doi.org/10.3389/fmars.2021.687414, 2021.
Ubelmann, C., Klein, P., and Fu, L. L.: Dynamic interpolation of sea surface height and potential applications for future high-resolution altimetry mapping, J. Atmos. Ocean. Tech., 32, 177–184, https://doi.org/10.1175/JTECH-D-14-00152.1, 2015.
Ubelmann, C., Dibarboure, G., Gaultier, L., Ponte, A., Ardhuin, F., Ballarotta, M., and Faugère, Y.: Reconstructing ocean surface current combining altimetry and future spaceborne Doppler data, J. Geophys. Res.-Oceans, 126, e2020JC016560, https://doi.org/10.1029/2020JC016560, 2021.
Ubelmann, C., Carrere, L., Durand, C., Dibarboure, G., Faugère, Y., Ballarotta, M., Briol, F., and Lyard, F.: Simultaneous estimation of ocean mesoscale and coherent internal tide sea surface height signatures from the global altimetry record, Ocean Sci., 18, 469–481, https://doi.org/10.5194/os-18-469-2022, 2022.
Vergara, O., Morrow, R., Pujol, M.-I., Dibarboure, G., and Ubelmann, C.: Global submesoscale diagnosis using along-track satellite altimetry, Ocean Sci., 19, 363–379, https://doi.org/10.5194/os-19-363-2023, 2023.
Wolfe, C., Cessi, P., McClean, J., and Maltrud, M.: Vertical heat transport in eddying ocean models, Geophys. Res. Lett., 35, L23605, https://doi.org/10.1029/2008GL036138, 2008.
Zhang, Z., Wang, W., and Qiu, B.: Oceanic mass transport by mesoscale eddies, Science, 345, 322–324, https://doi.org/10.1126/science.1252418, 2014.
Zhang, Z., Liu, Y., Qiu, B., Luo, Y., Cai, W., Yuan, Q., Liu, Y., Zhang, H., Liu, H., Miao, M., Zhang, J., Zhao, W., and Tian, J.: Submesoscale inverse energy cascade enhances Southern Ocean eddy heat transport, Nat. Commun., 14, 1335, https://doi.org/10.1038/s41467-023-36991-2, 2023.
Zhou, C., Cui, W., Sun, R., Huang, Y., and Zhuang, Z.: Enhancing the Assimilation of SWOT Simulated Observations Using a Multi-Scale 4DVAR Method in Regional Ocean Modeling System, Remote Sens., 16, 778, https://doi.org/10.3390/rs16050778, 2024.
- Abstract
- Introduction
- Data and methods
- Experiments and validation metrics
- Results
- Discussion and conclusions
- Appendix A: Discussion on the robustness of observing system simulation experiments
- Appendix B: Alternative mapping methods
- Code availability
- Data availability
- Author contributions
- Competing interests
- Disclaimer
- Acknowledgements
- Review statement
- References


