the Creative Commons Attribution 4.0 License.
the Creative Commons Attribution 4.0 License.
 | 13 Mar 2025
Observed bottom warming in the East Siberian Sea driven by the intensified vertical mixing
Xiaoyu Wang
Longjiang Mu
The East Siberian Sea (ESS) features the broadest continental shelf on Earth and contains nearly 80 % of the world's subsea permafrost. A persistently cold bottom layer, with temperatures at freezing point, inhibits the downward transport of heat, thus preventing the thawing of permafrost and subsequent methane release from sediments. However, in early September 2016, we observed an unprecedented warming of over 3 °C at the bottom of the water column, approximately 46 m deep in the ESS, following a relatively moderate Arctic cyclone. We attribute this notable bottom warming to enhanced wave-induced vertical mixing, which facilitates the well-mixed Arctic marginal seas and allows surface heat to reach the bottom layer. As sea ice continues to retreat on the Arctic continental shelf, wind-driven waves have longer fetch to grow. Consequently, even moderate cyclones can trigger substantial vertical mixing, a phenomenon not previously documented. Given the accelerated warming of the Arctic and the rapid decline of sea ice, we anticipate that more open water will foster the growth of larger wind-driven waves and intensified vertical mixing, leading to greater heat influx to the bottom layers of Arctic shelves in the future.
- Article
(4465 KB) - Full-text XML
- BibTeX
- EndNote


The East Siberian Arctic shelf includes the Laptev Sea, the East Siberian Sea (ESS), and the Russian side of the Chukchi Sea. It is the broadest ( km2) and shallowest (mean depth < 50 m) shelf in the world ocean, with nearly 80 % of existing subsea permafrost and up to 50 % methane flux of the global coastal seas area (Shakhova et al., 2019; Shakhova and Semiletov, 2007). In summer, the seafloor of the East Siberian Arctic shelf is generally covered by cold bottom waters ( °C) that are several meters to tens of meters thick (Dmitrenko et al., 2011; Bauch and Cherniavskaia, 2018; Wang et al., 2021). This cold layer acts as a barrier to isolate the seabed from the warmer surface layer and then reduce the methane emissions from sediments by about half (Ferré et al., 2020; El Bani Altuna et al., 2021).
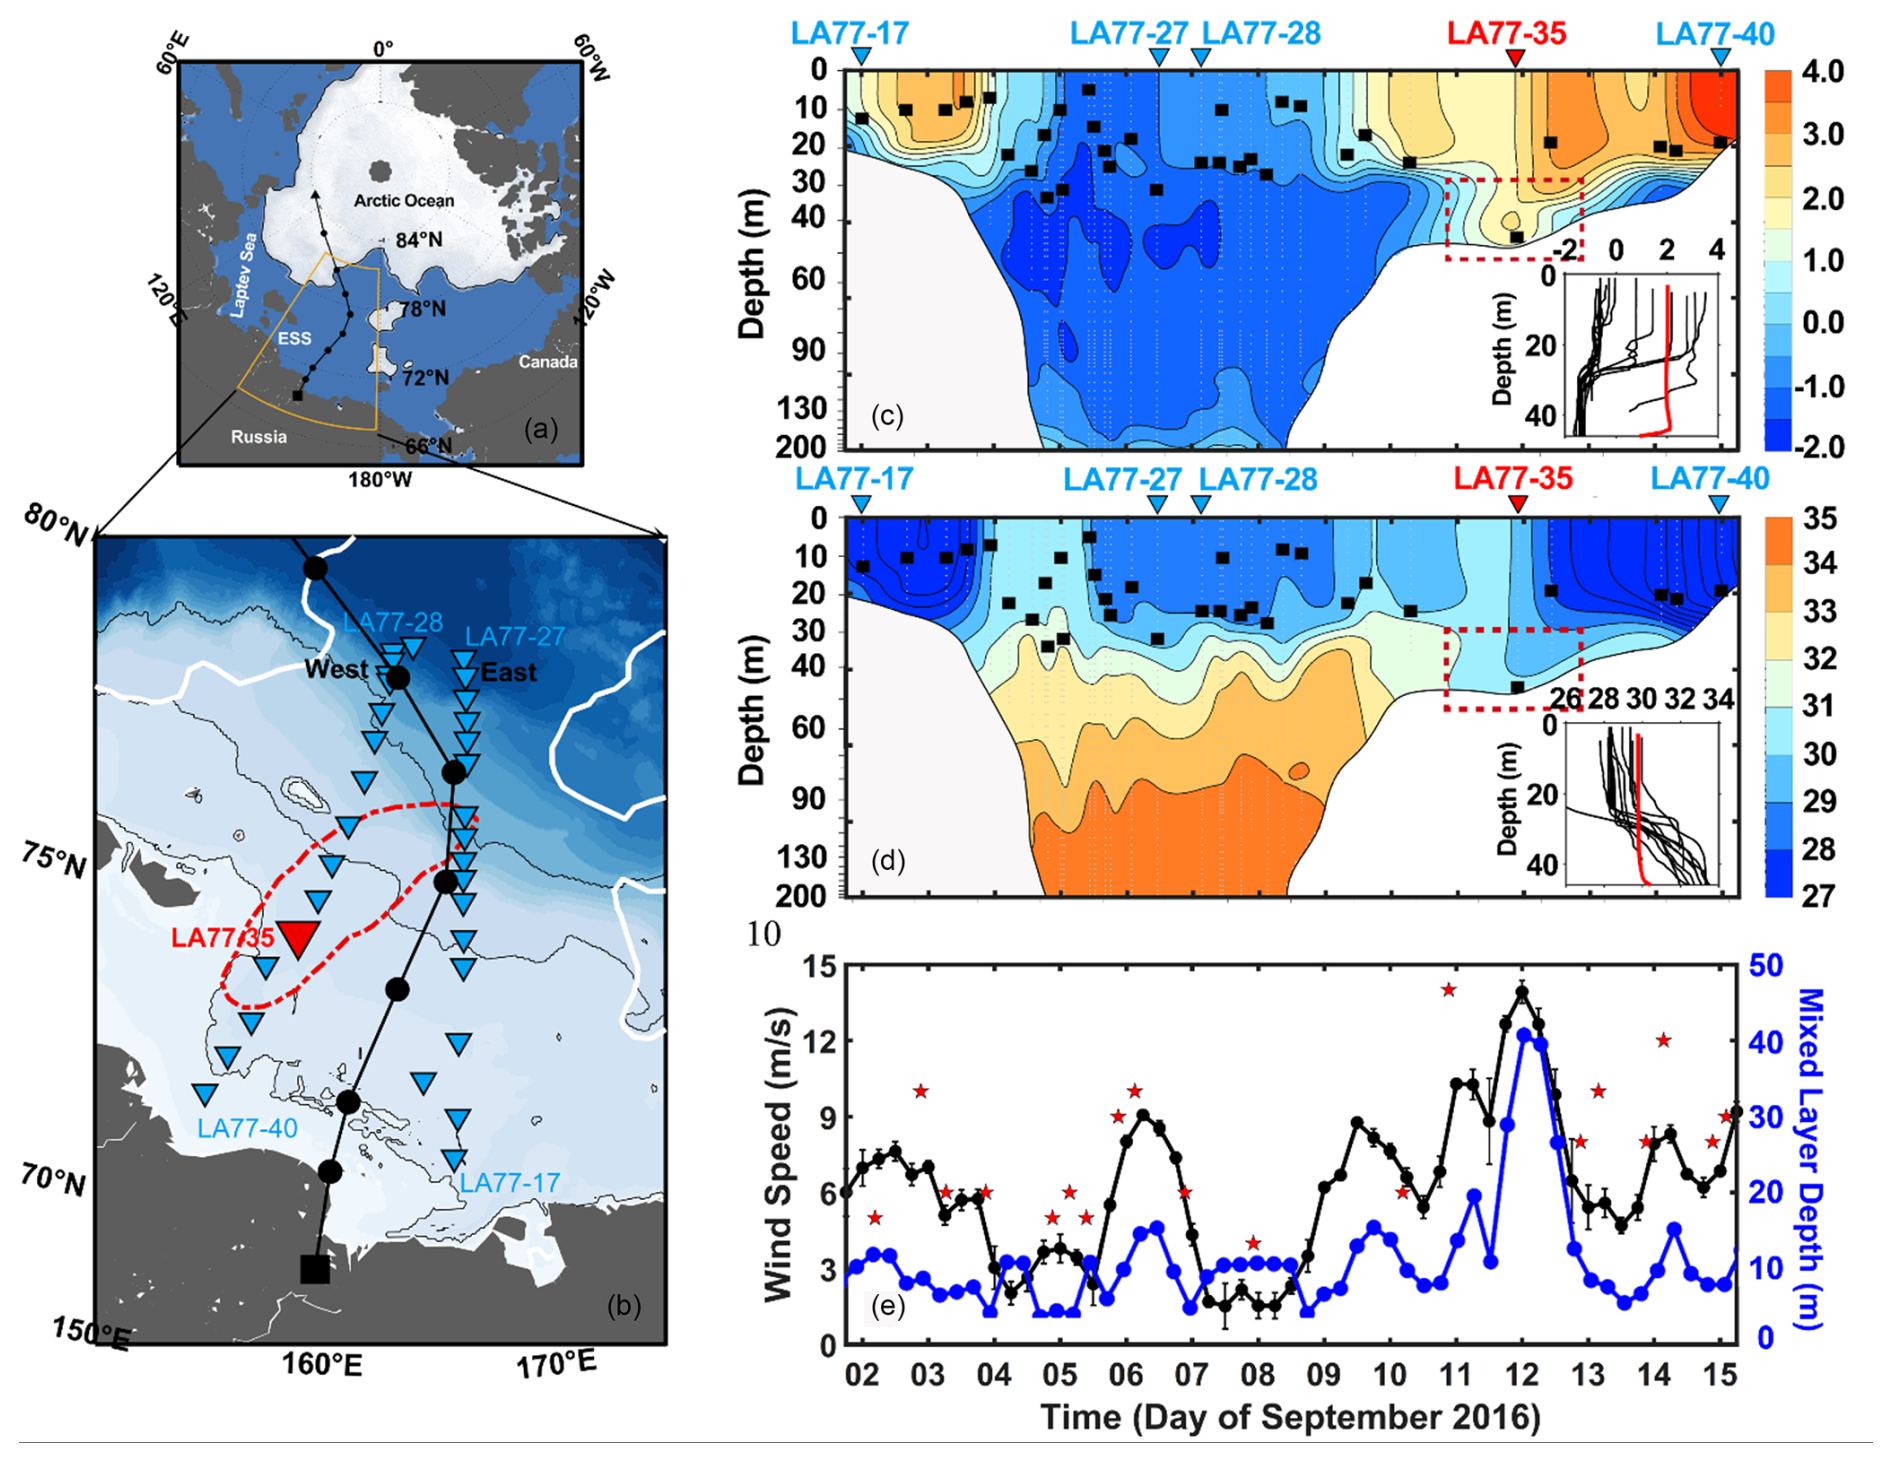
Figure 1Observations in the East Siberian Sea (ESS). (a) The path of the Arctic cyclone from 9 to 12 September 2016. The white area indicates the ocean covered by sea ice. (b) Location of stations (blue triangles) in the ESS. The red triangle marks the station LA77-35. Dots show the trajectory of the cyclone center. The dashed red line marks the area with wind speed exceeding 12 m s−1. (c) The temperature along the section from LA77-17 to LA77-27 and then from LA77-28 to LA77-40. The horizontal coordinate is time. The black rectangles denote the MLD at each station, and the red triangle marks the location of station LA77-35. The red rectangular box denotes where the significant bottom-water warming occurs. The inset figure shows the temperature profiles of all stations, in which the red line denotes the temperature profile of station LA77-35. (d) Same as panel (c) but for the salinity. (e) Variation in wind speeds and MLDcr during the observation period. Black dots denote the 6 h wind speeds derived from the hourly ERA5 reanalysis data according to the vessel's GPS positions. Blue dots denote the MLDcr induced by wave-breaking and wind stress. The red asterisks denote in situ observations of wind speeds from an onboard anemometer.
However, recent observations show that the near-bottom water over the Laptev Sea mid-shelf has exhibited pronounced warming due to the increasing downward mixing of surface warm water during the retreat of the surface sea ice since the mid-1980s (Janout and Lenn, 2014; Janout et al., 2016). In the late summer of 2007, the wind-induced vertical mixing caused a dramatic and abrupt near-bottom warming of about 3.0 °C on the Laptev Sea mid-shelf (30 m water depth) (Hölemann et al., 2011). The warming impacts on bottom-water temperature anomaly remained for up to 3 months after the wind event, leading to the warm bottom waters during the winter (Kraineva et al., 2019). A series of year-round oceanographic moorings at a deeper location (40 m water depth) in the Laptev Sea recorded near-bottom temperatures reaching 2.0 °C during 2012/2013 (Janout et al., 2016). Turbulent mixing is critical in determining vertical heat transfer in the water column. The strength of vertical mixing on the East Siberian Arctic shelf is dominated by wind forcing, tide-induced/shear-induced mixing, surface stress from ice motion, and buoyancy loss during ice formation. When the sea ice declines dramatically at the end of the summer melt season, wind forcing becomes dominant (Janout and Lenn, 2014). Previous studies showed that cyclone-induced strong wind can cause a mixing-layer deepening of about 5–10 m (Long and Perrie, 2012; Peng et al., 2021). This slight deepening can only cause significant impacts on the thermohaline bottom conditions on the inner shelf (water depth < 30 m).
The East Siberian Sea (ESS) has a much broader shelf than the Laptev Sea. However, for the lack of in situ observations, few studies focus on the bottom warming and related physical processes in the ESS. In the summer of 2016, the sea ice within the ESS sector decreased significantly, leaving a nearly ice-free shelf by early September (Fig. 1). On 11 September, a uniformly mixed water column on the mid-shelf of the ESS was observed, with the bottom-water temperature reaching nearly 3.0 °C. It is the first observation of such a remarkable vertical mixing event in the ESS during the period with the most intensified upper stratification over the course of 1 year. This paper reports this extreme mixing event and the related processes. We also present the intensification of the vertical mixing during the sea ice retreat for the past 2 decades and its thermal impacts on the bottom layer in the ESS.
The paper is structured as follows. Section 2 provides a data and methods description. Section 3 presents the process of an extreme vertical mixing event first observed in the ESS and its influences on the heat budget of shelf waters. The discussion and conclusions are given in Sect. 4.
2.1 In situ observations
The cruise (LA77), using the vessel R/V Akademik M. A. Lavrentyev, carried out two hydrographic sections across the ESS. The cross-shelf observations started at station LA77-17 on 2 September 2016 and ended at station LA77-40 on 15 September 2016 (Fig. 1b). A total of 23 temperature–salinity profiles were obtained using an SBE 911plus conductivity, temperature, and depth (CTD) sensor with temperature and salinity accuracies of 0.001 °C and 0.003 psu, respectively. The sensor was calibrated at the Sea-Bird facilities in Seattle before and after the cruise, and the CTD casts were processed according to Sea-Bird processing procedures. A total of 9 temperature–salinity profiles were obtained using expendable CTD (XCTD) with temperature and salinity accuracies of 0.02 °C and 0.04 psu, respectively. The in situ CTD and XCTD data are available at https://doi.org/10.5281/zenodo.4507584 (Wang and He, 2021). The wind speed at each station was recorded by a mechanical anemometer mounted about 10 m high.
2.2 Reanalysis product and satellite-derived data
We use the hourly and monthly atmospheric reanalysis products provided by the European Centre for Medium-Range Weather Forecasts (ECMWF) (Hersbach et al., 2020). The spatial resolution of meteorological and surface heat flux datasets is 0.25°×0.25°, and that of the ocean wave datasets is 0.5°×0.5°.
We use the Global Ocean Physics Reanalysis (GLORYS12V1) product with an eddy-resolving (1/12° horizontal resolution and 50 vertical levels) resolution to evaluate the warming trends of bottom waters on the shelf bottom (Lellouche et al., 2021). The model component is the Nucleus for European Modelling of the Ocean (NEMO) platform driven at surface by ECMWF ERA-Interim then ERA5 reanalysis. Along-track altimeter data (sea level anomaly), satellite sea surface temperature (SST), sea ice concentration, and in situ temperature and salinity profiles are jointly assimilated. Moreover, a 3D-Var scheme provides a correction for the slowly evolving large-scale biases in temperature and salinity. This reanalysis has good representation of Arctic sea ice concentration and water temperature, and it is widely used in the analysis of Arctic hydrographic structure changes (Hall et al., 2021; Hudson et al., 2024; Ivanov et al., 2024).
The sea surface temperature (SST) used in the analysis is from the optimally interpolated SST daily product v5.1 with a spatial resolution of 0.25°×0.25°, supported by Remote Sensing Systems sponsored by the National Oceanographic Partnership Program (NOPP) and the NASA Earth Science Physical Oceanography Program.
2.3 Mixed-layer depth, wavelength of surface wave, and ocean heat content
The mixed-layer depth (MLD) is usually between 15–25 m on the Arctic shelves, and its change can be used to demonstrate the regionally diapycnal mixing strength (Peralta-Ferriz and Woodgate, 2015). The method to determine the MLD is according to the maximum depth at which the density is within a certain threshold of the shallowest measured density. Due to complex hydrographic conditions around the Arctic Ocean, there are various thresholds from 0.01 to 0.25 kg m−3 (Timmermans et al., 2012; Peralta-Ferriz and Woodgate, 2015). In this study, we use a threshold value of 0.05 kg m−3 to detect the MLD. Note that the other threshold density values would not make a difference in determining the extreme mixing event.
To evaluate how an extreme diapycnal mixing event may impact the vertical heat budget on the central shelf of the ESS, the wavelength of surface waves and the ocean heat content are considered. The downward maximum mixing depth caused by wind-induced surface waves is usually consistent with its wavelength (Qiao et al., 2010); therefore, we can infer the maximum mixing depth of surface waves according to its wavelength, λ (meter), which is calculated using equations derived from the dispersion relation of regular waves (Holthuijsen, 2007) as follows:
where d is the water depth in meters, T is the wave period in seconds, and g is the acceleration of gravity (9.8 m s−2). We compute the critical MLD resulting from turbulence for the wave-induced motion following the parameterization of the wave-mixed upper-ocean layer suggested by Babanin (2006),
where ω is the wave frequency, a0 is half of the significant wave height, Recr is the critical Reynolds number (∼2300), υ is the kinematic viscosity of the ocean water (), and g is the acceleration of gravity (9.8 m s−2).
The ocean heat content, Q (Joule), is used to examine to what extent the surface ocean heat is transported to the bottom layer by an extreme diapycnal mixing, which is determined as
where ρ is the average water density (∼1026 kg m−3); Cp is the seawater heat capacity (∼4200 J kg−1 °C−1); θ and θfz are the potential temperature and freezing point (°C) of each layer, respectively; and z1 and z2 are the depth range of each layer. The surface layer is the MLD, while the bottom layer is from the lower boundary of the MLD to the seafloor.
2.4 Days with heavy winds and high waves
Energy induced by heavy winds and high ocean waves is a primary factor that enhances the diapycnal mixing in the upper ocean. We determine the days with heavy winds and high waves following three criteria: (1) the local (in one grid) hourly wind speed should be higher than 13 m s−1, and its cumulative duration within 1 d should be more than 6 h; (2) the grids with wind speeds higher than the criteria should occupy at least 20 % of the total area of the studied region (71.5–74.5° N, 155–174.5° E); (3) for the days with high waves, the hourly significant wave height must be higher than 2.4 m.
3.1 A record deepening of the surface mixed layer in summer
Observations in September 2016 showed that the water column on the ESS shelf has a two-layer structure: the surface mixed layer and the bottom layer separated by the seasonal pycnocline (Fig. 1c and d). Temperatures in the surface mixed layer were between 2–5 °C, and the salinity was lower than 31.0, while the temperatures in the bottom layer dropped below −1 °C and the salinity ranged between 31.0–34.0. The MLD was only 10–20 m on the mid-shelf and about 30 m near the slope. However, observations at LA77-35 showed that the mixed layer deepened to the seafloor, resulting in a uniform water column 45 m thick (Fig. 1c and d). At the same time, the bottom-water temperature increased to about 2 °C, above the freezing point. Because station LA77-35 was far from the influences of Atlantic Water and coastal river plumes, we deduce that the unusual bottom warming at LA77-35 was due to intense diapycnal mixing from the surface layer.
From 9 to 12 September 2016, a synoptic-scale Arctic cyclone moved southward across the ESS shelf (Fig. 1a), with open water about 1100 km long along its path. When its center moved to the mid-shelf on 11 September, the cyclone caused strong winds in the western ESS. Station LA77-35 was right in the center of the heaviest winds, where the observed wind speed exceeded 14 m s−1 on 11 September (Fig. 1b and e). The CTD profile of LA77-35 was obtained on 12 September when the sea conditions calmed down. Hence, the observed ocean state at LA77-35 represented the final influences of the cyclone on the mid-shelf. The extreme deepening of the mixed layer at LA77-35 was driven by the windy weather conditions. The intense diapycnal mixing completely eroded the stratification on the shelf, resulting in a record deepening of the mixed layer in the Pacific sector of the Arctic Ocean during summertime.
3.2 Vertical mixing intensified by the growing waves in open water
The sea level pressure at the center of the cyclone was 1012–1024 hPa (Fig. 2), indicating it was just a moderate cyclone, compared with the minimum observed sea level pressure during two Arctic cyclones in August 2016 (967 hPa) and August 2008 (976 hPa) (Long and Perrie, 2012; Peng et al., 2021). The resulting maximum wind speed was also lower than in the previous two cyclones. However, the deepened mixed layer observed in September 2016 in the ESS reached about 25 m depth, much larger than the 5–10 m deepening reported by the previous studies (Long and Perrie, 2012; Peng et al., 2021). The main difference between the cyclone we experienced during 9–12 September 2016 and the reported ones was that the path of the former was entirely along open waters, allowing wave growth and continuous wind energy input into the ocean.
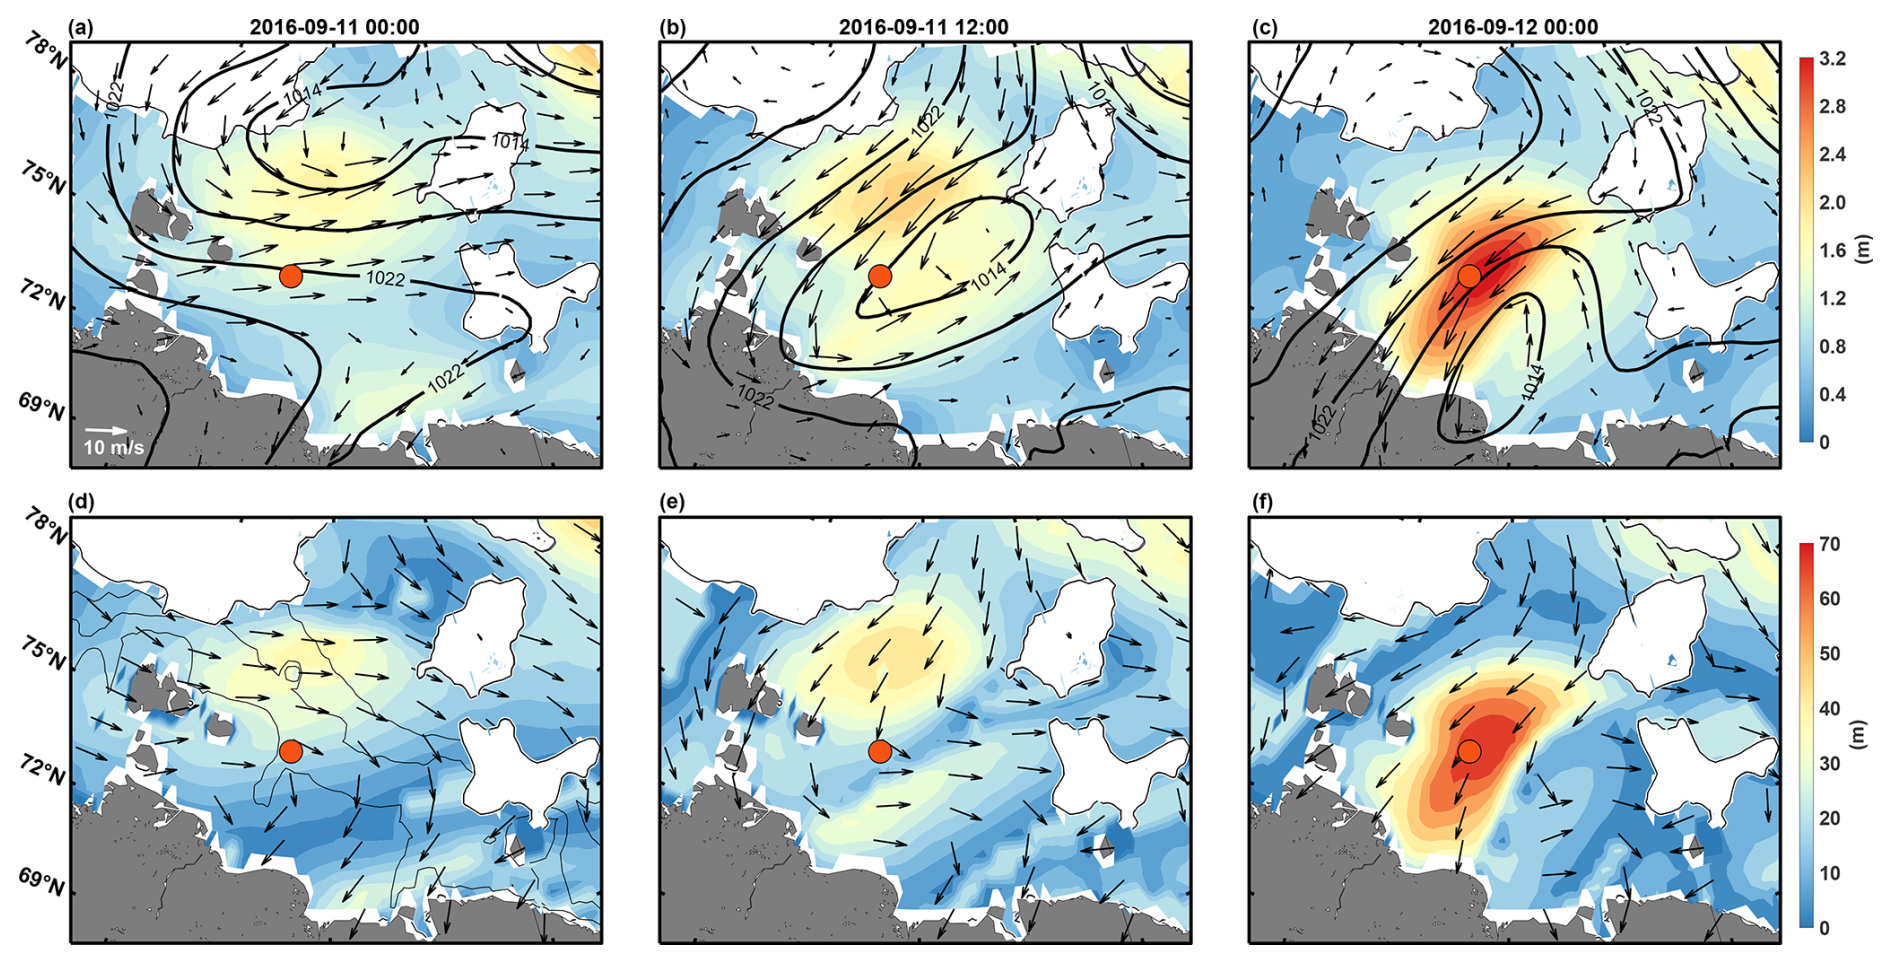
Figure 2Distribution of significant wave height (a–c) and wavelength (d–f) every 12 h during 11–12 September. (a–c) The black contours represent sea level pressure in units of hPa. The arrows represent the 10 m wind field. The white area denotes sea ice extent, and the red asterisk marks the location of station LA-77-35. (d–f) Arrows indicate the wave direction. The thin black lines in panels (d)–(f) indicate isobaths of 30, 50, and 100 m, respectively.
At 00:00 UTC on 11 September, when the cyclone center was still in the Arctic Basin, the significant wave height (using wave height for short in the following text) near the continental slope was about 1.5 m (Fig. 2a). When the cyclone center moved southward onto the outer shelf 0.5 d later, the maximum wave height gradually grew to about 2.0 m. When the cyclone landed on 12 September, nearly all the wave heights on the western ESS shelf were above 2.0 m. The maximum wave height exceeded 3.5 m, and its location was close to station LA77-35 (Fig. 2c).
The turbulent mixing induced by wave-breaking is mainly confined within the near-surface zone with the depth scale of wave heights (Soloviev and Lukas, 2003; Sulisz et al., 2015). To examine whether the wave-induced mixing can reach the seafloor of the mid-shelf, we calculated the wavelength change during the cyclone's passing (Fig. 2d–f). Before 11 September, the wavelength in the mid-shelf region was around 20–30 m. However, after the cyclone passed, the wavelength increased to about 70 m, which was long enough to stir the whole water column with 30–60 m depth by enhanced shearing and wave-breaking. We confirmed this estimation by calculating the MLDcr induced by wave-breaking and wind stress following the parameterization given by Babanin (2006). We found that, when the wind speed reached 14 m s−1 on the western shelf on 12 September, the turbulence process caused by wind and wave-breaking could have deepened the mixed layer to about 42 m (Fig. 1e). This estimation is consistent with the MLD of about 45 m at station LA77-35 (Fig. 1c and d), indicating that the strong wind-driven turbulence (wave-breaking and wind stress) triggered by the cyclone was sufficient to generate strong diapycnal mixing on the shelf and the uniform water column.
3.3 Heat transfer to the bottom of mid-shelf by intensified vertical mixing
Observations showed that the MLD in the ESS in early September was only 15–25 m, and water temperatures in the bottom layer were below −1 °C (Fig. 1c). However, the wind-induced diapycnal mixing at station LA77-35 caused a remarking warming of about 3 °C near the seafloor of the mid-shelf. This intensified downward mixing process transferred about 1.9×10⁸ J m−2 of heat from the surface to the bottom layer, equivalent to a monthly mean heat flux around 73 W m−2, 1 order of magnitude higher than the net solar radiation reaching the bottom during summertime.
During 10–11 September, the SST at station LA77-35 decreased by about 1.2 °C (Fig. 3a). This rapid decrease in temperature was associated with the enhanced diapycnal mixing caused by the cyclone and with the enhanced surface heat flux from the ocean to the atmosphere. According to the ERA5 reanalysis data, the net shortwave radiation decreased to about 40 W m−2 in this region (positive value means heat input to the ocean), and the sensible and latent heat fluxes at station LA77-35 increased to −40 and −50 W m−2, respectively (Fig. 3b). The net surface heat flux was about −73 W m−2, which can result in an SST decrease of about 0.15–0.19 °C within 2 d, assuming an MLD of 15–20 m before the cyclone. The SST at station LA77-35 decreased by more than 1.0 °C. The area around station LA77-35 also experienced the same extent of SST cooling based on the satellite observations, suggesting the similar bottom warming induced by intensified vertical mixing as observed at LA77-35.
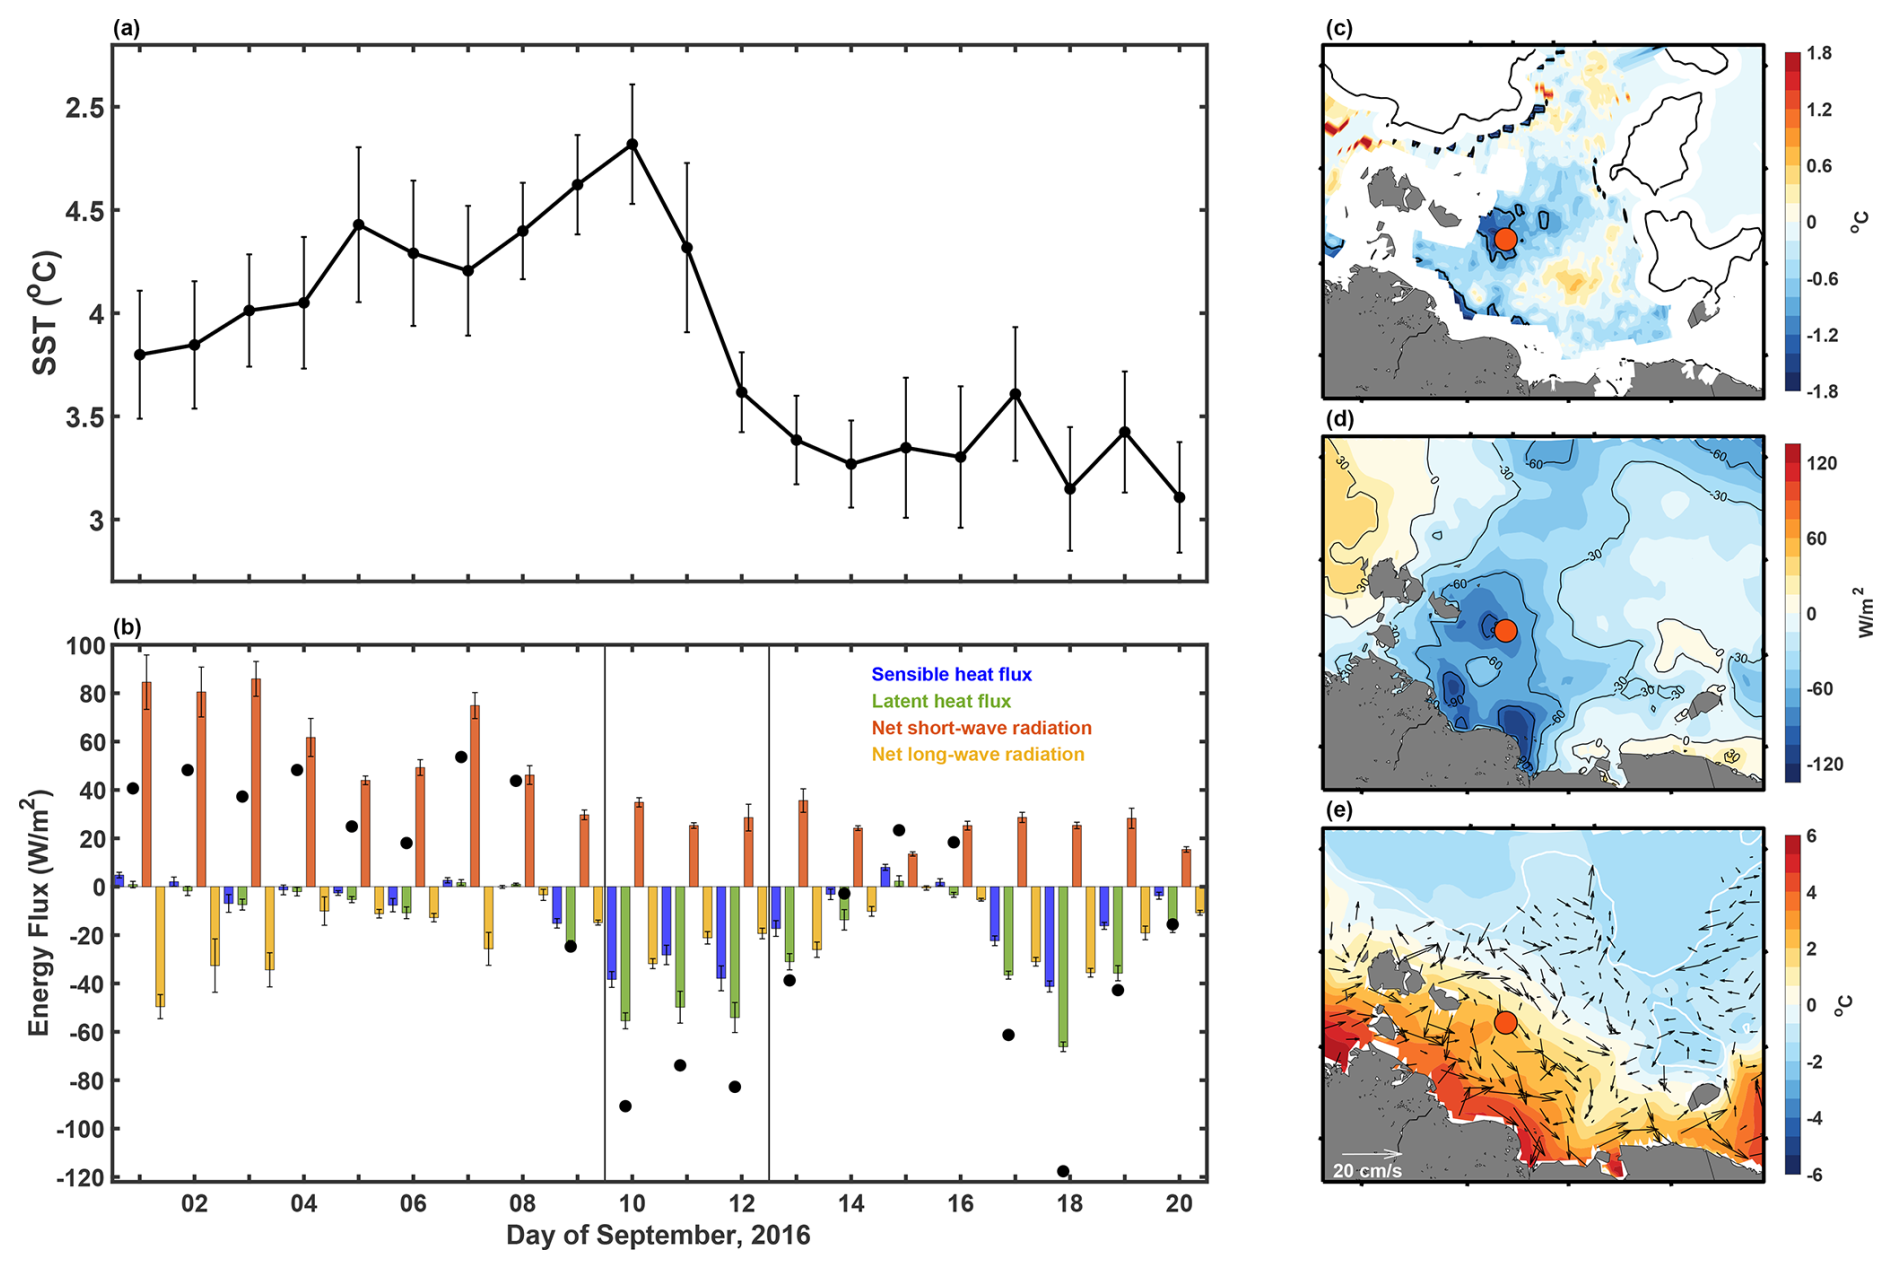
Figure 3Sea surface temperature (SST), air–sea energy flux, and the surface geostrophic current in the ESS. (a) Changes in mean SST in the region around station LA77-35 (74.375–74.875° N, 157.125–157.875° E). (b) Same as panel (a) but for the mean air–sea energy fluxes. Positive values mean heat input into the ocean. Black dots denote the net surface energy flux. (c) Difference in the SST between 10 and 12 September. The red dot marks the location of station LA77-35. (d) Distribution of mean surface energy balance between 10 to 12 September. (e) Same as panel (d) but for the mean surface geostrophic current and SST during the observation period.
Note that the reduction in the SST from 10 to 12 September should be more than 2 °C under such strong diapycnal mixing of about 45 m in depth, but the SST at station LA77-35 only decreased by about 1.2 °C. We infer that the additional heat is from the advection of the warming coastal water in the west of the ESS to the mid-shelf (Fig. 3e). The heat advection by coastal water only explains about 30 %–40 % of the surface and mixed-layer temperature variability: the enhanced downward mixing of the surface warm water still dominates the bottom warming in this area.
3.4 Intensification of the wind-induced mixing on the ESS shelf
We further investigate the long-term trend of wind-induced mixing in the ESS during the recent decade. The key parameters include the sea ice extent, the day with heavy winds and high waves, the MLD, and the bottom-water temperature (Fig. 4). Observational and simulated results indicate an intensification of Arctic cyclone activity over the last 7 decades, especially in the summer season (Akperov et al., 2019; Karwat et al., 2022; Zhang et al., 2023). The summer sea ice extent became lower than 0.5×10⁶ km2 in 2007 and has remained at a similar level since then (Fig. 4a). Simultaneously, the number of days with heavy winds and high waves gradually increased (Fig. 4b). All of the top 5 years with the most prevailing windy processes have occurred in the last decade. In particular, in September 2016 and 2017, heavy winds and high waves prevailed in the ESS for more than 1 week (Fig. 4b). As a result, the mean MLD in September has exhibited a significant deepening trend from about 11 m to nearly 15 m during the last 2 decades (Fig. 4c), and the bottom temperature reached nearly 0°C during 2015 and 2016, indicating an increasing influence of wind-induced synoptic processes on vertical mixing (Fig. 4d). This intensified vertical mixing may result from a synergistic effect of wave-induced mixing (Mellor, 2008; Qiao et al., 2010), wind-induced inertial oscillations (Lenn et al., 2011), the alignment of wind and current directions (Burchard and Rippeth, 2009; Lincoln et al., 2015), or the propagation of shelf waves carrying signals from distant storms (Schulz et al., 2021).
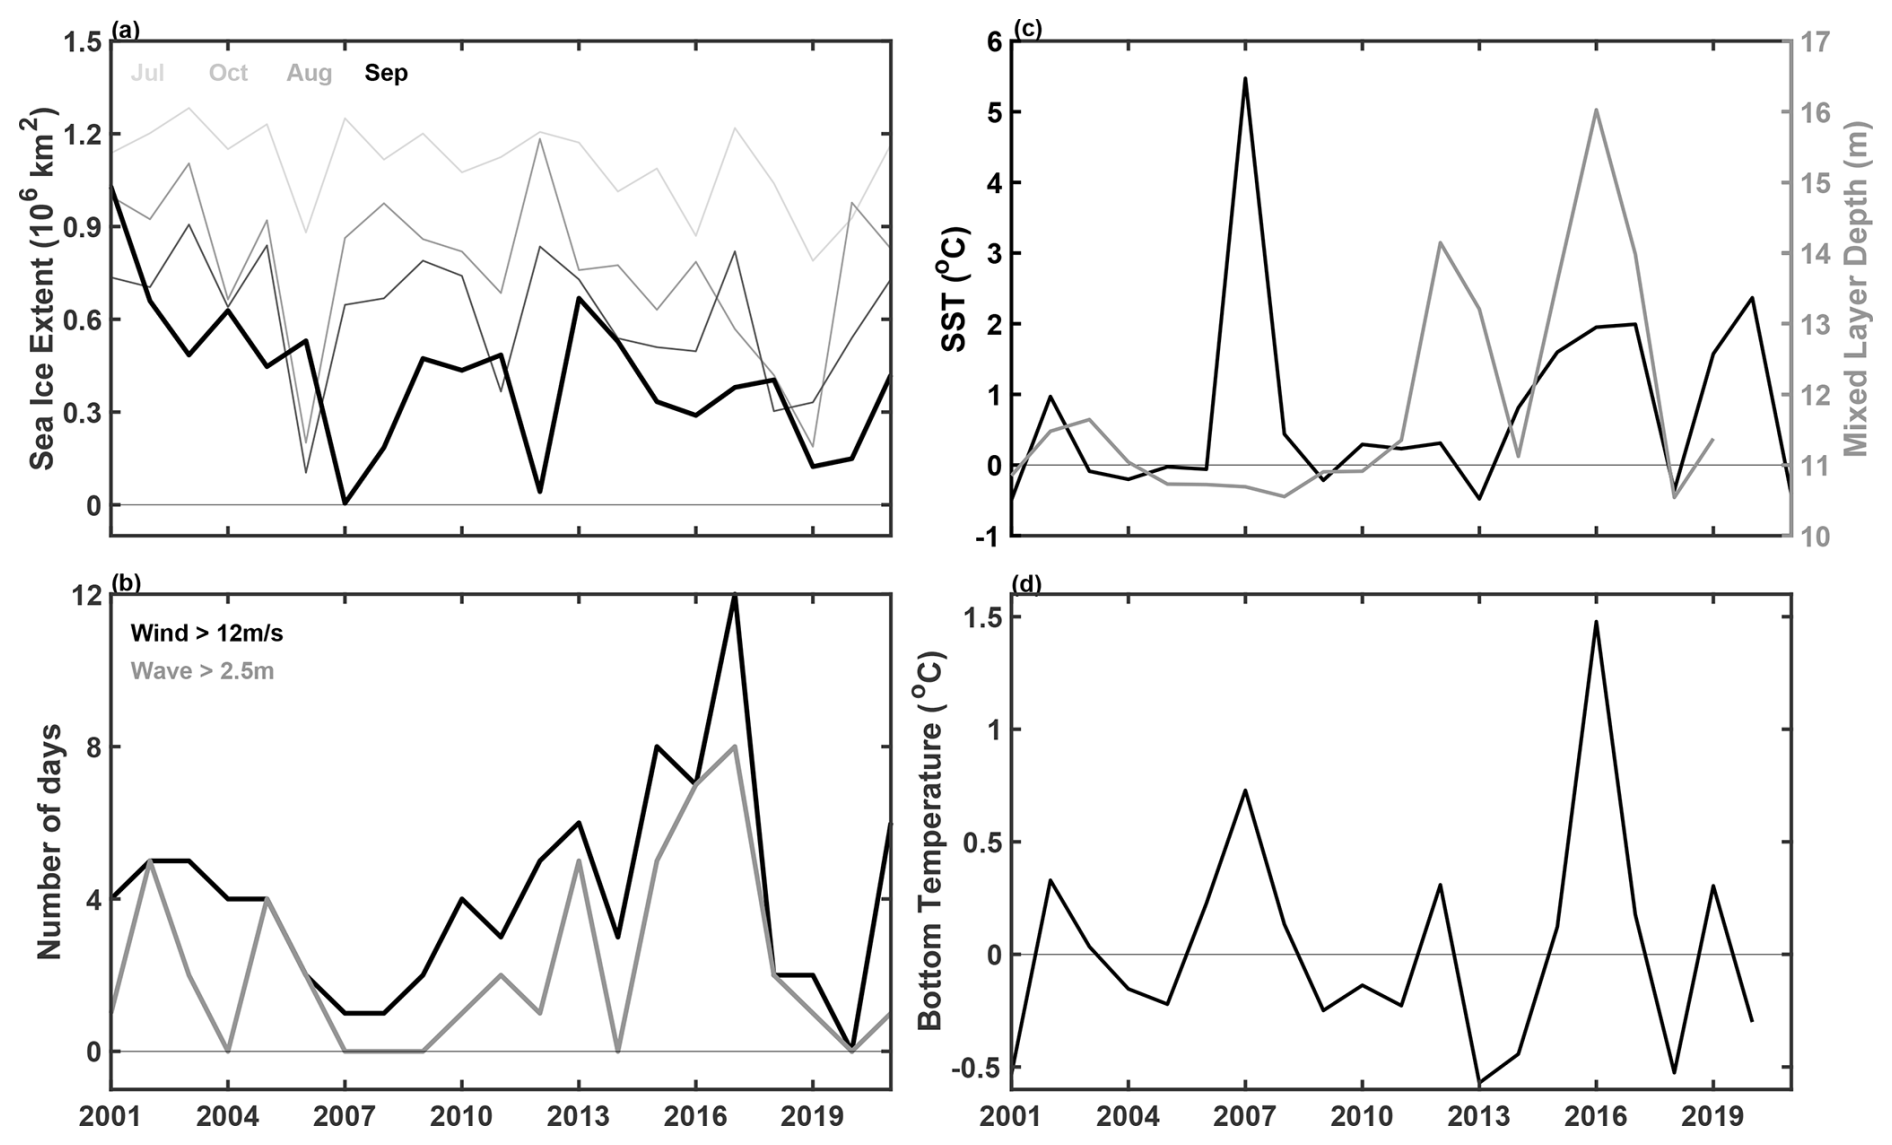
Figure 4Variability in the sea ice extent, number of days with heavy winds and high waves, SST, and bottom-water temperature in the ESS during 2001–2021. (a) Variation in sea ice extent in July, August, September (thick black line), and October 2016. (b) Number of days with heavy winds and high waves in September. (c) The SST and MLD in the ESS in summer. (d) Same as panel (c) but for the bottom-water temperature.
In this study, we report an extreme event with a thickened mixed layer to the seafloor with 25 m depth in the ESS, much deeper than the event reported in previous studies, which deepened the surface mixed layer by 5–10 m (Long and Perrie, 2012; Peng et al., 2021). This recorded deepening of the mixed layer in the Pacific sector results from an Arctic cyclone moving onto the shelf from open waters of nearly 1000 km from north to south. Over such a large open-water area, the wave can grow sufficiently and become strong enough to strengthen the vertical mixing of the mid-shelf ocean. The intensified mixing transports a large amount of heat from the upper layer straight to the seafloor, leading to remarkable warming of about 3 °C in the bottom layer. Our observational study provides an important supplement and extension of previous knowledge of wind-induced bottom-water warming in the Laptev Sea shelf (Hölemann et al., 2011; Janout et al., 2016; Kraineva et al., 2019).
The Arctic has warmed nearly 2–4 times faster than the global average since 1979 (Serreze and Barry, 2011; Rantanen et al., 2022). At the same time, the summer sea ice covering the Arctic shelves also decreased dramatically and has remained at a low level since 2007 (Park et al., 2020; Liu et al., 2021). Lengthening summers and reduced sea ice extent allow more heat into the ocean (Angelopoulos et al., 2020; Dong et al., 2022). With the increasing trends in the open-water area, heavy wind days, and high wave days during summertime since 2012, more vigorous wind-induced mixing and enhanced bottom warming will happen in the ESS. Now the average bottom-water temperature in summer is still below 0 °C. However, with the further reduction in sea ice extent and increasing heat content in the mixed layer in the future, the bottom-water temperature will undoubtedly become warmer than the freezing point, leading to the rapid retreat of bottom permafrost and the release of methane buried in the sediments (Shakhova et al., 2014; James et al., 2016; Sultan et al., 2020; Wild et al., 2022). Quantifying the impact of these processes is beyond the scope of this paper, but it deserves attention in the future.
Observations in the Laptev Sea revealed that the near-bottom warming could remain for at least 2–3 months when the sea ice refreezes again (Janout et al., 2016). This means that the heat stored in the bottom layer during summertime could partly return to the surface layer to melt ice. Unfortunately, the lack of continuous mooring observations prevents us from evaluating how many proportions of heat can re-emerge to melt sea ice in the following winter in the ESS. Analyzing and quantifying the vertical distribution and transport of ocean heat on the Arctic shelves will improve the understanding of the impacts of the Arctic Ocean warming on regional climate changes. To address this question, long-term mooring systems are urgently needed to monitor the ocean–seabed thermal processes in the ESS.
The in situ observation data and detailed introductions are available at https://doi.org/10.5281/zenodo.4507584 (Wang and He, 2021).
ERA5 data are available at the Copernicus Climate Change Service (C3S) Climate Data Store (CDS) (https://doi.org/10.24381/cds.adbb2d47, Hersbach et al., 2023).
Microwave OI SST data are produced by Remote Sensing Systems and sponsored by the National Oceanographic Partnership Program (NOPP) and the NASA Earth Science Physical Oceanography Program (https://www.remss.com/measurements/sea-surface-temperature/, Remote Sensing Systems, 2025).
The Global Ocean Physics Reanalysis product (GLORYS12V1) was obtained from the Global Ocean Physics Reanalysis dataset available from Copernicus Marine Services (https://doi.org/10.48670/moi-00021, Copernicus Marine Service, 2023a). The surface geostrophic current data was obtained from the “Global Ocean Gridded L 4 Sea Surface Heights And Derived Variables Reprocessed 1993 Ongoing” dataset available from Copernicus Marine Services (https://doi.org/10.48670/moi-00148, Copernicus Marine Service, 2023b).
Conceptualization: XW. Methodology: LM. Investigation: XC. Visualization: XW. Funding acquisition: XW, XC, LM. Project administration: XC. Supervision: XC, LM. Writing – original draft: XW. Writing – review and editing: XC, LM.
The contact author has declared that none of the authors has any competing interests.
Publisher's note: Copernicus Publications remains neutral with regard to jurisdictional claims made in the text, published maps, institutional affiliations, or any other geographical representation in this paper. While Copernicus Publications makes every effort to include appropriate place names, the final responsibility lies with the authors.
The authors would like to thank the European Centre for Medium-Range Weather Forecasts for access to the ERA5 reanalysis data, the National Oceanographic Partnership Program (NOPP) and the NASA Earth Science Physical Oceanography Program for access to the optimally interpolated SST data, and the Copernicus Marine Environment Monitoring Service (CMEMS) for access to the Global Ocean Physics Reanalysis product and the surface geostrophic current data.
This research has been supported by the National Key Research and Development Program of China (grant no. 2019YFA0607000) and the National Natural Science Foundation of China (grant nos. 42276248 and 42176235).
This paper was edited by Anne Marie Treguier and reviewed by two anonymous referees.
Akperov, M., Rinke, A., Mokhov, I. I., Semenov, V. A., Parfenova, M. R., Matthes, H., Adakudlu, M., Boberg, F., Christensen, J. H., Dembitskaya, M. A., Dethloff, K., Fettweis, X., Gutjahr, O., Heinemann, G., Koenigk, T., Koldunov, N. V., Laprise, R., Mottram, R., Nikiéma, O., Sein, D., Sobolowski, S., Winger, K., and Zhang, W. X., Future projections of cyclone activity in the Arctic for the 21st century from regional climate models (Arctic–CORDEX), Global Planet. Change, 182, 103005, https://doi.org/10.1016/j.gloplacha.2019.103005, 2019.
Angelopoulos, M., Overduin, P. P., Miesner, F., Grigoriev, M. N., and Vasiliev, A. A.: Recent advances in the study of Arctic submarine permafrost, Permafrost Periglac. Process., 31, 442–453, https://doi.org/10.1002/ppp.2061, 2020.
Babanin, A. V.: On a wave-induced turbulence and a wave-mixed upper ocean layer, Geophys. Res. Lett., 33, L20605, https://doi.org/10.1029/2006GL027308, 2006.
Bauch, D. and Cherniavskaia, E.: Water Mass Classification on a Highly Variable Arctic Shelf Region: Origin of Laptev Sea Water Masses and Implications for the Nutrient Budget, J. Geophys. Res.-Oceans, 123, 1896–1906, https://doi.org/10.1002/2017JC013524, 2018.
Burchard, H. and Rippeth, T. P.: Generation of bulk shear spikes in shallow stratified tidal seas, J. Phys. Oceanogr., 39, 969–985, 2009.
Copernicus Marine Service: Global Ocean Physics Reanalysis, Copernicus Marine Service [data set], https://doi.org/10.48670/moi-00021, 2023a.
Copernicus Marine Service: Global Ocean Gridded L 4 Sea Surface Heights And Derived Variables Reprocessed 1993 Ongoing, Copernicus Marine Service [data set], https://doi.org/10.48670/moi-00148, 2023b.
Dmitrenko, I. A., Kirillov, S. A., Tremblay, L. B., Kassens, H., Anisimov, O. A., Lavrov, S. A., Razumov, S. O., and Grigoriev, M. N.: Recent changes in shelf hydrography in the Siberian Arctic: Potential for subsea permafrost instability, J. Geophys. Res.-Oceans, 116, C10027, https://doi.org/10.1029/2011JC007218, 2011.
Dong, J., Shi, X., Gong, X., Astakhov, A. S., Hu, L., Liu, X., Yang, G., Wang, Y., Vasilenko, Y., Qiao, S., Bosin, A., and Lohmann, G.: Enhanced Arctic sea ice melting controlled by larger heat discharge of mid-Holocene rivers, Nat. Commun., 13, 5368, https://doi.org/10.1038/s41467-022-33106-1, 2022.
El Bani Altuna, N., Rasmussen, T. L., Ezat, M. M., Vadakkepuliyambatta, S., Groeneveld, J., and Greaves, M.: Deglacial bottom water warming intensified Arctic methane seepage in the NW Barents Sea, Commun. Earth Environ., 2, 188, https://doi.org/10.1038/s43247-021-00264-x, 2021.
Ferré, B., Jansson, P. G., Moser, M., Serov, P., Portnov, A., Graves, C. A., Panieri, G., Gründger, F., Berndt, C., Lehmann, M. F., and Niemann, H.: Reduced methane seepage from Arctic sediments during cold bottom-water conditions, Nat. Geosci., 13, 144–148, https://doi.org/10.1038/s41561-019-0515-3, 2020.
Hall, S. B., Subrahmanyam, B., Nyadjro, E. S., and Samuelsen, A.: Surface freshwater fluxes in the arctic and subarctic seas during contrasting years of high and low summer sea ice extent, Remote Sens., 13, 1570, https://doi.org/10.3390/rs13081570, 2021.
Hersbach, H., Bell, B., Berrisford, P., Hirahara, S., Horányi, A., Muñoz-Sabater, J., Nicolas, J., Peubey, C., Radu, R., Schepers, D., Simmons, A., Soci, C., Abdalla, S., Abellan, X., Balsamo, G., Bechtold, P., Biavati, G., Bidlot, J., Bonavita, M., De Chiara, G., Dahlgren, P., Dee, D., Diamantakis, M., Dragani, R., Flemming, J., Forbes, R., Fuentes, M., Geer, A., Haimberger, L., Healy, S., Hogan, R. J., Hólm, E., Janisková, M., Keeley, S., Laloyaux, P., Lopez, P., Lupu, C., Radnoti, G., de Rosnay, P., Rozum, I., Vamborg, F., Villaume, S., and Thépaut, J. The ERA5 global reanalysis, Q. J. Roy. Meteorol. Soc., 146, 1999–2049, https://doi.org/10.1002/qj.3803, 2020.
Hersbach, H., Bell, B., Berrisford, P., Biavati, G., Horányi, A., Muñoz Sabater, J., Nicolas, J., Peubey, C., Radu, R., Rozum, I., Schepers, D., Simmons, A., Soci, C., Dee, D., and Thépaut, J.-N.: ERA5 hourly data on single levels from 1940 to present, Copernicus Climate Change Service (C3S) Climate Data Store (CDS) [data set], https://doi.org/10.24381/cds.adbb2d47, 2023.
Hölemann, J. A., Kirillov, S., Klagge, T., Novikhin, A., Kassens, H., and Timokhov, L.: Near-bottom water warming in the Laptev Sea in response to atmospheric and sea-ice conditions in 2007, Polar Res., 30, 6425, https://doi.org/10.3402/polar.v30i0.6425, 2011.
Holthuijsen, L. H.: Waves in oceanic and coastal waters, Cambridge University Press, https://doi.org/10.1017/CBO9780511618536, 2007.
Hudson, P. A., Martin, A. C. H., Josey, S. A., Marzocchi, A., and Angeloudis, A.: Drivers of Laptev Sea interannual variability in salinity and temperature, Ocean Sci., 20, 341–367, https://doi.org/10.5194/os-20-341-2024, 2024.
Ivanov, V. V.,Danshina, A. V.,Smirnov, A. V., and Filchuk, K. V.: Transformation of the atlantic water between svalbard and Franz Joseph Land in the late winter 2018–2019, Deep-Sea Res. Pt. I, 206, 104280, https://doi.org/10.1016/j.dsr.2024.104280, 2024.
James, R. H., Bousquet, P., Bussmann, I., Haeckel, M., Kipfer, R., Leifer, I., Niemann, H., Ostrovsky, I., Piskozub, J., Rehder, G., Treude, T., Vielstädte, L., and Greinert, J.: Effects of climate change on methane emissions from seafloor sediments in the Arctic Ocean: A review, Limnol. Oceanogr., 61, S283–S299, https://doi.org/10.1002/lno.10307, 2016.
Janout, M., Hölemann, J., Juhls, B., Krumpen, T., Rabe, B., Bauch, D., Wegner, C., Kassens, H., and Timokhov, L.: Episodic warming of near-bottom waters under the Arctic , https://doi.org/10.1002/2015GL066565, 2016.
Janout, M. A. and Lenn, Y.: Semidiurnal Tides on the Laptev Sea Shelf with Implications for Shear and Vertical Mixing, J. Phys. Oceanogr., 44, 202–219, https://doi.org/10.1175/JPO-D-12-0240.1, 2014.
Karwat, A., Franzke, C. L. E., and Blender, R.: Long-term trends of Northern Hemispheric winter cyclones in the extended ERA5 reanalysis, J. Geophys. Res.-Atmos., 127, e2022JD036952, https://doi.org/10.1029/2022JD036952, 2022.
Kraineva, M., Golubeva, E., and Platov, G.: Simulation of the near-bottom water warming in the Laptev Sea in 2007–2008, Bull. Nov. Comp. Center Num. Model. Atmos., 17, 21–30, 2019.
Lellouche, J.-M., Greiner, E., Romain, B.-B., Gilles, G., Angélique, M., Marie, D., Clément, B., Mathieu, H., Olivier, L. G., Charly, R., Tony, C., Charles-Emmanuel, T., Florent, G., Giovanni, R., Mounir, B., Yann, D., and Pierre-Yves, L. T.: The Copernicus Global 1/12° Oceanic and Sea Ice GLORYS12 Reanalysis, Front. Earth Sci., 9, 698876, https://doi.org/10.3389/feart.2021.698876, 2021.
Lenn, Y.-D., Rippeth, T. P., Old, C. P., Bacon, S., Polyakov, I., Ivanov, V., and Hölemann, J.: Intermittent intense turbulent mixing under ice in the Laptev Sea continental shelf, J. Phys. Oceanogr., 41, 531–547, 2011.
Lincoln, B. J., Rippeth, T. P., and Simpson, J. H.: Surface mixed layer deepening through wind shear alignment in a seasonally stratified shallow sea, J. Geophys. Res., 121, 6021–6034, https://doi.org/10.1002/2015JC011382, 2015.
Liu, Z., Risi, C., Codron, F., He, X., Poulsen, C. J., Wei, Z., Chen, D., Li, S., and Bowen, G. J.: Acceleration of western Arctic sea ice loss linked to the Pacific North American pattern, Nat. Commun., 12, 1519, https://doi.org/10.1038/s41467-021-21830-z, 2021.
Long, Z. and Perrie, W.: Air-sea interactions during an Arctic storm, J. Geophys. Res.-Atmos., 117, D15103, https://doi.org/10.1029/2011JD016985, 2012.
Mellor, G. L.: The three dimensional, current and surface wave equations: a revision, J. Phys. Oceanogr., 33, 1978–1989, 2008.
Park, H., Watanabe, E., Kim, Y., Polyakov, I., Oshima, K., Zhang, X., Kimball, J. S., and Yang, D.: Increasing riverine heat influx triggers Arctic sea ice decline and oceanic and atmospheric warming, Sci. Adv., 6, c4699, https://doi.org/10.1126/sciadv.abc4699, 2020.
Peng, L., Zhang, X., Kim, J., Cho, K., Kim, B., Wang, Z., and Tang, H.: Role of Intense Arctic Storm in Accelerating Summer Sea Ice Melt: An In Situ Observational Study, Geophys. Res. Lett., 48, e2021GL092714, https://doi.org/10.1029/2021GL092714, 2021.
Peralta-Ferriz, C. and Woodgate, R. A.: Seasonal and interannual variability of pan-Arctic surface mixed layer properties from 1979 to 2012 from hydrographic data, and the dominance of stratification for multiyear mixed layer depth shoaling, Prog. Oceanogr., 134, 19–53, https://doi.org/10.1016/j.pocean.2014.12.005, 2015.
Qiao, F., Yuan, Y., Ezer, T., Xia, C., Yang, Y., Lü, X., and Song, Z.: A three-dimensional surface wave–ocean circulation coupled model and its initial testing, Ocean Dynam., 60, 1339–1355, 2010.
Rantanen, M., Karpechko, A. Y., Lipponen, A., Nordling, K., Hyvärinen, O., Ruosteenoja, K., Vihma, T., and Laaksonen, A.: The Arctic has warmed nearly four times faster than the globe since 1979, Commun. Earth Environ., 3, 168, https://doi.org/10.1038/s43247-022-00498-3, 2022.
Remote Sensing Systems: Sea Surface Temperature, https://www.remss.com/measurements/sea-surface-temperature/ (last access: 10 March 2025), 2025.
Schulz, K., Büttner, S., Rogge, A., Janout, M., Hölemann, J., and Rippeth, T. P.: Turbulent mixing and the formation of an intermediate nepheloid layer above the Siberian continental shelf break, Geophys. Res. Lett., 48, e2021GL09298, https://doi.org/10.1029/2021GL092988, 2021.
Serreze, M. C. and Barry, R. G.: Processes and impacts of Arctic amplification: A research synthesis, Global Planet. Change, 77, 85–96, https://doi.org/10.1016/j.gloplacha.2011.03.004, 2011.
Shakhova, N. and Semiletov, I.: Methane release and coastal environment in the East Siberian Arctic shelf, J. Mar. Syst., 66, 227–243, 2007.
Shakhova, N., Semiletov, I., Leifer, I., Sergienko, V., Salyuk, A., Kosmach, D., Chernykh, D., Stubbs, C., Nicolsky, D., Tumskoy, V., and Gustafsson, Ö.: Ebullition and storm-induced methane release from the East Siberian Arctic Shelf, Nat. Geosci., 7, 64–70, https://doi.org/10.1038/ngeo2007, 2014.
Shakhova, N., Semiletov, I., and Chuvilin, E.: Understanding the Permafrost–Hydrate System and Associated Methane Releases in the East Siberian Arctic Shelf, Geosciences, 9, 251, https://doi.org/10.3390/geosciences9060251, 2019.
Soloviev, A. and Lukas, R.: Observation of wave-enhanced turbulence in the near-surface layer of the ocean during TOGA COARE, Deep-Sea Res. Pt. I, 50, 371–395, https://doi.org/10.1016/S0967-0637(03)00004-9, 2003.
Sulisz, W., Paprota, M., and Wang, J.: Theoretical and Experimental Investigations of Wave-Induced Vertical Mixing, Math. Probl. Eng., 2015, 950849, https://doi.org/10.1155/2015/950849, 2015.
Sultan, N., Plaza-Faverola, A., Vadakkepuliyambatta, S., Buenz, S., and Knies, J.: Impact of tides and sea-level on deep-sea Arctic methane emissions, Nat. Commun., 11, 5087, https://doi.org/10.1038/s41467-020-18899-3, 2020.
Timmermans, M., Cole, S., and Toole, J.: Horizontal Density Structure and Restratification of the Arctic Ocean Surface Layer, J. Phys. Oceanogr., 42, 659–668, https://doi.org/10.1175/JPO-D-11-0125.1, 2012.
Wang, X. and He, Y.: Oceanographic data collected within the Pacific Arctic Ocean by the Russia and China cruises in the summer of 2016 [Data set], Zenodom [data set], https://doi.org/10.5281/zenodo.4507584, 2021.
Wang, X., Zhao, J., Lobanov, V. B., Kaplunenko, D., Rudykh, Y. N., He, Y., and Chen, X.: Distribution and Transport of Water Masses in the East Siberian Sea and Their Impacts on the Arctic Halocline, J. Geophys. Res.-Oceans, 126, e2020JC016523, https://doi.org/10.1029/2020JC016523, 2021.
Wild, B., Shakhova, N., Dudarev, O., Ruban, A., Kosmach, D., Tumskoy, V., Tesi, T., Grimm, H., Nybom, I., Matsubara, F., Alexanderson, H., Jakobsson, M., Mazurov, A., Semiletov, I., and Gustafsson, Ö.: Organic matter composition and greenhouse gas production of thawing subsea permafrost in the Laptev Sea, Nat. Commun., 13, 5057, https://doi.org/10.1038/s41467-022-32696-0, 2022.
Zhang, X. D., Tang, H., Zhang, J., Walsh, J. E., Roesler, E. L., Hillman, B., Ballinger, T. J., and Weijer, W.: Arctic cyclones have become more intense and longer-lived over the past seven decades, Commun. Earth Environ., 4, 348, https://doi.org/10.1038/s43247-023-01003-0, 2023.
The East Siberian Sea has nearly 80 % of the subsea permafrost worldwide. The cold layer with a temperature around −1.5 ºC above the seafloor prevents heat transporting from above to melt permafrost and release methane from sediments. However, we observed a warming trend at the seafloor caused by wave-induced vertical mixing in the shelf. The intensified mixing can transport enormous heat downward, leading to warming of more than 3 °C at the bottom, putting the subsea permafrost at high risk.
The East Siberian Sea has nearly 80 % of the subsea permafrost worldwide. The cold layer with a...