the Creative Commons Attribution 4.0 License.
the Creative Commons Attribution 4.0 License.
 | 07 Mar 2025
Technical note: Large offsets between different datasets of seawater isotopic composition – an illustration of the need to reinforce intercalibration efforts
Gilles Reverdin
Claire Waelbroeck
Antje H. L. Voelker
Hanno Meyer
We illustrate offsets in surface seawater isotopic composition between recent public datasets from the Atlantic Ocean and the subtropical southeastern Indian Ocean. The observed offsets between datasets often exceed 0.10 ‰ in δ18O and 0.50 ‰ in δ2H. They might in part originate from different sampling of seasonal, interannual, or spatial variability. However, they likely mostly originate from different instrumentations and protocols used to measure the water samples. Estimation of the systematic offsets is required before merging the different datasets in order to investigate the spatiotemporal variability of isotopic composition in the world ocean surface waters. This highlights the need to actively share seawater isotopic composition samples dedicated to specific intercomparison of data produced in different laboratories and to promote best practices, a task to be addressed by the new Scientific Committee of Oceanic Research (SCOR) working group 171.
- Article
(646 KB) - Full-text XML
- BibTeX
- EndNote


Seawater isotopic composition ( and ratios expressed as δ18O and δ2H in ‰ on the Vienna Standard Mean Ocean Water (VSMOW) and Standard Light Antarctic Precipitation (SLAP) scale) is classified as an essential ocean variable and essential climate variable (EOV, ECV) in international programs such as GEOTRACES and GO-SHIP. Stable seawater isotopes (δ18O, δ2H) are used to trace sources of fresh water (precipitation, evaporation, runoff, melting glaciers, sea ice formation and melting), both at the ocean surface and in the ocean interior (Schmidt et al., 2007; Hilaire-Marcel et al., 2021). Except for fractionation during phase changes, the water isotopic composition is nearly conservative in the ocean.
A major emphasis is on high-latitude oceanography. There, continental (or iceberg) glacial melt, formation or melt of sea ice, and high-latitude river inputs (for the Arctic) leave imprints on the surface ocean isotopic composition, as well as below the surface down to 800 m close to ice shelves in the Southern Ocean (Randall-Goodwin et al., 2015; Aoki et al., 2017; Biddle et al., 2019, Hennig et al., 2024). In contrast, few studies have been performed on the isotopic signature in the deep ocean (e.g., Prasanna et al., 2015; Voelker et al., 2015). Seawater isotopes in the upper ocean at low latitudes are often vital for paleoclimatic studies, as they are needed to calibrate proxies of past ocean variability in marine carbonate records such as corals and foraminifera (e.g., PAGES CoralHydro2k working group; Konecky et al., 2020). Seawater isotopes are also important tracers in the coastal ocean, with emphasis on upwelling (Conroy et al., 2014, 2017; Kubota et al., 2022; Lao et al., 2022) and river discharges (e.g., Amazon) (Karr and Showers, 2002). Surface ocean seawater isotopes are also used to characterize evaporation rates and air–sea interactions (Benetti et al., 2017a).
The isotopic signatures of these different processes are evolving in our warming world, which will imprint on the seawater isotopic composition (Oppo et al., 2007). Additionally, seawater isotope data provide model boundary conditions and allow the assessment of model performance in isotope-enabled Earth system models (e.g., Schmidt et al., 2007; Brady et al., 2019; Cauquoin et al., 2019), thereby improving climate model projections of the future.
Stable seawater isotope data have thus been massively produced in the last decades by a variety of methods. For example, most data compiled in the GISS Global Seawater Oxygen-18 Database V1.21 for stable seawater isotopes (LeGrande and Schmidt, 2006) originate from isotope ratio mass spectrometry (IRMS). They were mostly measured in earlier decades by dual-inlet technology (highest precision), whereas, more recently, the continuous-flow method (lower precision) has become widespread for seawater isotope analysis. In the last decade, cavity ring-down spectroscopy (CRDS) turned into another commonly used method as it allows parallel measurement of δ18O and δ2H but often with lower precision, at least early on (e.g., Voelker et al., 2015).
Reverdin et al. (2022) recently compiled a mix of data produced by IRMS and CRDS at LOCEAN (https://www.seanoe.org/data/00600/71186/, last access: December 2024). As CRDS and other laser techniques (Glaubke et al., 2024; hereafter GWS2024) have become more prevalent recently, they contribute significantly to the new data produced and thus also to the soon to be released CoralHydro2k seawater database for δ18O (δ2H) with a focus on the tropics (35° N–35° S) (Atwood et al., 2024).
There are potential differences between the data produced by the two methods. Typically, CO2–water or H2–water equilibration was used for IRMS measurements and yields measurements of the activity of water, which decreases with increasing salinity. Furthermore, concentrations of divalent cations like are responsible for slight changes in fractionation factors. On the other hand, laser methods such as CRDS evaporate the entire sample. If the samples have not been distilled beforehand, there is an issue of salt deposition and of resulting absorption or desorption of water with fractionation effects. In the LOCEAN database (Reverdin et al., 2022), an attempt was made to adjust the data based on the analysis of Benetti et al. (2017b). This was also adopted by at least one other group (Haumann et al., 2019), but overall, there is the possibility of an offset of these data with respect to the ones of other groups using CRDS. However, it should be noted that some studies reporting unadjusted δ18O measurements from CRDS and IRMS techniques with CO2–water equilibration provided data that were undistinguishable within instrumental precision (Walker et al., 2016; Hennig et al., 2024).
It is actually quite common when using water isotope data in studies involving more than one dataset to first evaluate whether there are possible offsets. Intercomparison with earlier data or reference materials was a prerequisite for GEOTRACES sampling campaigns, although for the water isotopes this was, unfortunately, seldom followed (e.g., Voelker et al., 2015). These intercomparisons often outline systematic differences which could result from the issue outlined above or from other issues, such as uncertainties in reference materials used, analysis protocols, or isotopic changes in the samples during their handling and storage (Benetti et al., 2017a; Akhoudas et al., 2021; Hennig et al., 2024). In other cases, this was not done, either because the data stood by themselves (Bonne et al., 2019, for δ18O and δ2H data) or there were no comparison data available in the same region (GWS2024 for δ18O data). The possible offsets can, however, become an issue when these data are placed in a larger context. For example, GWS2024 identify a large difference in the S–δ18O relationship in the subtropical Indian Ocean between their data in the southeastern part and other data in the southwestern Indian Ocean. They also discuss and question differences in the deep water mass isotopic values between separate datasets, but as these might also be explained by large uncertainties in these data, we will not address them further.
Using these two examples (Bonne et al., 2019; GWS 2024), the aim of this note is to point out the interest when producing a new dataset of exchanging collected samples to carry a direct comparison or, if this was not done, to compare the data with other published data and evaluate potential systematic differences.
For identifying possible offsets, we consider surface ocean subsets of the LOCEAN database in specific regions for roughly the same years as the other data collected. The data extracted are from the same regions as in the datasets of the two studies and are gathered in S–δ18O space as well as in S–δ2H space (only presented for the Bonne et al., 2019, dataset), where S is reported as practical salinity with the practical salinity scale of 1978. The assumption made here as in many papers is that the S–δ18O relationship holds on fairly large scales in the surface layer (for the eastern subtropical North Atlantic, see, for example, the discussion in Voelker et al., 2015, and in Benetti et al., 2017a). Obviously, this has limitations, such as in areas influenced by more than one water mass or by multiple freshwater end-members (meteoric, continental runoff, sea ice melt or formation, evaporation).
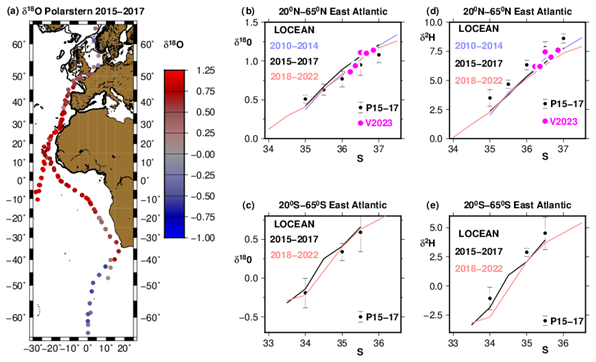
Figure 1Comparison of the LOCEAN and Bonne et al. (2019) datasets. (a) Map of RV Polarstern dataset points east of 30° W in the eastern Atlantic Ocean. (b–e) Water isotope–S scatter diagrams averaged as a function of salinity in 0.5 practical salinity bins (b and c for δ18O; d and e for δ2H): top for the Northern Hemisphere and bottom for the Southern Hemisphere, east of 30° W and outside of 20° N, 20° S. The black dots are the binned averages of the Bonne et al. (2019) RV Polarstern data in 2015–2017 (after adjustment of +0.25 ‰ to δ18O) (P15–17), with the root mean square of the variance reported as error bars. Five individual surface points from Voelker (2017) (V2023) are also plotted (magenta dots). The colored lines represent average relationships of water isotopes in the LOCEAN database in the same regions as a function of practical salinity for three different period ranges.
2.1 Daily surface data collected from RV Polarstern
The surface seawater samples originated from daily collection during 2 years on board RV Polarstern in 2015–2017 (Bonne et al., 2019). There is no salinity provided with the data, and here we chose to associate them with the simultaneously collected thermosalinograph (TSG) data collected on board the RV Polarstern and available from PANGAEA (for each cruise, an indexed file with a title starting with “Continuous thermosalinograph oceanography along Polarstern” is included in PANGAEA: for example, TSG data for the first cruise (PS90) associated with the isotopic seawater data are found at https://doi.org/10.1594/PANGAEA.858885). The water samples were not collected from the same water line and pumping depth as the TSG data, which can result in differences. This is, however, likely to be small in most circumstances away from large freshwater input at the sea surface, such as from melting sea ice, intense rainfall, and river estuaries (Boutin et al., 2016). We also applied an adjustment of +0.25 ‰ to the δ18O data of Bonne et al. (2019) based on post-analysis identification of a bias in an internal reference material.
We then estimate averages of all the data as a function of salinity in two domains extending poleward of the subtropical salinity maximum toward the higher latitudes in the eastern part of the Atlantic Ocean (thus, 20 to 65° N and the same in the Southern Hemisphere). This is done by sorting out the data by salinity classes of 0.5. The LOCEAN data until 2016 in the North Atlantic and tropical Atlantic were presented by Benetti et al. (2017a), showing the tightness of the S–δ18O and S–δ2H relationships in vast domains of the eastern Atlantic. In the North Atlantic, LOCEAN data have been continuously collected since 2011 and south of 10° S in the eastern Atlantic mostly since 2017.
The average relationships found in the LOCEAN dataset for three periods overlay well, in particular in the Northern Hemisphere. Uncertainties in individual curves (not shown) are estimated based on the scatter of individual data in each salinity bin. They are typically on the order of 0.01–0.02 (0.05–0.10) ‰ for δ18O (δ2H) in the Northern Hemisphere (top panel, Fig. 1) and a little larger for the less sampled Southern Hemisphere curves in 2015–2017. Sampling is usually also insufficient at the low end of the salinity range to reliably estimate an uncertainty. Thus, these different curves nearly overlay within the sampling uncertainty. Five surface samples that were collected in the northeast Atlantic during the same years within the same salinity range (Voelker, 2017) also fit well on the North Atlantic curves. The adjusted δ18O data from Bonne et al. (2019) are slightly shifted downward with respect to the curves (Fig. 1b and c), with the plotted standard deviation of individual data around the average not overlapping the LOCEAN data average curves in most cases for the same years (2015–2017). The situation is the opposite for the salinity bin with a value of 35 in the Northern Hemisphere, with the adjusted δ18O data from Bonne et al. (2019) being above the three LOCEAN average curves, which might be due to samples collected uniquely in the English Channel and North Sea by RV Polarstern in this salinity range, whereas sampling is more geographically spread in the LOCEAN database.
Altogether, the average δ18O offset is small, with the LOCEAN data being higher by 0.02 ± 0.01 ‰ than the δ18O from Bonne et al. (2019), which is not significantly different from 0 based on the interannual differences witnessed in the LOCEAN curves and the scatter and uncertainty in the RV Polarstern data. A systematic difference is, however, found for δ2H, with LOCEAN data being lower than δ2H from Bonne et al. (2019) by 0.99 ± 0.07 ‰ (Fig. 1d and e).
2.2 Southern subtropical Indian Ocean
GWS2024 describe a synthesis of water isotope data in the southern Indian Ocean combining their data collected in 2018 in the southeastern Indian Ocean (CROCCA-2S) with earlier data in the southwestern Indian Ocean, in particular from LOCEAN, as well as data from the southern Australian shelf collected mostly in 2010 (Richardson et al., 2019) and in the equatorial Indian Ocean (Kim et al., 2021). In the most recent version of the LOCEAN dataset, in addition to data included by GWS2024 and collected mostly west of 80° E, there are two transects with surface data through the southeastern Indian Ocean, one collected in February 2017 and the other in March 2024 (thus in middle to late austral summer). These transects cross the region covered by the CROCCA-2S dataset, although not close to western Australia, as well as the area of the Richardson et al. (2019) dataset south of Australia. The LOCEAN dataset also contains surface data south of Tasmania (in 2017, as well as in 2020 to 2024). All these data correspond to samples analyzed on a CRDS Picarro L2130 at LOCEAN and the protocols discussed by Reverdin et al. (2022). The bottles in which the samples were stored were the same ones for most of the samples, and time between collection and analysis varied but was mostly on the order of 6 months or less. Thus, this is a homogeneously produced set of data for the years 2016–2024, which spatially and temporally overlaps with the data used by GWS2024 collected south of Australia and in the southeastern Indian Ocean (Fig. 2).
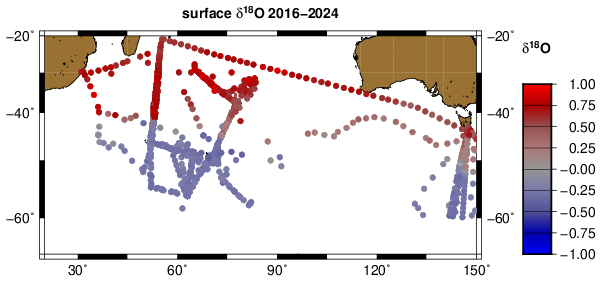
Figure 2Map of δ18O surface data in the LOCEAN archive for 2016–2024, north of 60° S. All data are associated with S and δ2H measurements.
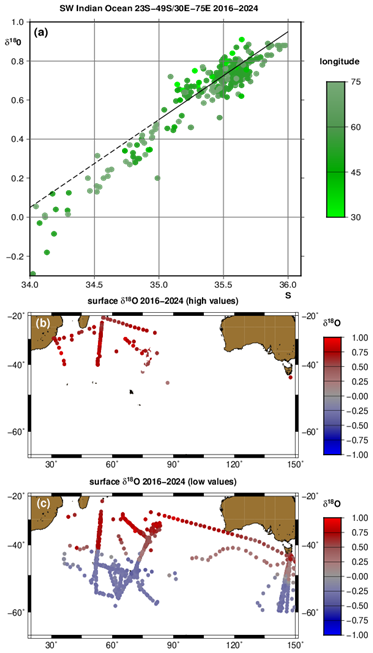
Figure 3(a) S–δ18O scatter diagram of 0–30 m LOCEAN data within the southwestern region (23–49° S, 30–75° E) colored as a function of longitude, with the regression line (black line) of the data in S–δ18O space for the 35–36 range in practical salinity. The spatial distribution of the LOCEAN data in the whole Indian Ocean north of 60° S is presented with higher and lower δ18O relative to the regression line in panels (b) and (c), respectively.
The LOCEAN data distribution plotted in the S–δ18O space presents a wide δ18O range at a given salinity in the southwestern Indian Ocean (Fig. 3a) for S between 35 and 36. For this range, which covers a large part of the surface water of the southwestern Indian Ocean's subtropical gyre, we establish a regression line for the LOCEAN δ18O as a function of S, which can be seen as a mixing line. Above this line, there are no data points for lower S (Fig. 3a), with data at higher S found north of 28° S as well as in the far southwestern Indian Ocean, but with some remnants found all the way to the core of the subtropical gyre near 35° S, 75° E (Fig. 3b). Data below the regression line contain most of the data east of 60° E for latitudes south of 28° S and connect the salinity maximum region with the lower salinity south of the subtropical front and down to the region south of the polar front (Fig. 3c). These subtropical lower isotopic values in S–δ18O space, which already appear in part of the repeated (1998–2024) French OISO cruise data at 50° E, dominate east of 60° E.
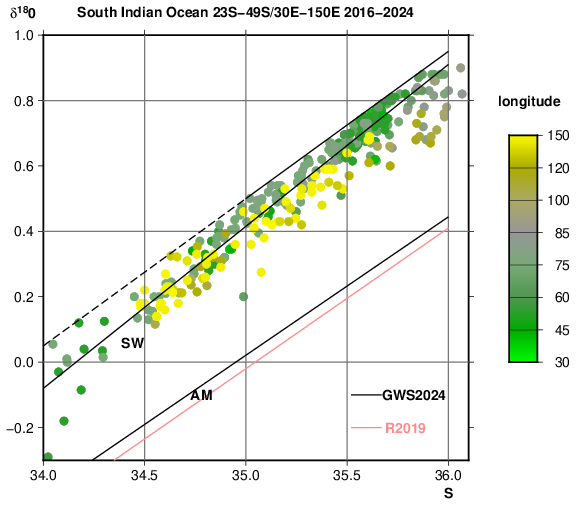
Figure 4S–δ18O scatter plot of 0–30 m LOCEAN Indian Ocean data as shown in Fig. 3c, color-coded as a function of longitude, below the partially stippled regression line for the SW Indian Ocean (reproduced from Fig. 3a). The two black lines correspond to the two linear relationships (GWS2024) for the 0–100 m layer between 23 and 49° S for the southwest Indian Ocean (SW) and for the Australian margin south of Australia (AM) (we use the original relation of δ18O = 0.4231 × S − 14.7876, instead of the rounded-up relation reported in the paper; Ryan H. Glaubke, personal communication, 2024), and the pink line is the earlier linear relationship for the 0–600 m layer along the Australian margin by Richardson et al. (2019) (R2019).
We will now focus on the lower part of the distribution in S–δ18O space (Fig. 3c), which overlaps with the location of the data from CROCCA-2S and the near-Australia data from GWS2024 (the higher values in Fig. 3c do not). For salinities above 35 one observes a lowering of δ18O at given salinity from 50° E in the western Indian Ocean to at least 100° E (Fig. 4), with more stable values further east. This lowering is on the order of 0.15 at most, even for the higher salinities (35.5 or more) for which it is strongest.
Thus, besides some gradual and smaller changes, we do not observe in the LOCEAN surface dataset a large sudden change in the S–δ18O distribution near 75 or 85° E between the southeastern and southwestern Indian Ocean or a further strong change closer to the Australian coastal margin, as suggested by Figs. 6 and 7 of GWS2024. Most of the LOCEAN S–δ18O data south of 28° S correspond to the mixing of a low-salinity end-member characteristic of the fresh waters of the Southern Ocean (at S < 34) with waters which are imprinted by air–sea exchange in the subtropical gyre at higher salinities up to 36 and more, as discussed by GWS2024. These LOCEAN (S, δ18O) values are significantly above the linear relationships proposed by GWS2024 (based on their Figs. 5a, 6, and 7). This positive offset at given S seems to be about 0.05–0.10 ‰ in the southwestern Indian Ocean but close to 0.50 ‰ for the Australian coastal margins, although we could not access the individual data of R2019 for that latter region. These offsets are much larger than the spread in the LOCEAN data, which is on the order of 0.10 ‰. Furthermore, the LOCEAN data support the presence of a secondary low-salinity end-member at S < 35 with heavier isotopic composition, contributing to the water mass properties in the far southwestern Indian Ocean as well as the area sampled between 20 and 28° S north of the subtropical salinity maximum. This could be a contribution of the Indonesian Throughflow and tropical western Indian Ocean surface waters, as discussed by Kim et al. (2021) and GWS2024. We could not carry out a comparable comparison for δ2H, which is not presented by GWS2024 and which exhibits a spread that is too large in the CROCCA-2S dataset to reach a firm conclusion.
In the two intercomparisons of surface data presented in this note, we find significant differences between datasets. Do these differences originate from spatiotemporal variability or from systematic offsets between the different datasets?
In the case of the RV Polarstern dataset (Bonne et al., 2019), an error in a specified reference material value was found after the publication, and the adjusted data present only a small, nonsignificant δ18O negative offset but a significant positive δ2H offset with respect to LOCEAN data. Differences might arise from spatial differences. For example, in the Northern Hemisphere, values at salinity close to 35 mostly originate from the North Sea and English Channel in the RV Polarstern dataset; thus, there is a more midlatitude continental influence than for most of the LOCEAN data in the same salinity range, which have a contribution of more depleted subpolar and polar fresh water. One expects a larger isotopic range in the South Atlantic for salinities less than 35 due to intermittent presence of sea ice or iceberg melt and at higher salinities due to the presence of different water masses originating from the South Atlantic and southeastern Indian Ocean. However, the current dataset is not sufficient to estimate it.
Furthermore, different seasons were sampled in the two datasets. In the northeastern Atlantic sector, Bonne et al. (2019) surface data east of 30° W were collected in April and November north of 10° S and in November south of 10° S in the southeastern Atlantic. These data do not suggest large seasonal differences in the northeast Atlantic, concurring with the LOCEAN S–δ18O data in the tropics to midlatitudes (20 to 50° N), which are tightly distributed along a mean S–δ18O relationship and thus with low seasonal variability of this relationship (Benetti et al., 2017a; Voelker et al., 2015). The LOCEAN data are not numerous enough in the southeastern Atlantic to further evaluate whether the offset is constant throughout the dataset or presents a component related to geographical temporal or spatial variability.
To investigate the southern Indian Ocean seawater isotopic composition, GWS2024 combined datasets that were processed in different laboratories. Potential offsets between those could thus cause apparent spatial variability. In particular, GWS2024 outline large spatial contrasts in the S–δ18O relationship across the surface subtropical Indian Ocean and southern Australia that are at least a factor 2 smaller in the recent version of the LOCEAN dataset.
Seasonal or interannual variability might contribute to the differences shown in Fig. 3, as the data in the southeastern Indian Ocean from GWS2024 were collected in November–December, whereas the data in the LOCEAN database in this region are mostly from February–March. However, at least south of Tasmania, where the LOCEAN dataset also contains December data, it does not seem that the seasonal cycle causes changes larger than 0.05 ‰ at the same salinity. A difference due to seasonality would thus be barely identifiable in that case, noting the possible presence of interannual variability and that the long-term accuracy in the analyses in some centers, such as AWI Potsdam and LOCEAN, is 0.05 ‰. Richardson et al. (2019) also commented that south of Australia there was little difference between a southern winter cruise and late summer (March) data. Further west, near 55–70° E, earlier surface data in the OISO surveys, as well as the vertical upper profiles of OISO station data, also suggest a rather modest seasonal variability on the order of 0.10 ‰. Changes could also arise from interannual variability, but the range of interannual variability in the LOCEAN database is smaller than the difference between the GWS2024 curves for the southeastern Indian Ocean and south of Australia and the corresponding LOCEAN data. Thus, a likely cause of the large differences between the southern Indian Ocean and Australian margin data combined in the GWS2024 study is the existence of systematic offsets between the data produced by different institutes.
What these two comparisons suggest is that offsets are present between different recent published datasets, which exceed 0.10 ‰ in δ18O and 0.50 ‰ in δ2H and are thus larger than the target long-term accuracy of analyses in individual isotopic laboratories. Moreover, errors in reference material values are always possible and require post-analysis intercomparisons, such as the one that led to the correction of the RV Polarstern dataset (Bonne et al., 2019). Furthermore, one contribution to a systematic difference between the LOCEAN dataset and data from other institutes is that the LOCEAN data are reported on a “freshwater” concentration scale (Benetti et al., 2017b). The use of this concentration scale corrects possible effects of salt in the water activity measured by IRMS with CO2 equilibration and the effect of salt accumulation during evaporation in laser spectroscopy, which both can lead to fractionation, possibly of similar magnitude (Walker et al., 2016). Different comparisons based on duplicates collected during cruises suggest that this is a main cause of differences between LOCEAN data and other datasets (LOCEAN δ18O data being more positive). Poor conservation of the samples during storage, analytical protocols, or uncertainties in the specified values of reference material are other sources of differences between data produced in different institutes.
Different methods have been used for intercomparing and detecting systematic offsets between different datasets. One common approach is to compare values obtained in specific water masses, for which we expect little variability of the water isotopic composition. This is often attempted, but data density is often limited, and the resulting uncertainties are difficult to assess. Datasets with intermediate and deep data in the Southern Ocean might be valuable to systematically test this approach, and model-based reconstructions of isotopic composition of seawater could also be incorporated.
An alternative, in particular for the surface data, is to develop approaches based on the systematic comparison of nearby data in space and time. In some ways, the assumption behind this and what was done in the mapping by LeGrande and Schmidt (2006) is that the bulk of the variability is from large-scale relationships of water isotopes and salinity. This is also what has been done by crossover analyses in major geochemical databases, such as GLODAP, with an attempt to adjust offsets for δ13CDIC (DIC: dissolved inorganic carbon) with a similar low-density data distribution in the North Atlantic (Becker et al., 2016). The comparison presented here (Fig. 1) of the S–water isotope surface distribution in the North and South Atlantic of the LOCEAN and the RV Polarstern (Bonne et al., 2019) datasets suggests that this can be used to estimate offsets. Required improvements, in particular for estimating uncertainties, would be to take into account estimates of seasonal, interannual, and spatial variability in these relationships. However, this requires that there are enough overlapping data within regions of relatively homogeneous water masses or some independent estimates on these signals, for example from model simulations.
As the spatial and temporal data density is often reduced, we expect that the uncertainties in estimated offsets will be large. This could reduce the usefulness of the isotopic data for different oceanographic and climate studies, with large uncertainties in estimated S–δ18O (or S–δ2H) relationships to validate proxies used for paleoclimate reconstructions or for identifying emerging climate-change-related signals.
Scientific Committee of Oceanic Research (SCOR) working group 171 MASIS (Towards Best Practices for Measuring and Archiving Stable Isotopes in Seawater) has recently been established to contribute to tackling these issues for both water isotopes and the isotopic composition of inorganic carbon in seawater: δ13C DIC. For that, it aims to actively involve the international community in establishing guidelines for data production (collection, storage, measurement) and quality control, as well as for validating the data and comparing well-documented archived data originating from different laboratories. It will review the methods to estimate errors and offsets between the different datasets. An important step for this effort is to directly intercompare measurements by different laboratories of shared well-preserved water samples distributed quickly, as done earlier for δ13C DIC (Cheng et al., 2019). This, together with enhancing interaction within the scientific community, needs to be actively pursued in order to reduce errors when merging different datasets and increase the potential use of water isotope data.
The LOCEAN data are available at https://doi.org/10.17882/71186 (Waterisotopes-CISE-LOCEAN, 2024).
The isotopic data from Bonne et al. (2019) are available as indicated in the paper, with S added here from the PANGAEA archive, as described in the text. The GWS2024 data are available as described in the paper. However, among the data used in this paper, we could not access the data from the Richardson et al. (2019) paper.
GR initiated the study and prepared the manuscript with contributions from all coauthors. AHLV initiated the intercomparison effort, and AHLV, CW, and HM contributed to editing the paper. HM was also responsible from producing the data in the Bonne et al. (2019) paper.
The contact author has declared that none of the authors has any competing interests.
Publisher's note: Copernicus Publications remains neutral with regard to jurisdictional claims made in the text, published maps, institutional affiliations, or any other geographical representation in this paper. While Copernicus Publications makes every effort to include appropriate place names, the final responsibility lies with the authors.
The LOCEAN isotopic laboratory is supported by OSU Ecce Terra of Sorbonne Université. We are thankful to Catherine Pierre and Jérôme Demange, who set and help run the facility, and to Aïcha Naamar, Marion Benetti, and Camille Akhoudas for measuring some of the water samples. We are grateful for support by INSU, Nicolas Metzl, and Claire Lo Monaco for samples during the OISO cruises on RV MD2; by IPEV during the SOCISSE program on RV Astrolabe, with onboard support by Patrice Bretel and Rémi Foletto; and by IPSL for supporting the LOCEAN database and intercomparisons. Antje H. L. Voelker thanks Joanna Waniek (IOW, Germany) for collecting the NE Atlantic water samples and Robert van Geldern (GeoZentrum Nordbayern, Germany) for analyzing them. Antje H. L. Voelker also acknowledges financial support from Fundação para a Ciência e a Tecnologia (FCT) through projects Centro de Ciências do Mar do Algarve (CCMAR) basic funding UIDB/04326/2020 (https://doi.org/10.54499/UIDB/04326/2020) and programmatic funding UIDP/04326/2020 (https://doi.org/10.54499/UIDP/04326/2020) as well as the CIMAR-associated laboratory funding under grant LA/P/0101/2020 (https://doi.org/10.54499/LA/P/0101/2020). Comments by Alexander Haumann (AWI) and by two anonymous reviewers were very helpful.
This research has been supported by the Centro de Ciências do Mar (grant no. UIDB/04326/2020), the Alfred Wegener Institute Helmholtz Centre for Polar and Marine Research (grant no. ISOARC) and CIMAR-associated laboratory funding (grant no. LA/P/0101/2020).
This paper was edited by Karen J. Heywood and reviewed by two anonymous referees.
Akhoudas, C. H., Sallée, J.-B., Haumann, F. A., Meredith, M. P., Garabato, A. N., Reverdin, G., Jullion, L., Aloisi, G., Benetti, M., Leng, M. J., and Arrowsmith, C.: Ventilation of the abyss in the Atlantic sector of the Southern Ocean, Nature Scientific Reports, 11, 16733, https://doi.org/10.1038/s41598-021-95949-w, 2021.
Aoki, S., Kobayashi, R., Rintoul, S. R., Tamura, T., and Kusahara, K.: Changes in water properties and flow regime on the continental shelf off the Adélie/George V Land coast, East Antarctica, after glacier tongue calving, J. Geophys. Res.-Oceans, 122, 6277–6294, 2017.
Atwood, A. R., Moore, A. L., Long, S., Pauly, R., DeLong, K., Wagner, A., and Hargreaves, J. A.: The CoralHydro2k Seawater δ18O Database, Past Global Changes Magazine, 32, 59, https://doi.org/10.22498/pages.32.1.59, 2024.
Becker, M., Andersen, N., Erlenkeuser, H., Humphreys, M. P., Tanhua, T., and Körtzinger, A.: An internally consistent dataset of δ13C-DIC in the North Atlantic Ocean – NAC13v1, Earth Syst. Sci. Data, 8, 559–570, https://doi.org/10.5194/essd-8-559-2016, 2016.
Benetti, M., Reverdin, G., Aloisi, G., and Sveinbjörnsdóttir, A.: Stable isotopes in surface waters of the Atlantic Ocean: indicators of ocean–atmosphere water fluxes and oceanic mixing processes, J. Geophys. Res. Oceans, 122, 4723–4742, https://doi.org/10.1002/2017JC012712, 2017a.
Benetti, M., Sveinbjörnsdóttir, A. E., Ólafsdóttir, R., Leng, M. J., Arrowsmith, C., Debondt, K., Fripiat, F., and Aloisi, G.: Inter-comparison of salt effect correction for δ18O and δ2H measurements in seawater by CRDS and IRMS using the gas-H2O equilibration method, Mar. Chem., 194, 114–123, https://doi.org/10.1016/j.marchem.2017.05.010, 2017b.
Biddle, L. C., Loose, B., and Heywood, K. J.: Upper ocean distribution of glacial meltwater in the Amundsen Sea, Antarctica, J. Geophys. Res.-Oceans, 124, 6854–6870, https://doi.org/10.1029/2019JC015133, 2019.
Bonne, J.-L., Behrens, M. Meyer, H., Kipfstuhl, S., Rabe, B., Schönicke, L., Steen-Larsen, H. C., and Werner, M.: Resolving the controls of water vapour isotopes in the Atlantic sector. Nature Comm., 10, 1632, https://doi.org/10.1038/s41467-019-09242-6, 2019.
Boutin, J., Chao, Y., Asher, W. E., Delcroix, T., Drucker, D., Drushka, K., Kolodzieczyk, N., Lee, T., Reul, N., Reverdin, G., Schanze, J., Soloviev, A., Yu, L., Anderson, J., Brucker, L., Dinnat, E., Santos-Garcia, A., Jones, W. I., Maes, C., Meissner, T., Tang, W., Vinagradova, N., and Ward, B.: Satellite and In Situ Salinity: Understanding Near-Surface Stratification and Subfootprint Variability, B. Am. Meteorol. Soc., 97, 1391–1407, https://doi.org/10.1175/BAMS-D-15-00032.1, 2016.
Brady, E., Stevenson, S., Bailey, D., Liu, Z., Noone, D., Nusbaumer, J., Otto-Bliesner, B. L., Tabor, C., Thomas, R., Wong, T., Zhang, J., and Zhu, J.: The connected isotopic water cycle in the Community Earth System Model Version 1, J. Adv. Model. Earth Sy., 11, 8, https://doi.org/10.1029/2019MS001663, 2019.
Cauquoin, A., Werner, M., and Lohmann, G.: Water isotopes – climate relationships for the mid-Holocene and preindustrial period simulated with an isotope-enabled version of MPI-ESM, Clim. Past, 15, 1913–1937, https://doi.org/10.5194/cp-15-1913-2019, 2019.
Cheng, L., Normandeau, C., Bowden, R., Doucett, R., Gallagher, B., Gillikin, D. P., Kumamoto, Y., McKay, J. L., Middlestead, P., Ninnemann, U., Nothaft, D., Dubinina, E. O., Quay, P., Reverdin, G., Shirai, K., Mørkved, P. T., Theiling, B. P., van Geldern, R., and Wallace, D. W. R.: An international intercomparison of stable carbon isotope composition measurements of dissolved inorganic carbon in seawater, Limnol. Oceanogr.-Meth., 17, 200–209, https://doi.org/10.1002/lom3.10300, 2019.
Conroy, J. L., Cobb, K. M., Lynch-Stieglitz, J., and Polissar, P. J.: Constraints on the salinity-oxygen isotopes relationship in the central tropical Pacific Ocean, Mar. Chem., 161, 26–33, 2014.
Conroy, J. L., Thompson, D. M., Cobb, K. M., Noone, D., Rea, S., and LeGrande, A. N.: Spatiotemporal variability in the δ18O-salinity relationship of seawater across the tropical Pacific, Paleoceanography, 32, 484–497, https://doi.org/10.1002/2016PA003073, 2017.
Glaubke, R. H., Wagner, A., and Sikes, E. L.: Characterizing the stable oxygen isotopic composition of the southeast Indian Ocean, Mar. Chem., 262, 177–185, https://doi.org/10.1016/j.marchem.2024.104397, 2024.
Haumann, F. A., Leonard, K., Budéus, G., Meredith, M. P., Gorodetskaya, I. V., Hutchings, J., Stammerjohn, S., Tsukernik, M., and Thomas, J.: Seawater stable isotope sample measurements from the Antarctic Circumnavigation Expedition (ACE) (Version 1.0) [Data set], Zenodo [data set], https://doi.org/10.5281/zenodo.1494915, 2019.
Hennig, A. N., Mucciarone, D. A., Jacobs, S. S., Mortlock, R. A., and Dunbar, R. B.: Meteoric water and glacial melt in the southeastern Amundsen Sea: a time series from 1994 to 2020, The Cryosphere, 18, 791–818, https://doi.org/10.5194/tc-18-791-2024, 2024.
Hilaire-Marcel, C., Kim, S. T., Landais, A., Ghosh, P., Assonov, S., Lécuyer, C., Blanchard, M., Meijer, H. A., and Steen-Larsen, H. C.: A stable isotope toolbox for water and inorganic carbon cycle studies, Nature Reviews Earth & Environment, 2, 699–719, 2021.
Karr, J. D. and Showers, W. J.: Stable oxygen and hydrogen isotopic tracers in Amazon shelf waters during AmassedsTraceurs isotopiques de l'oxygène stable et de l'hydrogène dans les eaux côtières amazonienne durant le programme Ammaseds, Oceanol. Ac., 25, 71–78, https://doi.org/10.1016/S0399-1784(02)01183-0, 2002.
Kim, Y., Rho, T., and Kang, D.-J.: Oxygen isotope composition of seawater and salinity in the western Indian Ocean: Implications for water mass mixing, Mar. Chem. 237, 104035, https://doi.org/10.1016/j.marchem.2021.104035, 2021.
Konecky, B. L., McKay, N. P., Churakova (Sidorova), O. V., Comas-Bru, L., Dassié, E. P., DeLong, K. L., Falster, G. M., Fischer, M. J., Jones, M. D., Jonkers, L., Kaufman, D. S., Leduc, G., Managave, S. R., Martrat, B., Opel, T., Orsi, A. J., Partin, J. W., Sayani, H. R., Thomas, E. K., Thompson, D. M., Tyler, J. J., Abram, N. J., Atwood, A. R., Cartapanis, O., Conroy, J. L., Curran, M. A., Dee, S. G., Deininger, M., Divine, D. V., Kern, Z., Porter, T. J., Stevenson, S. L., von Gunten, L., and Iso2k Project Members: The Iso2k database: a global compilation of paleo-δ18O and δ2H records to aid understanding of Common Era climate, Earth Syst. Sci. Data, 12, 2261–2288, https://doi.org/10.5194/essd-12-2261-2020, 2020.
Kubota, K., Sakai, K., Ohkushi, K., Higuchi, T., Shirai, K., and Minami, M.: Salinity, oxygen isotope, hydrogen isotope, and radiocarbon of coastal seawater of North Japan, Geochemic. J., 56, 240–249, https://doi.org/10.2343/geochemj.GJ22021, 2022.
Lao, Q., Lu, X.. Chen, F., Jin. G., Chen, C., Zhou, X., and Zhu. Q: Effects of upwelling and runoff on water mass mixing and nutrient supply induced by typhoons: Insight from dual water isotopes tracing, Limnol. Oceanogr., 68, 284–295, https://doi.org/10.1002/lno.12266, 2022.
LeGrande, A. N. and Schmidt, G. A.: Global gridded data set of the oxygen isotopic composition in seawater, Geophys. Res. Lett., 33, L12604, https://doi.org/10.1029/2006gl026011, 2006.
Oppo, D. W., Schmidt, G. A., and LeGrande, A. N.: Seawater isotope constraints on tropical hydrology during the Holocene, Geophys. Res. Lett., 34, L13701, https://doi.org/10.1029/2007GL030017, 2007.
Prasanna, K., Ghosh, P., and Kumar, N. A.: Stable isotopic signature of Southern Ocean deep water CO2 ventilation, Deep-Sea Res. Pt. II, 118, 177–185, https://doi.org/10.1016/j.dsr2.2015.04.009, 2015.
Randall-Goodwin, E., Meredith, M. P., Jenkins, A., Yager, P. L., Sherrell, R. M., Abrahamsen, E. P., Guerrero, R., Yuan, X., Mortlock, R. A., Gavahan, K., Alderkamp, A.-C., Ducklow, H., Robertson, R., and Stammerjohn, S. E.: Freshwater distributions and water mass structure in the Amundsen Sea polynya region, Antarctica, Elementa: Science of the Anthropocene, 3, 000065, https://doi.org/10.12952/journal.elementa.000065, 2015.
Reverdin, G., Waelbroeck, C., Pierre, C., Akhoudas, C., Aloisi, G., Benetti, M., Bourlès, B., Danielsen, M., Demange, J., Diverrès, D., Gascard, J.-C., Houssais, M.-N., Le Goff, H., Lherminier, P., Lo Monaco, C., Mercier, H., Metzl, N., Morisset, S., Naamar, A., Reynaud, T., Sallée, J.-B., Thierry, V., Hartman, S. E., Mawji, E. W., Olafsdottir, S., Kanzow, T., Velo, A., Voelker, A., Yashayaev, I., Haumann, F. A., Leng, M. J., Arrowsmith, C., and Meredith, M.: The CISE-LOCEAN seawater isotopic database (1998–2021), Earth Syst. Sci. Data, 14, 2721–2735, https://doi.org/10.5194/essd-14-2721-2022, 2022.
Richardson, L. E., Middleton, J. F., Kyser, T. K., James, N. P., and Opdyke, B. N.: Shallow water masses and their connectivity along the southern Australian continental margin, Deep-Sea Res. Pt. I, 152, 103083, https://doi.org/10.1016/j.dsr.2019.103083, 2019.
Schmidt, G. A., LeGrande, A. N., and Hoffmann, G.: Water isotope expressions of intrinsic and forced variability in a coupled ocean-atmosphere model, J. Geophys. Res., 112, D10103, https://doi.org/10.1029/2006jd007781, 2007.
Voelker, A., Colman, A., Olack, G., Waniek, J. J., and Hodell, D.: Oxygen and hydrogen isotope signatures of Northeast Atlantic water masses, Deep-Sea Res. Pt. II, 116, 89–106, https://doi.org/10.1016/j.dsr2.2014.11.006, 2015.
Voelker, A. H.: Seawater oxygen and hydrogen stable isotope data from the upper water column in the North Atlantic Ocean (unpublished data), IEDA – Interdisciplinary Earth Data Alliance, https://doi.org/10.26022/IEDA/112743, 2017.
Walker, S. A., Azetsu-Scott, K., Normandeau, C., Kelly, D. E., Friedrich, R., Newton, R., Schlosser, P., McKay, J. L. Abdi, W., Kerrigan, E., Craig, S. E., and Wallace, D. W. R.: Oxygen isotope measurement of seawater (). A comparison of cavity ring-down spectroscopy (CRDS) and isotope ratio mass spectrometry (IRMS), Limnol. Oceanogr.-Meth, 14, 31–38, https://doi.org/10.1002/lom3.10067, 2016.
Waterisotopes-CISE-LOCEAN: Water isotopes of sea water analyzed since 1998 at LOCEAN, (version Wisotopes-V4), Seanoe [data set], https://doi.org/10.17882/71186, 2024.