the Creative Commons Attribution 4.0 License.
the Creative Commons Attribution 4.0 License.
 | 13 Feb 2025
Application of wave–current coupled sediment transport models with variable grain properties for coastal morphodynamics: a case study of the Changhua River, Hainan
Enjin Zhao
Xiwen Li
Shiyou Zhang
This study introduces an integrated sand transport model that considers wave and current actions alongside variable grain properties to explore sediment dynamics in river deltas. The research delves into a case study of a river delta region, examining sediment transport over a substantial stretch of the river's lower course. The study incorporates topographic data, sediment sampling, and remote sensing to validate the model against observed suspended sediment concentrations at a key monitoring station. The results reveal substantial sediment deposition in both the estuary and lower reaches of the river, influenced by hydrodynamic conditions and geological settings. Deposition patterns in the estuary are primarily driven by coastal currents and wave action, while river channel deposition is linked to river constriction and flow velocity variations. The study demonstrates that the residual current in the region consistently flows towards a nearby bay, suggesting that sediment in the lower reaches of the river will be directed by this residual flow. The study underscores the pivotal roles of current and wave action in sediment transport within a multi-branched estuary characterized by low sediment concentrations, which can inform coastal management and environmental planning.
- Article
(16447 KB) - Full-text XML
-
Supplement
(634 KB) - BibTeX
- EndNote


The island of Hainan has an extensive coastline, making the marine economy a crucial source of its economic prosperity (Feng et al., 2021; Jin et al., 2008; Fang et al., 2021). The Changhua River is the second largest river in Hainan in terms of its basin area (Zhang et al., 2020; Zeng and Zeng, 1989), which, flowing uniquely into the Beibu Gulf in the northwest of the island of Hainan, serves as a crucial water source for the region, supporting irrigation, power generation, and water supply (Yang et al., 2013; Wang et al., 2023). The Changhua River is divided into upper, middle, and lower reaches based on its natural geographical characteristics: the upper reaches extend from the source to Poyang with a length of 79 km and an average gradient of 14.87 %; the middle reaches run from Poyang to Chahe with a total length of 84 km, which includes a significant drop at Guangba in Dongfang County, and generally feature a milder gradient; the lower reaches run from Chahe down to the river's mouth at the port of Changhua, spanning 39 km with an average gradient of 0.41 %, leading to a broad river plain (Fig. 1a). Characterized by a gentler gradient and slower flow, the lower reaches are where the river's capacity to carry sediment decreases, leading to increased sediment deposition. Currently, the issues related to water and sediment in the lower reaches of the Changhua River are primarily divided into studies on sediment composition and sediment transport (Zhang et al., 2006; Wu et al., 2012; Zhu et al., 2020; Gao, 2014; Wang et al., 2022; Zhao et al., 2021). About the sediment concentration information, the annual sediment concentration of the Changhua River is recorded as 0.173 kg m−3, with an average annual sediment discharge of 782 000 t, classifying it as a river with relatively low sediment load. From 2013 to 2021, the average sediment concentration at Baoqiao station in the lower reaches of the Changhua River was determined to be 0.1227143 kg m−3.
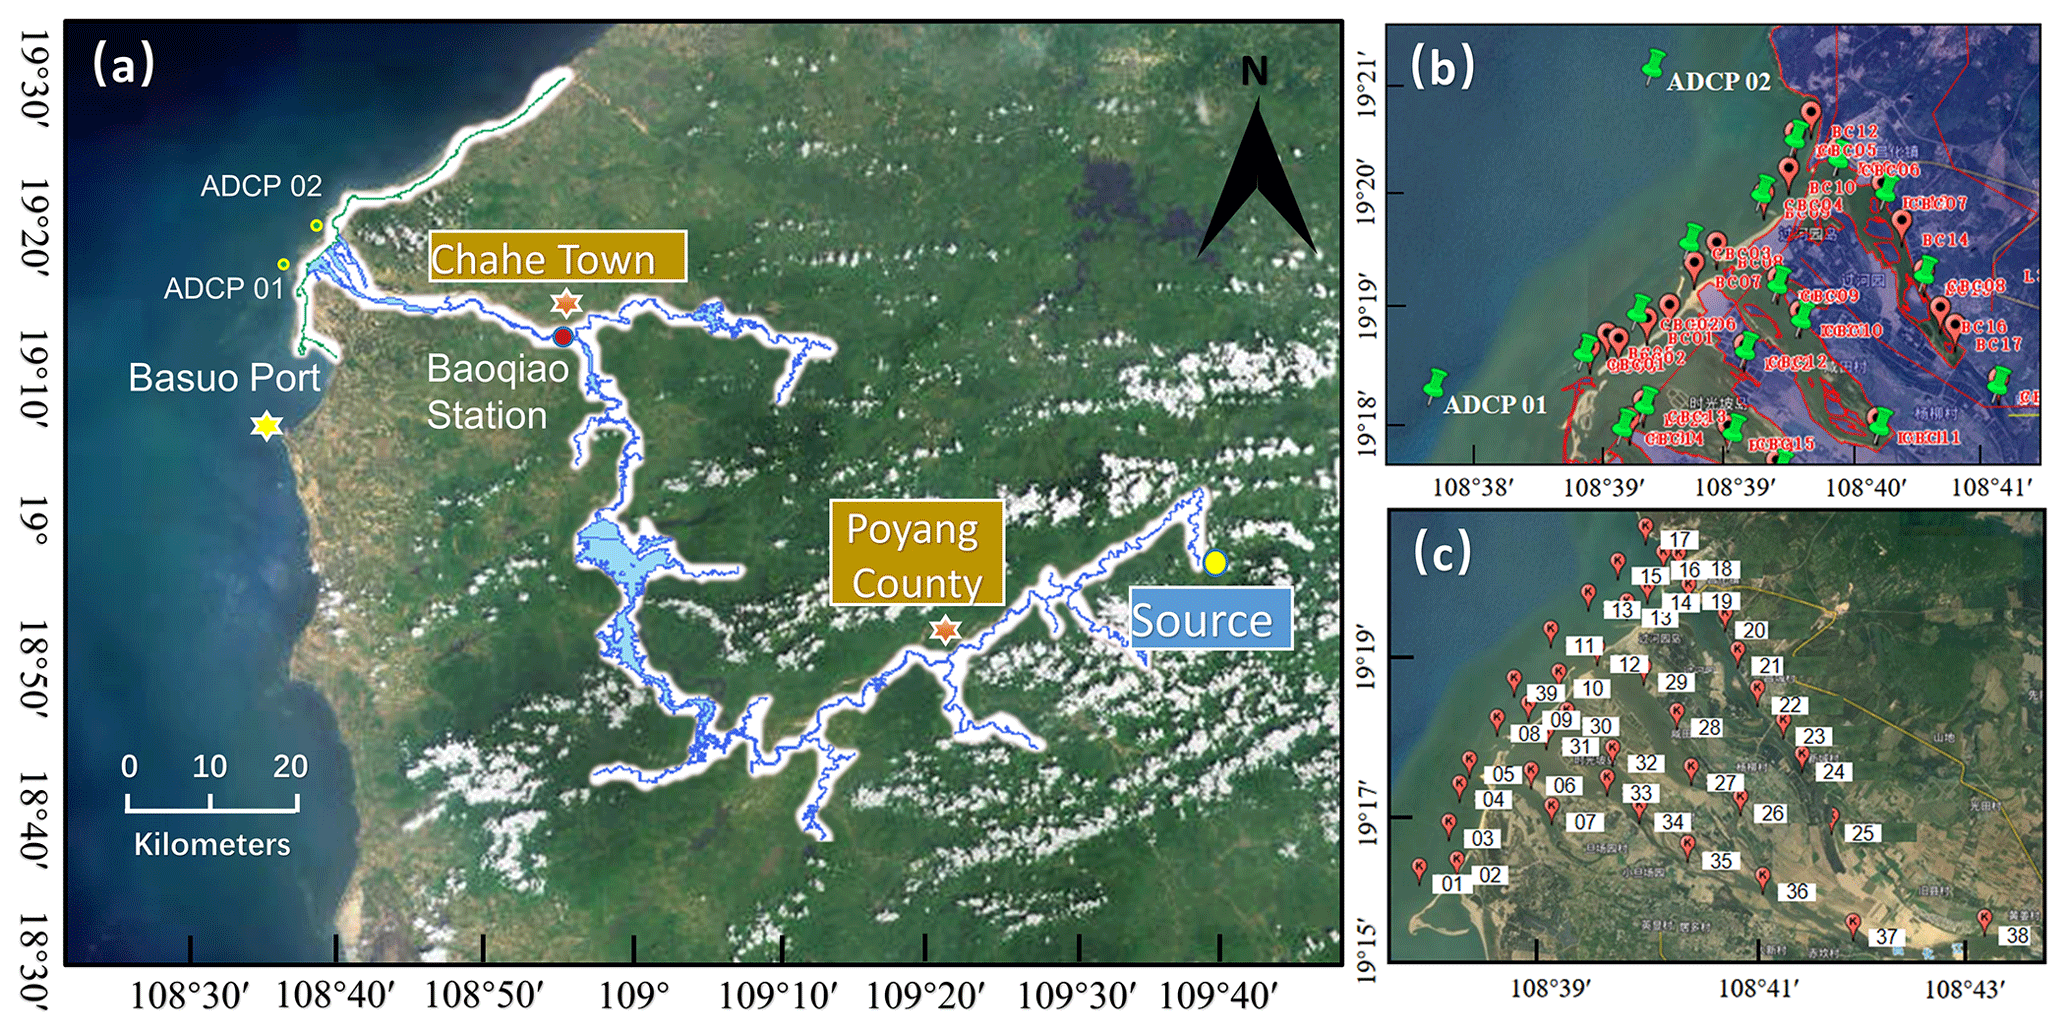
Figure 1Comprehensive overview of the study area in the lower reaches of the river. (a) Division of the upper, middle, and lower reaches of the Changhua River (adapted from the Tiandi Map, Hainan, https://hainan.tianditu.gov.cn/, last access: 4 October 2024); (b) ADCP stations and calibration stations in the study area; (c) sediment sampling points in the lower reaches of the river.
In the lower reaches of rivers, sediment dynamics are influenced by both water flow and waves, which are crucial for understanding the changes in estuarine and nearshore ecosystems, shoreline evolution, and the development of ocean resources. With the rapid advancement of computational technologies, significant progress has been made in sediment modeling studies, particularly in modeling sediment transport in the lower reaches of rivers where wave and current interactions are considered.
Researchers have developed a variety of computational models to simulate sediment transport processes in the lower reaches. These models include one-dimensional (1D), two-dimensional (2D), and three-dimensional (3D) hydrodynamic and sediment transport models that describe the flow and sediment movement in rivers, lakes, and coastal areas (Papanicolaou et al., 2010). One-dimensional models are typically used for large-scale, long-term sediment transport issues (Thomas and Prashum, 1977; Holly and Rahuel, 1990; Papanicolaou et al., 2004), while 2D and 3D models are more suitable for simulating specific flow and sediment transport conditions, especially in the lower reaches and estuary areas (Lee et al., 1997; Jia and Wang, 1999; Gessler et al., 1999; Wu et al., 2000; Blumberg and Mellor, 1987).
Traditional sediment transport models have predominantly focused on the dynamics of water flow, with wave action often addressed in a simplified manner or neglected altogether (Bakhtyar et al., 2009; Lee et al., 1997; Spasojevic and Holly, 1990; Bai et al., 2017). We need more accurate and comprehensive models that can describe and predict sediment behavior under the combined action of waves and currents, especially for rivers with low sediment concentrations. In this context, the Van Rijn formula emerges as a critical tool for enhancing the precision of sediment transport modeling (Van-Rijn, 1984). Originally formulated to calculate the transport of bed load and suspended sediment, the Van Rijn formula has been adapted over time to accommodate the intricate interplay between waves and currents. Its empirical nature, grounded in extensive field and laboratory data, allows for a nuanced representation of sediment dynamics in coastal environments. The recent applications of the Van Rijn formula in computational models have further expanded its utility, providing a robust framework for analyzing sediment behavior in scenarios characterized by wave and current interactions (Chen et al., 2024; Michel et al., 2023; Addison-Atkinson et al., 2024).
With the advancement of computational technologies and the development of remote sensing techniques, ocean numerical models are more and more widely used (Jiang and Zhao, 2024; Zhao et al., 2019, 2020, 2021, 2024; Sun et al., 2022). Researchers have begun to incorporate the complex interactions of waves and currents into sediment transport modeling (Han et al., 2022; Liu and Bai, 2014; Vinzon et al., 2023). These models not only consider the velocity and direction of water flow but also account for the energy input from waves, wave form changes, and the shear forces generated by wave–current interactions. Studies have shown that sediment movement under wave action is influenced not only by the shear stress of the water flow but also by the liquefaction and mass transport of bottom sediment caused by waves (Niu et al., 2023). Additionally, the physical properties of sediment, such as particle size distribution, concentration, and sedimentation rates, are crucial factors affecting sediment behavior under the combined influence of waves and currents (Constant et al., 2023; Terêncio et al., 2023).
Despite the progress made, sediment modeling under the combined action of waves and currents still faces many challenges. For example, how to better simulate sediment transport in complex turbulent flows, the coupling of flow and sediment transport, and the transport of non-uniform sediment still require further research. Moreover, model input and calibration also require more field data and experimental validation to ensure the reliability and applicability of the models. To verify the effectiveness of wave–current coupled sediment model in rivers with low sediment concentrations, we take the Changhua River in Hainan Province as an example to verify it.
To sum up, the sediment simulation considering only water flow can no longer meet the accuracy of sediment prediction, and there are still limitations in the verification of sediment simulation considering the interaction of waves and water flow. Most river sediment models do not study rivers with low sediment concentrations separately and lack in situ observations, so the accuracy of the models needs further verification. Additionally, due to the small scope of the lower reaches of the Changhua River, the existing terrain extraction methods are not enough to provide terrain data with appropriate accuracy. Moreover, the sediment concentration of the Changhua River is not large, and the existing research data are limited. In the absence of topographic data and sediment data, a complete and mature sediment transport model has not been established in the lower reaches of the Changhua River so far. In this paper, we take the Changhua River in Hainan Province as a representative of the river with less sediment and consider the sediment deposition under the combined action of waves and currents. Based on the measured topographic data and sediment sampling data, the bed load and suspended sediment load are calculated with the Van Rijn model, and the sediment model is established. The in situ observation of suspended sediment concentration is used to verify the model and analyze the sediment deposition in the lower reaches' channel and estuary.
2.1 Combined wave and current sand transport model
This study assumes the sediment to be non-viscous, and the sediment deposition model utilizes the results from the hydrodynamic model as open boundary driving forces. The model definition in the sand transport model is assumed to be combined current and waves, calculating the bed load and suspended load separately. Bed load typically occurs close to the bed, while suspended load can be transported at various levels within the water column. Sediment particles begin to move and may become suspended when the bed shear stress exerted by waves and currents exceeds a critical threshold. The equations adopt the Van Rijn model. Van Rijn proposed the following models for sediment transport of bed load and suspended load, which are suitable for sediment transport calculation under wave action (Van-Rijn, 1984). The Van Rijn model formula is derived based on a set of variables that are crucial for understanding sediment transport dynamics, particularly in the context of rivers and coastal waters. These variables include the following.
Here qb is the bed load transport rate; qs is the suspended load transport rate; M is the non-dimensional transport stage parameter; uf,c is the critical friction velocity, which is influenced by the current conditions; θc is the critical Shields parameter; is the effective friction velocity; V is the depth-averaged velocity; C′ is the Chezy number originating from skin friction; D∗ is the non-dimensional particle parameter; v is the kinematic viscosity and is approximately equal to 10−6 m2 s−1 for water; Ca is the bed concentration; u∗ is the friction velocity; us is the initiation velocity, which is the critical flow velocity at which sediment particles begin to move; τ is the shear stress at the bed surface; ρ is the density of water; and m is the empirical exponent.
In the context of the Van Rijn model, the non-dimensional particle parameters can influence the value of the critical Shields parameter. For example, as the particle size increases, the critical Shields parameter may also increase because larger particles require more force to overcome gravity and initiate motion. Similarly, changes in fluid properties or flow conditions can affect both the non-dimensional particle parameters and the critical Shields parameter. Instead of using a constant critical Shields parameter θc, Van Rijn specifies its variation as a function of D∗, as illustrated in Fig. S1 in the Supplement (Van-Rijn, 1984).
2.2 Influence of waves and currents
The influence of the sediment transport model on water flow has been widely studied and applied (Papanicolaou et al., 2010), including sediment transport mechanisms, the establishment of the boundary layer, modifications to bed morphology, and the vertical distribution of suspended sediment. However, the theory and application of wave action are not as developed compared with water flow. This chapter emphasizes the motion equation and boundary condition equation adopted by wave action in the sediment transport model in this paper.
The model of sediment transport calculates the influence of the waves through a comprehensive consideration of various factors that encapsulate the impact of waves on sediment transport. The typical models incorporate the nonlinear characteristics of wave motion, net mass transport induced by waves, turbulence generated by wave breaking, the temporal evolution of the boundary layer due to combined wave and current action, contributions to turbulence from three sources (wave boundary layer, mean flow, and wave breaking), and the influence of wave-formed ripples on flow and sediment transport. A suite of wave theories, such as Stokes and cnoidal theories, are employed to describe wave motion across different hydrodynamic conditions. Additionally, the model accounts for the calculation of turbulence viscosity due to wave breaking, and the equations to compute the shear stress resulting from wave motion are well represented. These complex interactions and processes are articulated through a series of mathematical equations and empirical formulas, enabling the model to accurately simulate the process of sediment transport under the dual influence of waves and current.
Table 1Formulas of the wave motion in the sand transport model.
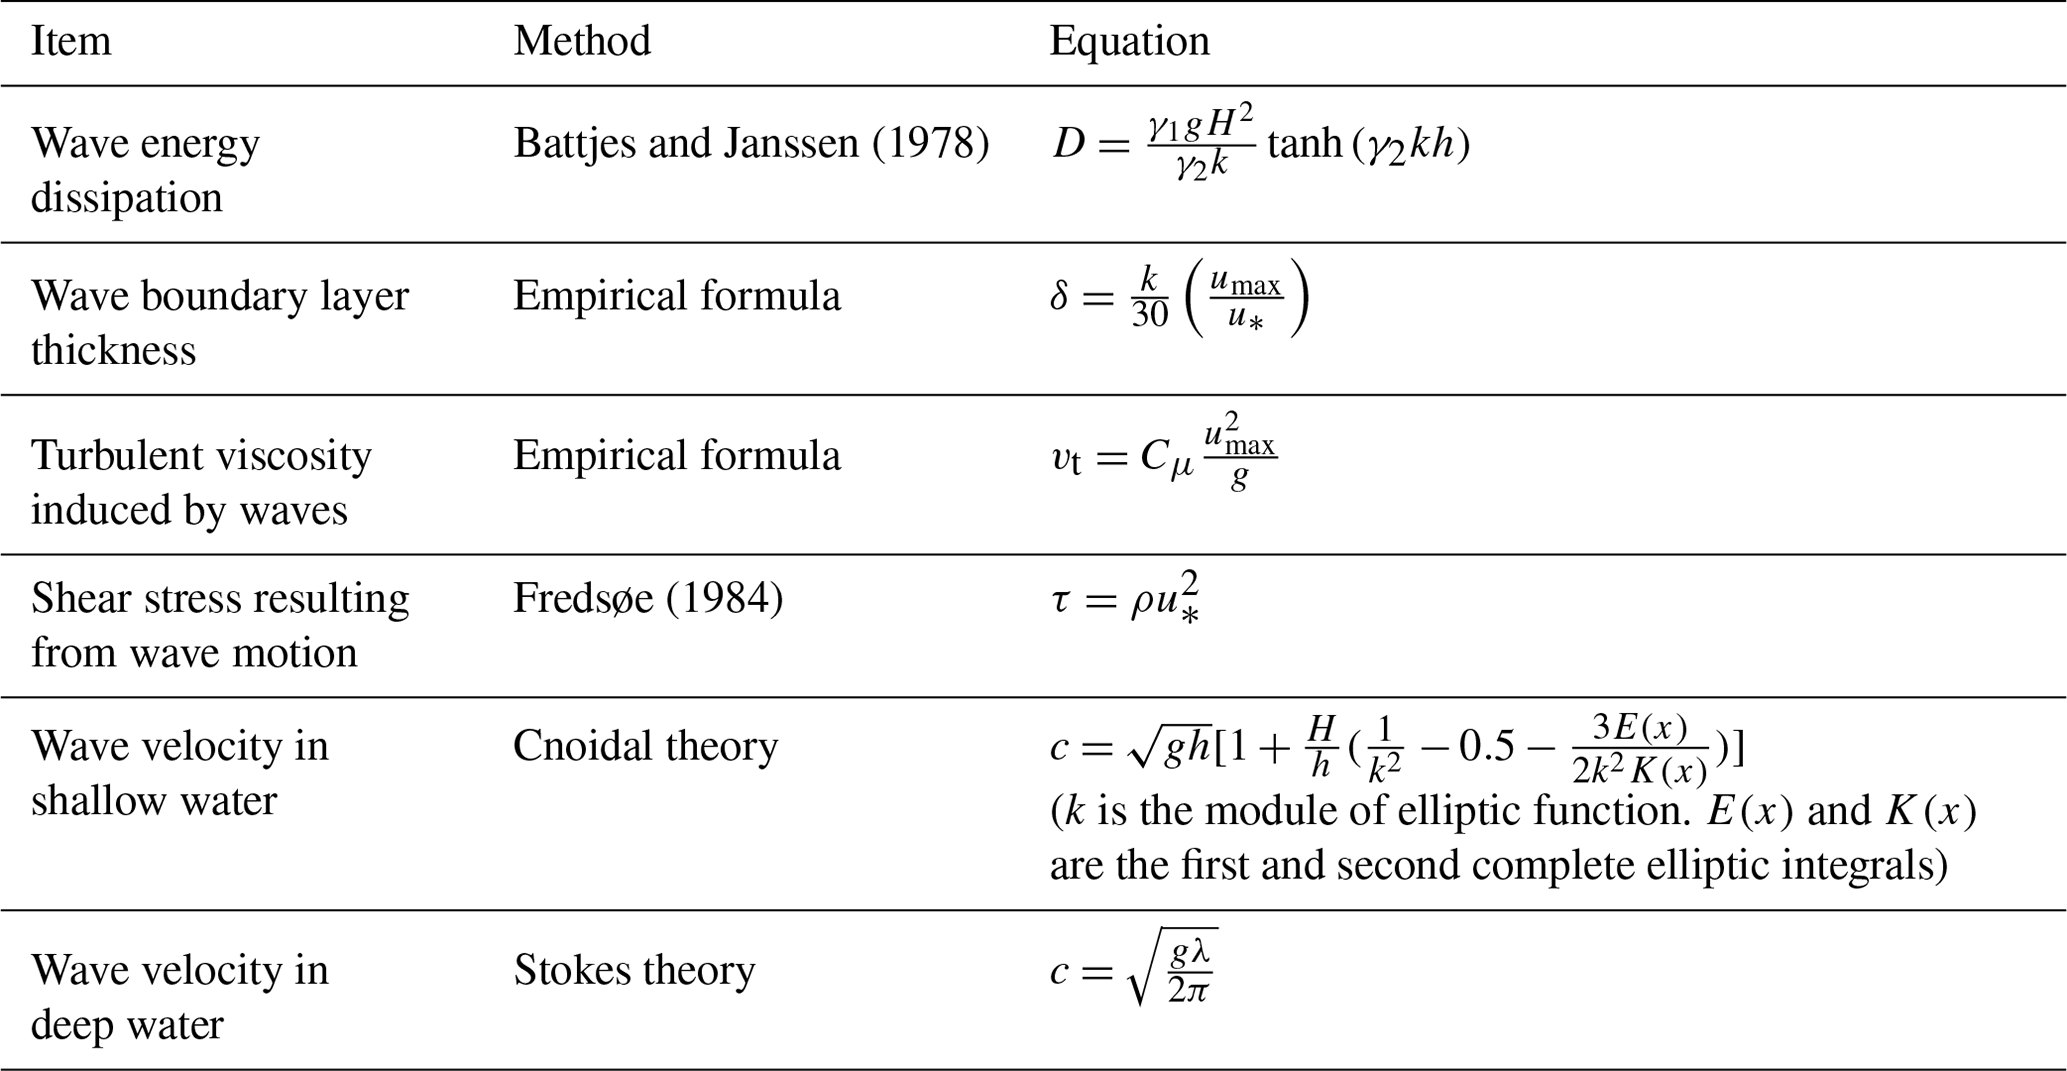
In this paper, the specific formulas of the wave motion are as follows. After examining the influence of waves and currents on sediment transport modeling, we now turn our attention to the specific characteristics of sediment properties in the study area. Section 2.3 provides a detailed account of these properties, which are essential for understanding the local sediment dynamics and will be crucial for the model's calibration and validation processes.
2.3 Non-constant sediment properties
Generally speaking, sediment data may have different particle size, sorting, porosity, and relative density equivalence, and they are not uniform. These characteristics lead to the increase in computational complexity (Adnan et al., 2019), so most studies have set the sediment parameters in the study area as a constant parameter for calculation (Mohd Salleh et al., 2024; Auguste et al., 2021). Actually, the spatial distribution of sediment parameters is not constant. Seabed sediment is not homogeneous, and as the distance from the shore increases, the grain size of the deposited sediment continuously decreases. Some research has proven the validity of the sand transport model with spatially variable sediment properties (Doroudi and Sharafati, 2024; Bui and Bui, 2020). Sediment properties can be obtained by a direct method and an indirect method. The indirect method includes a theoretical formula and an empirical formula, while the direct method is sampling (Claude et al., 2012; Leary and Buscombe, 2020). Studies have shown that indirect methods are less effective than direct sampling (Claude et al., 2012). In this paper, sediment sampling is conducted using a clam grab sampler to collect surface geological samples from targeted sea areas. The study area is divided into river channel and estuary segments, with sediment samples collected at consistent intervals (Fig. 1c). We sampled 15 points in the estuary of the lower reaches of the Changhua River and 40 points in the channel. Due to issues with the sample data from the 40th sampling point in the channel, it was decided to exclude the data from this point. To ascertain sediment parameters, including grain size and sorting factors, a laser particle size analyzer was utilized.
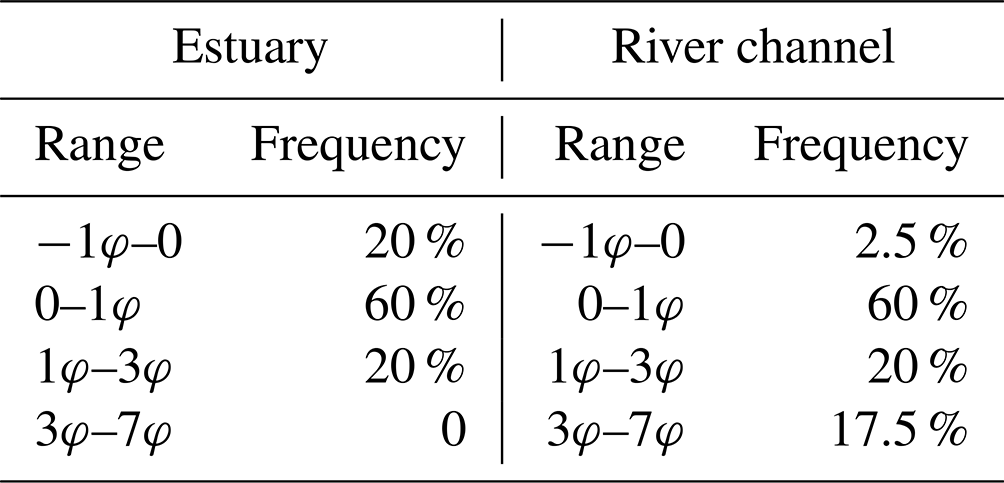
After selection, the analytical process detailed particle size and sediment segregation data. Grain size parameters are quantitative representations of the grain size characteristics of the clastic material in terms of certain values. The individual grain size parameters and their combined characteristics can be used as the basis for discriminating the depositional hydrodynamic conditions and depositional environment. The commonly used parameters are mean particle diameter (Mz), sorting coefficient (δi), and median grain diameter (Φ50). Here, φ represents the Udden–Wentworth scale (Udden, 1914), a logarithmic scale used to classify sediment grain sizes (Wentworth, 1922). The high proportion of samples with smaller median grain diameters (0–1φ) suggests that these areas are likely under higher-energy hydrodynamic conditions where coarser particles settle initially. The lower proportion of samples with larger median grain diameters (3φ–7φ) indicates that these areas may be in lower-energy environments where finer particles are more likely to be transported and deposited. Samples with median grain diameters between 1φ and 3φ represent intermediate energy transition zones. Through these data (Table 2), we can conclude that the majority of the areas are characterized by turbulent, high-energy hydrodynamic environments, while fewer areas are associated with static, low-energy conditions.
Table 2Distribution of sediment grain size classes in estuary and river channel.
The surface sediment particles in the nearshore area of the Changhua River's course are mainly divided into three grain size components: gravel (> 2 mm), sand (0.063–2 mm), and silt (0.004–0.063 mm), with relative percentages of 9.28 %, 72.18 %, and 18.54 %, respectively. Based on the sampling and testing results of the river course (Fig. S2), we can obtain the histogram of the component percentage for each sample. It is obvious that the sediment composition in the river channel is dominated by sand, followed by silt.
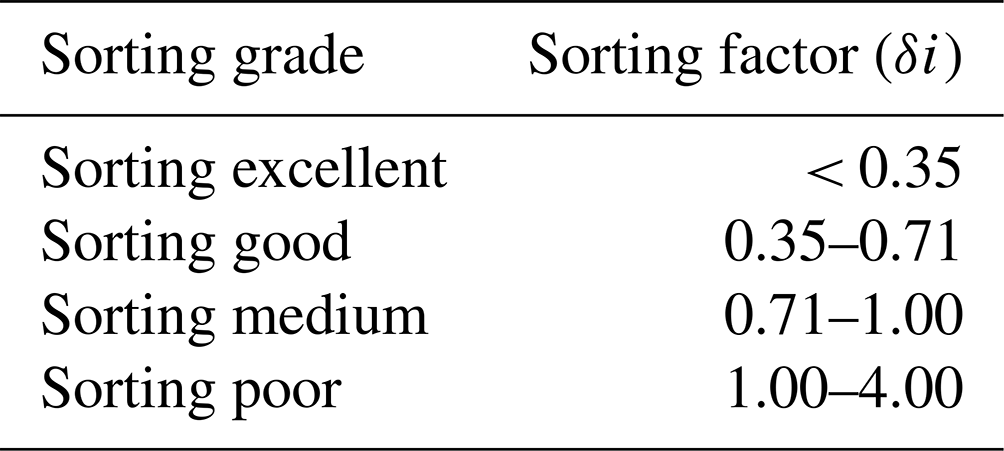
According to the classification criteria of the sorting coefficients by Folk and Ward (1957; Table 3), sediments from the Changhua River estuary in the lower reaches exhibit medium sorting with coefficients of most samples between 0.71–1.00 and a median grain diameter predominantly under 1.5 mm, characterized mainly by sand. In contrast, sediments within the river stretch between Baoqiao station and the lower reaches are coarser with poorer sorting, evidenced by a sorting coefficient exceeding 1.00 in 23 out of 40 samples (over 57 %).
To ascertain the sediment composition and the dry bulk density in the estuary, 15 samples were collected from the Changhua River estuary. These samples were dried to measure mass and volume, thereby determining the dry bulk density of the sediment. After calculating, the dry bulk density is 1210.9 kg m−3, which is used in the sand transport model. This analysis is crucial for model accuracy and understanding sediment behavior in the estuarine environment. According to the sampling position, the research area is divided into areas. After sorting and interpolation, the spatial variation in sediment particle size data and sorting data in the study area is obtained (Fig. 2).
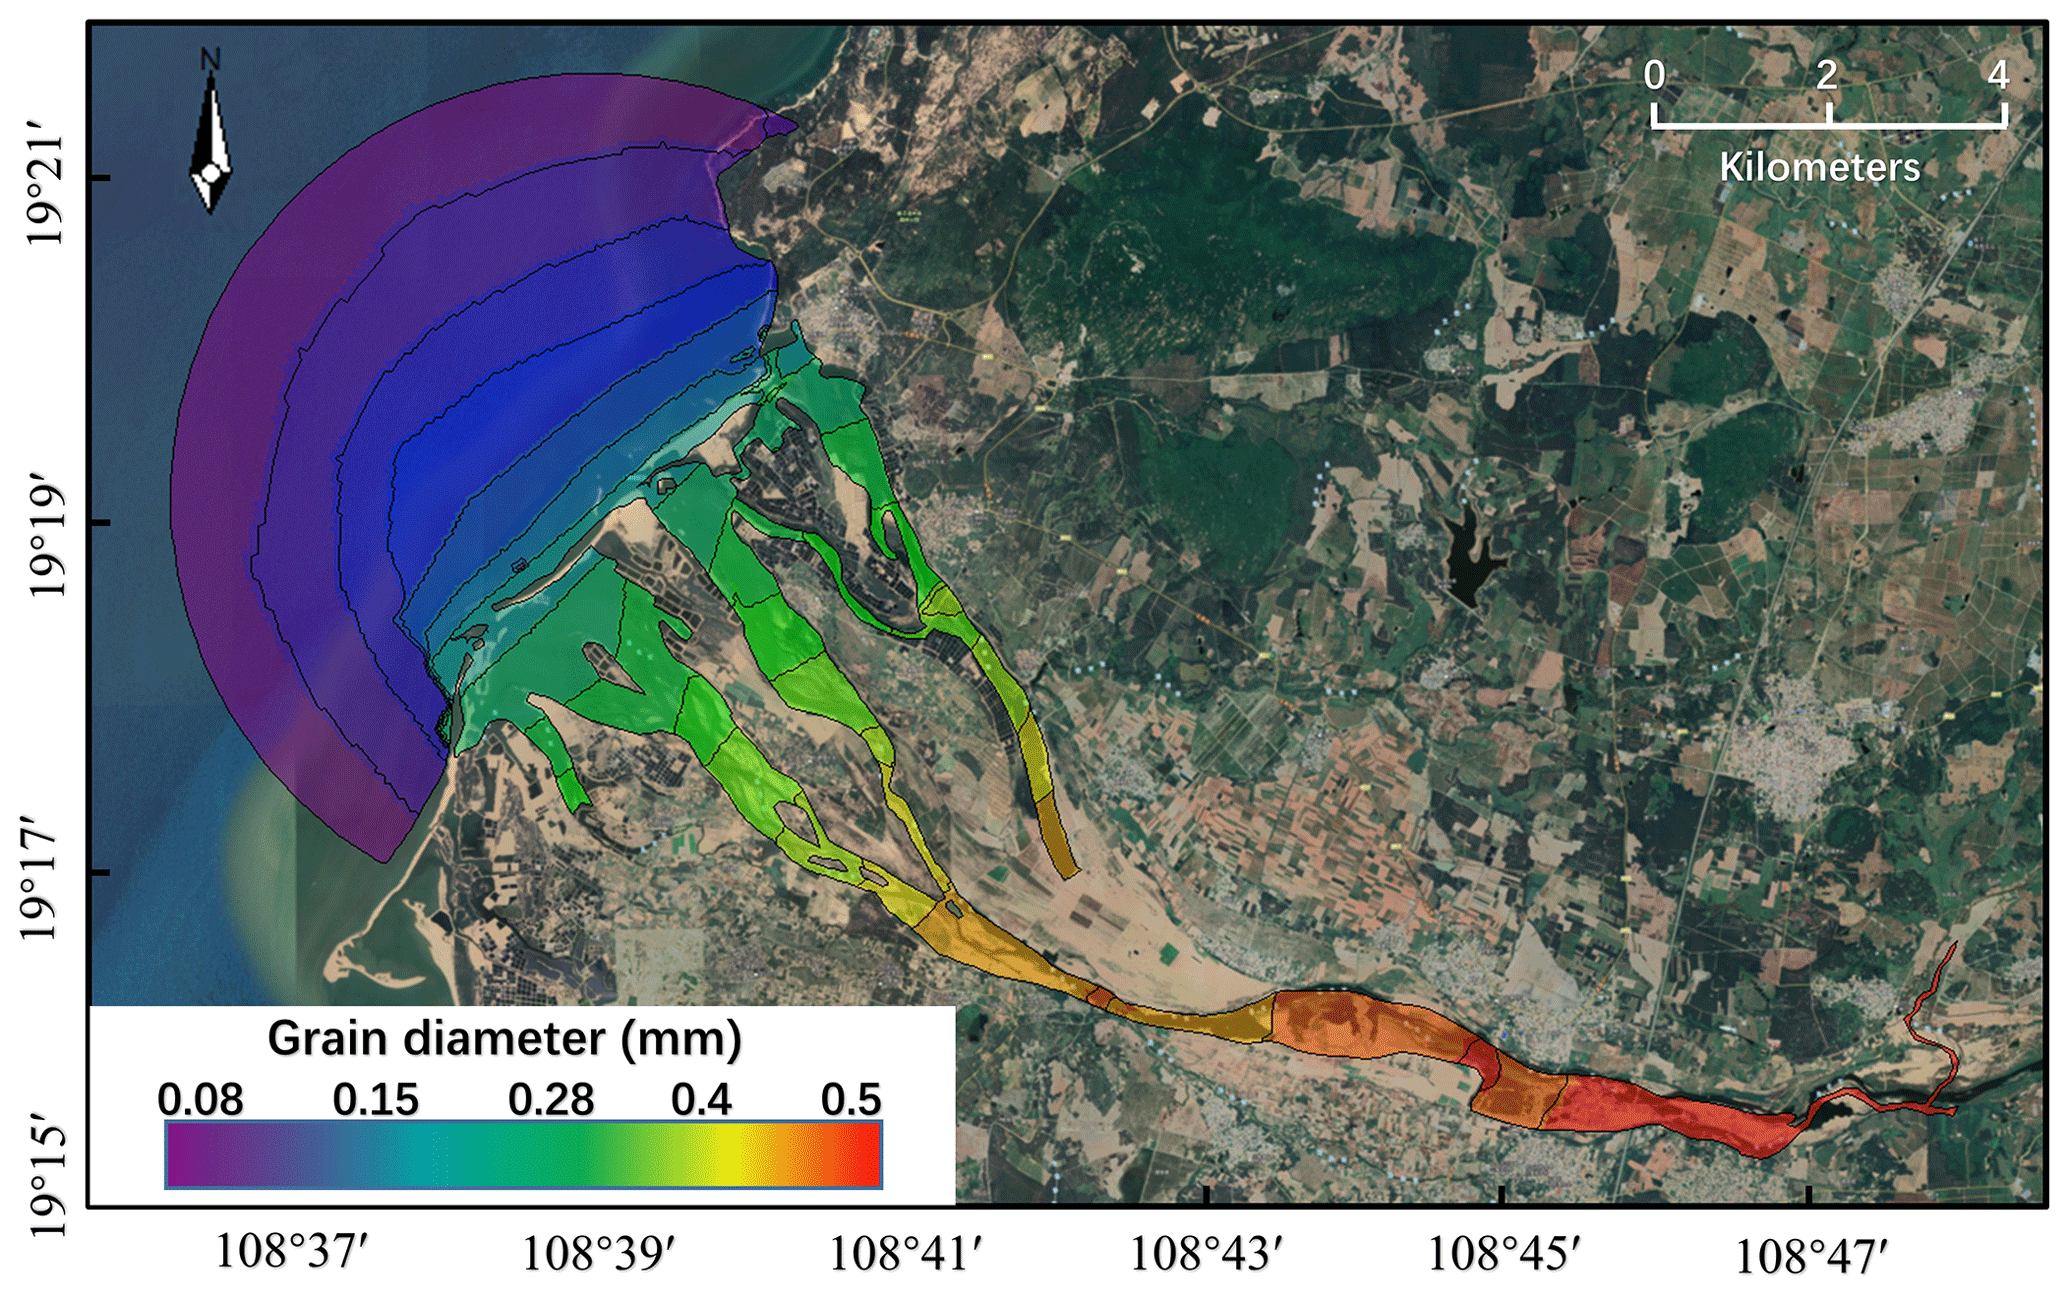
Figure 2Variation in sediment particle size data (adapted from the Tiandi Map, Hainan, https://hainan.tianditu.gov.cn/, last access: 4 October 2024).
2.4 Reliability evaluation index
In this paper, the Nash–Sutcliffe efficiency (NSE) coefficient and root mean squared error (RMSE) are used to evaluate the reliability of the model. The calculation formulas (Nash and Sutcliffe, 1970) are as follows.
In the equations, Mi is the model simulation value at the ith moment, Oi is the measured value at the ith moment, is the average of the measured values of the site at all simulation moments, and N is the total number of all simulation moments. When 0.65 ≤ NSE < 1, the fitting degree of the model is excellent; when 0.5 ≤ NSE < 0.65, the fitting degree of the model is good; when 0.2 ≤ NSE < 0.5, the fitting degree of the model is general; when 0 < NSE < 0.2, the fitting degree of the model is poor; and when NSE < 0, the fitting degree of the model is very poor.
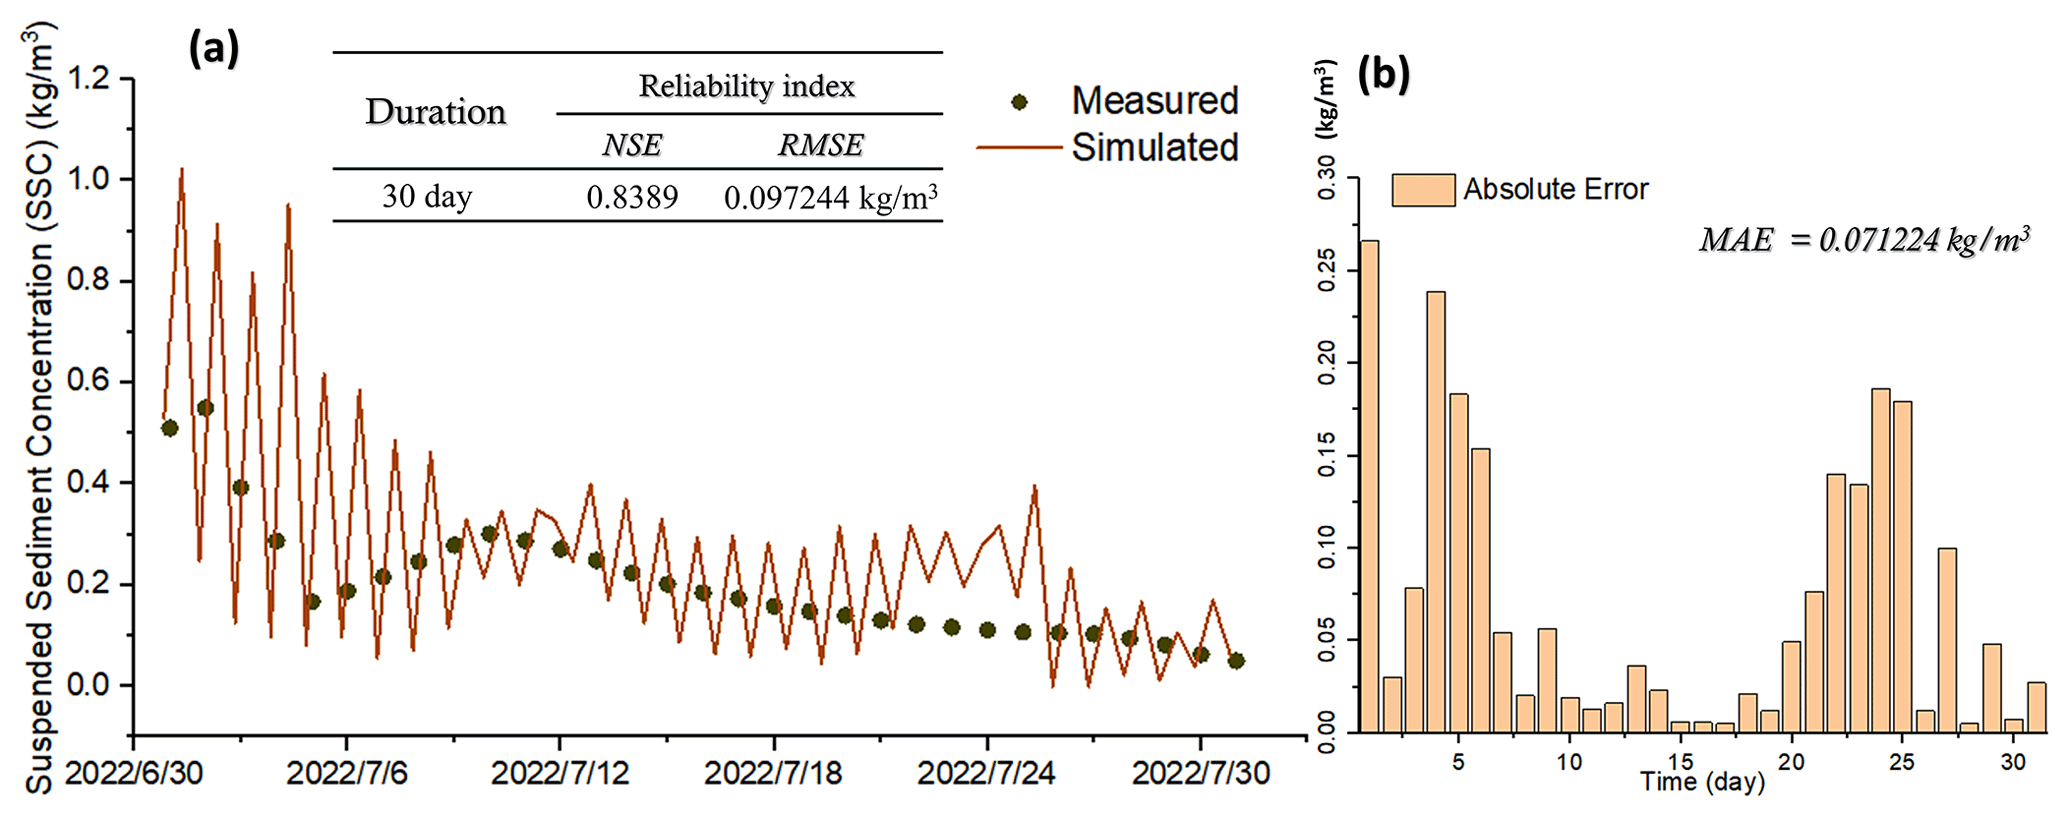
The study area is situated in the western part of the island of Hainan, mainly encompassing the lower reaches of the Changhua River and its estuary. The approximate coordinates range from 108°36′ to 108°48′ E and 19°15′ to 19°22′ N (Fig. 3). The study area covers a large part of the region from the town of Chahe to the estuary of the Changhua River, including towns such as Changhua, Sigeng, Sanjia, and Wulie, among others. The prognostic, unstructured-grid, finite-volume, free-surface, 3D primitive equation coastal ocean circulation model (FVCOM) (Chen et al., 2003) was used to simulate the hydrodynamic background and hydrological features. It has been widely used for the study of coastal oceanic and estuarine circulation (Jiang and Xia, 2016; Huang et al., 2008; Lai et al., 2018; Chen et al., 2008). The model's open boundary relies on forced tidal level data extracted using Earth and Space Research's (ESR) MATLAB “Tide Model Driver” (TMD) toolbox (https://www.esr.org/research/polar-tide-models/tmd-software/, last access: 20 September 2024) from the TPXO 6.2 global tidal wave prediction model.
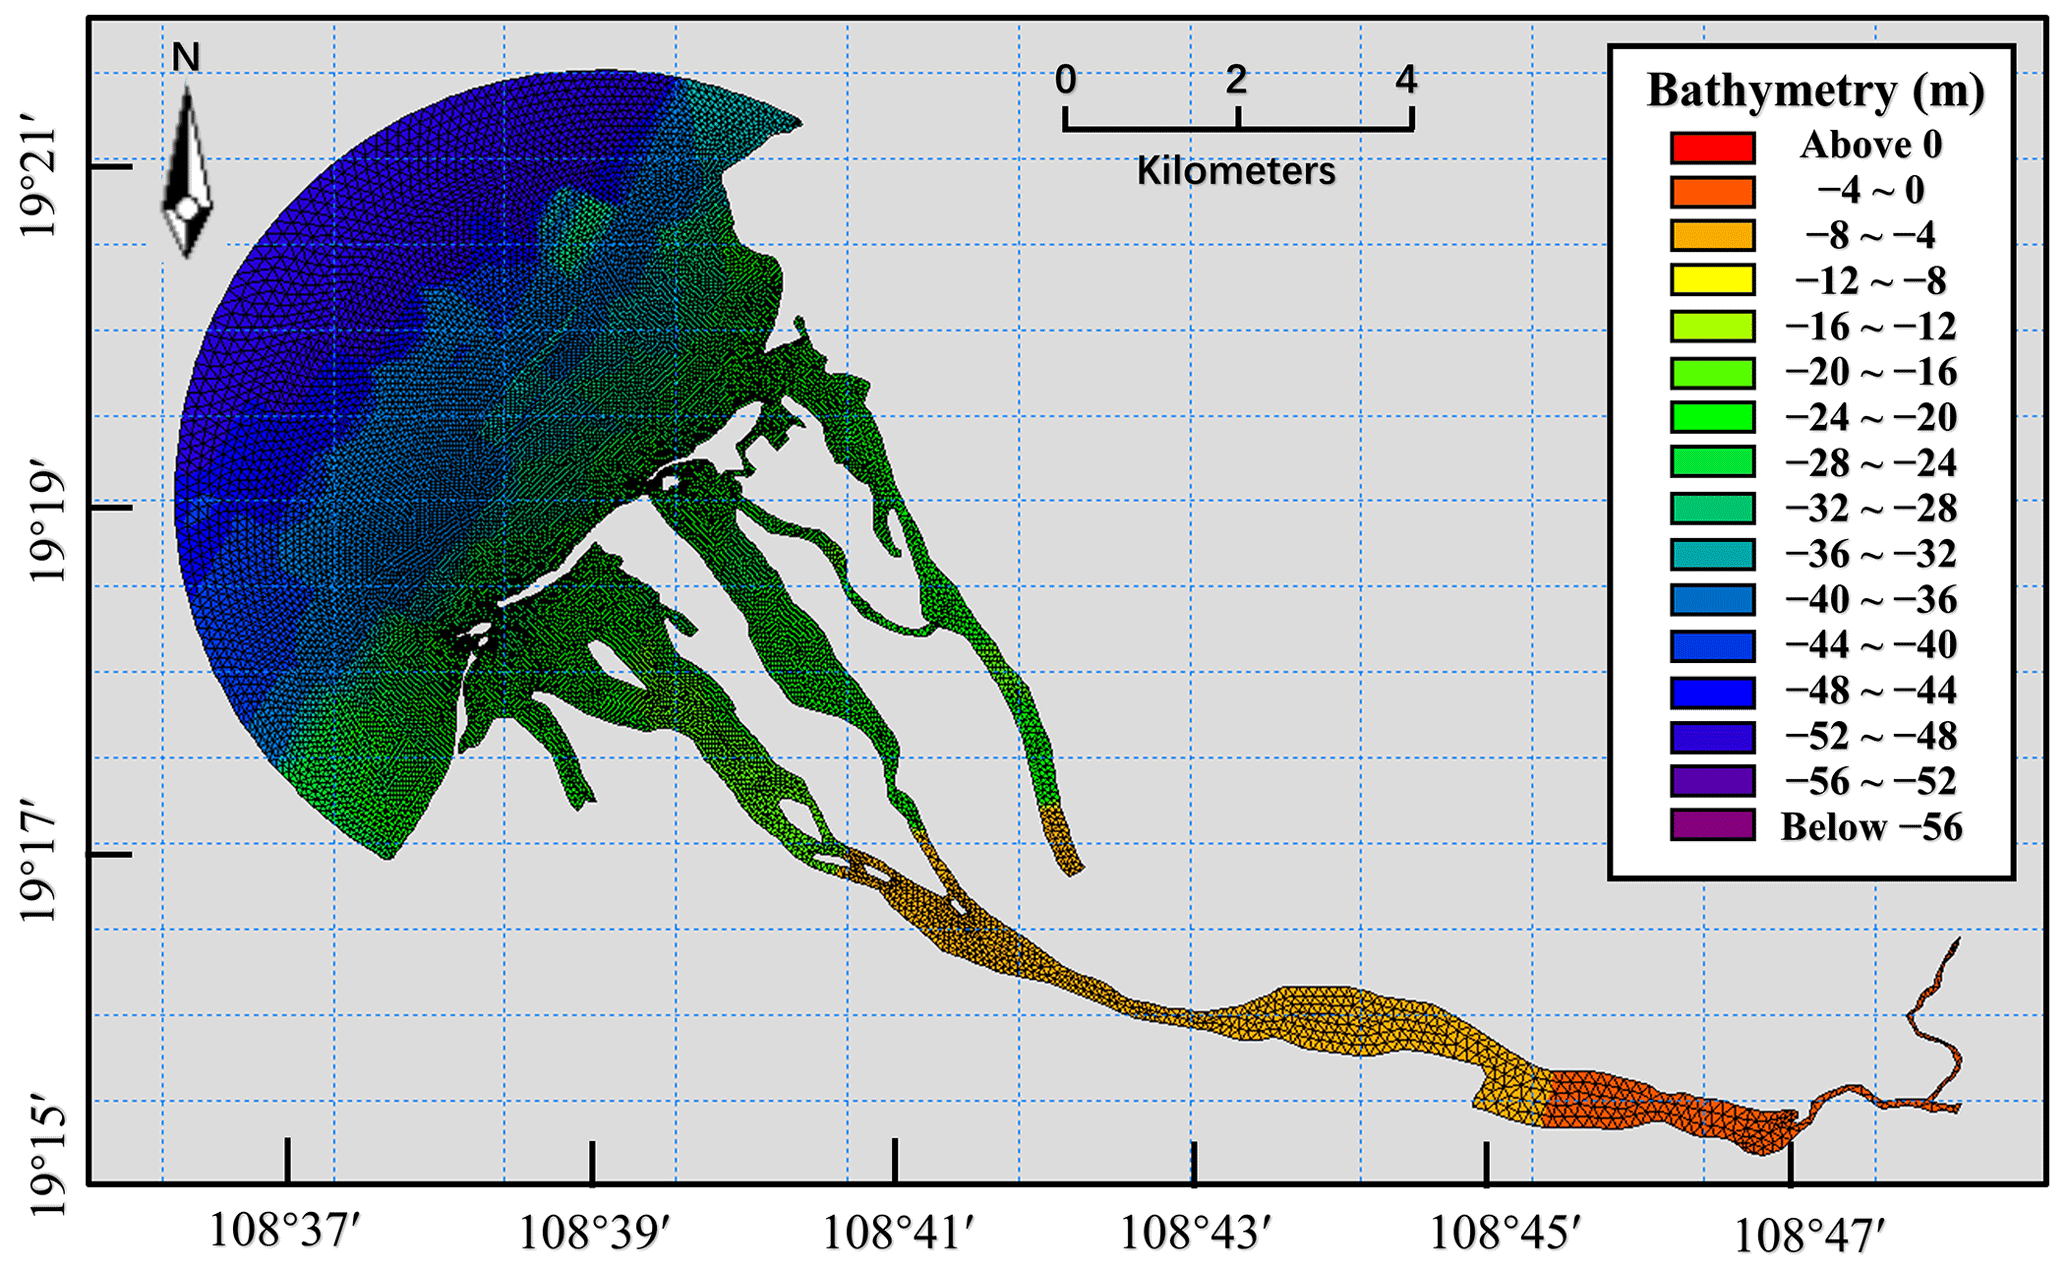
Figure 3Grids and boundaries of study area.
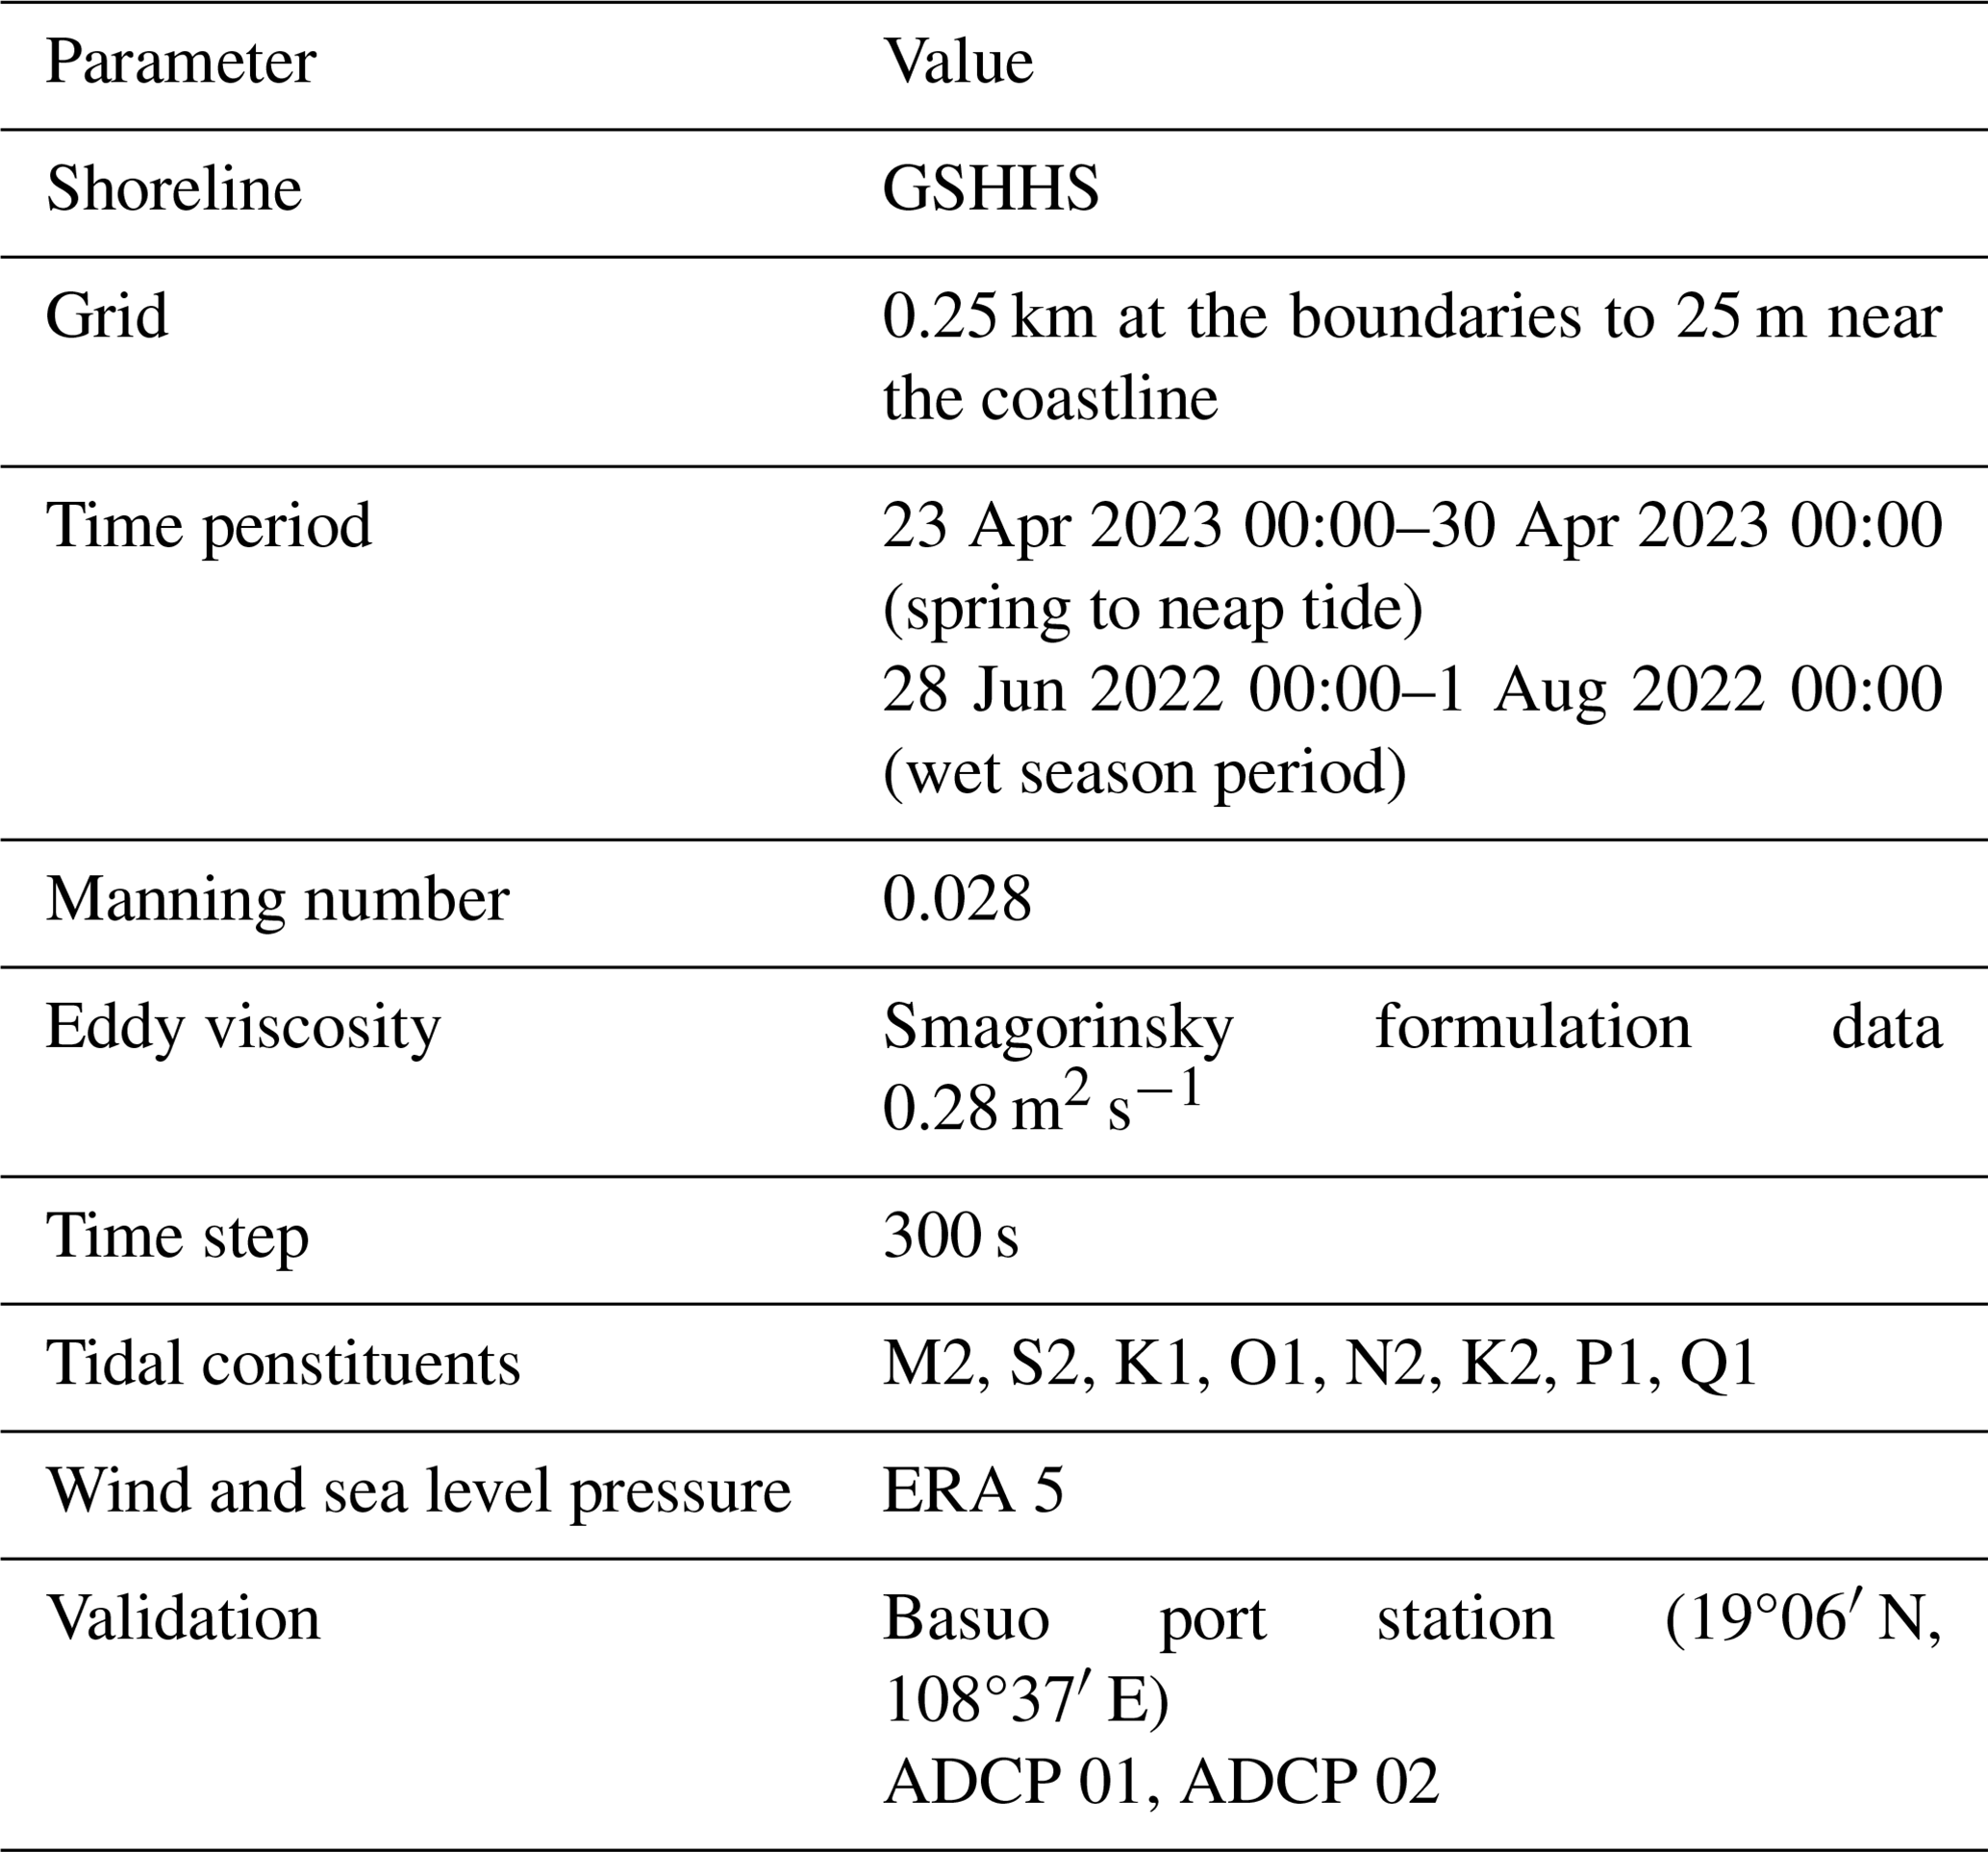
In the study, we utilized the Global Self-consistent, Hierarchical, High-resolution Geography Database (GSHHS) to extract the shoreline data at full resolution. Bathymetric data are derived from ETOPO1 global seafloor topography data and in situ measurements using acoustic Doppler current profiler (ADCP). The spatial resolution of ETOPO1 data is , which is insufficient for the research requirements. ADCP depth measurements have higher density in nearshore areas and provide actual measured data with higher accuracy. The model employs a triangular unstructured grid. To enhance computational accuracy and reduce computation time, the density of boundary nodes gradually decreases from nearshore to offshore. In the offshore region, the grid density is lower, with a resolution of 0.25 km, while the nearshore part of the open boundary has higher grid resolution. In the main research area near the river channel, the grid resolution is highest, reaching 25 m. The entire study area grid comprises a total of 13 814 computational nodes. The wave parameters at the open boundary are set to fixed values, referring to the annual average frequency of occurrence of wave heights in various directions at the Dongfang ocean station over the years (Ding, 1990; Hu, 2009; Wang, 2023).
The model's open boundary conditions are defined by the forced tidal water level, incorporating eight primary tidal components: M2, S2, K1, O1, N2, K2, P1, and Q1. The model's closed boundary aligns with the terrestrial boundary, where the normal velocity of ocean currents is set to zero, precluding any exchange of temperature and salt between land and seawater. The time resolution of tidal level data is 1 h. There are 121 open boundary control points. The model also integrates the impact of wind fields, with data sourced from European Centre for Medium-Range Weather Forecasts (ECMWF) at a resolution of . This dataset encompasses the u (east–west) and v (north–south) components of the wind vector, along with sea level pressure. The upstream boundary of the model is set based on the multi-year average monthly flow and sediment concentration data from the Baoqiao Hydrological Station in the town of Chahe. The upstream boundary is assigned a flow rate of 44 m3 s−1, and the suspended sediment concentration is set at 5 g m−3. The median grain size and sorting coefficient of the initial sediment distribution are determined through the partitioning based on the measured sediment data from Sect. 2.3. The porosity is set to 0.4, and the sediment density is 2650 kg m−3. In this study, we calibrated the hydrodynamic model using water level data from April and May 2022. The data were collected from Basuo port station. The one-at-a-time (OAT/OFAT) method (Czitrom, 1999) is used to modify the parameters, an effective local sensitivity analysis technique. In each experiment, we alter one factor while holding the others constant. During the calibration process, our primary focus was on the model's hydrodynamic response. This was achieved by adjusting the flow resistance parameters and the bed roughness coefficients within the model. The calibrated model parameters are presented in Table 4.
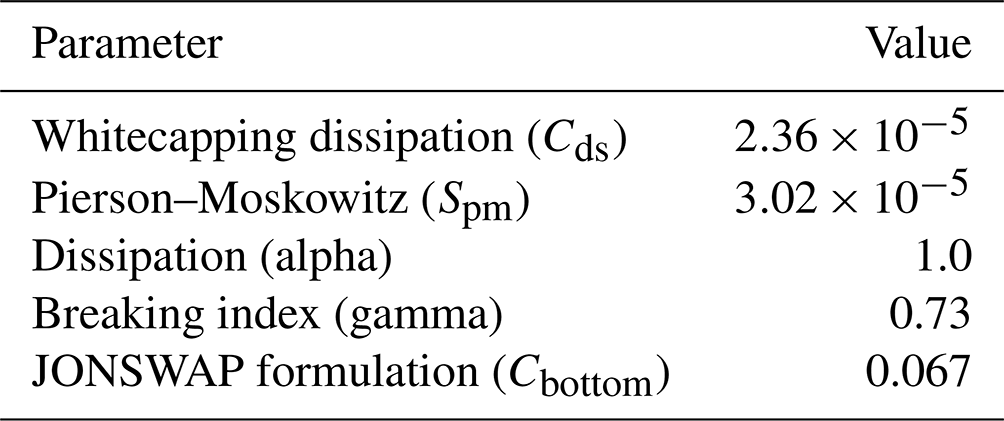
This study selects the widely used third-generation Simulating Waves Nearshore (SWAN) model (Deltares, 2024) for the numerical simulation of wind waves in this region. The wave fields are driven by wind and current from the hydrodynamic model. The parameters used in the model setups are based on the values listed in Table 5. The wave model at the open boundary is defined by the JONSWAP (Joint North Sea Wave Observation Project) spectrum, with a spectral resolution of 40 frequency bins and 36 directional sectors. We calibrate the parameters using multi-year wave data from the Dongfang ocean station. The wind speed and wind direction are from the ERA5 reanalysis data provided by ECMWF. The peak parameter (γ) of the JONSWAP spectrum, indicative of the wave asymmetry, was specified at 3.3, and the spectral width parameter was set to 0.07 to define the shape of the wave spectrum.
To substantiate the accuracy of our hydrodynamic model, we incorporated wave validation using comprehensive wave data from Wang (2023), which include the maximum wave height and peak wave period observed throughout November 2013. The wave validation results are depicted in Fig. 4. The figure illustrates a substantial agreement between the modeled and observed wave parameters, affirming the reliability of our model in reproducing wave conditions. The agreement between the model's wave predictions and the empirical data underscores the robustness of our wave model.
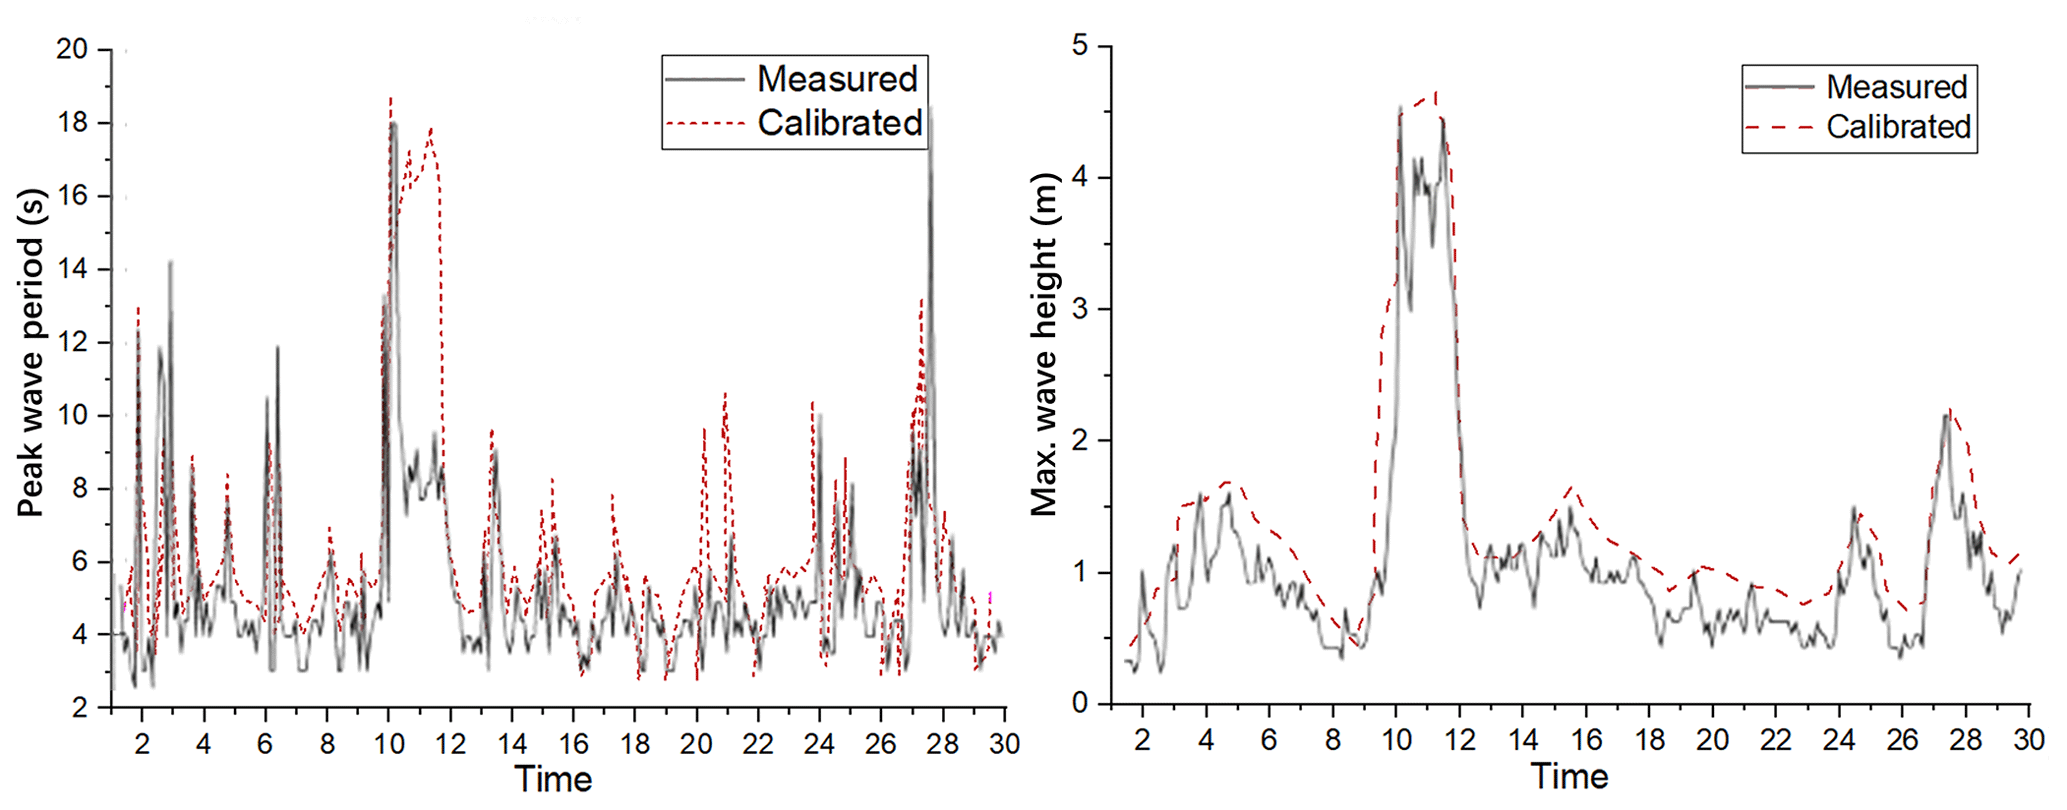
Figure 4Comparison of maximum wave height and peak wave period calculated with the calibrated model against those measured in the field (adapted from the study by Wang, 2023).
A mathematical model established through a wave–current coupling approach can accurately describe the motion laws of wave-generated currents and consider the impact of nearshore currents on wave propagation. It also reflects the interaction between nearshore waves and currents. In this paper, a 3D sediment transport model is constructed using the Model Coupling Toolkit (MCT) to perform real-time coupling between the hydrodynamic model FVCOM and the SWAN wave model, employing the same unstructured grid for the coupling (Chen et al., 2018; Ji et al., 2022). The coupling process can be summarized as follows: the FVCOM hydrodynamic model and the SWAN wave model transmit the calculated 3D flow field and wave data to the sediment module, which then calculates the suspended and bed load sediment transport rates, achieving data linkage between the 3D wave–current coupled model and the sediment transport model.
4.1 Verification of hydrodynamic model
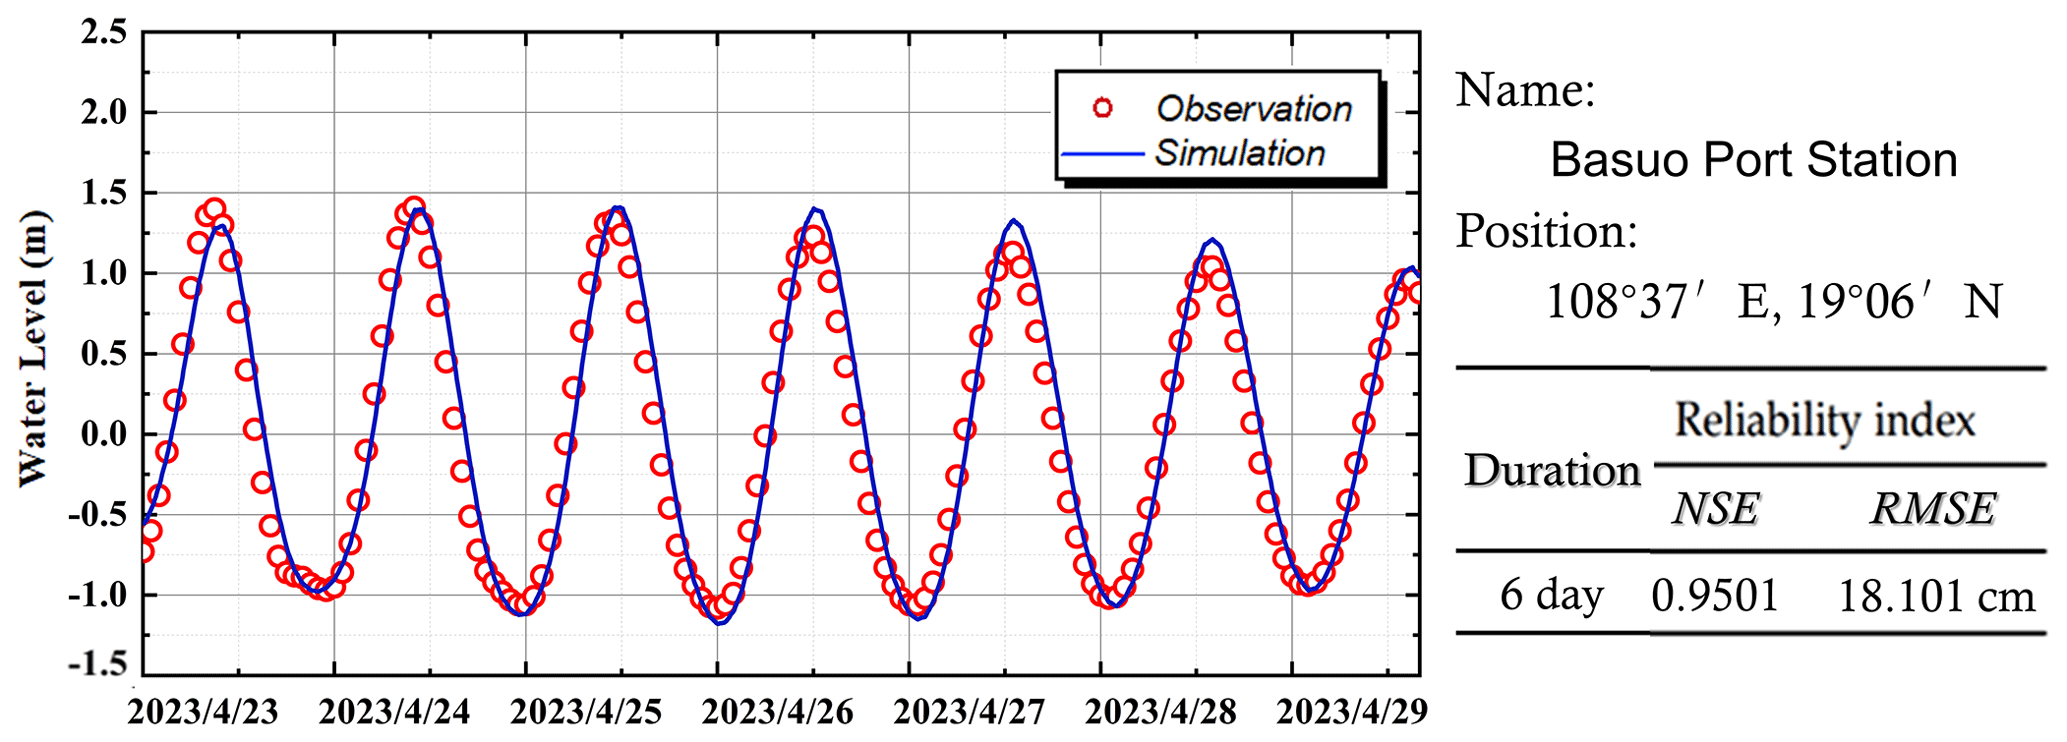
In order to ensure the validity of the model, the tidal current data of one tide gauge station and two ADCP points in the study area are compared and verified. Figure 5 shows the hourly water level comparison between the measured tidal water level at Basuo port station (19°06′ N, 108°37′ E) and the model simulation results. Model validation occurs from 10:00 CST (all times are in China standard time) on 23 April 2023 to 00:00 on 30 April 2023. After calculation, the RMSE of the simulation results is 18.101 cm and the NSE is 0.9501, which is within the acceptable range. This shows that the model is reliable, meets the demand, and can be used to simulate the tidal current in the research area of the lower reaches of the Changhua River.
During the sea trial, two points were selected to continuously observe the velocity and direction of seawater. To capture the tidal cycle, continuous measurements were taken over a 25 h period. Information about the position and observation time of the measuring point is as follows (Table 6 and Fig. 1b).
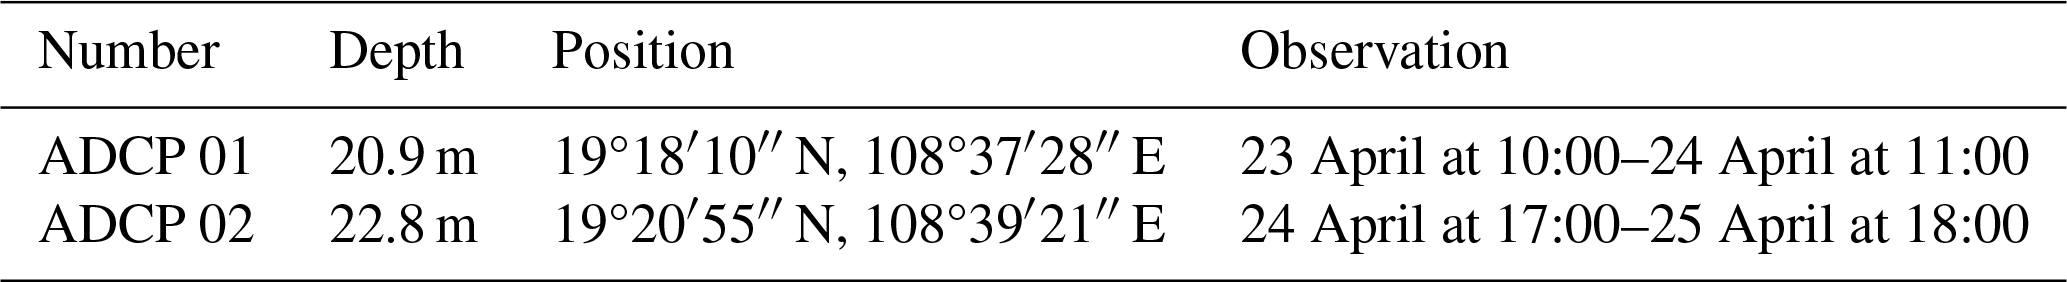
Current velocity and direction verification at the Changhua River estuary involves a 5 min time resolution analysis using an acoustic Doppler current profiler (ADCP). Located over 2 km offshore with a water depth of 20.9 m, ADCP 01's data are compared against simulations at 5 min intervals. The 25 h observation period, from 10:00 on 23 April 2023 to 11:00 on 24 April 2023, encompasses a full lunar day, providing a comprehensive dataset.
Figure 6 provides a comparison between the model simulations and the in situ ADCP measurements, highlighting the model's accuracy in capturing the tidal current dynamics. The model accurately replicates the speed fluctuations, affirming its capability to capture the dynamics of the study area. The proximity of measurement point ADCP 01 to the land, coupled with its relatively shallow water depth, results in seawater being more susceptible to obstruction by the topography and friction from the seafloor at this location. This results in a reduced error, validating the model's performance. The consistency between the model and the measurements confirms the high reliability of the model for future research applications.
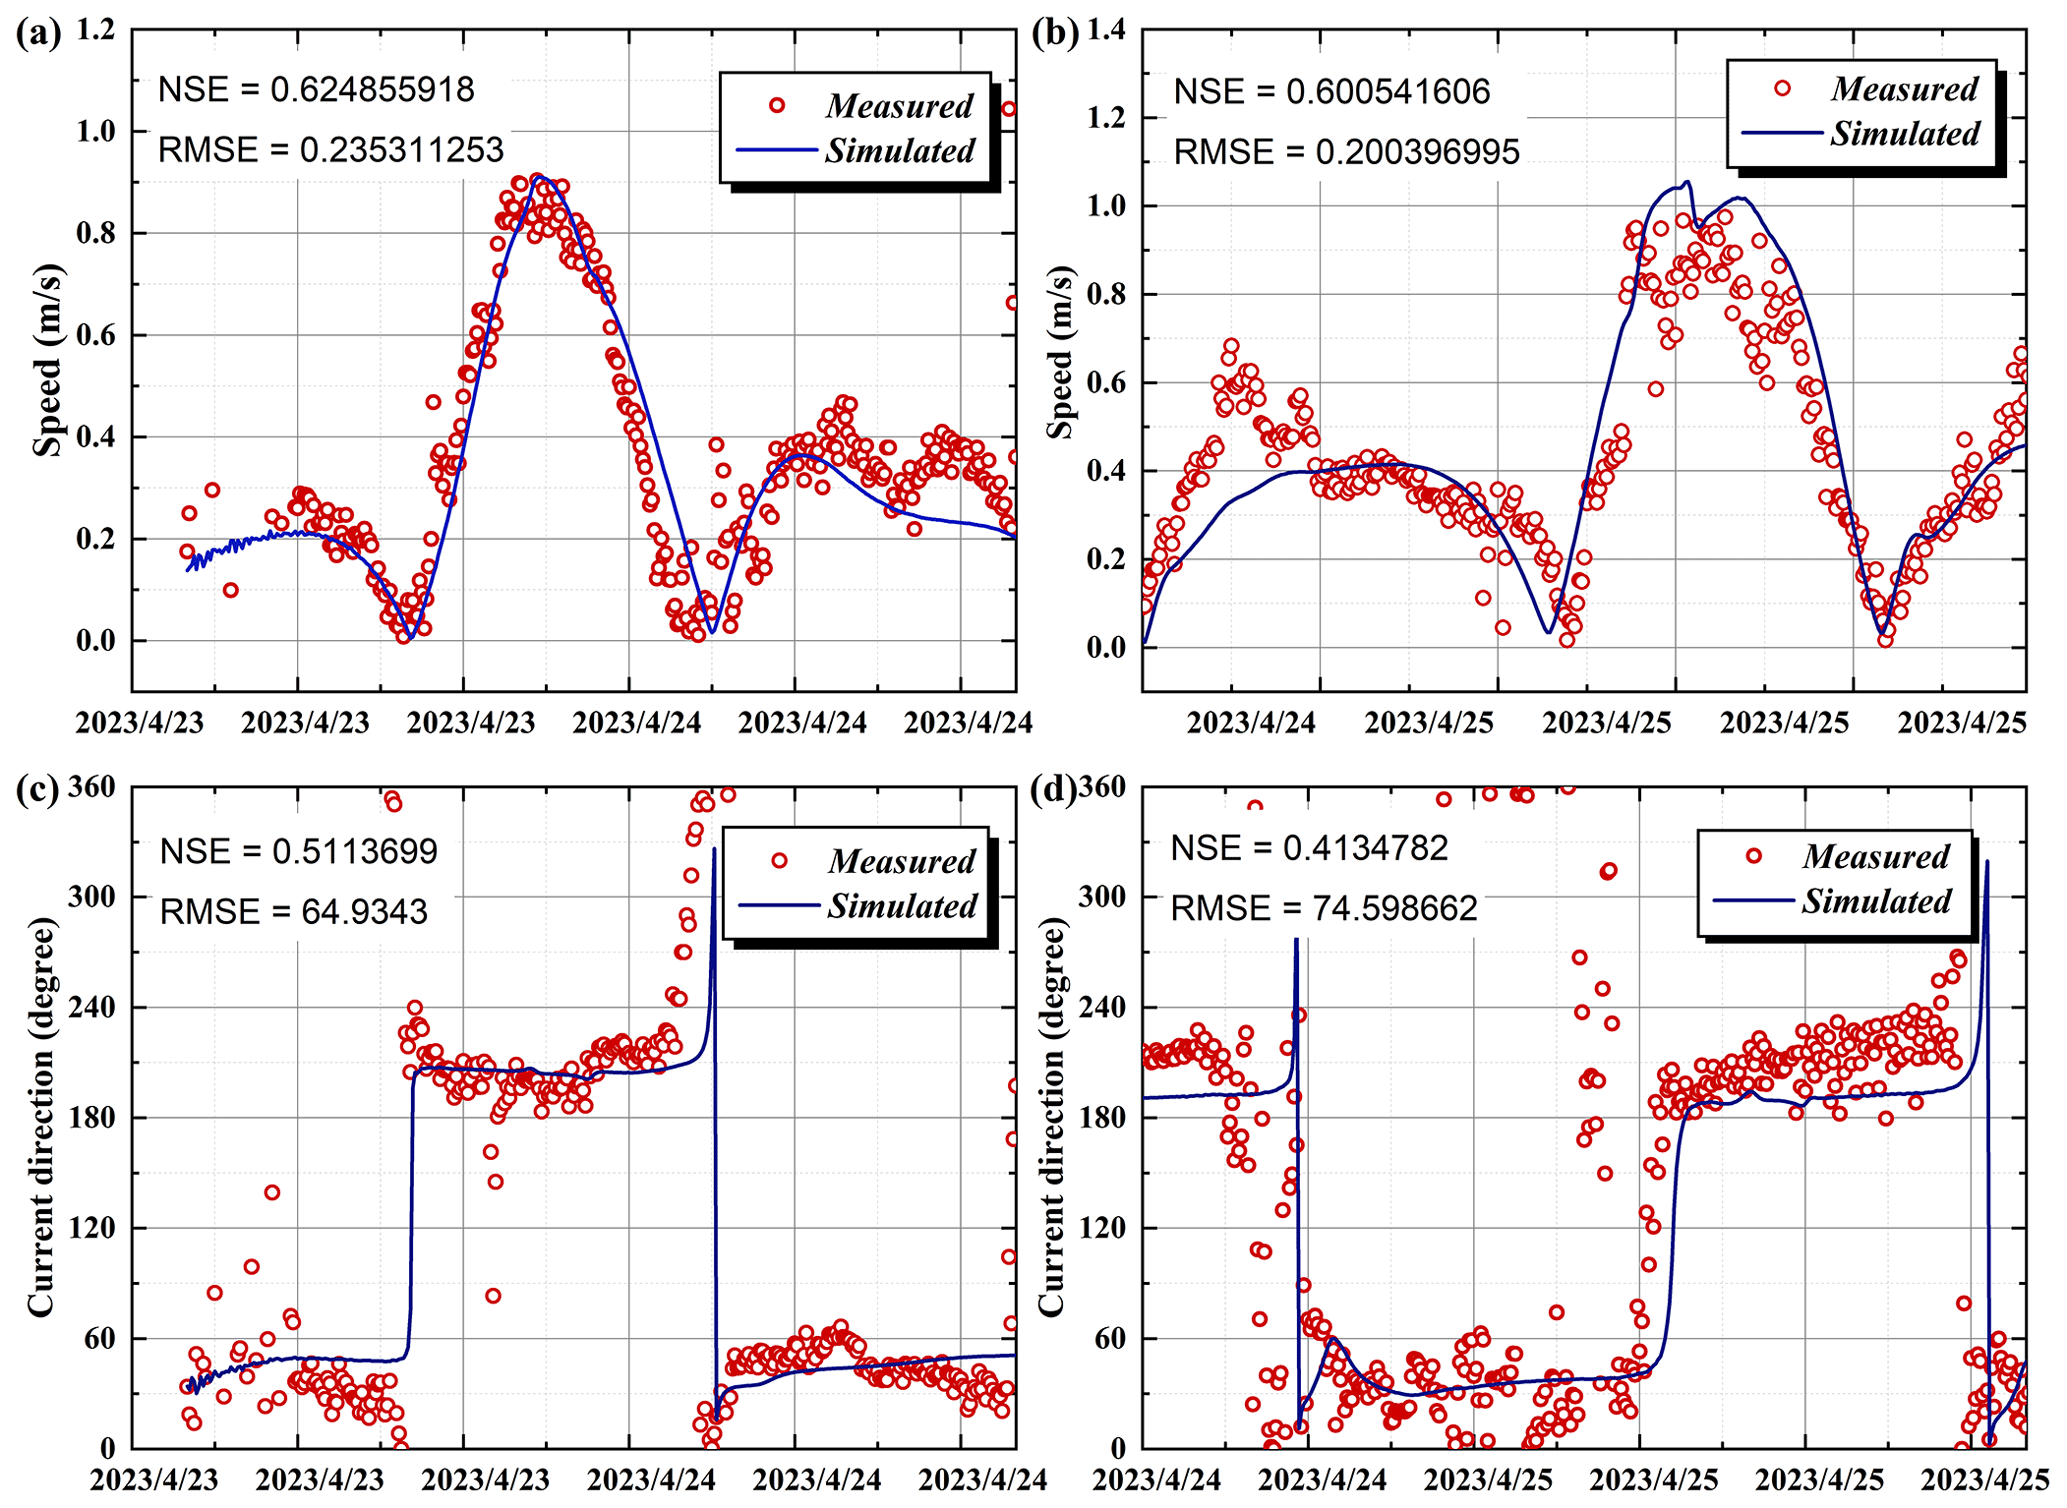
Figure 6Depth-averaged current speed and direction verification. (a) Speed verification of ADCP 01; (b) speed verification of ADCP 02; (c) verification of current direction of ADCP 01; (d) verification of current direction of ADCP 02.
4.2 Results of hydrodynamic model
The hydrodynamic simulation outcomes, as depicted in Fig. 7, indicate a predominantly northeast–southwest reciprocating current pattern within the study area. This flow is aligned parallel to the coastline, with the tidal current shifting direction according to the tidal phase.
Figure 7a and b illustrate the flow field in the estuary of the Changhua River. Figure 7a shows the flow field at 23:00 on 23 April 2023, corresponding to the peak of the flood tide. Inside sub-estuary A, due to the topography, a large counterclockwise circulation forms around the central island, accompanied by several smaller vortices, with the overall trend of tidal currents flowing southeast along the river channel. In sub-estuary B, ocean inflows meet with river flows from upstream, ultimately converging into sub-estuary C through the passage between B and C. In sub-estuary C, the flow is more unidirectional compared to A and B, with upstream water flowing into the ocean and then following the northeast-directed tidal current outside the Changhua River estuary. Figure 7b shows the flow field at 13:30 on 24 April 2023 at the peak of the ebb tide. At this time, the circulation inside sub-estuary A reverses to a clockwise direction, and other smaller vortices change direction accordingly, with the overall trend of tidal currents flowing from upstream to the ocean. In sub-estuary B, the dominant force is the high-speed flow from sub-estuary C, which enters B through the narrow passage between B and C, splitting into two opposite directions: one part flows into the ocean, and the other flows upstream, forming a circulation within the river channel. In sub-estuary C, the water flows upstream from the ocean along the river channel.
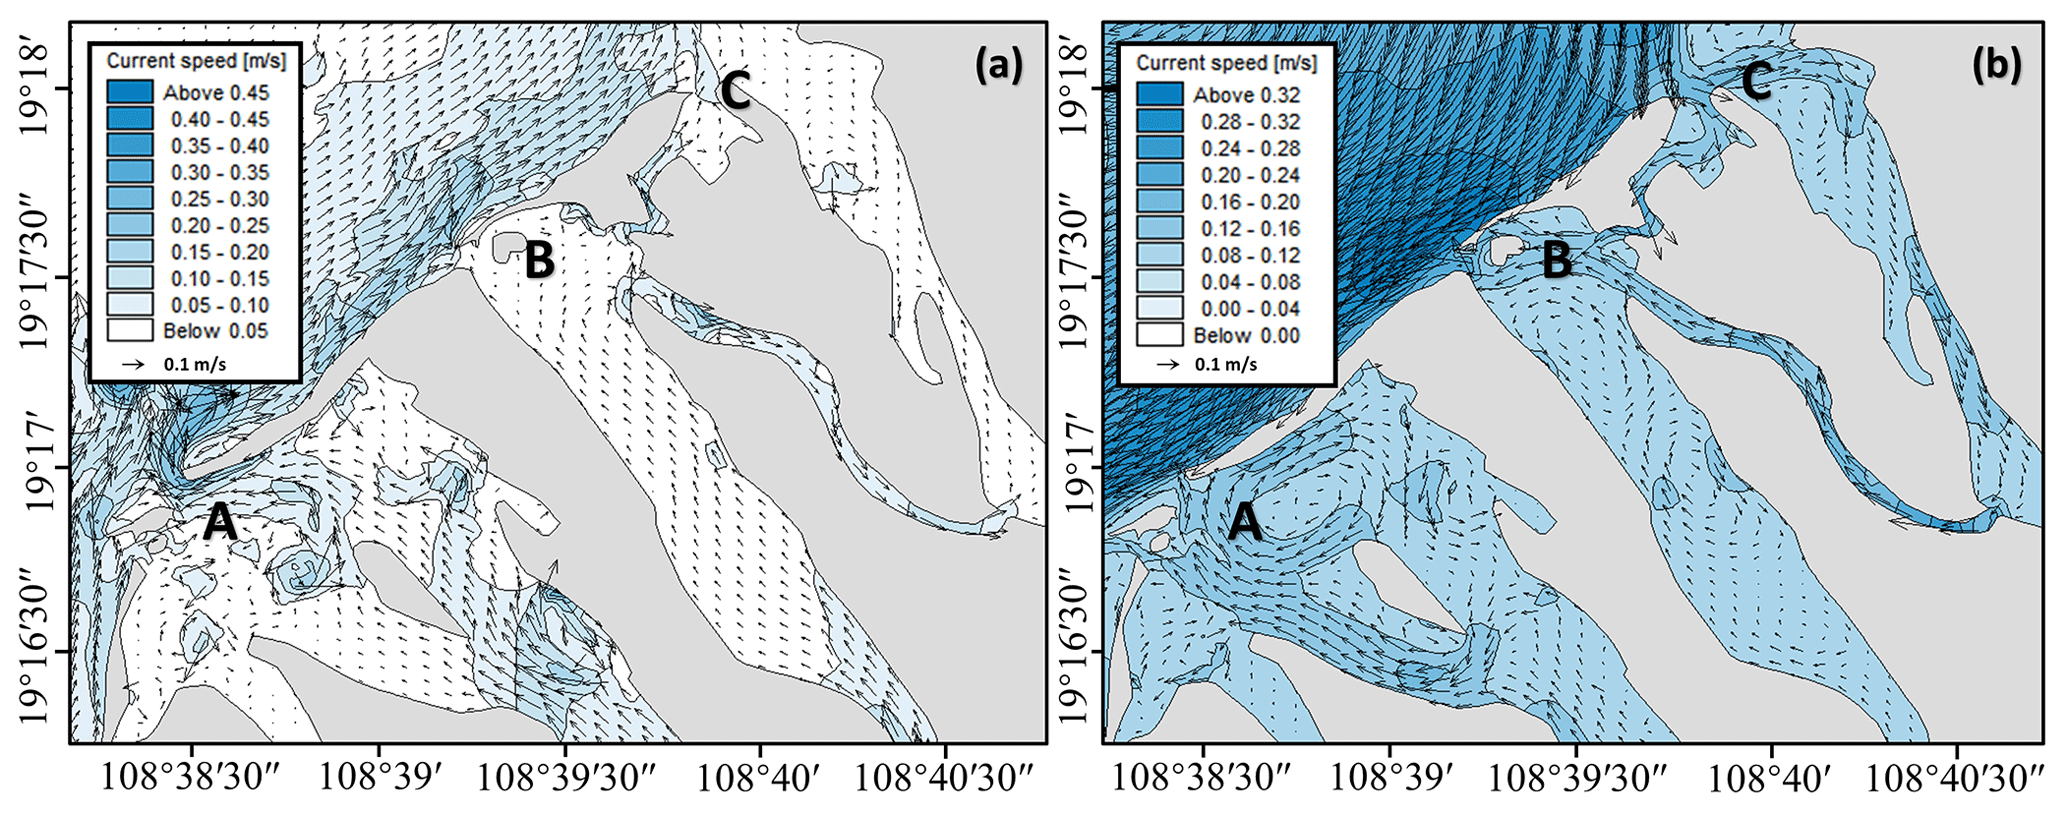
Figure 7Flow field inside the estuary, displaying depth-averaged flow velocities. (a) Moment of the maximum flood current; (b) moment of the maximum ebb current.
To further analyze the characteristics of the flow field in the study area, flow fields are selected for analysis during the transition from low tide to high tide and from high tide to low tide. Figure 8f depicts the location of the research area. Figure 8a shows the flow field at low tide, where the tidal current outside the estuary flows northeast, and water in the main river channel downstream of the Changhua River flows upstream from the ocean. After low tide (during flood tide), water flow velocity gradually increases, with the tidal current outside the estuary consistently flowing northeastward. During this period, the main river channel maintains an eastward flow.
Figure 8b illustrates the moment of flow direction change during flood tide, when the flow direction outside the estuary rotates clockwise along the shoreline from the south (toward Beili Bay). The northern ocean current (outside the harbor of Changhua) also begins to rotate clockwise, flowing into sub-estuary C and then into the ocean through the passage between sub-estuaries B and C, forming a circulation that enhances the clockwise rotation of the northern ocean current. Subsequently, the flow direction gradually changes from northeast to southwest as it moves from the coast toward the open sea. The sand spits at downstream sub-estuaries A and B alter the flow direction and velocity. The sand spit can act as a natural barrier, causing the tidal current to change direction earlier during flood tide.
Figure 8c shows the flow field at high tide, where the tidal current outside the estuary has fully shifted to the southwest while the flow direction further offshore is still transitioning. In the main river channel, the water flows from upstream toward the ocean. Sub-estuaries B and C are influenced by the coastal current outside the northern part of the study area, flowing into the sub-estuary opposite to sub-estuary A. After high tide (during ebb tide), the water flow velocity in the study area gradually increases, with the tidal current outside the estuary consistently flowing southwestward. After some time, the water currents in the southern and northern parts of the study area turn counterclockwise, and the flow direction in sub-estuaries B and C changes from inward to outward.
Figure 8d shows the flow field at the moment when the flow direction changes during ebb tide. It is evident that there are two counterclockwise circulations outside the Changhua River estuary: one from Beili Bay and the other from outside the harbor of Changhua. The latter has a broader influence and thus plays a dominant role in determining the water flow direction in the study area, gradually shifting the coastal current from southwest to northeast. Figure 8e shows the flow field at low tide once again, where the water flow outside the estuary has shifted back to the northeast, repeating the previous flow pattern.
In summary, during the transition from flood to ebb tide, the flow field outside the estuary is driven by the deflection of water currents from Beili Bay and the port of Changhua, shifting the flow direction from the northeast to southwest. During the transition from ebb to flood tide, the deflection is primarily influenced by the circulation outside the port of Changhua, shifting the flow direction from southwest to northeast. In sub-estuaries A, B, and C within the study area, the flow direction changes are relatively consistent due to the passage between sub-estuaries B and C. The flow direction in sub-estuary A aligns with the main river channel, flowing inward during flood tide and outward toward the ocean during ebb tide.
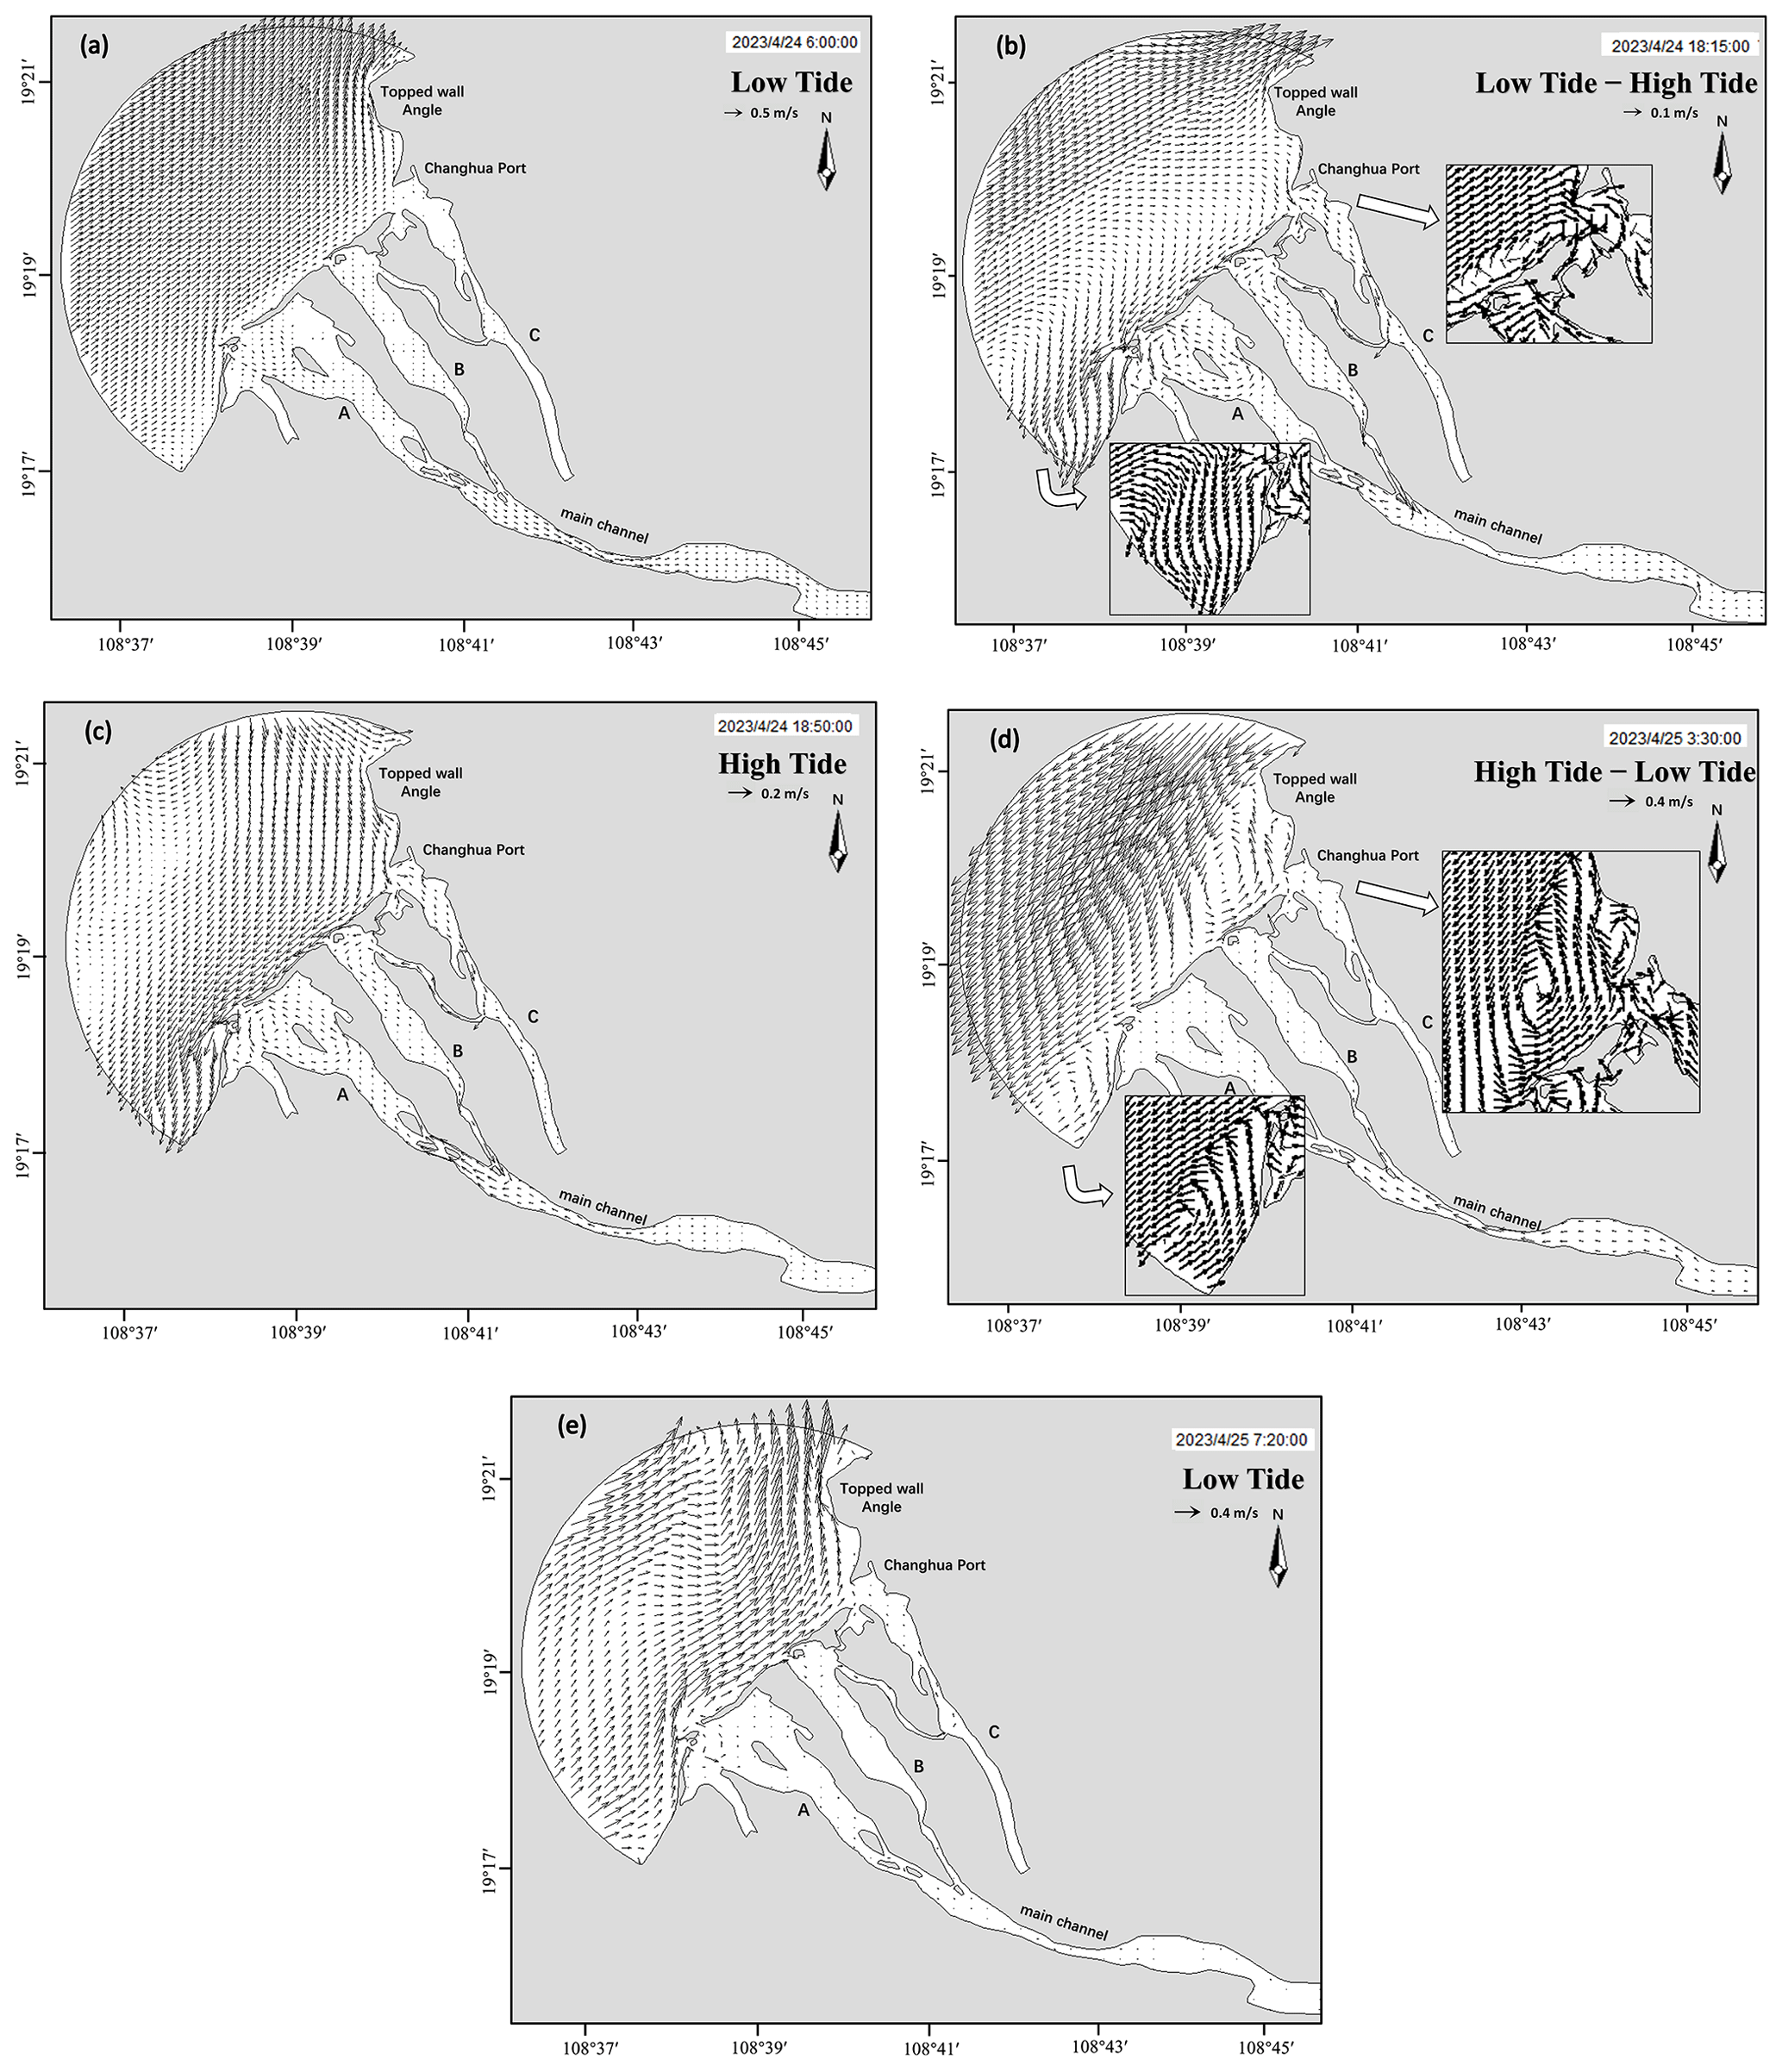
Figure 8Transition of the flow field and location of the study area.
5.1 Verification by suspended sediment concentration
In the lower reaches of the Changhua River, the summer season is the most pronounced for sediment variation within a year, with the highest sediment concentration and sediment transport rate (Mao et al., 2006). Therefore, sediment data from July, which are representative, are selected for model validation. The simulated suspended sediment concentration (SSC) is compared with the daily observed SSC at Baoqiao station for the month of July (Fig. 9). The SSC at Baoqiao station is the highest during the first 2 d of July, reaching a peak SSC of 0.55 kg m−3. Subsequently, the SSC continuously decreases, reaching its lowest value on 5 July, and then slowly rises. After 10 July, it gradually decreases from 0.301 kg m−3, with most values remaining below 0.2 kg m−3. Based on the analysis, NSE for Baoqiao station is 0.8389; the RMSE is 0.097244 kg m−3. The observed SSCs are in good agreement with the simulated values.
To further analyze the simulation validation, Fig. 9 presents a histogram of the daily absolute error in SSC at Baoqiao station. The absolute error is calculated as the absolute difference between the measured and simulated values. The mean absolute error (MAE) is defined as the average over the test sample of the absolute differences between prediction and actual observation. The MAE in SSC for Baoqiao station in July is 0.071224 kg m−3. The maximum error occurs at the beginning and the end of the month, which may be due to the use of monthly average flow and sediment data for the model's upper boundary input, thereby increasing the model's error. The discrepancy in suspended sediment concentrations during 21–25 July is primarily attributed to the inaccuracies in the initial sediment parameters, particularly the grain size distribution. These parameters were interpolated from a limited number of sampling points within the narrow river channel, which introduced errors. An inaccurate grain size distribution can lead to an underestimation of settling velocities or an overestimation of bed shear stresses, significantly affecting the model's predictions of sediment concentrations. We acknowledge the complexity of sediment dynamics and the challenges in accurately capturing these processes, especially in a dynamic environment like the lower reaches of the Changhua River. Overall, the difference between the daily observed SSC values and the simulated results at Baoqiao station in July is within a reasonable range, indicating that the model has an acceptable level of precision.
5.2 Analysis of depositions in the Changhua River estuary
Sediment deposition in the Changhua River estuary is influenced by both hydrodynamic and geological factors. The predominant northeast–southwest tidal current direction and wave action have led to the formation of a two-way sand mouth, further narrowing the estuary. Secondly, the estuary's geomorphology consists of a sandy riverbed with poor stability. The bed slope at the estuary decreases, and the water flow's capacity to carry sediment is reduced. Therefore, the sediment accumulation at the mouth of the Changhua River is relatively severe.
Over time, these processes have resulted in the formation of two river islands, altering the estuary into a complex channel system with multiple smaller estuaries (Fig. 10). Currently, the main river channel flows between these islands, exhibiting shallow depths during low tide. These findings are pivotal for understanding the estuary's morphological evolution and informing strategies for sediment management in such dynamic environments.
To elucidate the sedimentary characteristics of the study area, we extract the bed-level change data of a particular point in the obvious change area of a riverbed. By examining the bed-level changes at this point, we aim to gain insights into the sediment deposition characteristics that may be occurring throughout the area. This approach allows us to infer patterns and trends in sediment deposition based on observable changes at a specific location.
Figure 10Information of important place names in simulated areas (adapted from the Tiandi Map, Hainan, https://hainan.tianditu.gov.cn/, last access: 4 Ocotber 2024).
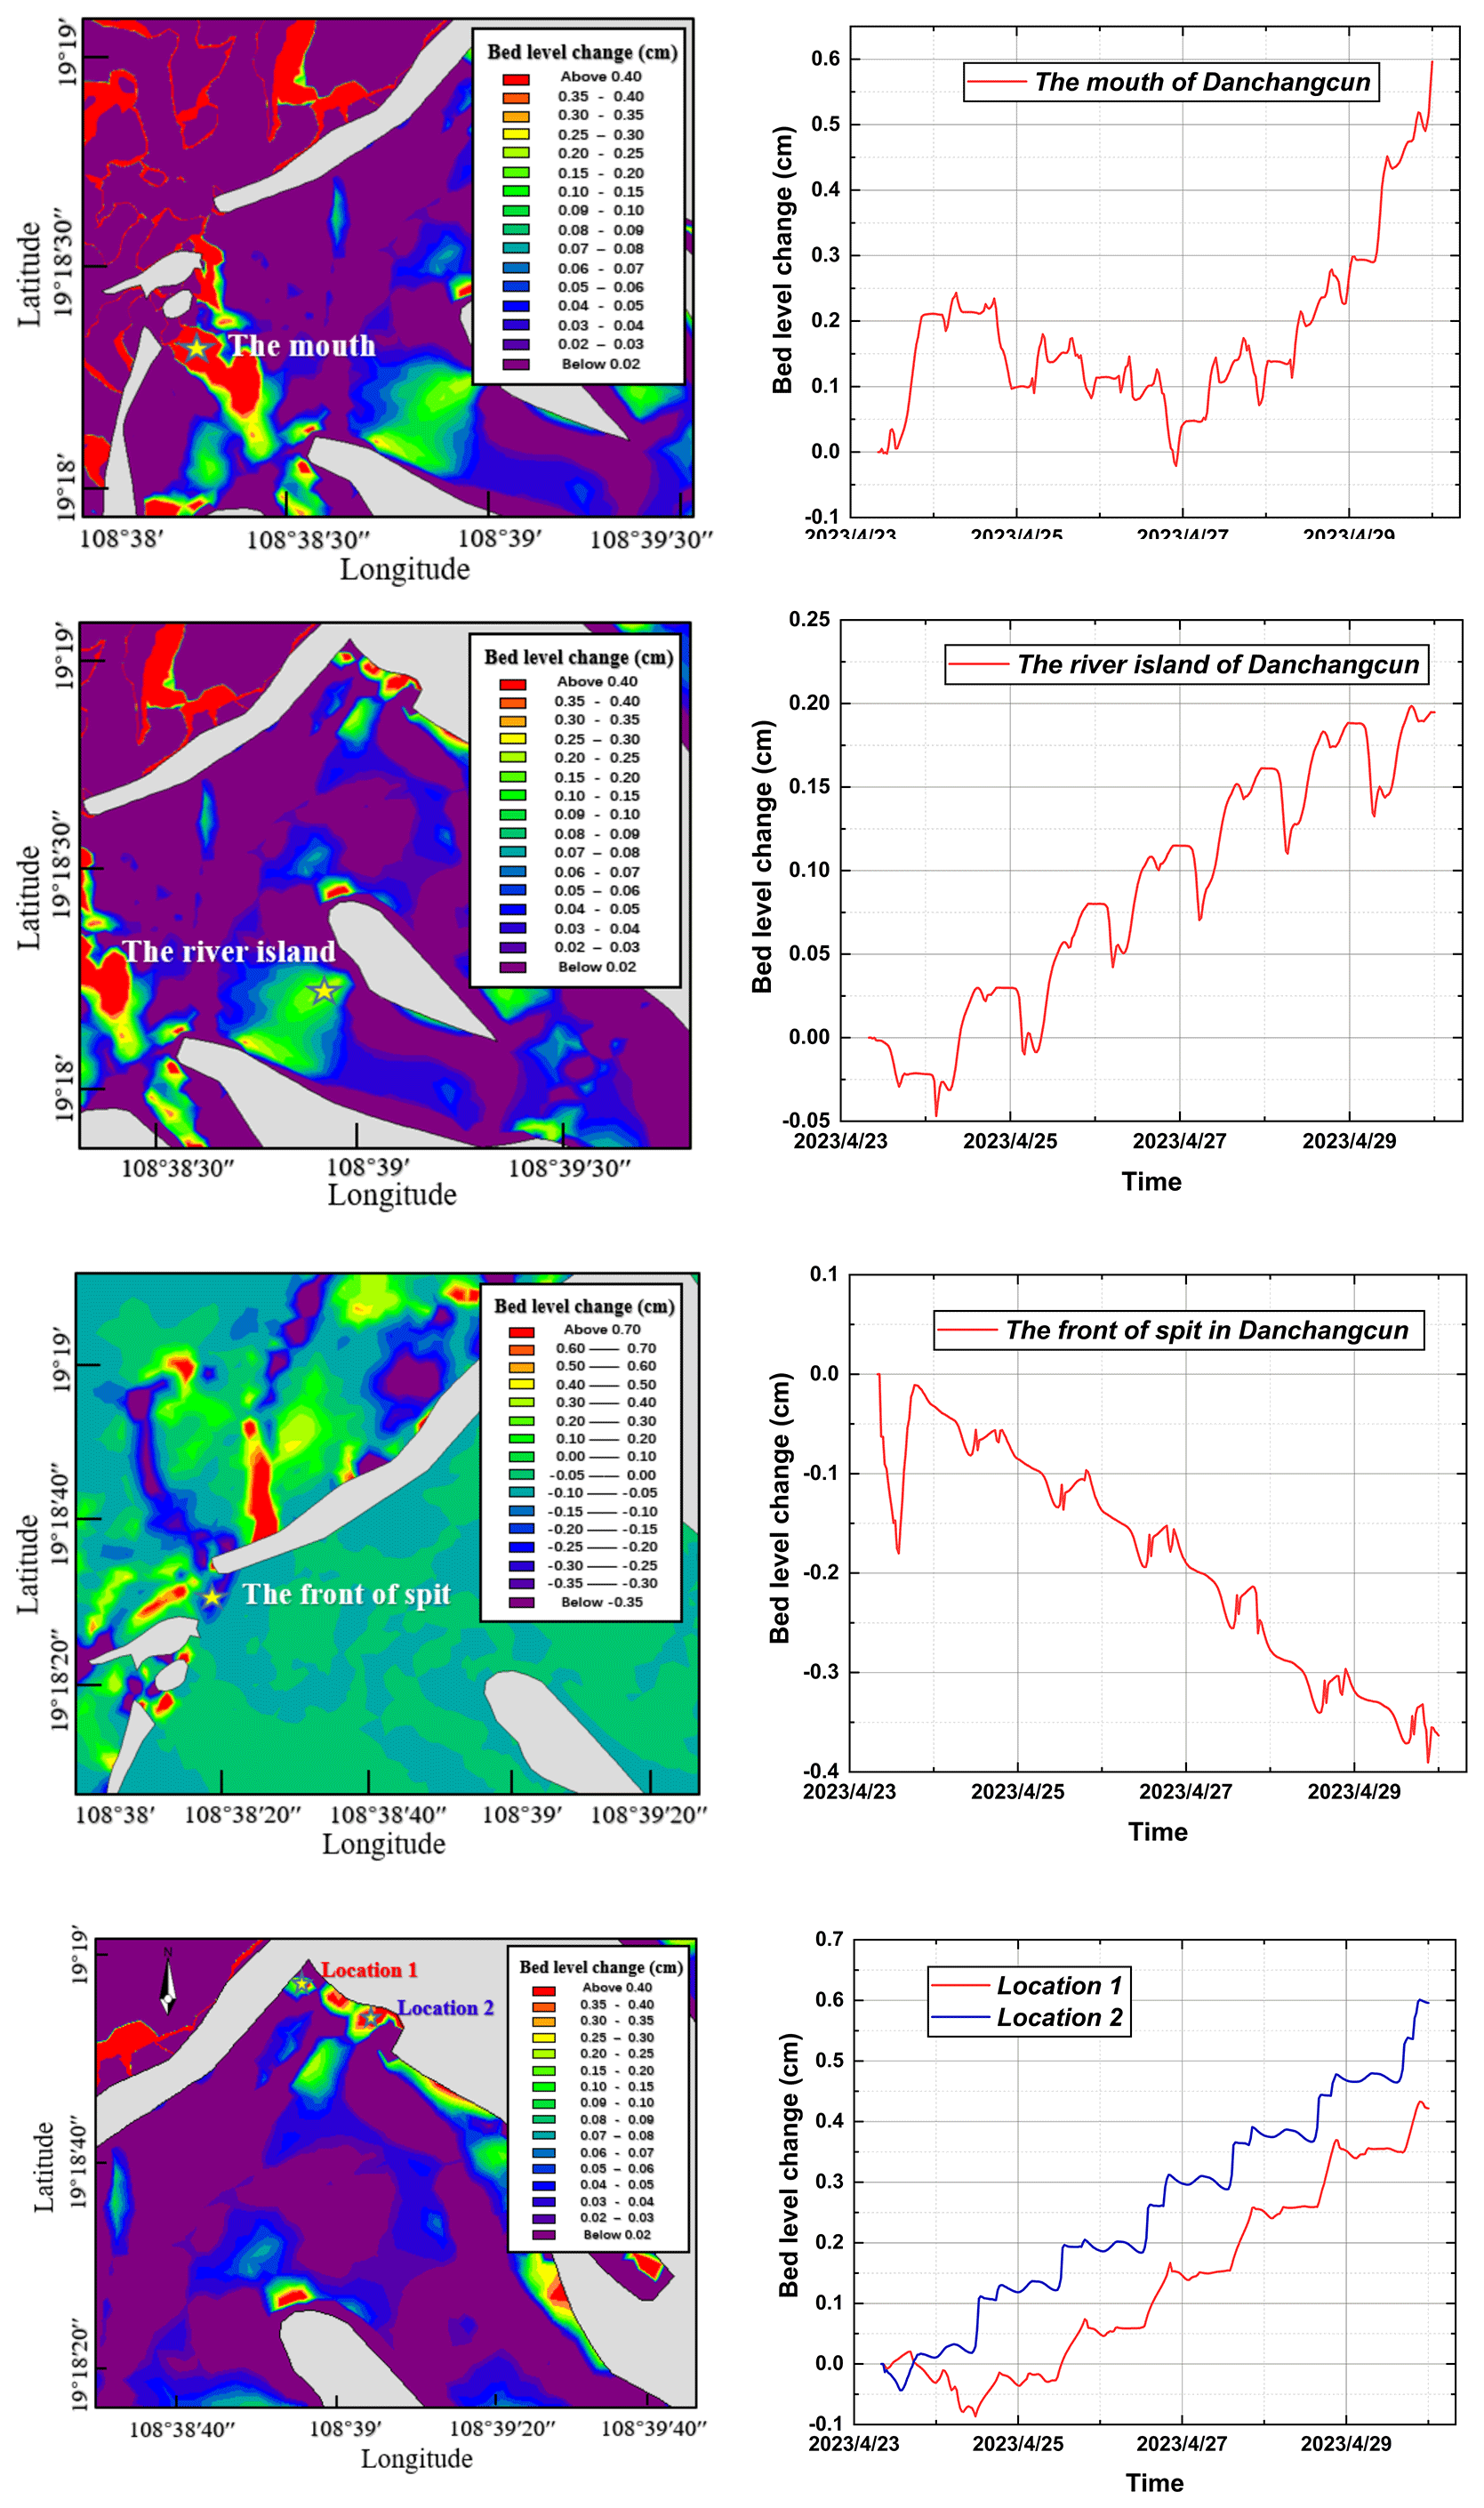
Figure 11Simulated results of bed-level changes and sediment deposition in Danchangcun. Panel (a) displays the bed-level changes at the estuary, (c) near the river island, (e) at the front end of the sand mouth, and (g) at the sand mouth itself. Panels (b), (d), (f), and (h) represent the temporal changes in bed thickness at selected points.
Results of Danchangcun are shown in Fig. 11, which illustrates the bed-level changes and consequent sediment deposition and scouring in various parts of Danchangcun. Positive values indicate sediment deposition, while negative values denote scouring.
In the estuary of Danchangcun (Fig. 11b), the bed level fluctuates above zero, signifying net sediment deposition with a final accumulation of approximately 0.59 cm over the simulation period.
The deposition near the river island in Danchangcun (Fig. 11d) follows a cyclical pattern over a 24 h cycle, with an overall sediment thickness of about 0.20 cm. Initially, sediment accumulates quickly, after which the bed level stabilizes at its peak value. A sharp decrease in deposition rate is observed in the last 2 h, with each cycle adding about 0.03 cm of sediment.
At the front end of the sand mouth (Fig. 11f), the bed level decreases by 0.39 cm, indicating active scouring and sediment removal. The continuous negative bed-level changes suggest an increasing scouring intensity, especially pronounced on 23 April when a significant erosion event led to a 0.18 cm drop in bed level.
Finally, Fig. 11h examines sediment deposition at the sand mouth, with two distinct locations showing similar sedimentation trends, albeit with Location 2 (near the river) experiencing faster sedimentation. Prior to 24–25 April, Location 1 (near the ocean) registered erosion, followed by a transition to net deposition, while Location 2 showed minor erosion before 24 April. The simulation predicts final bed-level changes of approximately 0.42 cm for Location 1 and 0.60 cm for Location 2.
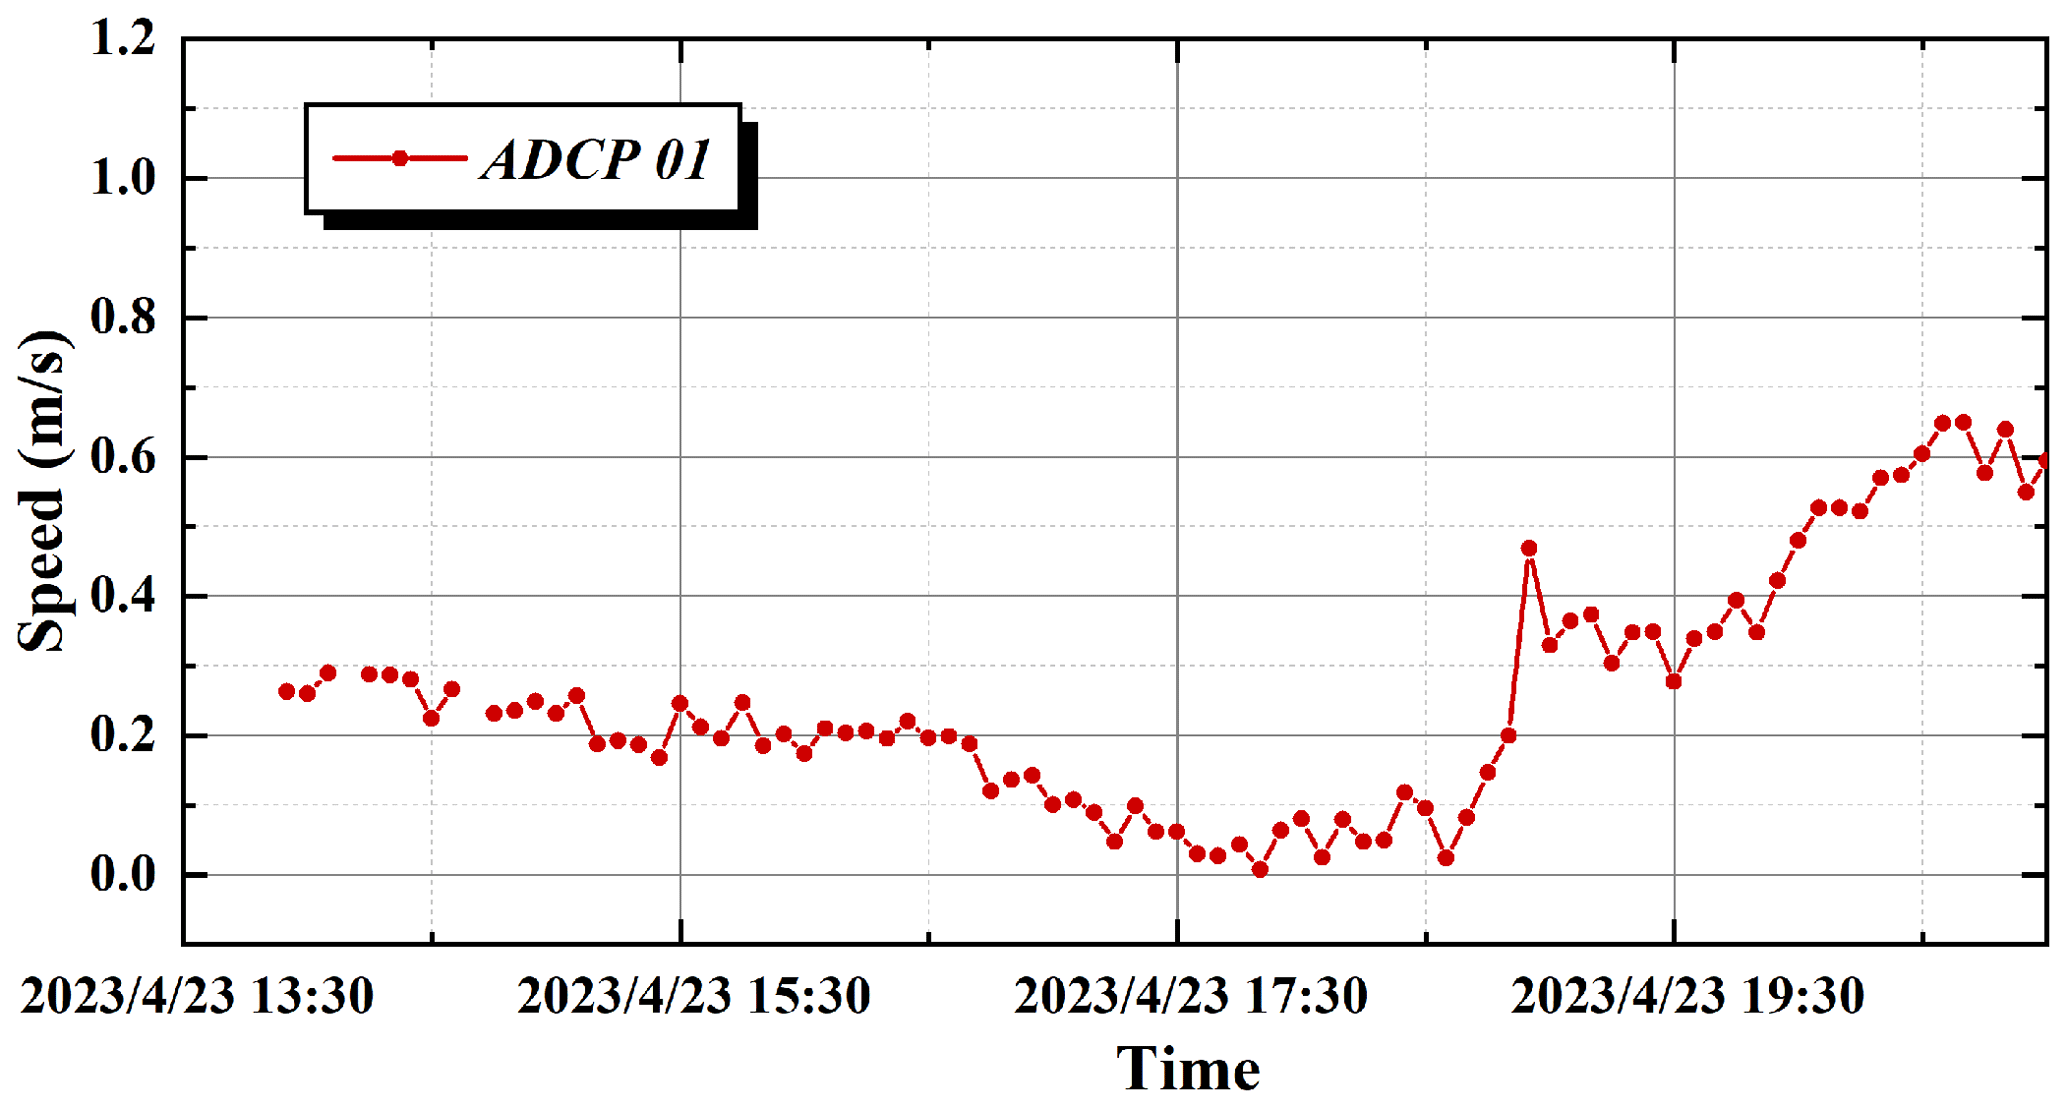
From 23 to 30 April, an overall increase in deposition thickness was noted, reaching approximately 0.59 cm. Two rapid deposition phases were identified: the first, on 23 April from 13:30 to 20:30, coincided with astronomical mid-tide but exhibited lower current velocities than expected, as per ADCP 01 measurements (Fig. 12). The second phase, which occurred after 27 April, was characterized by a neap tide, reduced tidal amplitude, and slower currents. These conditions collectively led to enhanced sediment deposition. These findings underscore the complex interplay between sediment deposition and erosion in estuarine environments and highlight the influence of tidal dynamics on sediment transport processes.
In the Xiantiancun estuary, sediment deposition is influenced by its narrower configuration compared to Danchangcun, with numerous tributaries contributing to a dispersed flow and reduced kinetic energy. This results in variable sediment deposition levels at the entrances of the tributaries, although the overall deposition is less extensive than at the Danchangcun mouth. The maximum observed deposition thickness within the estuary is 0.58 cm at Location 2, while other areas exhibit thicknesses between 0.3 cm and 0.5 cm (Fig. 13).
Two significant deposition sites are located near the sand mouth, which may facilitate the mouth's further expansion. Additionally, a substantial, albeit thin, silting zone is identified at the rear of the river island (Location 1), covering a considerable area. These findings indicate the complex interplay of sedimentary processes in estuarine environments and the potential for morphological changes due to deposition patterns.
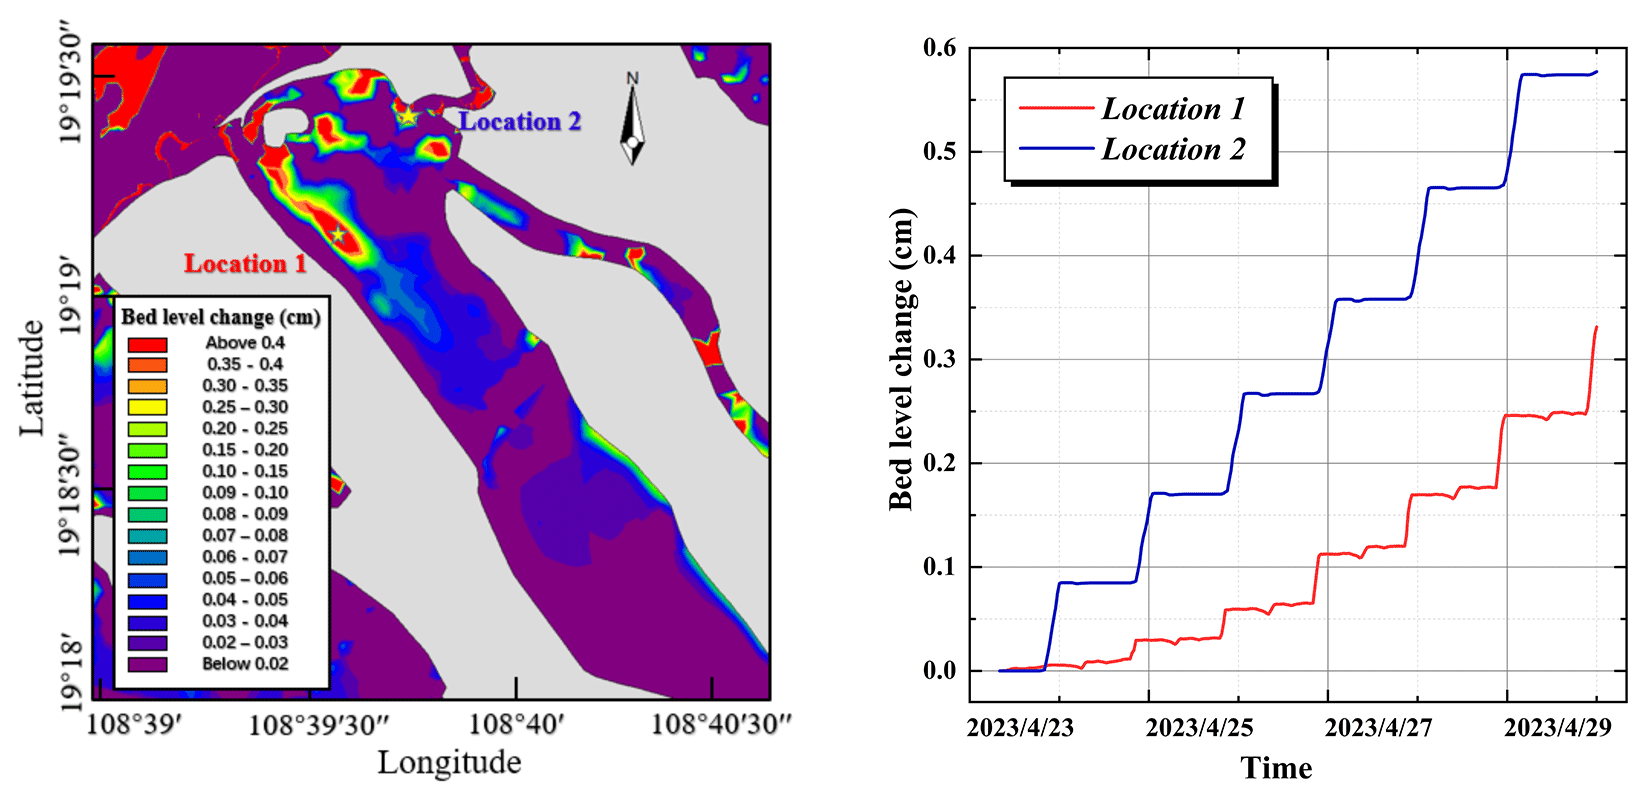
Figure 13Deposition in Xiantiancun. (a) Changes in sedimentation thickness of Xiantiancun with color palette; (b) changes in sedimentation thickness of Xiantiancun in detail.
To summarize, the Changhua River estuary exhibits distinct sedimentation patterns, with notable deposition occurring in both the estuary and slender channel regions. The estuary depositions are a result of interplay between hydrodynamic conditions and geological settings. Specifically, the estuary is subject to persistent northeast–southwest coastal currents and wave action, leading to the formation of a two-way sand mouth that constricts the estuary's width. The sandy, unstable riverbed further contributes to substantial sediment deposition due to the reduced gradient and sediment transport capacity of the fluctuating discharge. This has, over time, led to the formation of river islands, transforming the estuary into a complex channel system with multiple small estuaries. The main channel, situated between these islands, experiences shallow water depths during low tide.
In the Danchangcun region, the estuary displays a maximum sediment deposition thickness of 0.59 cm. The presence of a small river island in this area results in shallow deposition near the island, with some areas having thicknesses below 0.3 cm. In contrast, deeper deposition is observed along the riverbanks and particularly near the estuary. The sand mouth at the estuary's entrance is influenced by river erosion and coastal currents, leading to the formation of a new small sand mouth to the southwest. The original sand mouth tends to thicken after fracturing, with scouring at its front end and deposition at the fractured end, reaching a maximum thickness of 0.6 cm. This suggests that the estuary's current is obstructed by multiple depositional strips, resulting in a slower current and increased deposition.
In the Xiantiancun region, the estuary is narrower than in Danchangcun, with numerous tributaries dispersing the flow and reducing energy. This leads to varying degrees of deposition at the entrances of the tributaries, although the overall deposition is less than that observed at the Danchangcun mouth. The maximum deposition thickness at the estuary reaches 0.58 cm, with other areas exhibiting thicknesses ranging from 0.3 to 0.5 cm. Deposition near the sand mouth contributes to its expansion, and a long silting zone is present at the rear of the river island, characterized by a thin layer over a large area.
5.3 Analysis of deposition in the Changhua River channel
Changhua River's channel exhibits two key sediment deposition sites: the Chahe confluence and an area near Jiuxiancun. These areas are prone to significant sedimentation as the river narrows from a wide estuary to a more confined channel, increasing the risk of blockages (Fig. 14a). The primary sedimentation zone is located on the right bank of the distributary, with the maximum thickness measuring 0.47 cm (Fig. 14b). Deposition is most intense around the river island and decreases from the right side towards the rear and the left side of the island. This distribution suggests that sedimentation is more pronounced in the upper, narrower section of the channel.
In the main channel, erosion occurs on the ocean-facing right side, while the left side is subject to deposition. The sediments on the left bank are likely sourced from tidal actions or upstream inflows, a process that requires further study. The lateral variation in sedimentation and scouring highlights the intricate sediment dynamics within the river channel.
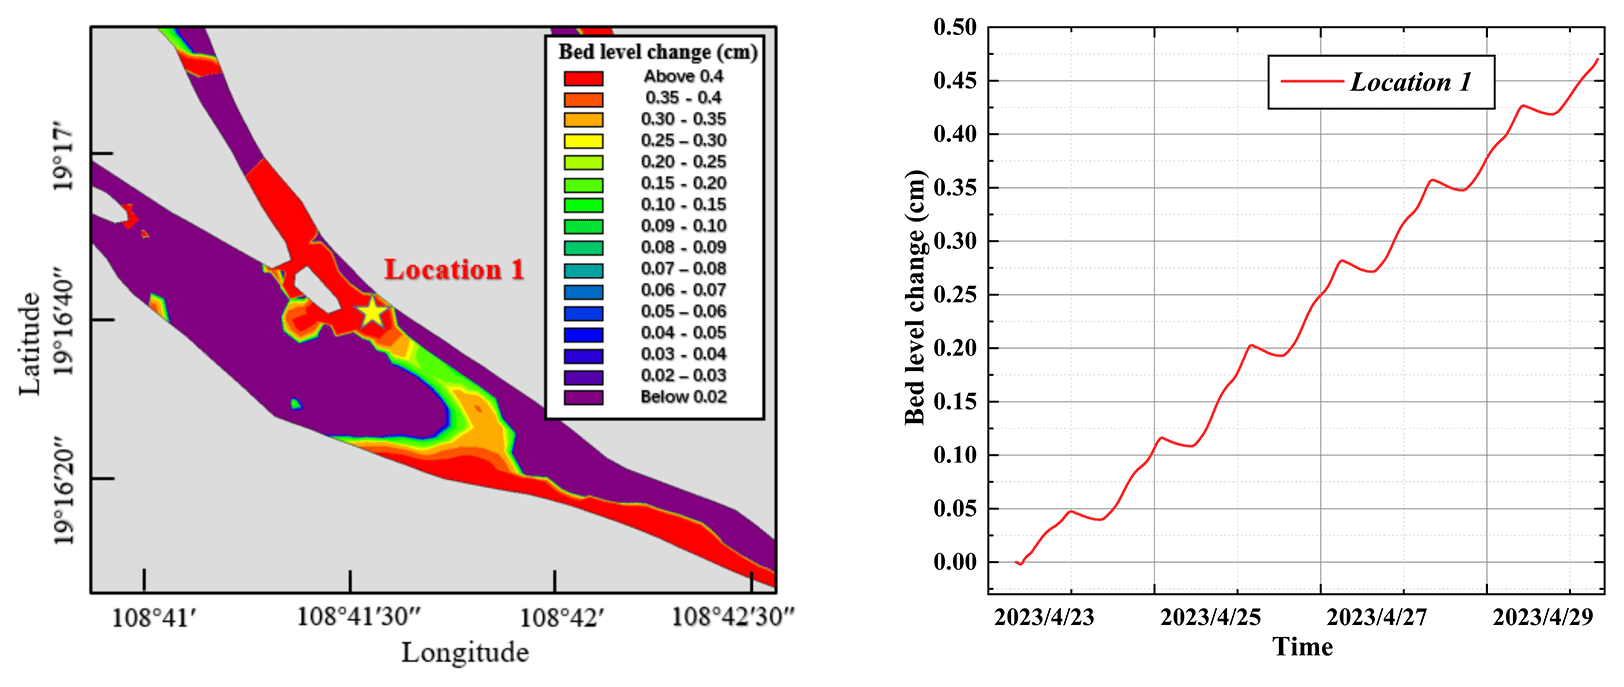
Figure 14Deposition in channel. (a) Changes in sedimentation thickness of channel with color palette; (b) changes in sedimentation thickness of channel in detail.
The analysis of topography and flow velocities along the river island banks indicates a pattern of alternating unidirectional currents and countercurrents (Fig. 15). The current speeds peak at 0.21 m s−1 during opposing flows and reach approximately 0.68 m s−1 when currents are in the same direction. The Xiantiancun section, marked by a constricted channel and intensified currents, is prone to sediment accumulation. As tides recede, the river's hydrodynamic energy weakens, facilitating the convergence of the Xiantiancun course with the estuary's incoming flows. This interaction leads to the predominant deposition of sediment on the left bank of the main channel, facing the ocean, which is influenced by high-tide influxes.
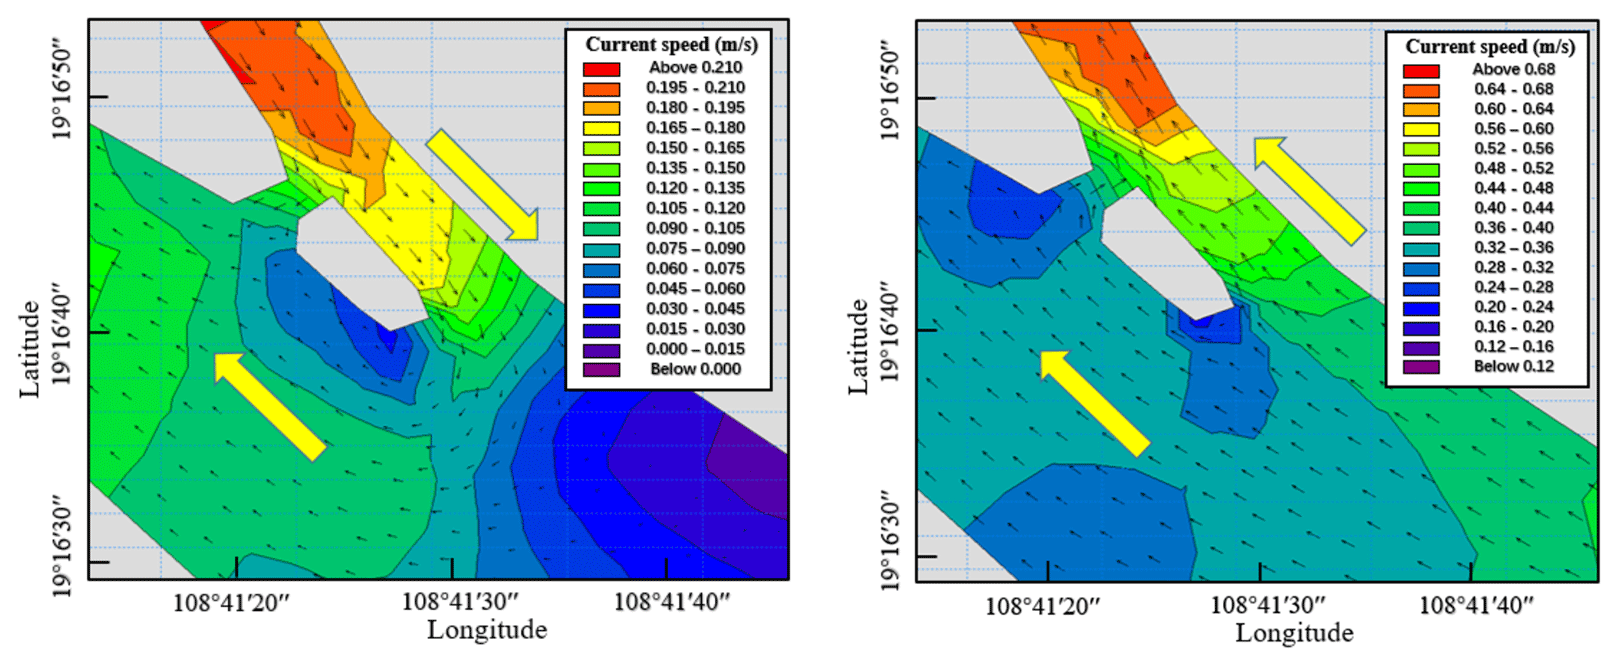
Figure 15Flow around the river island. (a) The flow around the river island in opposite directions; (b) the flow around the river island in the same directions.
A secondary sediment deposition site has been identified in proximity to Jiuxiancun, with the maximal sediment thickness measuring 0.81 cm (Fig. 16). This deposition zone is elongated and in close proximity to the coast, while erosion is observed on the opposing bank. The river's erosive action has led to the removal of the opposite bank, with the displaced sediment accumulating near Jiuxiancun. The sediment deposition patterns contribute to the river's natural evolution by altering its course and morphology over time. This process is a fundamental aspect of the river's dynamic landscape, shaping its future state through the deposition of sediments.
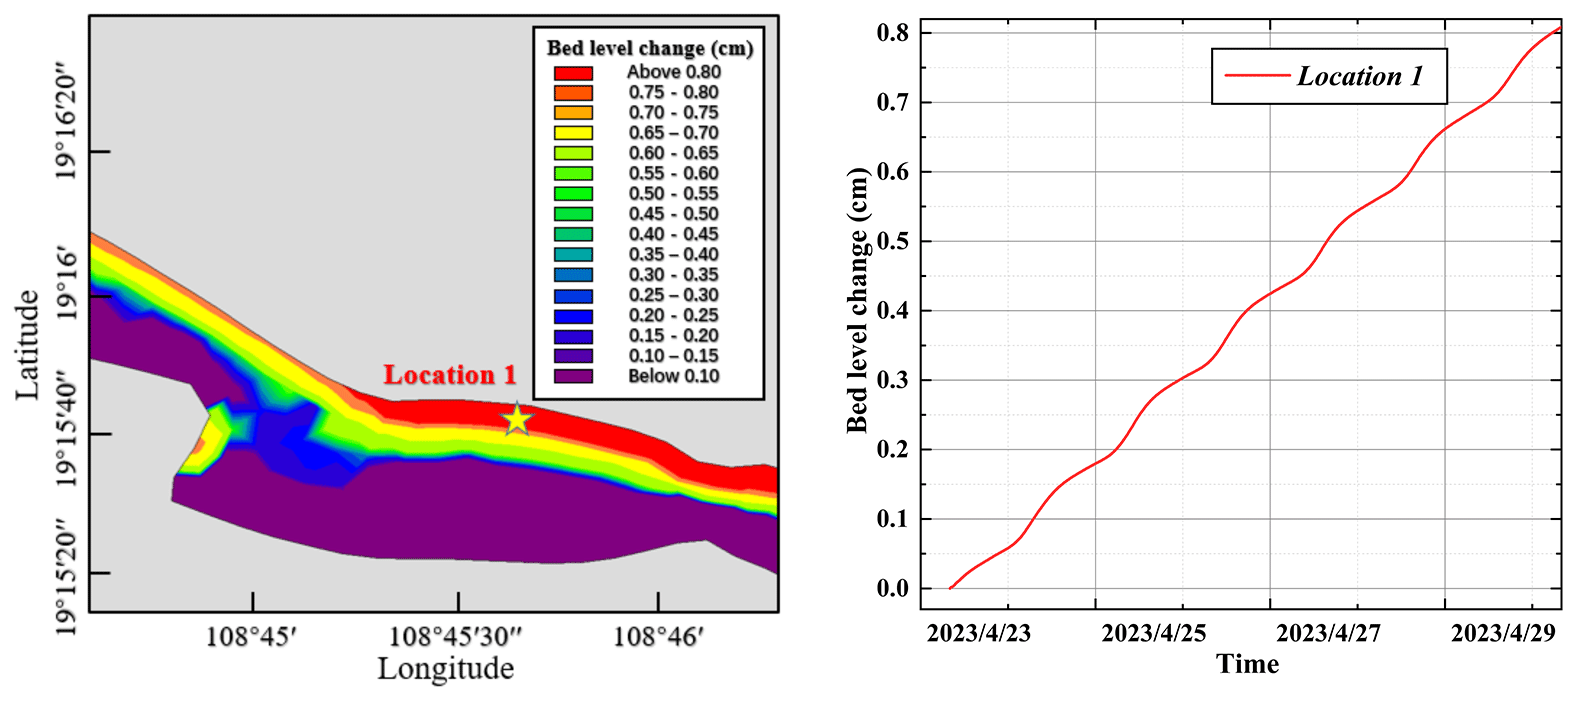
Figure 16Deposition near Jiuxiancun. (a) Changes in sedimentation thickness of Jiuxiancun with color palette; (b) changes in sedimentation thickness of Jiuxiancun in detail.
To summarize, there are two clear deposits at the channel of the Changhua River. One occurs at the intersection of Xiantiancun and Danchangcun, while the other is near Jiuxiancun. Compared to the fork, sedimentation near Jiuxiancun is deeper and thicker. The final deposition thickness of the model is 0.81 cm. The fork was deposited near the river island, and the simulation resulted in a displacement of 0.47 cm. The sediment carried by the high tide may be the source.
6.1 Residual current
Residual currents to some extent reflect the transfer and exchange of waterbodies, and their direction is usually the direction of sediment movement and the dispersion and migration of pollutant substances (Robinson, 1983). They are closely related to the long-term transfer and deposition of estuarine materials. Therefore, studying the characteristics of residual currents in this sea area under the combined action of waves and currents can lead to the comprehensive understanding of the evolution characteristics of the sea area's sediment. Tidal residual currents can be studied using the Lagrangian and Eulerian methods. The Eulerian residual current refers to the average flow after accounting for the periodic astronomical tide, which reflects the net flow direction and magnitude resulting from the ebb and flood tidal velocities. This residual current is influenced by the strength and duration of these tidal velocities, providing insight into the overall sediment transport dynamics in the study area. Stokes drift characterizes the net drift of the waterbody, and its numerical size directly reflects the correlation between the tidal range and the change in flow velocity within the tidal cycle, and the sum of the two is the Lagrangian residual current. The Lagrangian residual current is considered the result of the superposition of the Eulerian residual current and Stokes drift, which together provide a comprehensive representation of the long-term particle trajectories and the mean flow in our coastal environment. The formulas for calculating these currents are based on established studies (Longuet-Higgins, 1969; Uncles and Jordan, 1980; Li and O'Donnell, 1997).
Through the analysis of sediment simulation results from the previous section for the distribution of major sedimentation areas, we have been able to understand the distribution of these areas. However, the causes of sedimentation require further exploration. In this section, based on the tidal current field from hydrodynamic numerical simulation, we calculate the residual flow according to the entire study area. The validation of our hydrodynamic model against observed currents confirms the model's accuracy and reliability (Fig. 6). Consequently, the residual flow field, as simulated by the model, is also considered credible. The residual current from two ADCP stations outside the estuary of the Changhua River was analyzed using the tidal residual current calculation method.
Table 7Residual currents at monitoring stations: values are averaged over a 15 d periods. Elevations used in the calculation of Stokes drift are based on mean sea level (MSL) as the reference datum.
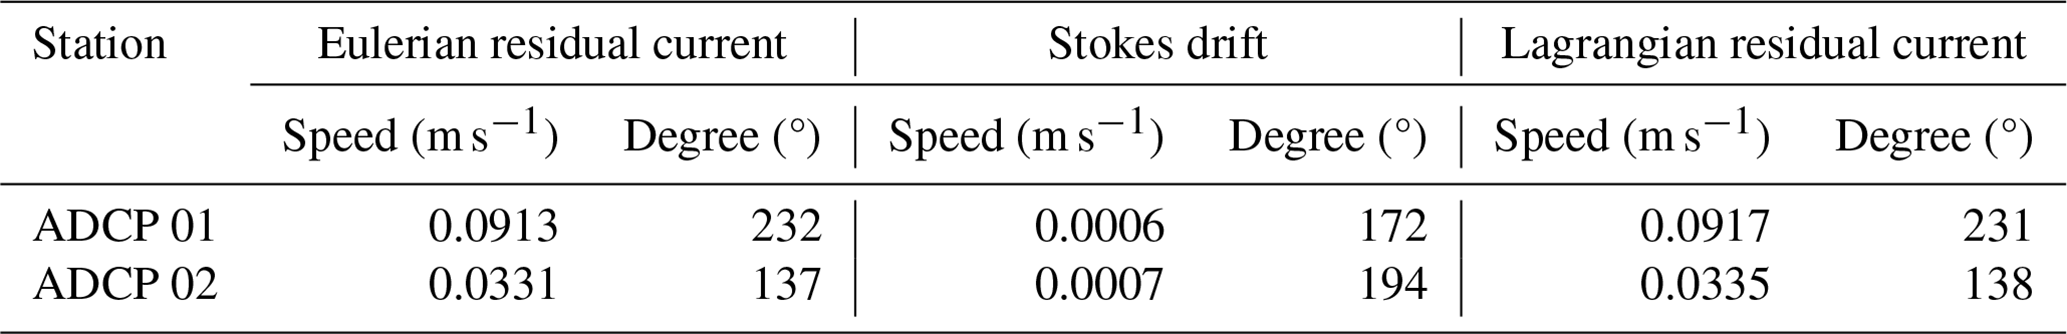
In the area outside the Changhua River estuary, the Stokes tidal residual current at the monitoring stations is 2 orders of magnitude smaller than the Eulerian residual current. Therefore, the flow trend of the composite Lagrangian tidal residual current remains essentially consistent with that of the Eulerian residual current.
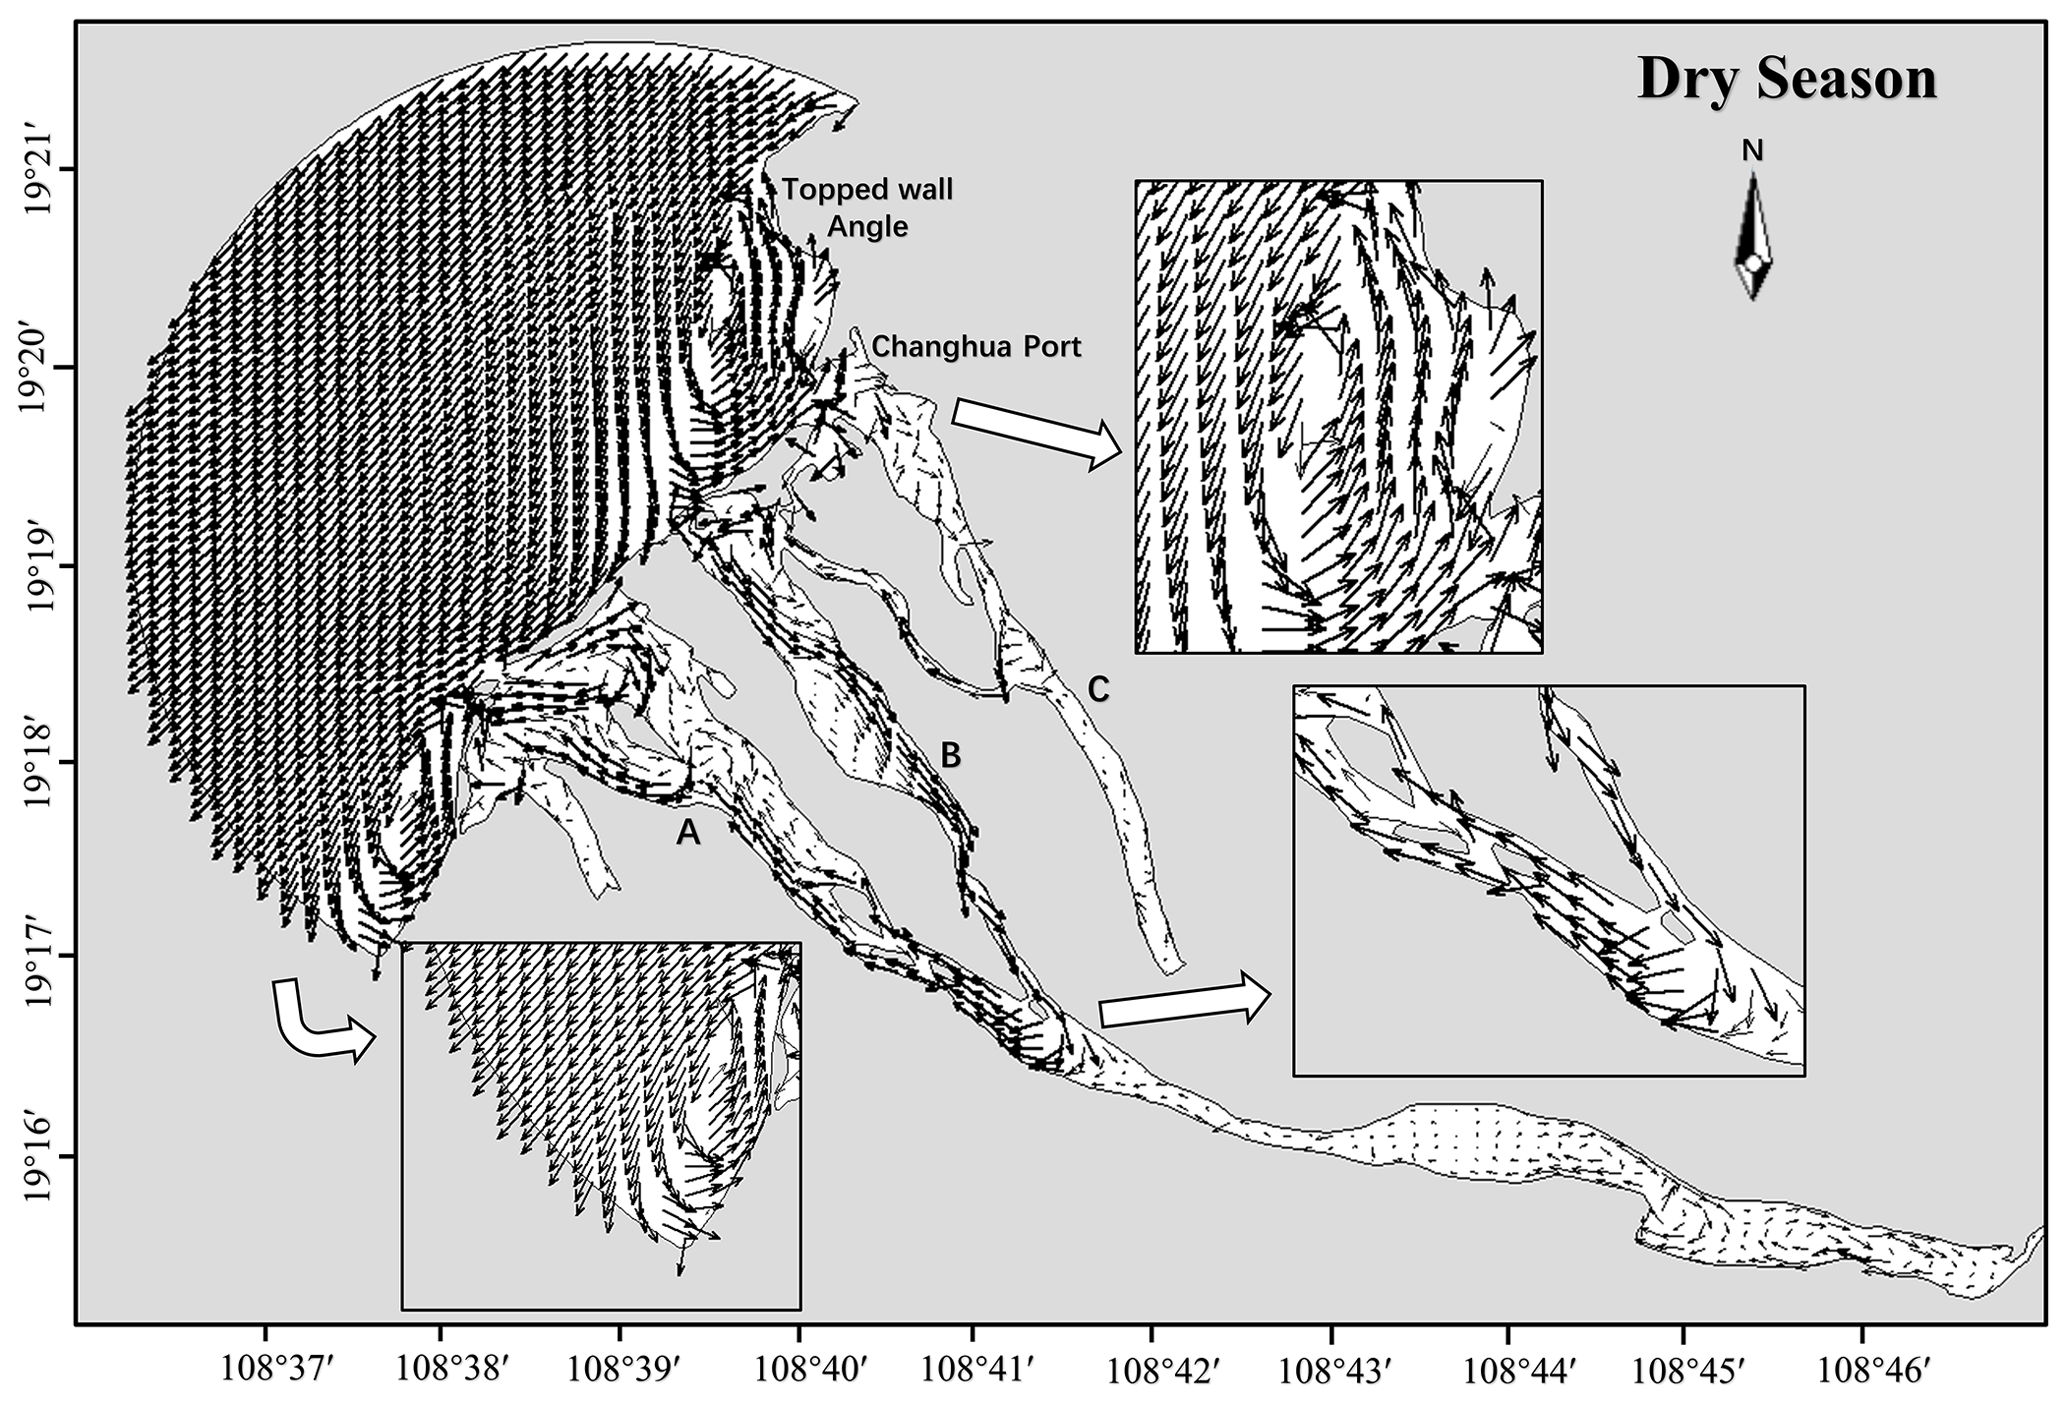
Figure 17Eulerian residual current field during the dry season.
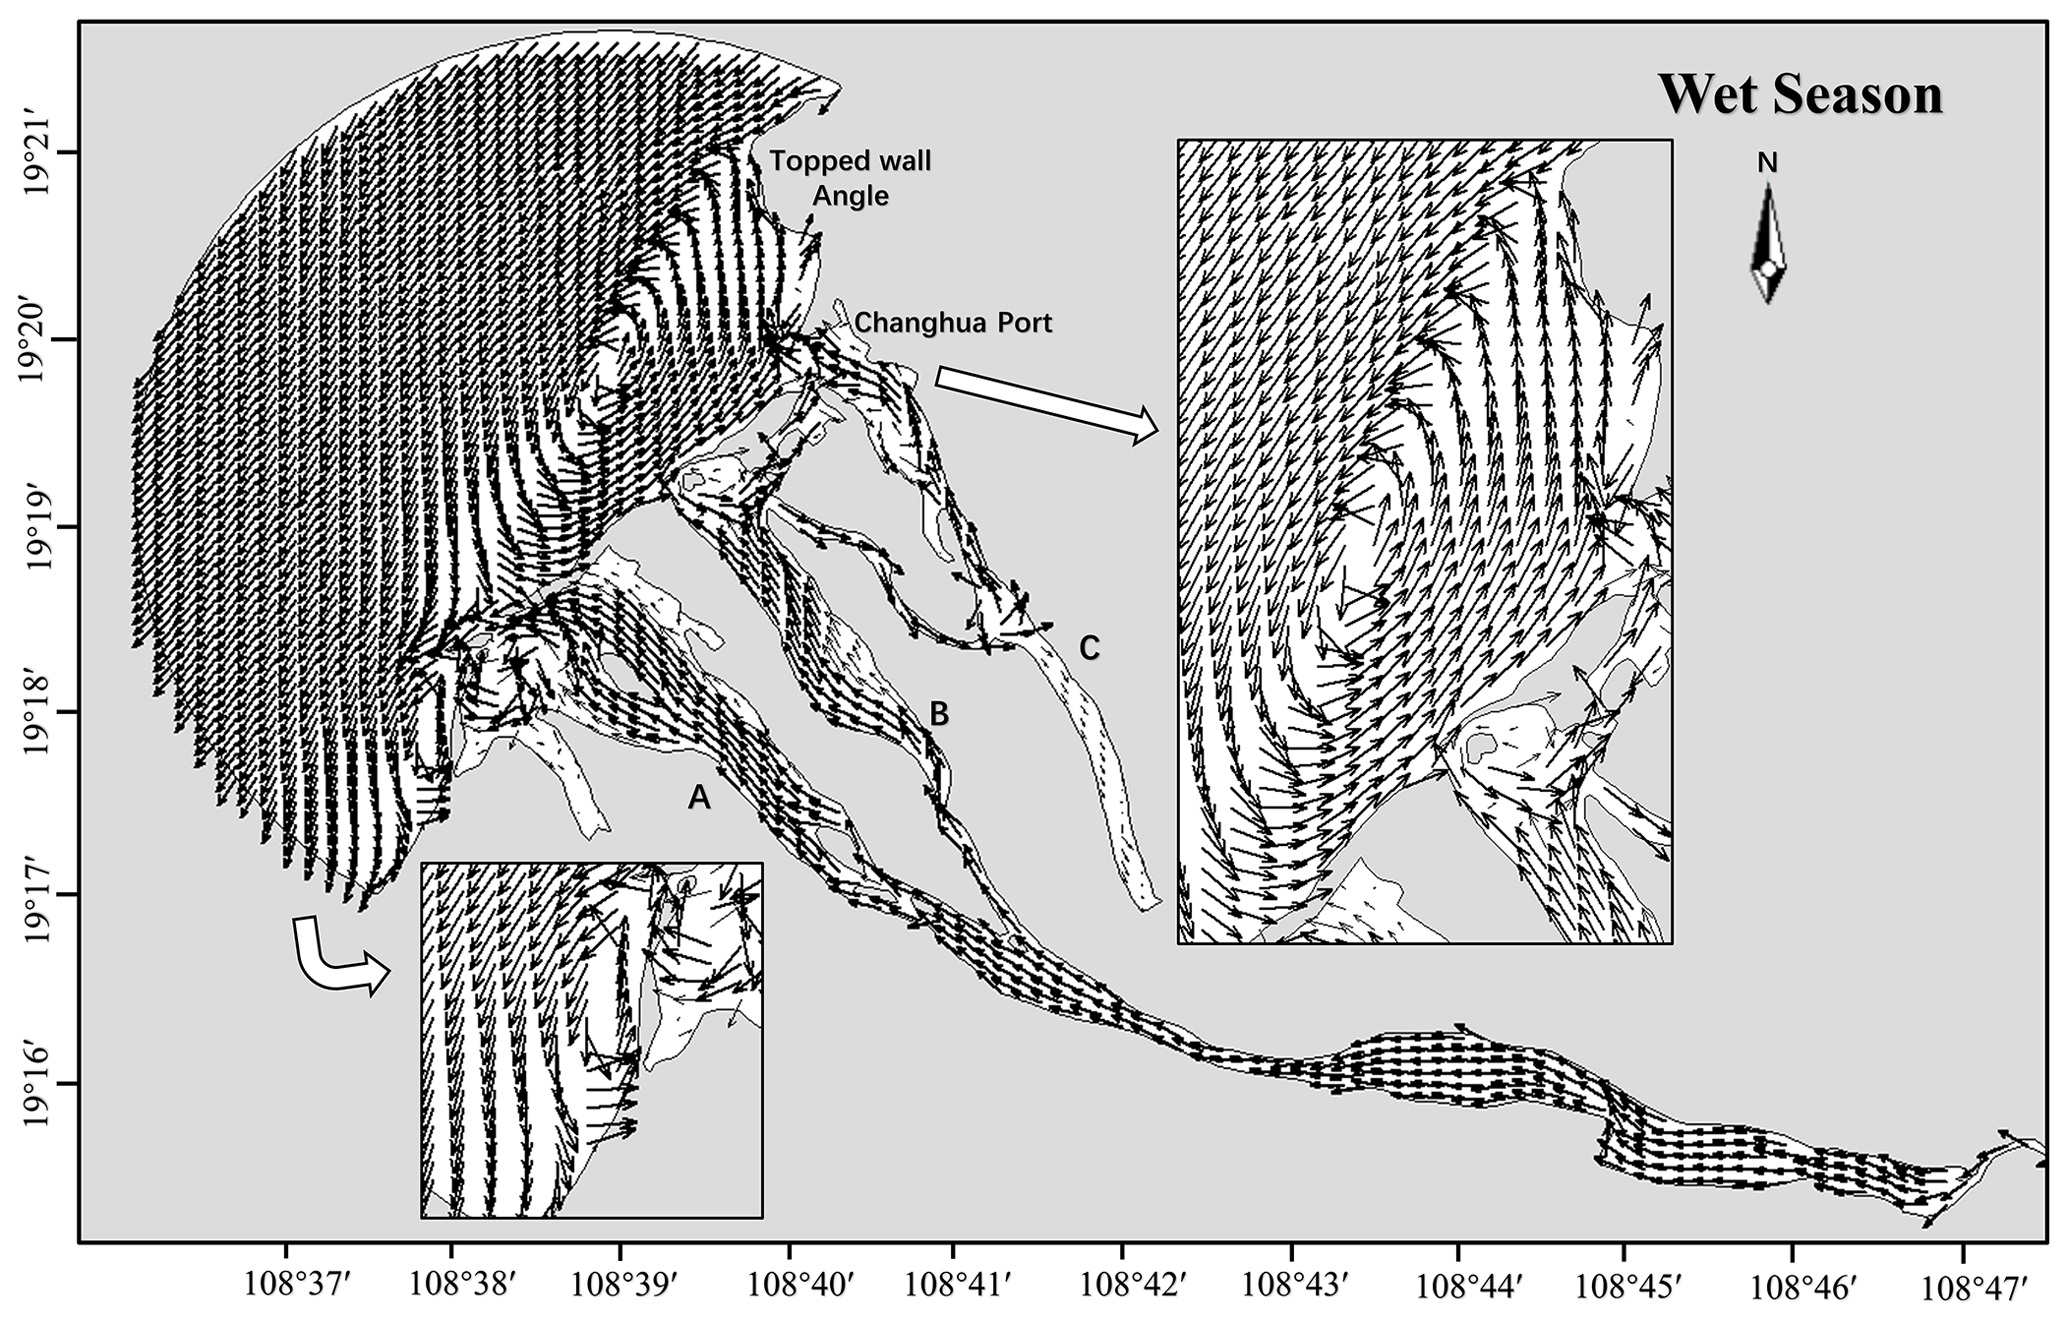
Figure 18Eulerian residual current field during the wet season.
6.2 Influence of residual current during the dry season
The study area has a distinct monsoon climate, with prevailing southerly winds in the summer and alternating southerly and northeasterly winds in the spring. Figure 17 is derived from averaging the instantaneous flow data over a standard 15 d period. To present the Eulerian residual currents within the study area in a complete and clear manner, a limit on vector length was set when plotting the current field. Consequently, the direction and length of the arrows in the figure represent the direction of the residual currents but not their intensity. However, the intensity of the Eulerian residual currents can still be discerned through the data at the grid points. The Eulerian residual current outside the Changhua River estuary generally flows southward. As it flows from north to south, it is obstructed by the sand spit diverging around it. After the divergence, the southwestward Eulerian residual current splits, with one part following the sand spit to the river mouth near sub-estuary A and the other part entering sub-estuary B and flowing inward. The northeastward Eulerian residual current, after divergence, encounters the obstruction of the headland (here named topped wall angle) and forms a counterclockwise circulation south of the topped wall angle. Headlands are one of the key topographical features where strong residual current vortices occur (Maddock and Pingree, 1978; Pingree and Maddock, 1977; Smith, 1983). At the headland, the water depth shoals in the onshore direction, and the frictional effect is stronger in shallow-water areas than in deep water areas. This results in a frictional force moment on the alongshore tidal current, generating vorticity. The transport of vorticity within the closed circulation lines on either side of the headland is not equal in input and output. After a tidal cycle of time averaging, a net vorticity will be produced on both sides of the headland, forming two counter-rotating residual current vortices, with the tidal residual current at the tip of the headland generally pointing seaward (Zimmerman, 1981). The topped wall angle, being a headland, can produce similar residual current field results. A clockwise residual current vortex may exist north of the topped wall angle, opposite to the southern vortex. The Eulerian residual currents in the three river sub-estuaries where A, B, and C are located all flow towards the river mouths. The Eulerian residual current in the sub-estuary between B and C flows from B to C.
6.3 Influence of residual current during wet season
In order to comprehensively understand the residual current field of the study area, it is essential to analyze the residual current field during the wet season. Figure 18 displays the Eulerian residual current field over a standard 15 d period during the wet season. The Eulerian residual current south of the river mouth in the study area still flows to the south (towards Beili Bay), but the nearshore residual current veers more quickly, resulting in a smaller circulation compared to the dry season. The circulation range in the north has expanded, likely due to the influence of the southerly monsoon during the summer, leading to an increase in the strength and directional deflection of the Eulerian residual current. When it reaches the shore, it is naturally obstructed by the sand spit and disperses to both sides (northeast–southwest). The northward Eulerian residual current, upon encountering the sea area outside the port of Changhua, is deflected by the coastal promontory (topped wall angle) and turns westward. The westward Eulerian residual current, continuously affected by the strong southerly winds during its movement, keeps deflecting. Eventually, a circulation is formed, with a circulation range larger than that of the dry season. The situation in sub-estuary A is essentially consistent with the dry season, while the Eulerian residual current directions in sub-estuaries B and C are the same as that in A, all flowing towards the ocean. This is quite different from the dry season, with a flow direction opposite to that of the dry season, which may be related to the increased rainfall and subsequent increase in downstream flow during the summer wet season.
In conclusion, our comprehensive study on the sediment transport dynamics in the lower reaches of the Changhua River, Hainan, has yielded valuable insights into the complex interplay between wave action, current flow, and sediment deposition. Through the application of an integrated wave–current coupled sediment transport model with variable grain properties, we have successfully simulated and analyzed the sediment behavior under the combined influence of waves and currents, particularly in multiple sub-estuaries with low sediment concentrations.
Our findings reveal significant sediment deposition in both the estuary and lower reaches of the river, which is primarily driven by the prevailing northeast–southwest tidal current direction and wave action. This has led to the formation of a two-way sand mouth, further narrowing the estuary and contributing to the substantial sediment accumulation at the mouth of the Changhua River. Furthermore, our research underscores the significance of residual currents in directing sediment movement and the dispersion of pollutant substances in the study area. The consistent flow of residual currents towards Beili Bay suggests that sediment in the lower reaches of the Changhua River is systematically transported in this direction, highlighting the importance of understanding these currents for coastal management and environmental planning.
Overall, our study contributes to the understanding of sediment transport processes in coastal environments and provides a robust framework for future research and management strategies in similar estuarine systems. The detailed analysis of sediment deposition and the validation of our model against observed data confirm the reliability and applicability of our approach, offering valuable insights for coastal and environmental researches.
The open-source code of FVCOM ocean model version 3.2.1 is available from http://fvcom.smast.umassd.edu (Chen et al., 2006). The source code for SWAN used in this study is freely available at http://swanmodel.sourceforge.net (Deltares, 2024).
The ERA5 data on a single level were obtained at https://cds.climate.copernicus.eu/cdsapp#!/dataset/reanalysis-era5-single-levels?tab=overview (Copernicus Climate Change Service (C3S), 2017). The bathymetry is the ETOPO1 Global Relief Model, available from NOAA at https://doi.org/10.7289/V5C8276M (NOAA National Geophysical Data Center, 2009). Topographic data were obtained from the Haikou Marine Geological Survey Center and are available from the authors with the permission of the Haikou Marine Geological Survey Center.
The supplement related to this article is available online at https://doi.org/10.5194/os-21-473-2025-supplement.
YW: writing (review and editing), writing (original draft), visualization, validation, software, resources, methodology, investigation, formal analysis, data curation, conceptualization. EZ: writing (review and editing), writing (original draft), supervision, resources, project administration, conceptualization. XL: investigation (data collection), validation, supervision, project administration. SZ: investigation (data collection), validation.
The contact author has declared that none of the authors has any competing interests.
Publisher’s note: Copernicus Publications remains neutral with regard to jurisdictional claims made in the text, published maps, institutional affiliations, or any other geographical representation in this paper. While Copernicus Publications makes every effort to include appropriate place names, the final responsibility lies with the authors.
This work was supported by the National Natural Science Foundation of China (grant nos. 52371295, 52001286), Guangdong Basic and Applied Basic Research Foundation (grant no. 2022A1515240002), Hubei Provincial Natural Science Foundation of China (grant no. 2023AFB576), Shenzhen Science and Technology Program (grant no. JCYJ20240813114005008), the Open Fund of Shandong Provincial Key Laboratory of Marine Environment and Geological Engineering (grant no. MEGE2024006), and the China Geological Survey Project (DD20220956).
This work has been supported by the National Natural Science Foundation of China (grant nos. 52371295, 52001286), Guangdong Basic and Applied Basic Research Foundation (grant no. 2022A1515240002), Hubei Provincial Natural Science Foundation of China (grant no. 2023AFB576), Shenzhen Science and Technology Program (grant no. JCYJ20240813114005008), the Open Fund of Shandong Provincial Key Laboratory of Marine Environment and Geological Engineering (grant no. MEGE2024006), and the China Geological Survey Project (DD20220956).
This paper was edited by John M. Huthnance and reviewed by two anonymous referees.
Addison-Atkinson, W., Chen, A. S., Memon, F. A., Anta, J., Naves, J., and Cea, L.: Investigation of uniform and graded sediment wash-off in an urban drainage system: Numerical model validation from a rainfall simulator in an experimental facility, J. Hydrol., 629, 130561, https://doi.org/10.1016/j.jhydrol.2023.130561, 2024.
Adnan, R. M., Liang, Z. M., El-Shafie, A., Zounemat-Kermani, M., and Kisi, O.: Prediction of Suspended Sediment Load Using Data-Driven Models, Water, 11, 2060, https://doi.org/10.3390/w11102060, 2019.
Auguste, C., Nader, J. R., Marsh, P., Cossu, R., and Penesis, I.: Variability of sediment processes around a tidal farm in a theoretical channel, Renew. Energ., 171, 606–620, https://doi.org/10.1016/j.renene.2021.02.147, 2021.
Bai, J., Fang, H. W., He, G. J., Xie, C. B., and Gao, H.: Numerical simulation of erosion and transport of fine sediments by large eddy simulation, Chinese J. Theor. Appl. Mech., 49, 65–74, https://doi.org/10.6052/0459-1879-16-235, 2017.
Bakhtyar, R., Barry, D. A., Li, L., and Jeng, D. S.: Yeganeh-Bakhtiary, A.: Modeling sediment transport in the swash zone: A review, Ocean Eng., 36, 767–783, https://doi.org/10.1016/j.oceaneng.2009.03.003, 2009.
Battjes, J. A. and Janssen, J. P. F. M.: Energy loss and set-up due to breaking in random waves, Proc. 16th Coastal Eng. Conf., Hamburg, Part 1, 569–587, https://doi.org/10.1061/9780872621909.034, 1978.
Blumberg, A. F. and Mellor, G. L.: A description of a three-dimensional coastal ocean circulation model, Coast. Estuar. Sci., 4, 1–16, https://doi.org/10.1029/CO004p0001, 1987.
Bui, L. H. N. and Bui, L. T.: Modelling bank erosion dependence on natural and anthropogenic factors – case study of Ganh Hao estuary, Bac Lieu – Ca Mau, Vietnam, Environ. Technol. Innov., 19, 100975, https://doi.org/10.1016/j.eti.2020.100975, 2020.
Chen, C., Liu, H., and Beardsley, R. C.: An unstructured grid, finite-volume, three-dimensional, primitive equations ocean model: application to coastal ocean and estuaries, J. Atmos. Ocean. Technol., 20, 159–186, https://doi.org/10.1175/1520-0426(2003)020<0159:AUGFVT>2.0.CO;2, 2003.
Chen, C. S., Beardsley, R. C., and Cowles, G.: An unstructured grid, finite-volume coastal ocean model: FVCOM User Manual, Second Edition, Technical Report 06-0602, University of Massachusetts Dartmouth [code], New Bedford, MA, USA, http://fvcom.smast.umassd.edu (last access: 4 March 2022), 2006.
Chen, C., Xue, P., Ding, P., Beardsley, R. C., Xu, Q., Mao, X., Gao, G., Qi, J., Li, C., Lin, H., Cowles, G., and Shi, M.: Physical mechanisms for the offshore detachment of the Changjiang Diluted Water in the East China Sea, J. Geophys. Res.-Ocean., 113, C02002, https://doi.org/10.1029/2006JC003994, 2008.
Chen, T., Zhang, Q., Wu, Y., Ji, C., Yang, J., and Liu, G.: Development of a wave-current model through coupling of FVCOM and SWAN, Ocean Eng., 164, 443–454, https://doi.org/10.1016/j.oceaneng.2018.06.062, 2018.
Chen, W. Q., Werf, J. J., and Hulscher, S. J. M. H.: Practical modelling of sand transport and beach profile evolution in the swash zone, Coast. Eng., 191, 104514, https://doi.org/10.1016/j.coastaleng.2024.104514, 2024.
Claude, N., Rodrigues, S., Bustillo, V., Bréhéret, J. G., Macaire, J. J., and Jugé, P.: Estimating bedload transport in a large sand–gravel bed river from direct sampling, dune tracking and empirical formulas, Geomorphology, 179, 40–57, https://doi.org/10.1016/j.geomorph.2012.07.030, 2012.
Constant, M., Alary, C., Weiss, L., Constant, A., and Billon, G.: Trapped microplastics within vertical redeposited sediment: Experimental study simulating lake and channeled river systems during resuspension events, Environ. Pollut., 322, 121212, https://doi.org/10.1016/j.envpol.2023.121212, 2023.
Copernicus Climate Change Service (C3S): ERA5: Fifth generation of ECMWF atmospheric reanalyses of the global climate, Copernicus Climate Change Service Climate Data Store (CDS) [data set], https://cds.climate.copernicus.eu/cdsapp#!/dataset/reanalysis-era5-single-levels?tab=overview (last access: 26 March 2024), 2017.
Czitrom, V. A.: One-factor-at-a-time versus designed experiments, Am. Stat., 53, 126–131, https://doi.org/10.1080/00031305.1999.10474445, 1999.
Deltares: SWAN Cycle III Version 40.51 User Manual, Delft, the Netherlands, Deltares [code], https://swanmodel.sourceforge.io/online_5doc/swanuse/swanuse.html (last access: 24 June 2022), 2024.
Deltares: SWAN Cycle III Version 40.51 User Manual, Delft, the Netherlands, Deltares [code], https://swanmodel.sourceforge.io/online_doc/swanuse/swanuse.html (last access: 21 June 2017), 2024.
Ding, Q. L.: Wave characteristics and calculation of Beibu Gulf, Marine Forecasts, 7, 46–52, https://doi.org/10.11737/j.issn.1003-0239.1990.02.007, 1990.
Doroudi, S. and Sharafati, A.: A newly developed multi-objective evolutionary paradigm for predicting suspended sediment load, J. Hydrol., 634, 131090, https://doi.org/10.1016/j.jhydrol.2024.131090, 2024.
Fang, X., Zou, J., Wu, Y., Zhang, Y., Zhao, Y., and Zhang, H.: Evaluation of the sustainable development of an island “Blue Economy”: a case study of Hainan, China, Sustain. Cities Soc., 66, 102662, https://doi.org/10.1016/j.scs.2020.102662, 2021.
Feng, H. L., Liu, M., Xu, M. Y., Zhang, M. X., Mo, L., Chen, T., Tan, X. Y., and Liu, Z. Y.: Study on the integrated protection strategy of water environment protection: The case of Hainan Province of China, Environ. Technol. Innov., 24, 101990, https://doi.org/10.1016/j.eti.2021.101990, 2021.
Folk, R. L. and Ward, W. C.: A Study in the Significance of Grain-Size Parameters, J. Sediment. Petrol., 27, 3–26, https://doi.org/10.1306/74D70646-2B21-11D7-8648000102C1865D, 1957.
Fredsoe, J.: The turbulent boundary layer in combined wave-current motion, J. Hydraul. Eng., 110, 1103–1120, https://doi.org/10.1061/(ASCE)0733-9429(1984)110:8(1103), 1984.
Gao, J.: Study on sediment transport model in Changhua River Estuary of Hainan Province based on remote sensing analysis, China University of Geosciences (Beijing), CNKI, CDMD: 2.1014.101980080086, 2014.
Gessler, D., Hall, B., Spasojevic, M., Holly, F. M., Pourtaheri, H., and Raphelt, N. X.: Application of 3D mobile bed, hydrodynamics model, J. Hydraul. Eng., 125, 737–749, https://doi.org/10.1061/(ASCE)0733-9429(1999)125:7(737), 1999.
Han, X. J., Kuang, C. P., Gong, L. X., and Li, W. B.: Sediment transport and seabed evolution under artificial headland and beach nourishment engineering, Oceanol. Limnol. Sin., 53, 917–932, https://doi.org/10.11693/hyhz20211200345, 2022.
Holly, F. M. and Rahuel, J. L.: New numerical/physical framework for mobile-bed modeling, Part 1: Numerical and physical principles, J. Hydraul. Res., 28, 401–416, https://doi.org/10.1080/00221689009499057, 1990.
Hu, X. Z.: Mathematical Simulation Study of Sediment in Intake and Outfall of Dongfang (East) Power Plant in Hainan at North Bay, Pearl River, 030, 18–23, https://doi.org/10.3969/j.ISSN.1001-9235.2009.06.006, 2009.
Huang, H., Chen, C., Blanton, J. O., and Andrade, F. A.: A numerical study of tidal asymmetry in Okatee Creek, South Carolina, Estuar. Coast. Shelf Sci., 78, 190–202, https://doi.org/10.1016/j.ecss.2007.11.027, 2008.
Ji, C., Zhang, Q., Ma, D., Wu, Y., and Jiang, Q.: Nearshore coupled wave-current model based on new three-dimensional radiation stress formulation, J. Zhejiang Univ., 56, 128–136, https://doi.org/10.3785/j.issn.1008-973X.2022.01.014, 2022.
Jia, Y. and Wang, S. S.: Numerical model for channel flow and morphological change studies, J. Hydraul. Eng., 125, 924–933, https://doi.org/10.1061/(ASCE)0733-9429(1999)125:9(924), 1999.
Jiang, F. Y. and Zhao, E. J.: Damage mechanism and failure risk analysis of offshore pipelines subjected to impact loads from falling object, considering the soil variability, Mar. Struct., 93, 103544, https://doi.org/10.1016/j.marstruc.2023.103544, 2024.
Jiang, L. and Xia, M.: Dynamics of the Chesapeake Bay outflow plume: Realistic plume simulation and its seasonal and interannual variability, J. Geophys. Res.-Ocean., 121, 1424–1445, https://doi.org/10.1002/2015JC011191, 2016.
Jin, J., Ou-Yang, Z. Y., Lin, S. K., and Wang, X. K.: A study on ecosystem deterioration and protection counter-measure of Hainan Island coast, Ocean Dev. Manag., 2008, 103–108, https://doi.org/10.3969/j.issn.1005-9857.2008.01.023, 2008.
Lai, W., Pan, J., and Devlin, A. T.: Impact of tides and winds on estuarine circulation in the Pearl River Estuary, Cont. Shelf Res., 168, 68–82, https://doi.org/10.1016/j.csr.2018.09.004, 2018.
Leary, K. C. P. and Buscombe, D.: Estimating sand bed load in rivers by tracking dunes: a comparison of methods based on bed elevation time series, Earth Surf. Dynam., 8, 161–172, https://doi.org/10.5194/ESURF-8-161-2020, 2020.
Lee, H. Y., Hsieh, H. M., Yang, J. C., and Yang, C. T.: Quasi–two-dimensional simulation of scour and deposition in alluvial channels, J. Hydraul. Eng., 123, 600–609, https://doi.org/10.1061/(ASCE)0733-9429(1997)123:7(600), 1997.
Li, C. and O'Donnell, J.: Tidally driven residual circulation in shallow estuaries with lateral depth variation, J. Geophys. Res., 102, 27915–27929, https://doi.org/10.1029/97JC02330, 1997.
Liu, J. and Bai, Y. C.: The interactions between wave and cohesive sediment, Mech. Eng., 36, 253–260, https://doi.org/10.6052/1000-0879-13-204, 2014.
Longuet-Higgins, M. S.: On the transport of mass by time-varying ocean currents, Deep-Sea Res. Oceanogr. Abstr., 16, 431–447, https://doi.org/10.1016/0011-7471(69)90031-X, 1969.
Maddock, L. and Pingree, R. D.: Numerical simulation of the Portland tidal eddies, Estuar. Coast. Mar. Sci., 6, 353–363, https://doi.org/10.1016/0302-3524(78)90127-5, 1978.
Mao, L. M., Zhang, Y. L., and Bi, H.: Modern pollen deposits in coastal mangrove swamps from northern Hainan Island, China, J. Coast. Res., 22, 1423–1436, https://doi.org/10.2112/05-0516.1, 2006.
Michel, G., Le Bot, S., Deloffre, J., Legrain, M., Levaillant, R., Simon, M., Tessier, B., and Lesourd, S.: In-situ characterisation of fluvial dune morphology and dynamics under limited sediment supply conditions, Seine River, France, Geomorphology, 439, 108855, https://doi.org/10.1016/j.geomorph.2023.108855, 2023.
Nash, J. E. and Sutcliffe, J. V.: River flow forecasting through conceptual models part I – A discussion of principles, J. Hydrol., 10, 282–290, https://doi.org/10.1016/0022-1694(70)90255-6, 1970.
Niu, J., Xie, J., Lin, S., Lin, P., Gao, F., Zhang, J., and Cai, S.: Importance of bed liquefaction-induced erosion during the winter wind storm in the Yellow River Delta, China, J. Geophys. Res.-Ocean., 128, e2022JC019256, https://doi.org/10.1029/2022JC019256, 2023.
NOAA National Geophysical Data Center: ETOPO1 1 Arc-Minute Global Relief Model, NOAA National Centers for Environmental Information [data set], https://www.ncei.noaa.gov/access/metadata/landing-page/bin/iso?id=gov.noaa.ngdc.mgg.dem:316 (last access: June 2022), 2009.
Papanicolaou, A., Bdour, A., and Wicklein, E.: One-dimensional hydrodynamic/sediment transport model applicable to steep mountain streams, J. Hydraul. Res., 42, 357–375, https://doi.org/10.1080/00221686.2004.9728402, 2004.
Papanicolaou, A., Krallis, M., and Edinger, S.: Sediment transport modeling review – Current and future developments, Adv. Mech., 40, 323–339, https://doi.org/10.6052/1000-0992-2010-3-J2009-110, 2010.
Pingree, R. D. and Maddock, L.: Tidal residuals in the English Channel, J. Mar. Biol. Assoc. UK, 57, 339–354, https://doi.org/10.1017/S0025315400021792, 1977.
Robinson, I. S.: Chapter 7 Tidally Induced Residual Flows, Elsevier, Oceanography, 35, 321–356, https://doi.org/10.1016/S0422-9894(08)70505-1, 1983.
Salleh, S. H., Ahmad, A., Wan-Mohtar, W. H. M., Lim, C. H., and Abdul-Maulud, K. N.: Effect of projected sea level rise on the hydrodynamic and suspended sediment concentration profile of tropical estuary, Reg. Stud. Mar. Sci., 24, 225–236, https://doi.org/10.1016/j.rsma.2018.08.004, 2018.
Smith, P. C.: The Mean and Seasonal Circulation off Southwest Nova Scotia, J. Phys. Oceanogr., 13, 1034–1054, https://doi.org/10.1175/1520-0485(1983)013<1034:TMASCO>2.0.CO;2, 1983.
Spasojevic, M. and Holly, F. M.: 2-D bed evolution in natural watercourses – new simulation approach, J. Waterway Div.-ASCE, 116, 425–443, https://doi.org/10.1061/(ASCE)0733-950X(1990)116:4(425), 1990.
Sun, Q. L., Wang, Q., Shi, F. Y., Alves, T., Gao, S., Xie, X. N., Wu, S. G., and Li, J. B.: Runup of landslide-generated tsunamis controlled by paleogeography and sea-level change, Commun. Earth Environ., 3, 244, https://doi.org/10.1038/s43247-022-00572-w, 2022.
Terêncio, D. P. S., Pacheco, F. A .L., Valle-Junior, R. F., Melo-Silva, M. M. A. P., Pissarra, T. C. T., Melo, M. C., Valera, C. A., and Fernandes, L. F. S.: The Igarapé Weir decelerated transport of contaminated sediment in the Paraopeba River after the failure of the B1 tailings dam (Brumadinho), Int. J. Sediment Res., 38, 673–697, https://doi.org/10.1016/j.ijsrc.2023.06.004, 2023.
Thomas, W. A. and Prashum, A. I.: Mathematical model of scour and deposition, J. Hydr. Div., 103, 851–863, https://doi.org/10.1061/JYCEAJ.0004805, 1977.
Udden, J. A.: Mechanical composition of clastic sediments, GSA Bull., 25, 655–744, https://doi.org/10.1130/GSAB-25-655, 1914.
Uncles, R. J. and Jordan, M. B.: A one-dimensional representation ofresidual currents in the Severn Estuary and associated observations, Estuar. Coast. Mar. Sci., 10, 39–60, https://doi.org/10.1016/S0302-3524(80)80048-X, 1980.
Van-Rijn, L. C.: Sediment Transport, Part I : Bed load transport, J. Hydraul. Eng., 110, 1431–1455, https://doi.org/10.1061/(ASCE)0733-9429(1984)110:10(1431), 1984.
Vinzon, S. B., Gallo, M. N., Gabioux, M., Fonseca, D. L., Achete, F. M., Ghisolfi, R. D., Mill, G. N., Fonseca, S. A. R., Silva-Quaresma, V., Oliveira, K. S. S., Brigagão, G., and Machado, L. G.: The role of waves in the resuspension and transport of fine sediment and mine tailings from the Fundão Dam failure, Doce River, Brazil, Int. J. Sediment Res., 39, 44–60, https://doi.org/10.1016/j.ijsrc.2023.09.004, 2023.
Wang, D., Pei, L., Zhang, L., Li, X., Chen, Z., and Zhou, Y.: Water resource utilization characteristics and driving factors in the Hainan Island, J. Groundw. Sci. Eng., 11, 191–206, https://doi.org/10.26599/JGSE.2023.9280017, 2023.
Wang, X. H.: Analysis of wave characteristics in the offshore area of Dongfang City, Mar. Sci., 47, 31–46, https://doi.org/10.11759/hykx20220919001, 2023.
Wang, X. M., Qu, H. B., Xiong, Y. K., Lu, L., and Hu, K.: Grain-size characteristics and transport trend of bottom sediments at the estuary of Changhua River in Hainan, Geoscience, 36, 88–95, 2022.
Wu, J. Q., Xiao, M., Yang, J. T., Xiao, X. B., and Tang, W. H.: Study on distribution characteristics of soil erosion in the lower reaches of Changhua River in Hainan, Technol. Soil Water Conserv., 3, 12–15, https://doi.org/10.3969/j.issn.1673-5366.2012.03.04, 2012.
Wentworth, C. K.: A scale of grade and class terms for clastic sediments, J. Geol., 30, 377–392, https://doi.org/10.1086/622910, 1922.
Wu, W., Rodi, W., and Wenka, T.: 3D numerical modeling of flow and sediment transport in open channels, J. Hydraul. Eng., 126, 4–15, 2000.
Yang, Z. H., Jia, J. J., Wang, X. K., and Gao, J. H.: Characteristics and variations of water and sediment fluxes into the sea of the top three rivers of Hainan in recent 50 years, Mar. Sci. Bull., 32, 92–99, https://doi.org/10.11840/j.issn.1001-6392.2013.01.014, 2013.
Zeng, Z. X. and Zeng, X. Z.: Physicogeography of Hainan Island, Science Press, Beijing, ISBN: 7030008758, 1989.
Zhang, L. M., Wei, Z. Y., Cao, Q. M., Sang, A. Y., Wang, H., and Qi, Z. P.: Characteristics and influencing factors of sediment concentration in the lower reaches of three major rivers in Hainan Province in recent 40 years, Ecol. Environ. Sci., 15, 765–769, https://doi.org/10.3969/j.issn.1674-5906.2006.04.022, 2006.
Zhang, P., Ruan, H. M., Dai, P. D., Zhao, L. R., and Zhang, J. B.: Spatiotemporal river flux and composition of nutrients affecting adjacent coastal water quality in Hainan Island, J. Hydrol., 591, 125293, https://doi.org/10.1016/j.jhydrol.2020.125293, 2020.
Zhao, E. J., Qu, K., and Mu, L.: Numerical study of morphological response of the sandy bed after tsunami-like wave overtopping an impermeable seawall, Ocean. Eng., 186, 106076, https://doi.org/10.1016/j.oceaneng.2019.05.058, 2019.
Zhao, E. J., Sun, J. K., Tang, Y. Z., Mu, L., and Jiang, H. Y.: Numerical investigation of tsunami wave impacts on different coastal bridge decks using immersed boundary method, Ocean. Eng., 201, 107132, https://doi.org/10.1016/j.oceaneng.2020.107132, 2020.
Zhao, E. J., Dong, Y. K., Tang, Y. Z., and Sun, J. K.: Numerical investigation of hydrodynamic characteristics and local scour mecha-nism around submarine pipelines under joint effect of solitary waves and currents, Ocean. Eng., 222, 108553, https://doi.org/10.1016/j.oceaneng.2020.108553, 2021.
Zhao, E. J., Wu, Y. X., Jiang, F. Y., Wang, Y., Zhang, Z. Y., and Nie, C. H.: Numerical investigation on the influence of the complete tsunami-like wave on the tandem pipeline, Ocean. Eng., 294, 116697, https://doi.org/10.1016/j.oceaneng.2024.116697, 2024.
Zhao, L., Cai, G. Q., Zhong, H. X., Li, B., Zou, L. Q., Li, S., and Han, Y. F.: Grain-size characteristics and sedimentary environment of surface sediments in the shallow sea in the southeast of Hainan Island, Mar. Geol. Quat. Geol., 41, 64–74, 2021.
Zhu, L. R., Liu, Y. H., and Ye, C. Q.: Runoff change and influencing factors of Changhua River in arid area of Hainan Island, Ecol. Sci., 39, 183–189, 2020.
Zimmerman, J.: Dynamics, diffusion and geomorphological significance of tidal residual eddies, Nature, 290, 549–555, https://doi.org/10.1038/290549a0, 1981.