the Creative Commons Attribution 4.0 License.
the Creative Commons Attribution 4.0 License.
 | 30 Oct 2025
Effect of double-diffusion processes in the deep ocean on the distribution and dynamics of particulate and dissolved matter: a case study in the Tyrrhenian Sea
Xavier Durrieu de Madron
Paul Blin
Mireille Pujo-Pay
Vincent Taillandier
Pascal Conan
This study examines conductivity–temperature–depth (CTD), acoustic Doppler current profiler (ADCP) and optical data collected during the PERLE-3 cruise in March 2020 between the surface and 2000 m depth over an east–west section of the Tyrrhenian Sea in the Mediterranean. The focus is on the impact of double-diffusion processes, in particular salt fingering, on the distribution and dynamics of particulate and dissolved matter. Staircases form at the interface between the warm, saline Eastern Intermediate Water (EIW) and the colder, less saline Tyrrhenian Deep Water (TDW) in the centre of the basin in a region of weak hydrodynamic activity. The results show that thermohaline staircases formed by salt fingering significantly influence particle sedimentation and biogeochemical cycling in deep ocean environments by altering vertical flux patterns. These density steps create distinct vertical layers that act as physical barriers, slowing the descent of particles and facilitating their retention and aggregation. The retention of fine particles at density gradients promotes the formation of larger aggregates, thereby affecting the particle size distribution. The staircases also affect dissolved matter by creating pronounced concentration gradients of oxygen and nutrients, which may influence microbial activity and nutrient fluxes.
- Article
(12747 KB) - Full-text XML
- BibTeX
- EndNote


Gravitational settling of biologically derived particles, produced by marine plankton in the surface layer, is the primary driver of vertical fluxes of material in the deep ocean (Newton and Liss, 1990). In general, vertical mass fluxes of particles in the ocean decrease exponentially with depth due to particle degradation and the increasing density of ambient seawater (Omand et al., 2020). Marine particles have a wide range of sizes, from micrometres (clays) to centimetres (organic detritus). Particles tend to agglomerate to form aggregates of different sizes, shapes, densities and characteristics (Kiko et al., 2022). The change in the geometry of the aggregates and their excess density compared to seawater are the factors that determine their sedimentation rate.
The water column in the ocean is composed of the superposition of water masses with generally distinct thermohaline characteristics and often distant origins. Large density interfaces, associated with strong vertical gradients in temperature (∼ 0.25 °C m−1) at seasonal thermoclines or in salinity (∼ 0.5 g kg−1 m−1) at river plumes, can occur in the upper ocean, resulting in the retention of the less dense particles. In the ocean, temperature and salinity gradients are much weaker, and the effect of particle size becomes greater than the effect of density excess, so that the settling velocity generally increases with particle size. Thus, the settling velocities in the open ocean are on the order of 5 × 10⁻⁴ to 1 mm s−1 for particles ranging from 2 to 300 µm (McCave, 1975).
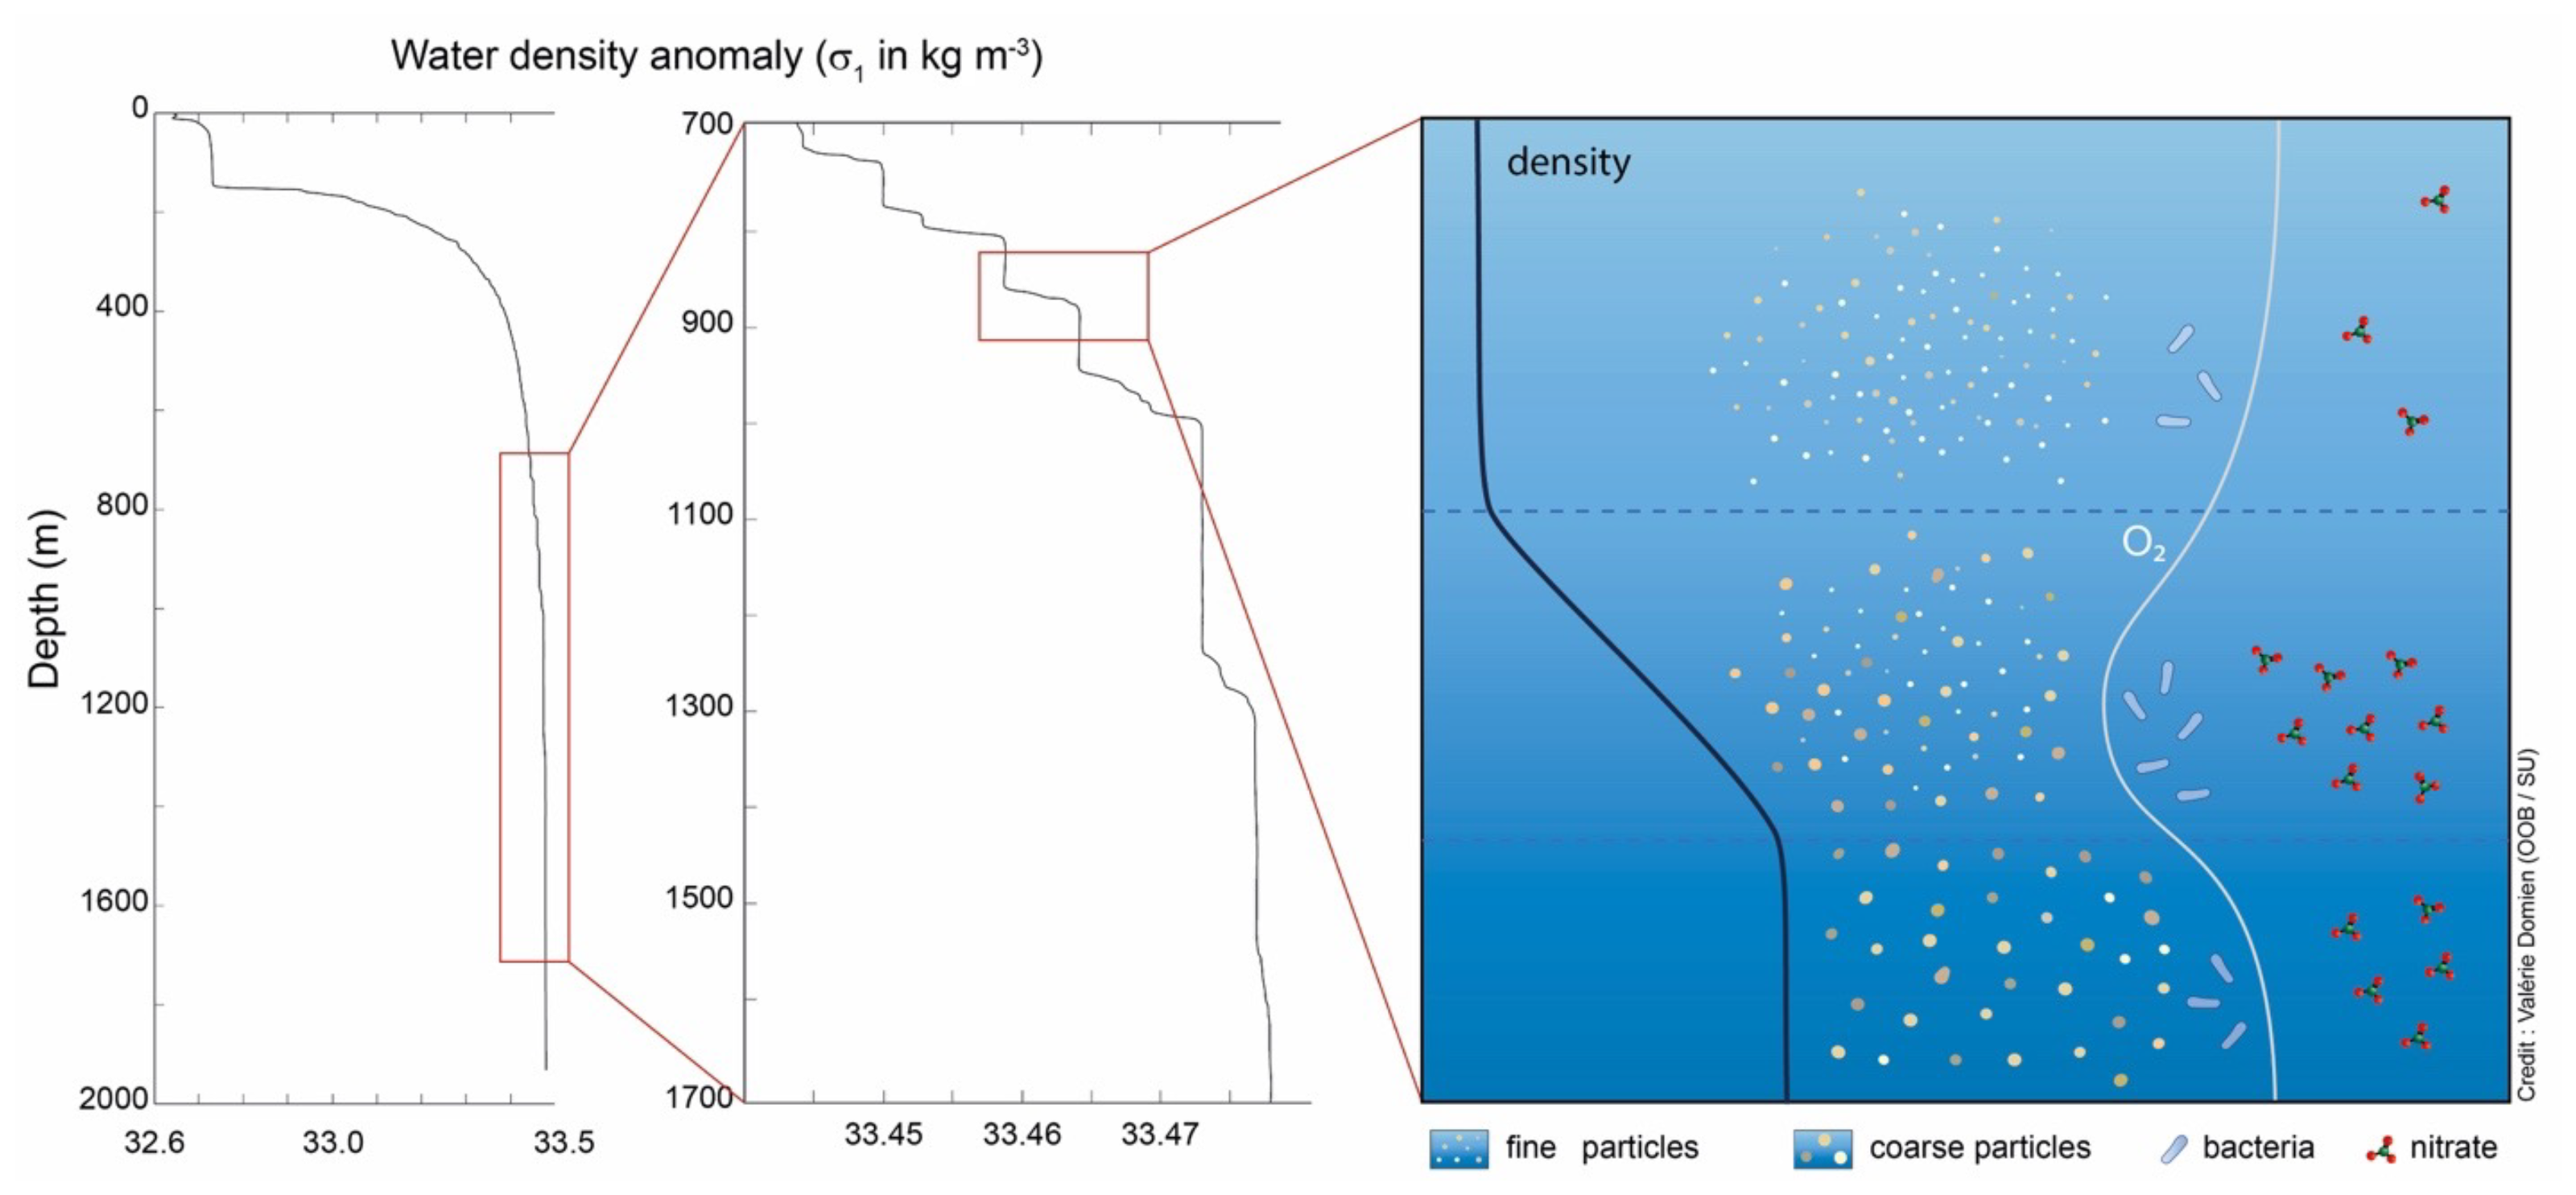
However, in the deep ocean, in the transition zones between two water masses, areas of enhanced density gradients can occur due to double-diffusion processes, in particular those associated with salt fingers. Salt fingering is a common process in the ocean (Kunze, 2003; Radko et al., 2014). It requires a stably stratified water column, where a layer of warm, saline water overlies a layer of cooler, less saline water. Because the molecular diffusion of temperature is about 100 times faster than that of salinity, the salinity interface initially remains essentially unchanged as temperature exchange occurs across the interface. As a result, the saltier water above this thin mixed layer of average temperature becomes denser than the less saline water below. This leads to salt-finger instabilities at the interface, whereby saltier water sinks and less saline water rises. The mixing process is then repeated at the new interfaces, resulting in a progressive thickening of the mixed layer and an increase in the vertical density gradients on either side of the interface. If favourable conditions persist, step structures can develop and reach thicknesses of several tens of metres. These staircases exhibit temperature and salinity steps ranging between 0.001 and 0.019 °C and between 0.001 and 0.2 g kg−1, respectively (van der Boog et al., 2021).
Various experimental and numerical studies have explored the impact of density interfaces on the sedimentation of particulate material; however, to our knowledge, very little research has been applied to the deep oceanic environment. Laboratory experiments conducted for a variety of individual particle geometries and densities (e.g. Prairie et al., 2013; Mrokowska, 2018; Doostmohammadi and Ardekani, 2014; Doostmohammadi and Ardekani, 2015; Verso et al., 2019) have generally shown a decrease in settling velocity, as well as a reorientation of the particles, during their passage through the transition layer formed by the density interface. The initial decrease is followed by an increase, once the particle reaches the base of the interface, but this settling velocity is always smaller in the lower layer due to its higher density. The initial decrease in velocity in the interface is likely due to the entrainment of less dense water by the particles and the drag created by their wake as they cross the interface. Finally, Maggi (2013) showed that sedimentation rates are highly correlated with size for mineral particles but are much less clear for biomineral or biological material. Thus, the sedimentation rate of a solid particle alone will depend almost exclusively on its size. This is not the case for aggregates, where composition, shape, excess density and porosity must also be taken into account. Kindler et al. (2010) demonstrated that slowly sinking particles, like highly porous aggregates, can be retained and, therefore, accumulate at density interfaces, increasing the likelihood of collisions and subsequent aggregation. They suggested that this increase in retention time may affect carbon transformation through the increased microbial colonization and utilization of particles and the release of dissolved organics.
The Mediterranean Sea is a prime location for the observation and study of thermohaline staircases due to its unique hydrographic conditions. The study presented here focuses on the behaviour of particulate matter and dissolved elements in the Tyrrhenian Sea (Fig. 1a), a region known to be favourable for salt fingers with the formation of large staircases at the transition between intermediate and deep waters (Durante et al., 2019). The Tyrrhenian Sea has a complex circulation pattern characterized by three main water masses: Atlantic Water (AW) at the surface, Eastern Intermediate Water (EIW) at intermediate depths and Tyrrhenian Deep Water (TDW) in the deeper layers (Millot and Taupier-Letage, 2005; Iacono et al., 2021). Note that the names of the water masses follow the nomenclature recommended by Schroeder et al. (2024). The surface circulation shows strong seasonal variability, with a basin-wide cyclonic pattern in winter, which weakens and becomes more complex in summer. The EIW, formed in the eastern Mediterranean Basin, enters through the Strait of Sicily. It is found throughout the Tyrrhenian Sea at depths between 200 and 700 m. It is part of the cyclonic flow and exits through the Corsican and Sardinian channels. The deep circulation, involving the TDWs, is defined as resulting from the mixing of the deep waters of the western Mediterranean with the intermediate and deep waters of the eastern basin (Sparnocchia et al., 1999). Staircase structures, characterized by remarkable spatial and temporal stability, extend over most of the central basin at depths between 600 and 2500 m, with individual layers spanning tens or even hundreds of metres in thickness. These persistent formations have been consistently observed and documented over several decades, demonstrating their long-term coherence in the region (Johannessen and Lee, 1974; Molcard and Tait, 1977; Zodiatis and Gasparini, 1996; Sparnocchia et al., 1999; Falco et al., 2016).
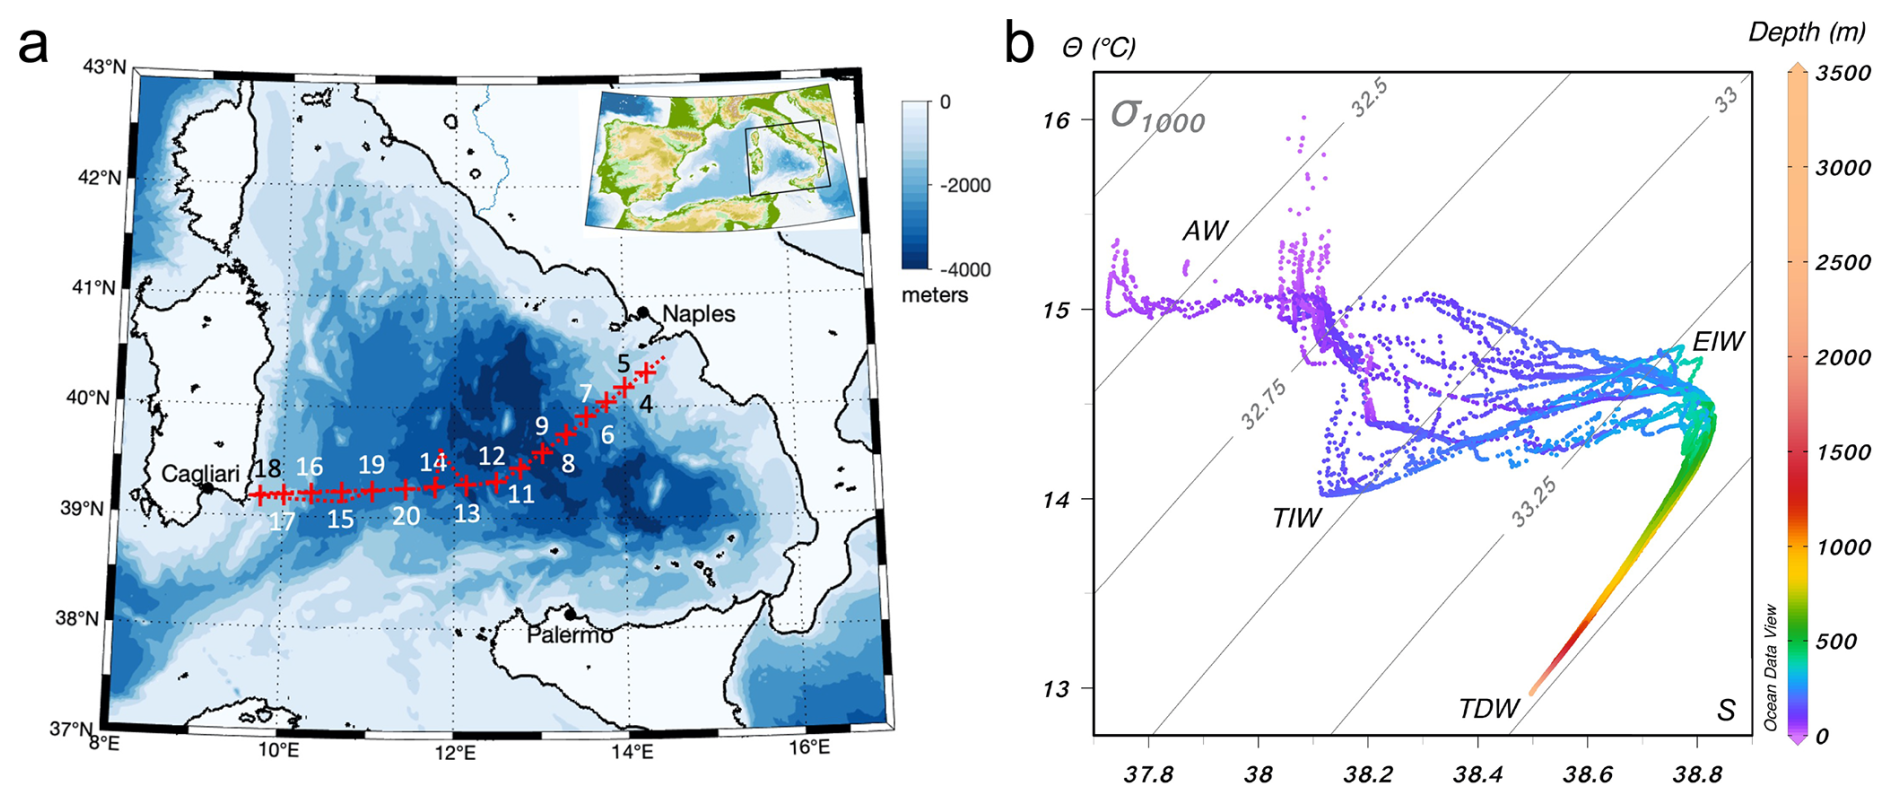
Figure 1(a) Map of the stations carried out during part of the PERLE-3 cruise (14–16 March 2020) in the Tyrrhenian Sea. The route followed by the ship is indicated by the dotted red line. The northward deviation in the centre of the basin is associated with the recovery of the profiling float. (b) θ–S diagram for the different stations of the transect and associated water masses (AW, Atlantic Water; TIW, Tyrrhenian Intermediate Water; EIW, Eastern Intermediate Water; TDW, Tyrrhenian Deep Water), with depth shown using the colour bar. Reiner Schlitzer, Ocean Data View, http://odv.awi.de (last access: 11 September 2025), 2025.
The dataset used in this work was obtained from the PERLE-3 cruise (Pujo-Pay et al., 2020), whose main objective was to study the formation of Levantine Intermediate Water in the eastern basin and their fate and transformation along their course in the Mediterranean Sea. Here, we focused on a section between the Bay of Naples and southern Sardinia, which cuts across the Tyrrhenian Sea from east to west. The data collected included hydrological parameters (temperature, salinity and density), hydrodynamic parameters (current velocity and direction), and particulate (turbidity, large particle size and abundance) and dissolved (oxygen and nitrate) parameters in the upper 2000 m of the water column. The two questions addressed here are as follows:
-
What are the characteristics and development conditions of the notable staircase structures observed during this cruise?
-
What is the impact of these staircases on the distribution of dissolved and particulate matter?
The answers to these two questions will provide new insights into the ecological consequences of these small-scale structures.
2.1 Hydrographical and optical data
This hydrographic survey of the Tyrrhenian Sea was conducted in March 2020 as part of the PERLE-3 cruise, which was unexpectedly shortened due to the outbreak of the COVID-19 pandemic. It includes 16 stations for which hydrological profiles were obtained between the surface and 2000 m with a Sea-Bird 911+ CTD-O2 probe (where CTD denotes conductivity–temperature–depth) mounted on a rosette carrying twenty-two 12 L Niskin bottles. Additional optical sensors (WET Labs C-Star 0.25 m pathlength transmissometer at 650 nm wavelength, Sea-Bird SUNA V2 UV nitrate sensor and Hydroptic Underwater Vision Profiler UVP-5) were connected to the probe.
Data from the CTD sensors and the transmissometer were recorded at a frequency of 24 Hz. Data were therefore acquired at 2 cm vertical intervals at a descent rate of 1 m s−1. The temperature and conductivity sensors provided measurements with a resolution of 2 × 10⁻⁴ °C (4 × 10⁻⁵ S m−1) and an accuracy of 2 × 10⁻³ °C (3 × 10⁻⁴ S m−1), respectively. The dissolved oxygen sensor provided measurements with a resolution of 0.2 µmol L−1. The transmissometer has a resolution of 0.3 mV over a range of 0–5 V (WET Labs, Inc., 2011), giving a beam attenuation coefficient (BAC) of ), where T% is the transmittance in percent, and a resolution of 10−3 m−1. The UVP-5 is a stand-alone camera mounted on the CTD/rosette frame to quantify the vertical distribution of large particles and zooplankton. Images were acquired at a frequency of up to 6 Hz, i.e. on average every 20 cm at a descent rate of 1 m s−1. The small size limit of the UVP-5 is determined by the optical resolution (94.7 µm corresponding to 1 pixel), while the large size limit is determined by the volume of water illuminated (1.02 L).
The stand-alone Sea-Bird SUNA V2 UV nitrate sensor attached to the CTD collected data at 1 Hz from the surface down to 2000 m. It uses ultraviolet absorption spectroscopy to measure nitrate in situ. Strong agreement was observed with discrete bottle measurements over the entire water column collected during the cruise at PERLE3-10 station (R2= 0.99, N= 27 samples, , NO.
The CTD data processing was performed with the SBE Data Processing software, and derived variables (the potential temperature, practical salinity, potential density anomaly, Brunt–Väisälä frequency and density ratio) were estimated based on the TEOS-10 toolbox (IOC, SCOR and IAPSO, 2010). The practical salinity was measured using the practical salinity scale.
The transmissometer provides a BAC, which is linearly correlated with the particle concentration. This signal is influenced by the size and composition of the particles (Hill et al., 2011). Due to their prevalence and larger surface-to-volume ratio, this signal is primarily sensitive to the finest particles (submicron to micrometre scale). As a result, turbidity spikes caused by the rare passage of large particles through the beam were eliminated by smoothing (Giering et al., 2020).
The Underwater Vision Profiler (UVP) provides quantitative data on the abundance (in units of number of particles per litre, no. L−1) of large particles, estimated from raw images (Picheral et al., 2010), for different size classes between 80 and 2000 µm (equivalent circular diameter). This material is hereafter referred to as “large particulate matter” (LPM). The UVP data were then processed to estimate the particle size distribution, which was modelled using a typical power law of the form , where C represents a constant, d stands for particle diameter and α denotes the Junge index (Guidi et al., 2009), as a proxy for the particle size distribution. The Junge index is determined through linear regression involving log-transformed values of N(d) and d. The calculation was performed on the size range between 80 and 400 µm, to consider only the most abundant particles, which represent up to 99 % of the total number observed and whose concentration is greater than 1 particle L−1 (Table A1). The Junge index, α, varies between 2.5 and 4.5 for this dataset. A slope of the differential particle size distribution of 3 indicates an equal amount of mass in logarithmically increasing size intervals. Higher values indicate a greater dominance of fine particles within the particle population, whereas lower values are associated with particle populations enriched in larger particles.
Another CTD dataset was collected from a Biogeochemical-Argo (BGC-Argo) profiling float (WMO 6902 903). This float was equipped with a pumped SBE-41CP CTD with a sampling at 0.5 Hz with an instrumental precision of 0.01 in practical salinity, 0.002 °C in temperature and 2.4 dbar in pressure. CTD profiles were collected during an ascent from the parking depth to the surface, which took between 3 and 6 h, depending on the depth, at a nominal vertical speed of 0.1 m s−1. The profiling float collected data for almost 2 years, between 23 June 2018 and 15 March 2020 (date of recovery during the PERLE-3 cruise). It remained in the centre of the Tyrrhenian Basin (between 39.1 and 39.7° N and between 11.6 and 12.8° E) during this period. The resulting time series of CTD profiles includes 16 profiles between 0 and 1000 m from 23 June to 6 July 2018 and 118 profiles between 0 and 2000 m from 13 July 2018 to 15 March 2020, with a temporal resolution of 7 d until October 2019 and then 3 d thereafter. The filtering step was crucial, given the scales on which the study focused, to remove the spikes and reduce the noise of the signal while maintaining the best vertical resolution. The 24 Hz raw data were subjected to outlier removal using two successive moving median filters with window lengths of 7 and 5 scans, respectively. The data were then binned at 1 m intervals and smoothed with a LOESS regression filter. For temperature, salinity and potential density anomaly signals, the LOESS regression smoothing window length was 10 scans (10 m). For the dissolved oxygen, nitrate, beam attenuation coefficient, UVP and Junge index signals, we applied a LOESS regression smoothing with a window length of 50 scans (50 m).
Thermohaline staircases are characterized by alternating mixed layers, which are thick regions of nearly constant temperature, salinity and density, and interfaces, which are thin layers with sharp changes in temperature, salinity and density. Staircase structures were defined based on temperature and salinity profiles between 500 and 2000 m depth, following the procedure described in Durante et al. (2019). Relative maxima in the vertical gradient of salinity and potential temperature are used to identify interfaces that form well-marked steps and delimit a well-mixed layer. Gradient thresholds of 10−4 °C m−1 for potential temperature and 5 × 10⁻⁴ m−1 for salinity were used.
2.2 Acoustic data
During the PERLE-3 survey, two shipboard acoustic Doppler current profilers (ADCPs) – S-ADCPs – continuously collected current data from 21 to 1200 m depth. The first S-ADCP was an RDI OS150 with an acoustic frequency of 150 kHz, a sampling rate of 1 Hz and a cell size of 8 m, allowing a total range of 220 m. The second S-ADCP was an RDI OS38 with an acoustic frequency of 38 kHz, a sampling rate of 1 Hz and a cell size of 8 m, allowing a maximum range of 1200 m. Data averaged over a 2 min period were concatenated and processed using Cascade V7.2 processing software (Kermabon et al., 2018) to compute horizontal ocean current velocities with a spatial resolution of 2 km, corrected for navigation and ship attitude parameters, and filtered according to various quality criteria (i.e. thresholds on vertical velocity error, vertical shear, correlation and minimum percentage of valid ensembles; Kermabon et al., 2018). Bathymetry (ETOPO1 with a 1 arcmin resolution) was incorporated in the processing to account for bottom detection. The profile data for the meridional and zonal components of the current for the two S-ADCPs were combined to obtain a complete profile between 21 and 1200 m depth with maximum resolution in the surface layer.
In addition to the S-ADCP current measurements, current data between the surface and 2000 m depth were also collected using a dual-head lowered-acoustic Doppler current profiler (L-ADCP) system. These measurements were collected with two RDI Workhorse 300 kHz current meters mounted on the CTD frame, one looking up and one looking down. The vertical profiling resolution was 8 m. The data were processed by the velocity inversion method using version IX of the LDEO software (Thurnherr, 2021). Qualified external data (CTD, S-ADCP and GPS) were used to process the L-ADCP data. The horizontal current profiles generated by the L-ADCPs were combined with the current profiles from the S-ADCPs to generate current sections between 21 and 2000 m. Vertical ocean velocities were calculated using the LADCP_w_ ocean utility from combined raw L-ADCP and CTD data (Thurnherr, 2022). The upward- and downward-looking data were processed separately and combined during post-processing to provide vertical velocity profiles for the downcast and upcast with a vertical resolution of 40 m.
The vertical shear squared (Sh2) was calculated from the vertical gradients of the velocity components measured by the L-ADCP using the following formula: Sh, where u and v are the zonal and meridional horizontal velocity components, and z is depth. The gradient Richardson number (Ri), defined as Ri = Sh2, quantifies the balance between stratification and shear-driven turbulence, with N2 representing the buoyancy frequency squared. To ensure consistency and reduce noise, the temperature, salinity (used to calculate density) and velocity components were smoothed using a Savitzky–Golay filter with a 48 m window length. The vertical gradients of buoyancy and shear frequencies were then computed over this smoothing interval.
The data from the 38 kHz S-ADCP were also used to derive the acoustic backscatter index (BI, as described by Mullison, 2017), which is a proxy for the abundance of centimetre-scale reflectors (e.g. organic detritus, zooplankton and micronekton) in the water column. This derivation takes into account the absorption and geometric dispersion of sound, BI , where Kc is the conversion factor (count to decibels) of the ADCP used, RL is the received signal, Er is the signal noise, and TLw and TLg are the absorption and geometric transmission losses of the acoustic signal in water, respectively.
2.3 Selection of representative stations
A classification of the deep stations (i.e. those reaching 2000 m) was made via the threshold-based detection of buoyancy frequency anomalies between 700 and 2000 m relative to the background stratification. The “WStairs” category includes stations with two to four sharp staircases characterized by N peaks (> 0.6 cph, where cph denotes cycles per hour), corresponding to strong density gradients, bounded above and below by well-mixed layers (Fig. B1a, b). The “NoStair” category includes stations with smoother N profiles without multiple strong stairs (Fig. B1b, d). The “NoStair” group differs in particular due to the absence of thermohaline stairs between 500 and 1000 m, unlike the “WStairs” group. The “WStairs” category comprises stations 8, 9, 11, 12, 13 and 15, while the “NoStair” category includes stations 7, 14, 16, 19 and 20. The vertical profiles of key thermohaline parameters (temperature, potential, salinity and potential density anomaly), particulate parameters (the beam attenuation coefficient, large particle abundance and Junge index) and biogeochemical parameters (dissolved oxygen, nitrate and apparent oxygen utilization) are presented here for a representative station of both categories. Station 9 was chosen as a representative station “WStairs” for the processes occurring at the density interfaces, while station 20 was chosen as representative of the “NoStair” category.
A statistical approach was used to compare the evolution of parameters measured as a function of depth between the two groups of stations. It is based on a multiple linear regression model (Aiken et al., 1991) that includes an interaction term between depth and staircase condition, which allows for the study of how the relationship between depth and the selected parameter varies depending on the presence or absence of thermohaline staircases. The model is expressed as follows:
where the condition variable is coded as a binary variable (1 for the presence of staircases or 0 for their absence) and the depth × condition term represents the interaction. In this equation, b1 corresponds to the slope of the parameter as a function of depth for the reference condition (“NoStair”), b2 indicates the difference in intercept between the presence and absence of staircases, and b3 measures the interaction effect (i.e. the difference in the slope of the relationship between depth and the selected parameter depending on the staircase condition). The statistical significance of the interaction term (p value of b3) indicates that the relationship between depth and the selected parameter differs significantly between both conditions, even if the difference in slope is small.
3.1 Hydrological and hydrodynamical features along the section
3.1.1 Temperature, salinity, oxygen and nitrate
The temperature–salinity diagram (Fig. 1b) and the basin cross-section (Fig. 2) clearly identify the distribution of the water masses present in the study area. As in Falco et al. (2016), we used the isohaline 38.72 as the minimum salinity value to identify the shallowest and deepest levels of the EIW. The AW, which extends through the upper 200 m of the water column, exhibits higher temperatures and lower salinities toward the east. The colder Tyrrhenian Intermediate Water (TIW) can be distinguished between 150 and 220 m in a tongue-like feature trapped in an anticyclonic eddy in the middle of the section (see Sect. 3.1.2). The warmer, saltier and oxygen-depleted core of the EIW is located at depths ranging from 300 to 600 m, as illustrated in Fig. 2a, b and c, respectively. The core of the colder and less saline TDW is visible beyond 1200 m depth (Fig. 2a and b).
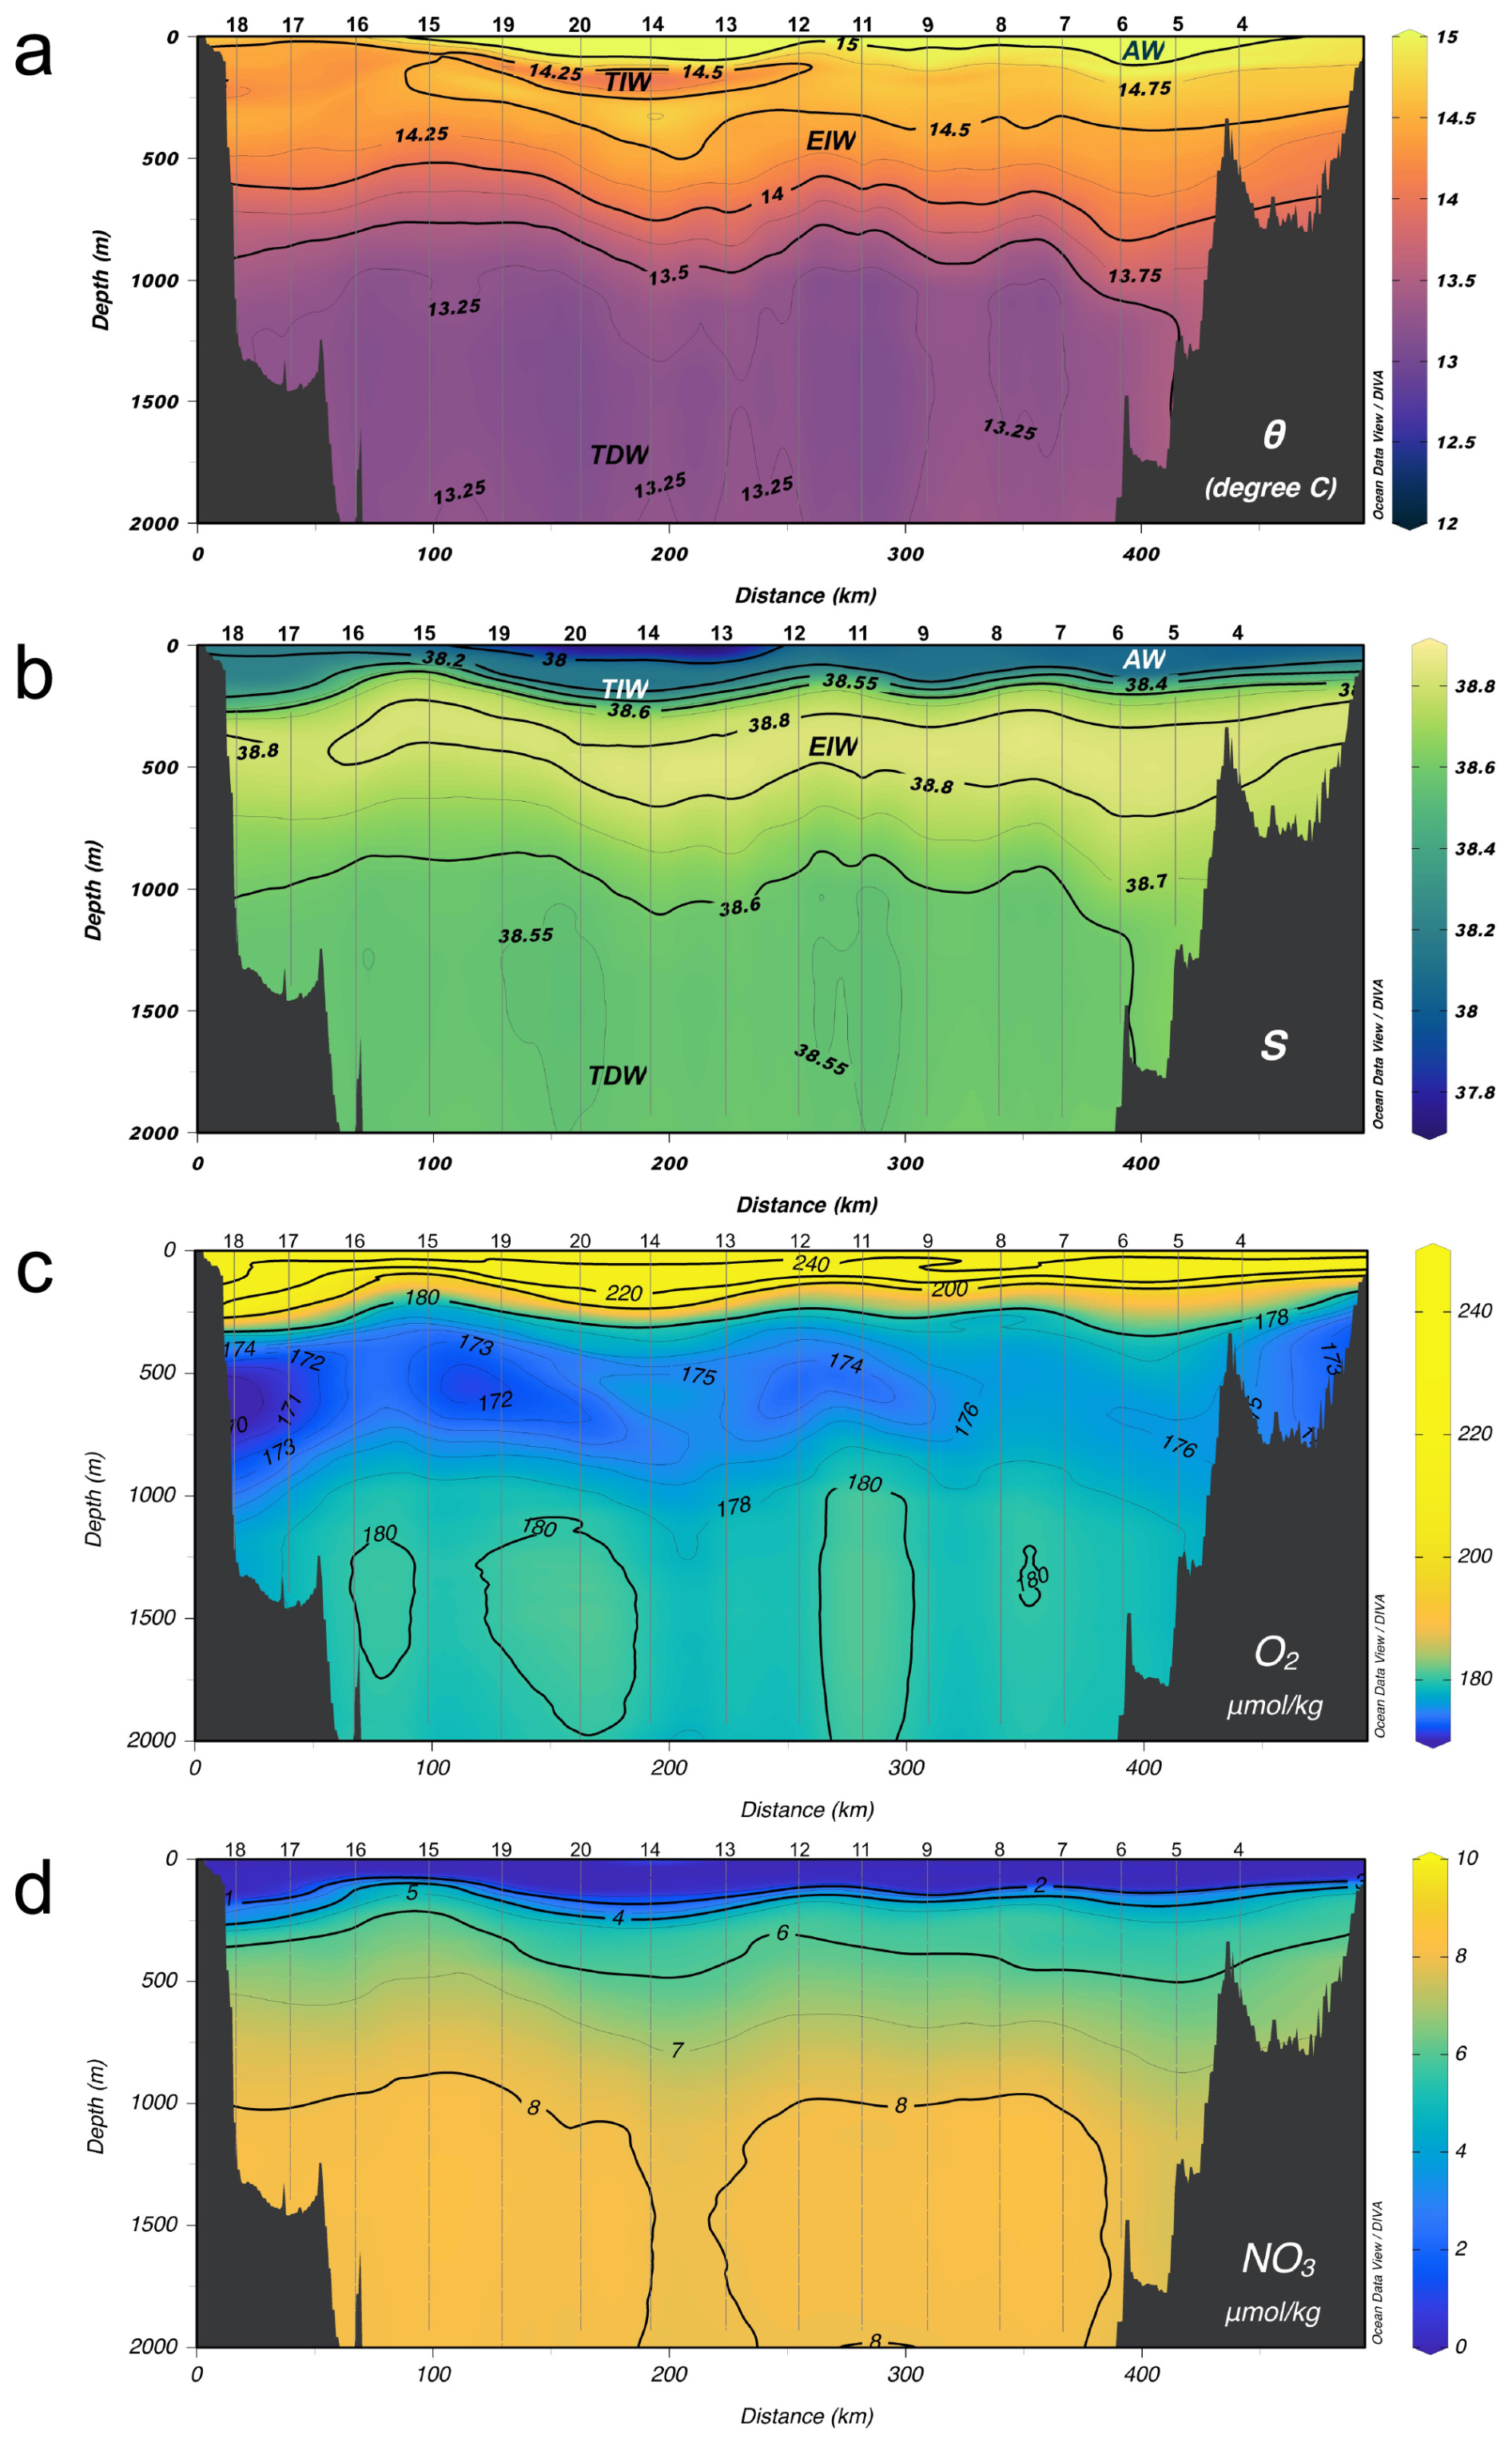
Figure 2Cross-basin section of (a) potential temperature, (b) salinity, (c) dissolved oxygen and (d) nitrate for the PERLE-3 cruise (March 2020). The upper x axis indicates the station number along the section that runs from west (station 18) to east (station 4). Reiner Schlitzer, Ocean Data View, http://odv.awi.de, 2025.
In March, the nitrate distribution in the Tyrrhenian Sea (Fig. 2d) shows a nutrient-poor surface layer and a deeper, nutrient-rich layer, typical of oligotrophic conditions. Near the surface, nitrate concentrations are low, about 1 µmol kg−1, due to biological uptake. Nitrate concentrations increase with increasing depth. At intermediate depths (250–650 m), concentrations range from 4 to 7 µmol kg−1, indicating a transition zone with maximum vertical gradients. In deeper waters, concentrations reach 7 to 9 µmol kg−1 due to decomposing organic matter. An anticyclonic eddy around 12° E and the boundary current jet, especially over the eastern part of the section, modify the intermediate water depth (EIW) by a few hundred metres without significantly affecting the deep water depth (TDW). To the west, the signature of a cyclonic eddy is also visible and contributes to the vertical modulation of isopycnals. These mesoscale structures affect the distribution of oxygen and nitrate, which increase less rapidly with depth beneath them.
3.1.2 Currents
Dynamic topography and observed horizontal velocity in the water column during PERLE-3 reveal the presence of two large mesoscale eddies in the centre of the basin with maximum horizontal velocities of 10–15 cm s−1 (Fig. 3a, b). The southern edge of the cyclonic eddy at 10.5° E extends to a depth of about 200 m, while the anticyclonic eddy at 12° E extends to more than 500 m. The deep current running along the eastern edge of the basin defines the general along-slope cyclonic circulation. Below the EIW core, i.e. at 600 m depth, the currents are very weak, of the order of a few centimetres per second (Fig. 3c). The Richardson number (Ri; Fig. 3d) is high in the surface layers down to a depth of approximately 500 m, indicating high water column stability and low vertical mixing potential. Below this depth, Ri decreases significantly, due to weak stratification, indicating potential zones of enhanced vertical mixing.
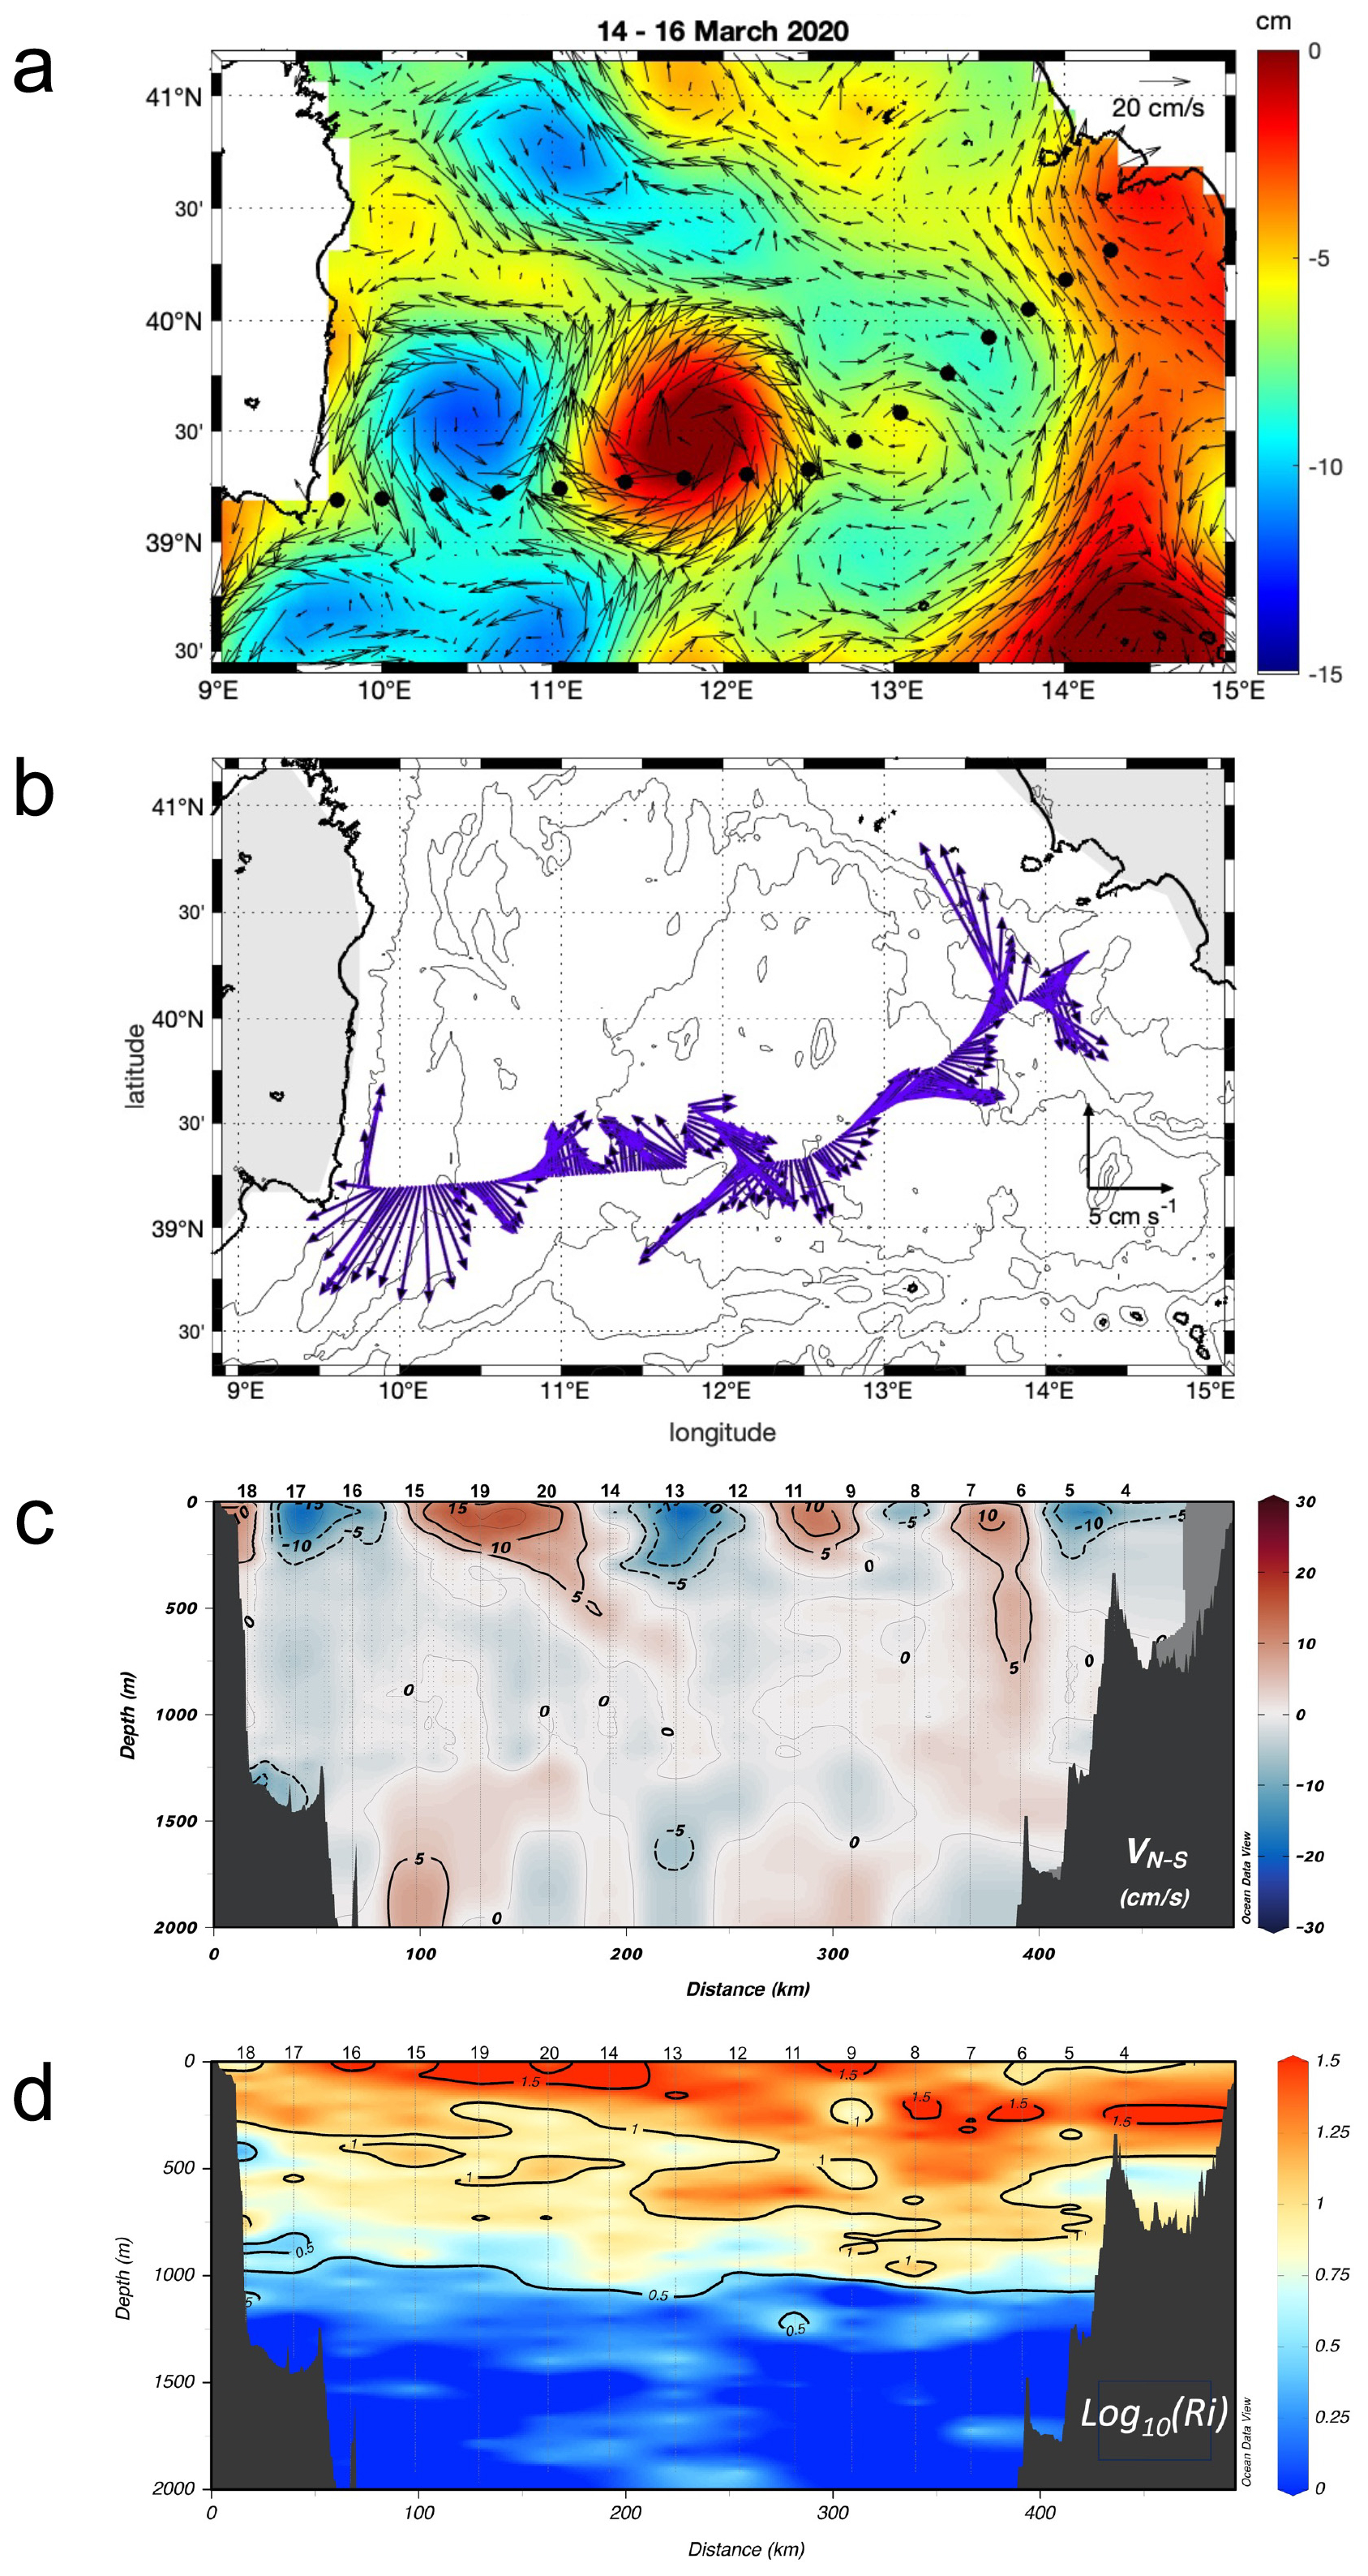
Figure 3(a) Absolute dynamic topography (in cm) and surface geostrophic currents derived from daily Copernicus Marine Environment Monitoring Service Gridded L4 data (interpolated to 3.75 arcmin), averaged over the period of the PERLE-3 cruise (14–16 March 2020). Black dots indicate station locations; see Fig. 1 for station numbering. (b) Stick plot of vertically averaged S-ADCP currents between 21 and 1200 m along the ship's route across the basin. (c) Meridional component of combined S-ADCP and L-ADCP currents. (d) Richardson number derived from the L-ADCP measurements. The upper x axis indicates the station number along the section that runs from west (station 18) to east (station 4). Reiner Schlitzer, Ocean Data View, http://odv.awi.de, 2025.
The estimated vertical velocities for the layer between the surface and 2000 m depth (Fig. 4) are between −15 and +15 mm s−1 with a root-mean-square (rms) of 4 mm s−1. Apart from greater vertical shear in the upper 300 m of the water column on either side of the eddy at around 12° E, there was no notable spatial variation in vertical velocities. In particular, there are no statistically significant differences in the vertical velocity histograms between the “WStairs” and “NoStair” station groups for depths between 700 and 2000 m.
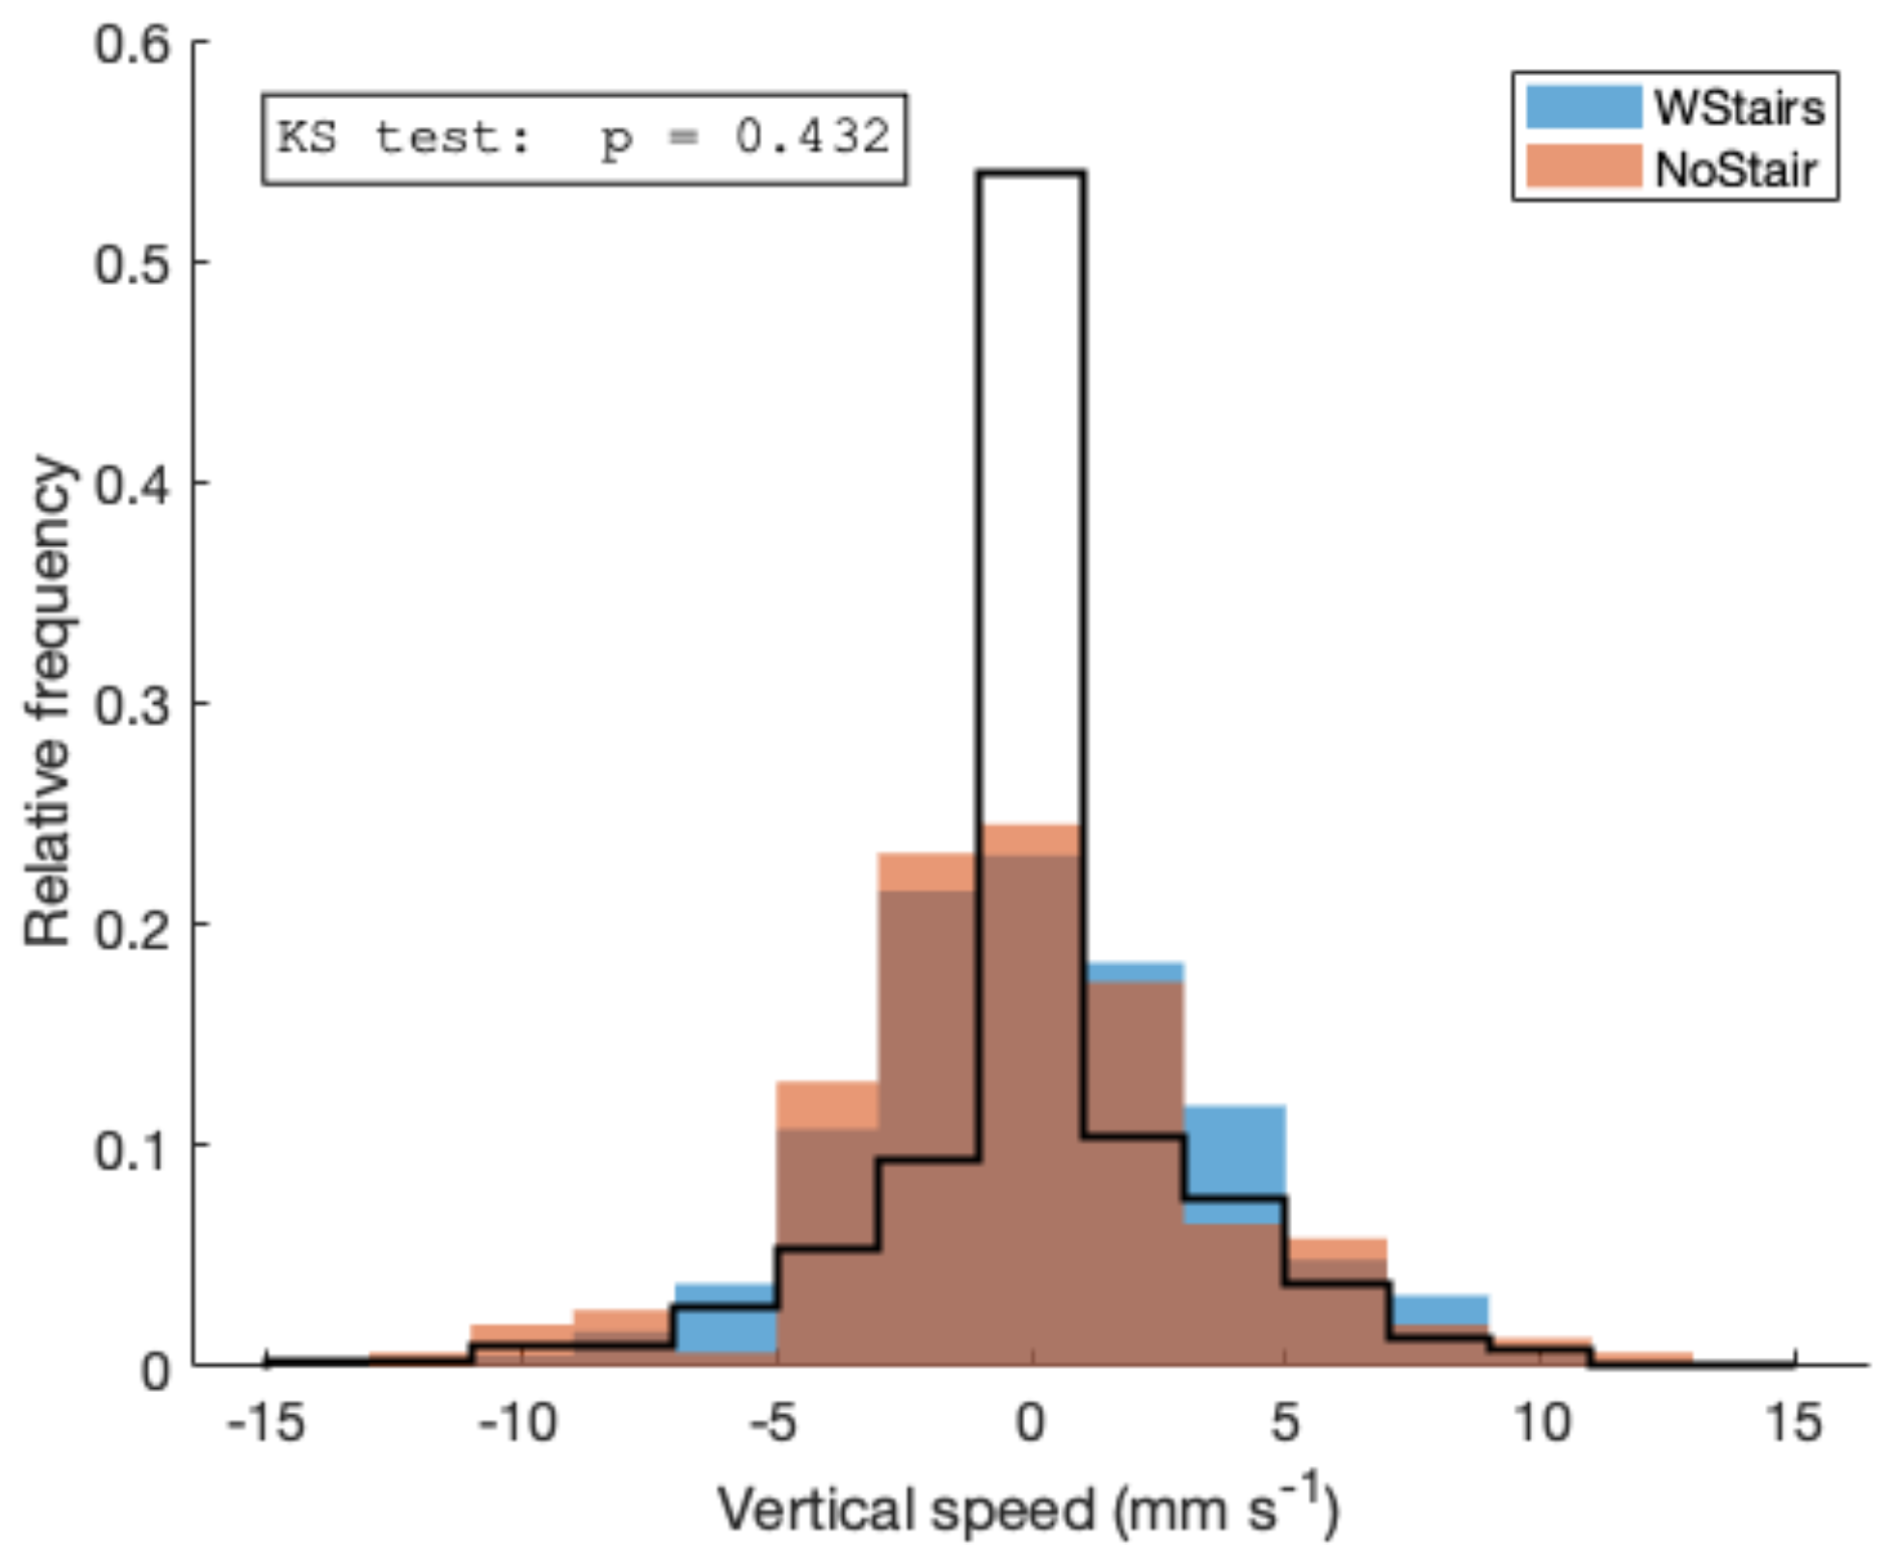
Figure 4Histograms of the estimated vertical velocities between 700 and 2000 m for all deep stations for the “WStairs” or “NoStair” groups. The black line represents to the entire dataset, including all stations and the full water column. The Kolmogorov–Smirnov test, which gives a p value greater than 0.05, indicates that the differences between the two populations of vertical velocity are statistically similar in terms of distribution.
3.1.3 Turbidity, large particle abundance and the Junge index
The beam attenuation coefficient, an indicator of the abundance of small particles (Fig. 5a), is highest in the surface layer and along the continental slope on both sides of the basin. The tongue-like feature of turbid water that descends to 500–600 m in the western half of the basin (stations 19–20) is associated with the downward movement of water around the anticyclonic eddy.
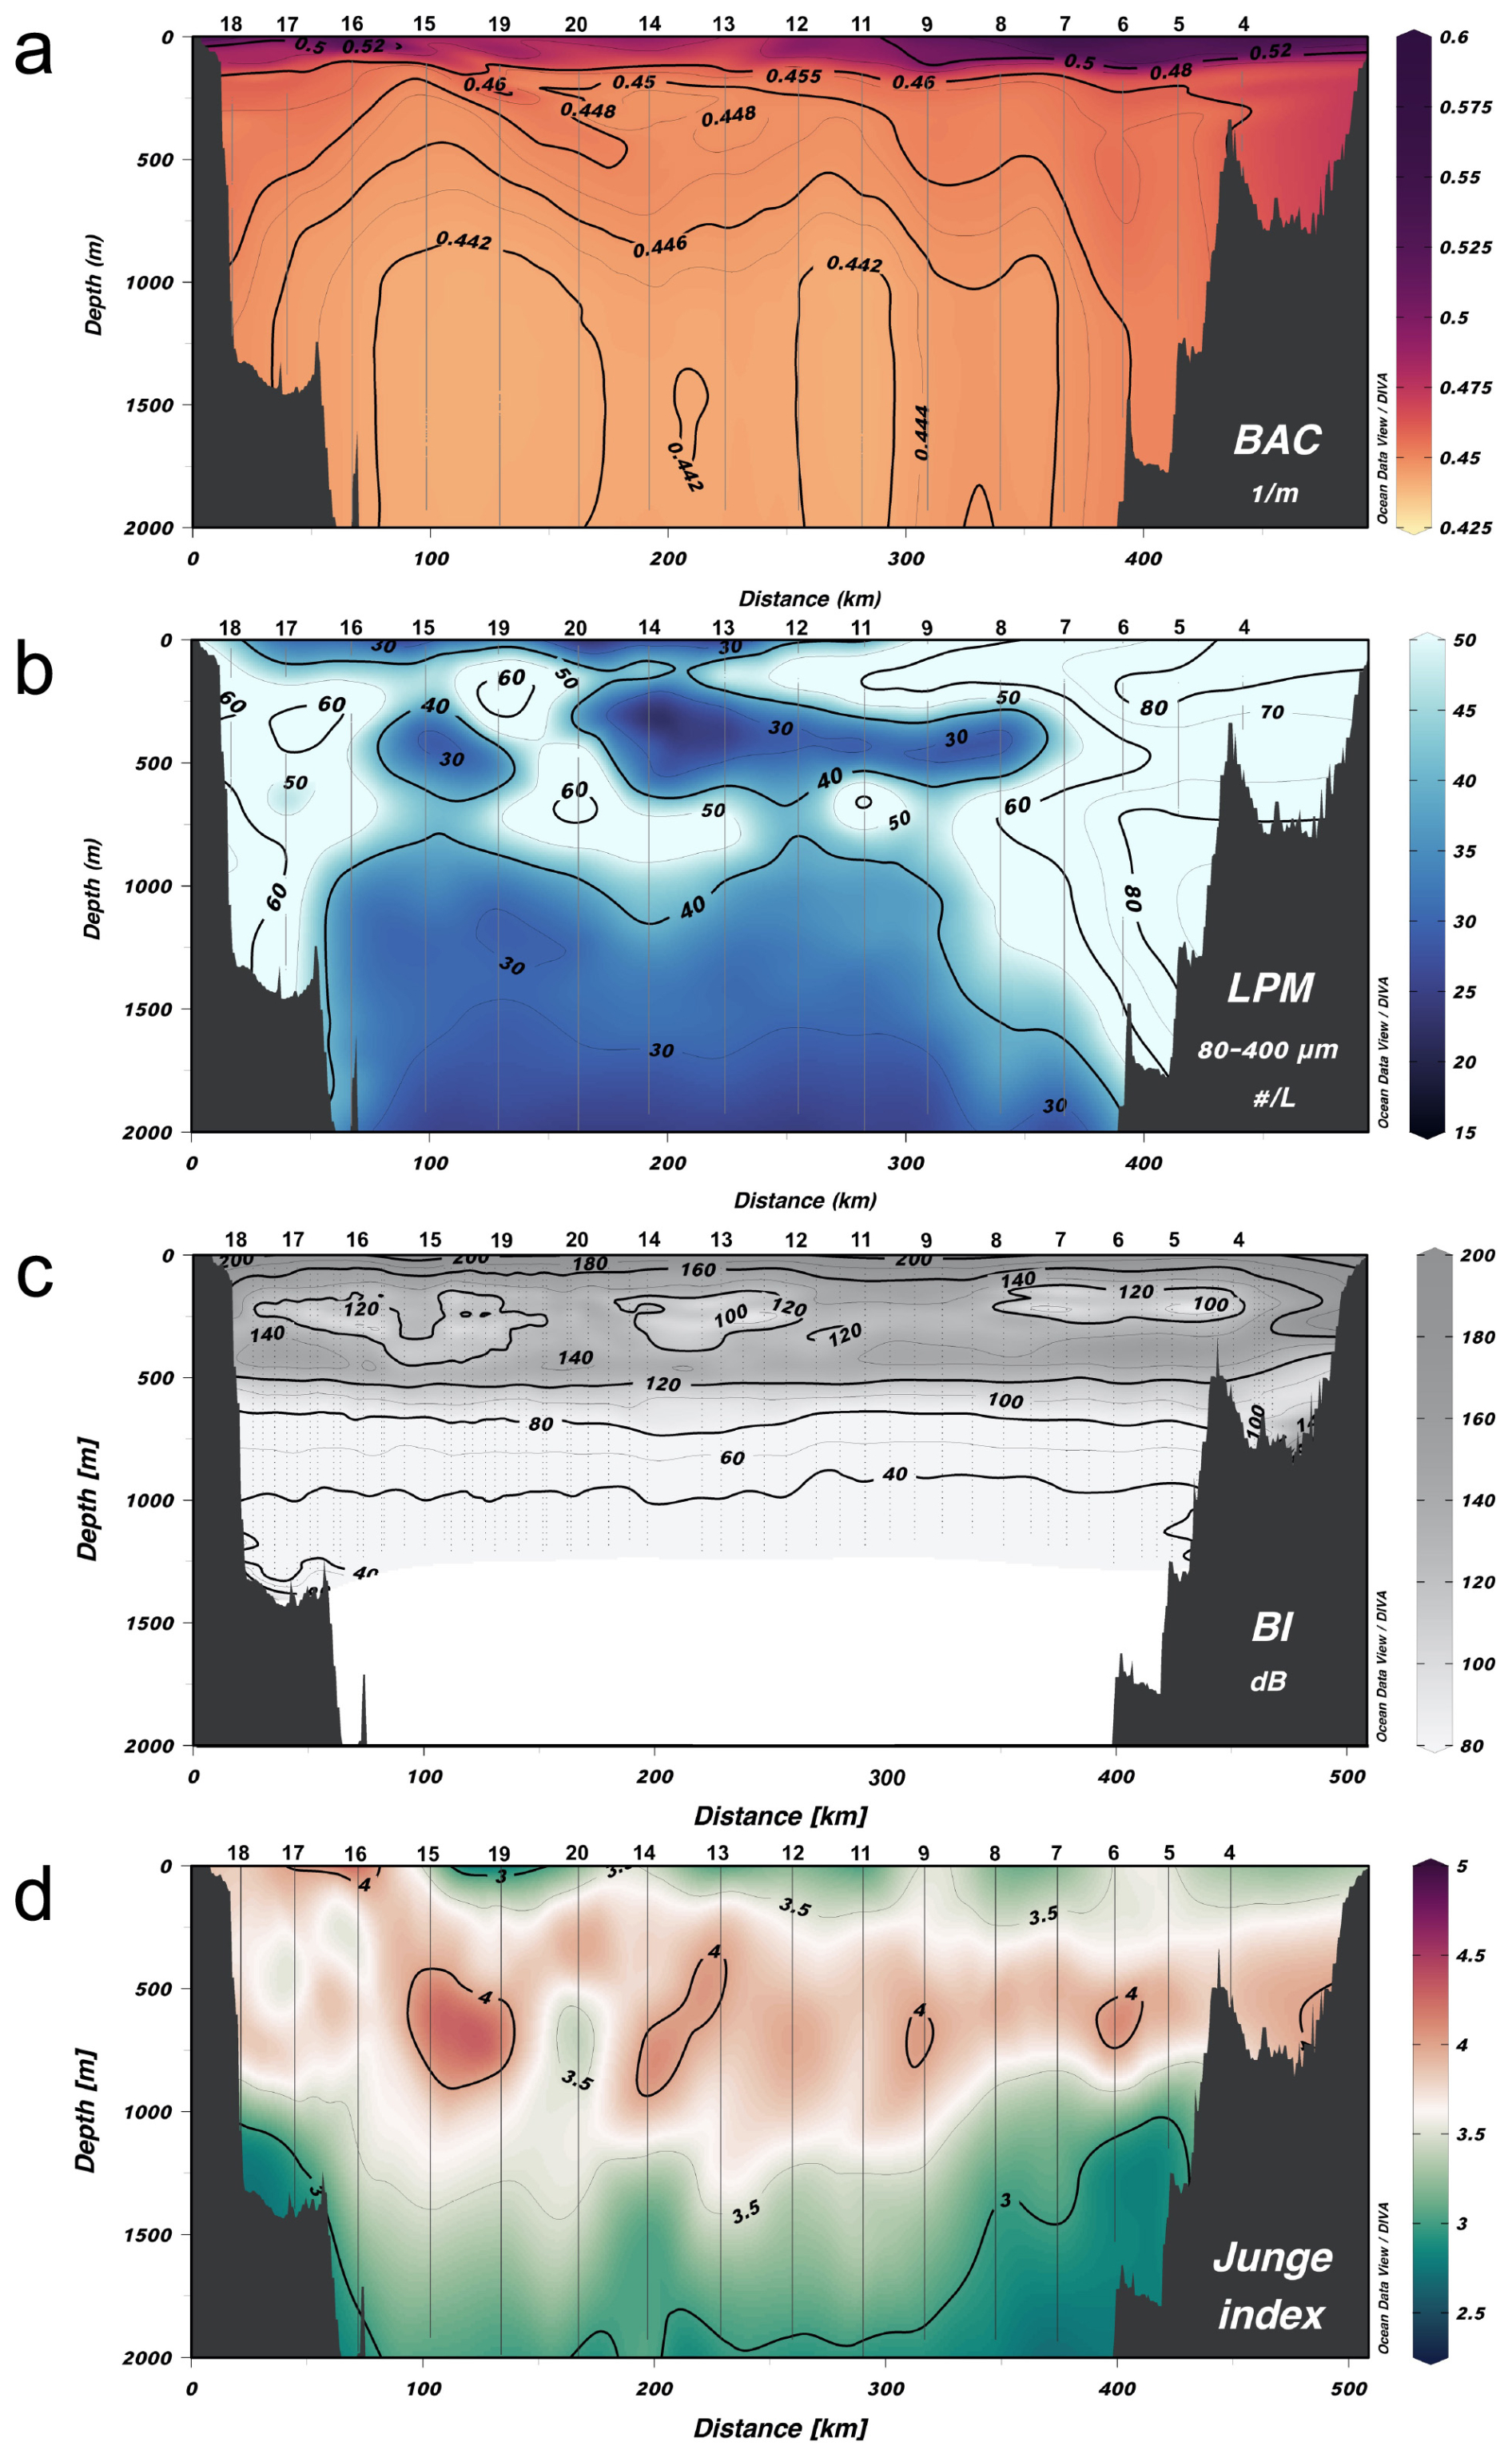
Figure 5Cross-basin section of (a) the beam attenuation coefficient, (b) total large particle abundances, (c) the backscatter index and (d) the Junge index for the PERLE-3 cruise. The upper x axis indicates the station number along the section that runs from west (station 18) to east (station 4). Reiner Schlitzer, Ocean Data View, http://odv.awi.de, 2025.
Large particles, as observed with the UVP (Fig. 5b), are most abundant along the continental slope and between 400 and 900 m depth throughout the basin. The subduction effect of the anticyclonic eddy is also evident in the abundance of large particles.
An accumulation of large reflectors between 200 and 500 m depth is clearly visible on the 38 kHz ADCP echo intensity (Fig. 5c), corresponding to the deep scattering layer formed by the micronekton (small mesopelagic fishes, crustaceans and cephalopods) (Kapelonis et al., 2023; Peña, 2024). Its fragmentation into elongated patches of lower intensity between 200 and 300 m is related to the diel vertical migrations (upward motion) of part of the organisms at night.
The Junge index (Fig. 5d), estimated from UVP data, shows an intermediate maximum – indicating the dominance of smaller particles over coarser ones – between 400 and 1000 m, below the deep scattering layer. Below 1000 m, the index decreases by one unit to 2000 m depth, indicating a decrease in the relative abundance of smaller particles compared to coarser particles. This decrease is more pronounced on the continental slope.
3.2 Hydrological features of thermohaline staircases
3.2.1 Attributes of a staircase station vs. a non-staircase station
In this section, we describe the vertical distribution of physical parameters (potential temperature, salinity and potential density anomaly) and dissolved and particulate parameters (dissolved oxygen, nitrate, apparent oxygen utilization, the beam attenuation coefficient, large particle abundance and the Junge index) at station 20, which shows virtually no significant staircase (Fig. 6), and station 9, which shows marked staircases between 700 and 1700 m (Fig. 7).
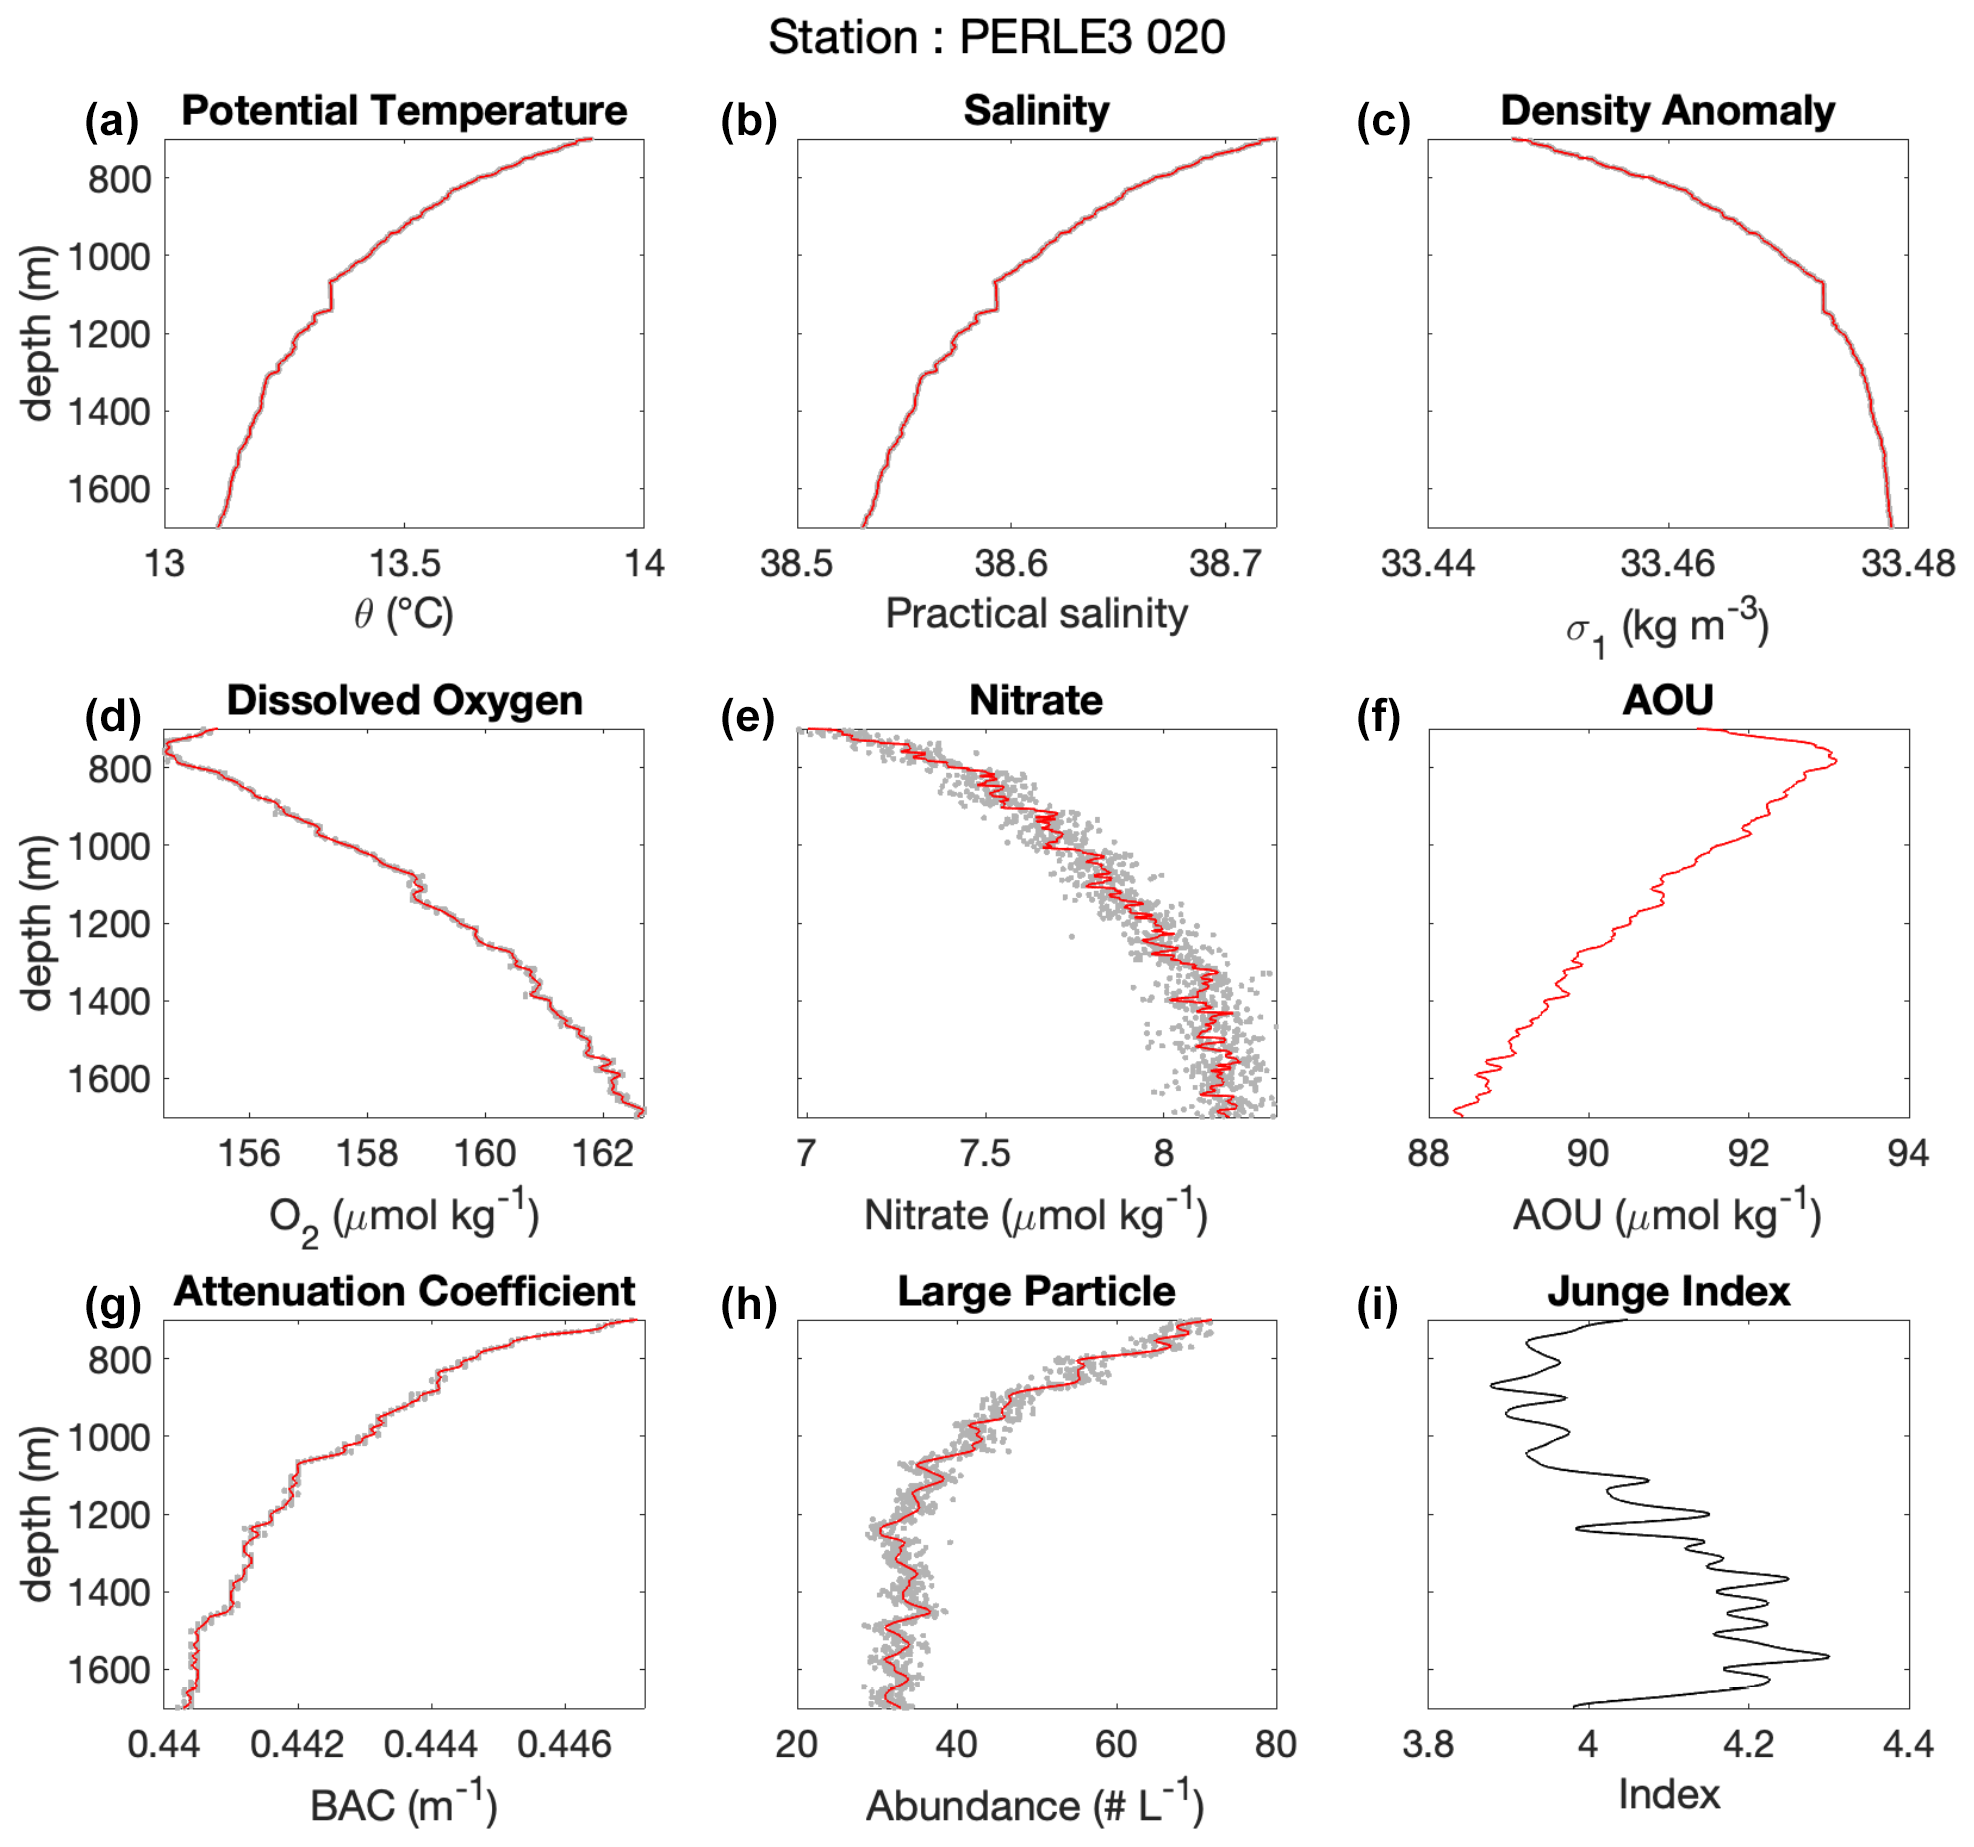
Figure 6Profiles of (a) potential temperature, (b) salinity, (c) potential density anomaly (with σ1 referenced to 1000 dbar pressure), (d) dissolved oxygen, (e) nitrate, (f) apparent oxygen utilization (AOU), (g) the beam attenuation coefficient, (h) large particle abundance between 80 and 400 µm, and (i) the Junge index between 700 and 1700 m depth for station PERLE3-20. The grey dots are the data binned at 1 m intervals, whereas the solid red line indicates the smoothed profile. See the station position in Fig. 1.
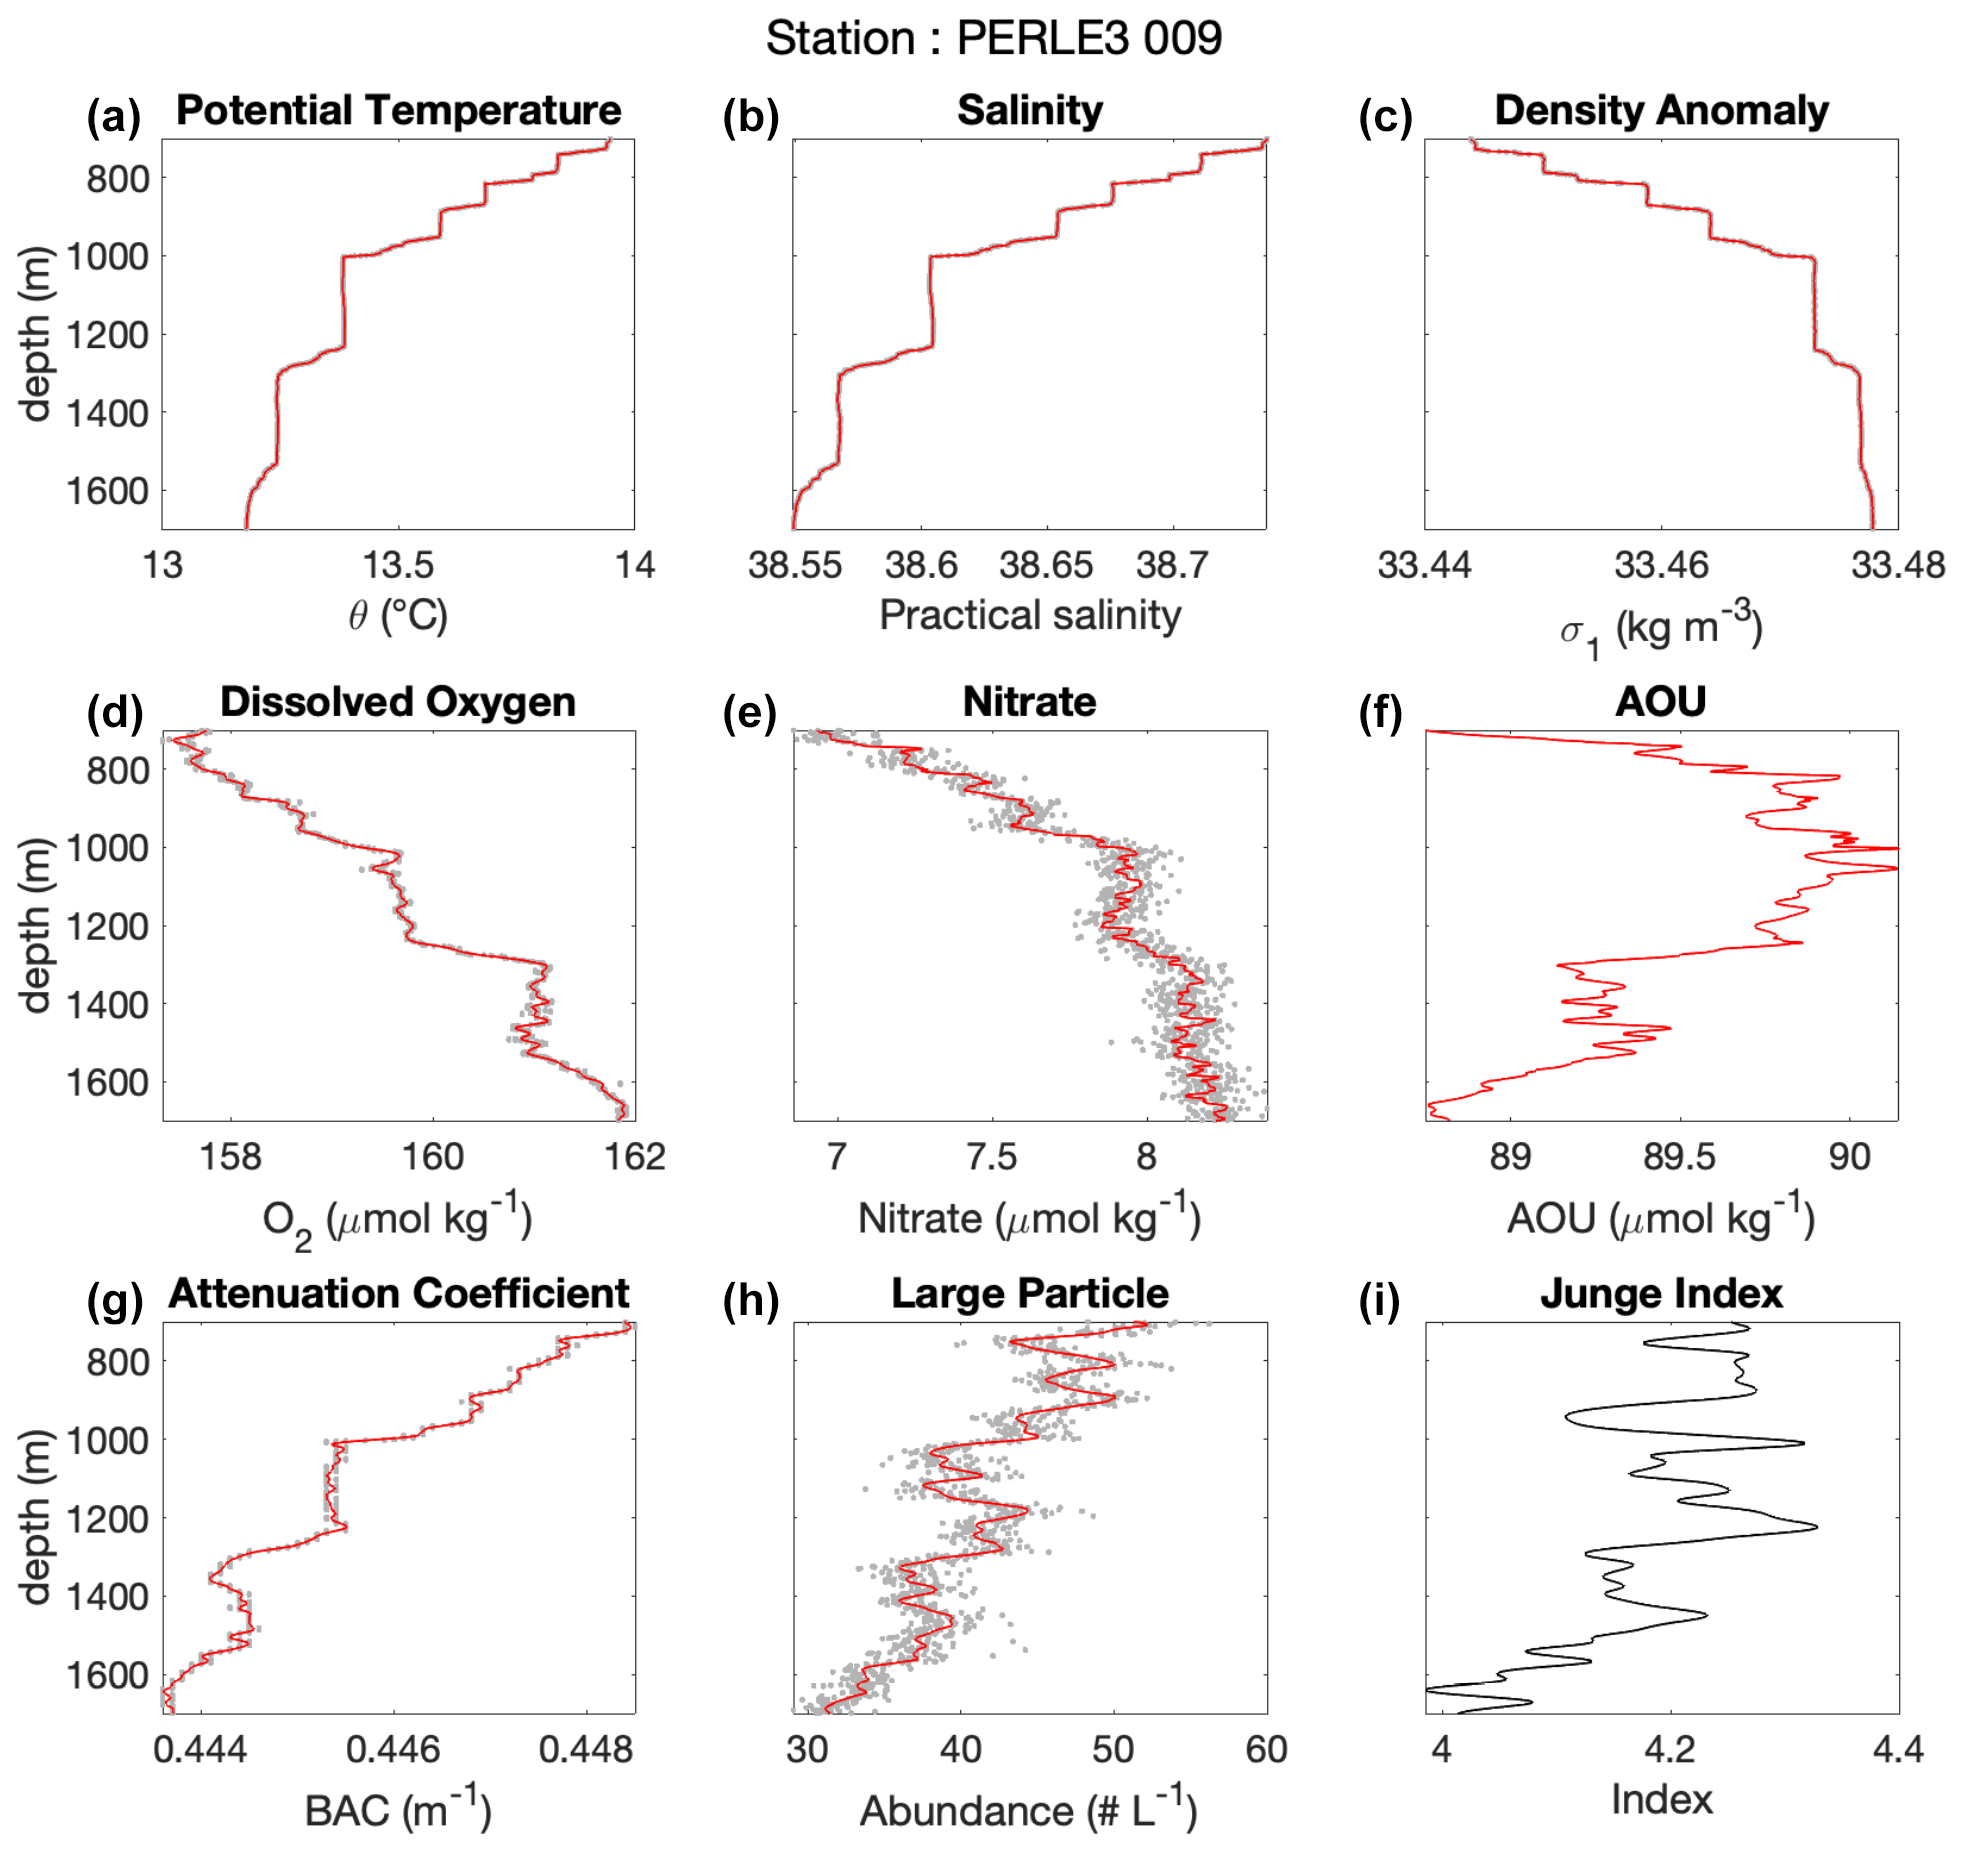
Figure 7Profiles of (a) potential temperature, (b) salinity, (c) potential density anomaly (with σ1 referenced to 1000 dbar pressure), (d) dissolved oxygen, (e) nitrate, (f) apparent oxygen utilization (AOU), (g) the beam attenuation coefficient, (h) large particle abundance between 80 and 400 µm, and (i) the Junge index between 700 and 1700 m depth for PERLE3-09 station. The grey dots are the data binned at 1 m intervals, whereas the solid red line indicates the smoothed profile. See the station position in Fig. 1.
At station 20, the vertical profiles of most variables exhibit relatively smooth characteristics between 800 and 1070 m depth. At 1070 m, a homogeneous layer of approximately 70 m thickness is observed, immediately succeeded by a pronounced density interface. The water column structure below this interface demonstrates increased variability, characterized by minor step-like features in the measured parameters.
The profiles of physical variables at station 9 show a series of steps starting at 750 m depth. Density steps result in thin interfaces (about 9–73 m) with temperature steps of approximately 0.1–0.2 °C and practical salinity steps of 0.01–0.03 between adjacent mixed layers, resulting in density steps of a few thousandths of a kilogram per cubic metre. The thickness of the mixed layers varies between 10 and 230 m and increases significantly below 1000 m. The profiles of the biogeochemical variables also show step-like profiles, with larger gradients corresponding to the density steps and nearly homogeneous concentrations in the mixed layers between each step. This is clearly visible for dissolved elements (oxygen and nitrate) and small particle concentration (the beam attenuation coefficient). The effect of the density steps on the abundance of coarser material is less obvious due to the variability in the measurements, but it still appears that the total abundance decreases significantly below each step. It is noteworthy that the decrease in the Junge index between 700 and 1700 m is greater for station 9 with staircase steps than at station 20.
3.2.2 Positioning and persistence of the main staircases
The transition zone between the EIW and the TDW thus provides ideal conditions (warmer and saltier water mass overlying a colder and less saline water mass) for salt fingers. The thermohaline gradients from the profiles collected during the cruise and from the profiling float allowed us to identify the main stepped structures in the Tyrrhenian Basin (Fig. 8).
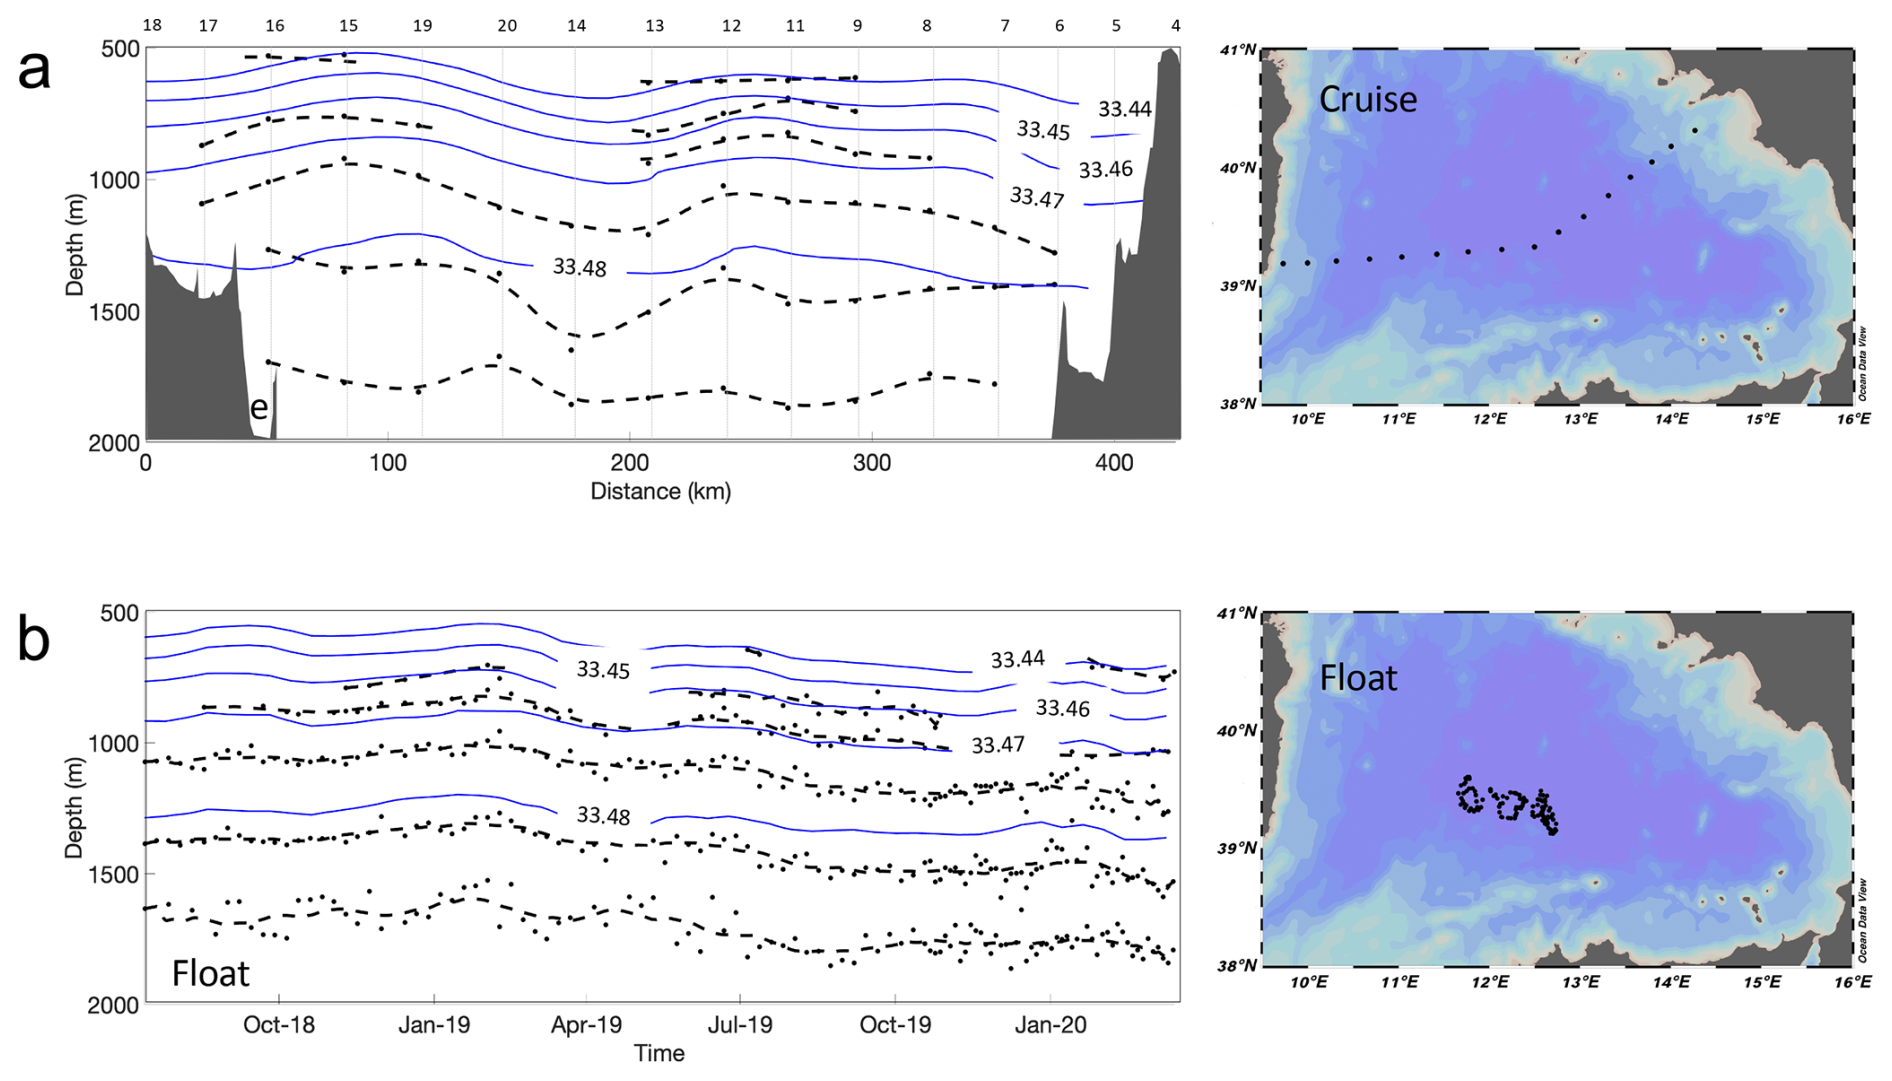
Figure 8(a) Depth of the main thermohaline staircases (dashed lines) across the basin from west to east during the PERLE-3 cruise and (b) the temporal evolution of the staircases in the centre of the basin as seen by the profiling float between July 2018 and March 2020. The dots are the steps identified using the procedure referenced in the methods (Sect. 2.1). The blue lines show the isopycnals (potential density anomaly with σ1 referenced to 1000 dbar pressure). The position of the stations and the trajectory of the profiling float are shown on the maps on the right. Reiner Schlitzer, Ocean Data View, http://odv.awi.de, 2025.
During the PERLE-3 cruise, distinct thermohaline staircases are observed between 600 and 2000 m depth, primarily in the central region of the basin (Fig. 8a). These staircases are clearly absent in two areas: near the western slope of the basin and beneath the deep anticyclonic eddy located at about 12° E. The absence of staircases extends to 1000 m depth beneath this eddy.
The temporal evolution of the staircase in the centre of the basin, as seen by the profiling float between July 2018 and March 2020, underscores that these structures, particularly at depths greater than 1000 m, are relatively stable and have persisted for several years (Fig. 8b).
4.1 Circulation and thermohaline staircases
The hydrodynamic patterns observed during the PERLE-3 cruise aligned with the established understanding of winter circulation in the southern Tyrrhenian Sea (Rinaldi et al., 2010; Iacono et al., 2013, 2021). The winter circulation in this region is primarily driven by wind forcing, resulting in a vigorous cyclonic flow that encompasses the entire Tyrrhenian Basin and persistent mesoscale eddy structures. The observed anticyclonic gyre between 12 and 13° E and between 39 and 40° N and the cyclonic circulation between Sardinia and Sicily corroborate the findings of previous studies.
Turbulence levels in the Tyrrhenian Sea are generally low, as reported by Ferron et al. (2017), who estimated extremely low dissipation rates derived from microstructure. Our observations show well-defined thermohaline staircase structures associated with salt fingers developing between 700 and 2000 m. The observed thermohaline staircases occur mainly in the centre of the Tyrrhenian Basin and are less defined on the continental slope at both ends of the section. These latter regions are the ones that contain the cyclonic boundary circulation that entrains the core of the EIWs originating from the Strait of Sicily. These results are in agreement with ship observations of Zodiatis and Gasparini (1996), seismic observations of Buffett et al. (2017), and profiling float observation of Taillandier et al. (2020), who showed that the staircases with the most distinct step-like gradients appear in the centre of the basin, whereas they become less evident towards the boundaries and the bottom. They linked this change to increased vertical motions that prevent diffusive convection and staircase formation because the internal wave field and current shear are stronger near the boundaries. Similarly, Durante et al. (2021) found that internal gravity-wave-induced mixing can modulate staircase structures in the basin interior.
Mesoscale eddies appear to be able to disrupt this balance. Seismic observations in the Caribbean (Yang et al., 2024) have shown that eddies generate turbulent mixing and vertical shear, especially at their peripheries, which can erode thermohaline staircases down to 750 m. In our study, staircases are notably absent in the upper 1000 m at the stations within the anticyclonic eddy at 12° E, suggesting a similar disruptive effect. Such erosion is not observed near the adjacent cyclonic structure to the west, possibly due to the focusing of near-inertial internal waves and enhanced mixing within anticyclones, as described by Fer et al. (2018) in the Lofoten Basin Eddy. Although this co-occurrence does not confirm causality, in the absence of turbulence measurements, the potential disruptive effect of this eddy on staircase formation warrants consideration.
Temporal measurements collected by the profiling float (Fig. 8b), alongside spatial data gathered during the cruise (Fig. 8a), highlight the consistent occurrence of thermohaline staircases in the central region of the basin at depths below 1000 m. The observed persistence of thermohaline steps below 1000 m depth corroborates previous observations that have highlighted the stability of these structures in the basin interior. These step-like features have been documented to maintain their structure over temporal scales ranging from years (Falco et al., 2016; Taillandier et al., 2020; Zodiatis and Gasparini, 1996) to decades (Durante et al., 2019) and show strong lateral coherence, sometimes reaching several hundred kilometres (Buffett et al., 2017).
The subsequent sections provide a detailed examination of how these persistent, well-developed thermohaline staircases may influence particulate matter dynamics, specifically addressing their impact on sedimentation processes (Sect. 4.2) and the degradation of suspended particles (Sect. 4.3). This analysis aims to investigate the complex interactions between physical oceanographic features and biogeochemical cycles in the deep marine environment.
4.2 Impact of staircases on the distribution and settling of particulate matter
The Junge index has been shown to be a valid first-order description of the particle size distribution, particularly for the study of size-dependent processes such as particle sinking (Guidi et al., 2009). In our case, the observed abundance of coarse particles and the Junge index are greatest in the deep scattering layer between 400 and 1000 m (Fig. 5). Deeper down to 2000 m, both the total particle abundance and the slope of the size distribution decrease, indicating that the contribution of coarser particles to the particle population increases with depth. Similar results regarding the size distribution of smaller particles in the Tyrrhenian Basin were obtained by Chaikalis et al. (2021) during the trans-Mediterranean cruise in March 2018 using an in situ laser scattering and transmissometry instrument (LISST-Deep). In their study, they considered the size range between 5.6 and 92.6 µm, complementary to that measured with the UVP. Their stations show a similar particle distribution size with depth below the surface layer (> 150 m), with an intermediate maximum at about 400–500 m depth and a steady decrease to 2000 m depth. Such an evolution of the abundance and particle size distribution is generally considered to be the result of aggregation, with smaller particles agglomerating to form larger ones, a common process in the ocean (McCave, 1984).
To assess the influence of thermohaline staircases on particle dynamics, the vertical distribution of the Junge index was examined across depth under two distinct conditions: presence (“WStairs”) and absence (“NoStair”) of multiple staircases (see Sect. 2.3 for definitions). A multiple linear regression model, incorporating an interaction term between depth and staircase condition, was applied to evaluate whether the depth-dependent trends in the Junge index diverged significantly between conditions.
As illustrated in Fig. 9a, the regression model demonstrated a robust fit to the observational data. The interaction term between depth and staircase condition exhibited a high statistical significance (p<0.001), confirming distinct depth-dependent slopes for the Junge index under “WStairs” and “NoStair” conditions. In “NoStair” regions, the Junge index decreased markedly with depth (slope = −0.0007 m−1), consistent with a gradual reduction in the relative abundance of smaller particles compared to larger particles. However, under “WStairs” conditions, this decrease was more pronounced (slope = −0.0008 m−1), suggesting that stairs modulate the grain size distribution, potentially favouring larger particle fractions during their sedimentation in the water column.
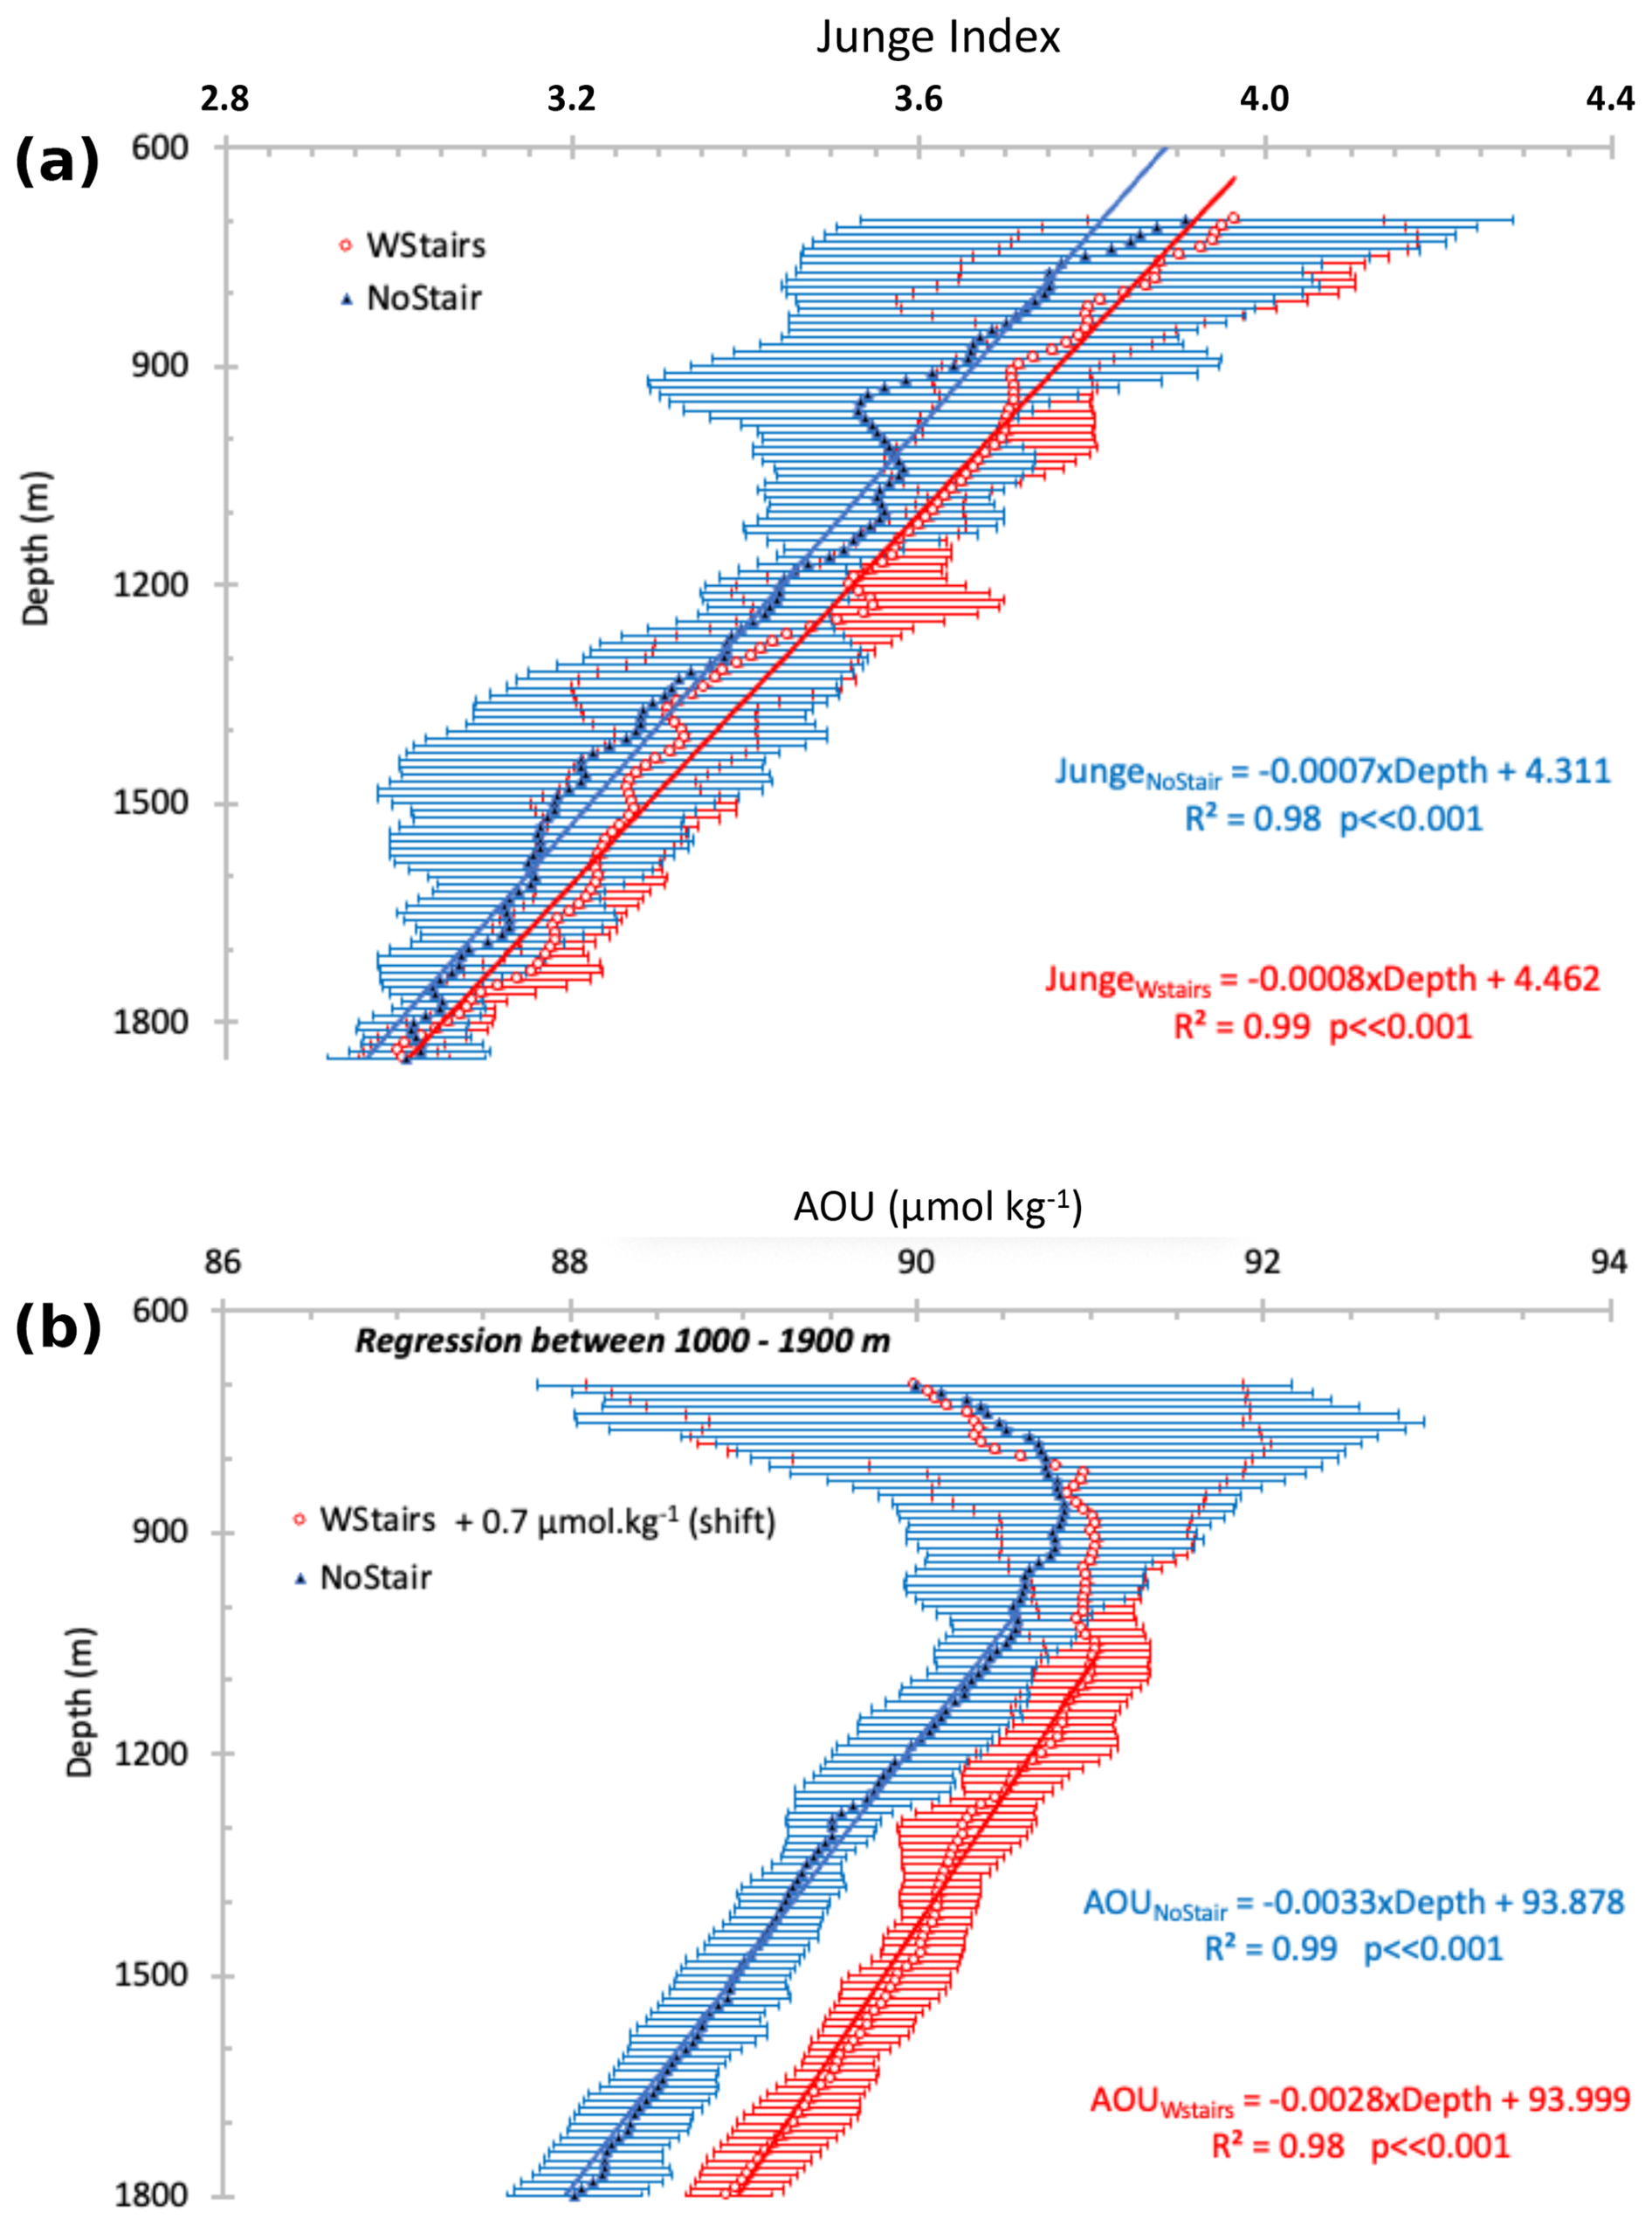
Figure 9Vertical profiles of (a) the mean Junge index and (b) mean apparent oxygen utilization (AOU) in profiles for the groups of stations with staircases (“WStairs”, open red circles) and without staircases (“NoStair”, filled blue triangles). For each depth, the values represent the mean of all available stations within each group, while the error bars correspond to the standard deviation among stations of the same group. Linear regression equations and R2 values are indicated in each panel (between 700 and 1900 m for the Junge index and between 1000 and 1900 m for AOU). In panel (b), AOU values for the “WStairs” group have been shifted by +0.7 µmol kg−1 so both profiles start from the same value at 700 m, to facilitate comparison of their vertical trends.
The overall diminution in suspended particle abundance, concurrent with an augmentation of the coarse particle fraction, is evident not only at large vertical scales throughout the water column beneath the Eastern Intermediate Waters (EIWs) but also at finer scales spanning several decametres within the thermohaline staircases. The influence of density steps on the vertical distribution of particle abundance and size is illustrated through an examination of three distinct interfaces, situated at different stations and depths ranging from 700 to 1400 m, i.e. station 8 (Fig. 10), station 11 (Fig. 11) and station 9 (Fig. 12). These interfaces, characterized by thicknesses varying between 20 and about 150 m, exhibit density variations of 3–5 × 10⁻³ kg m−3.
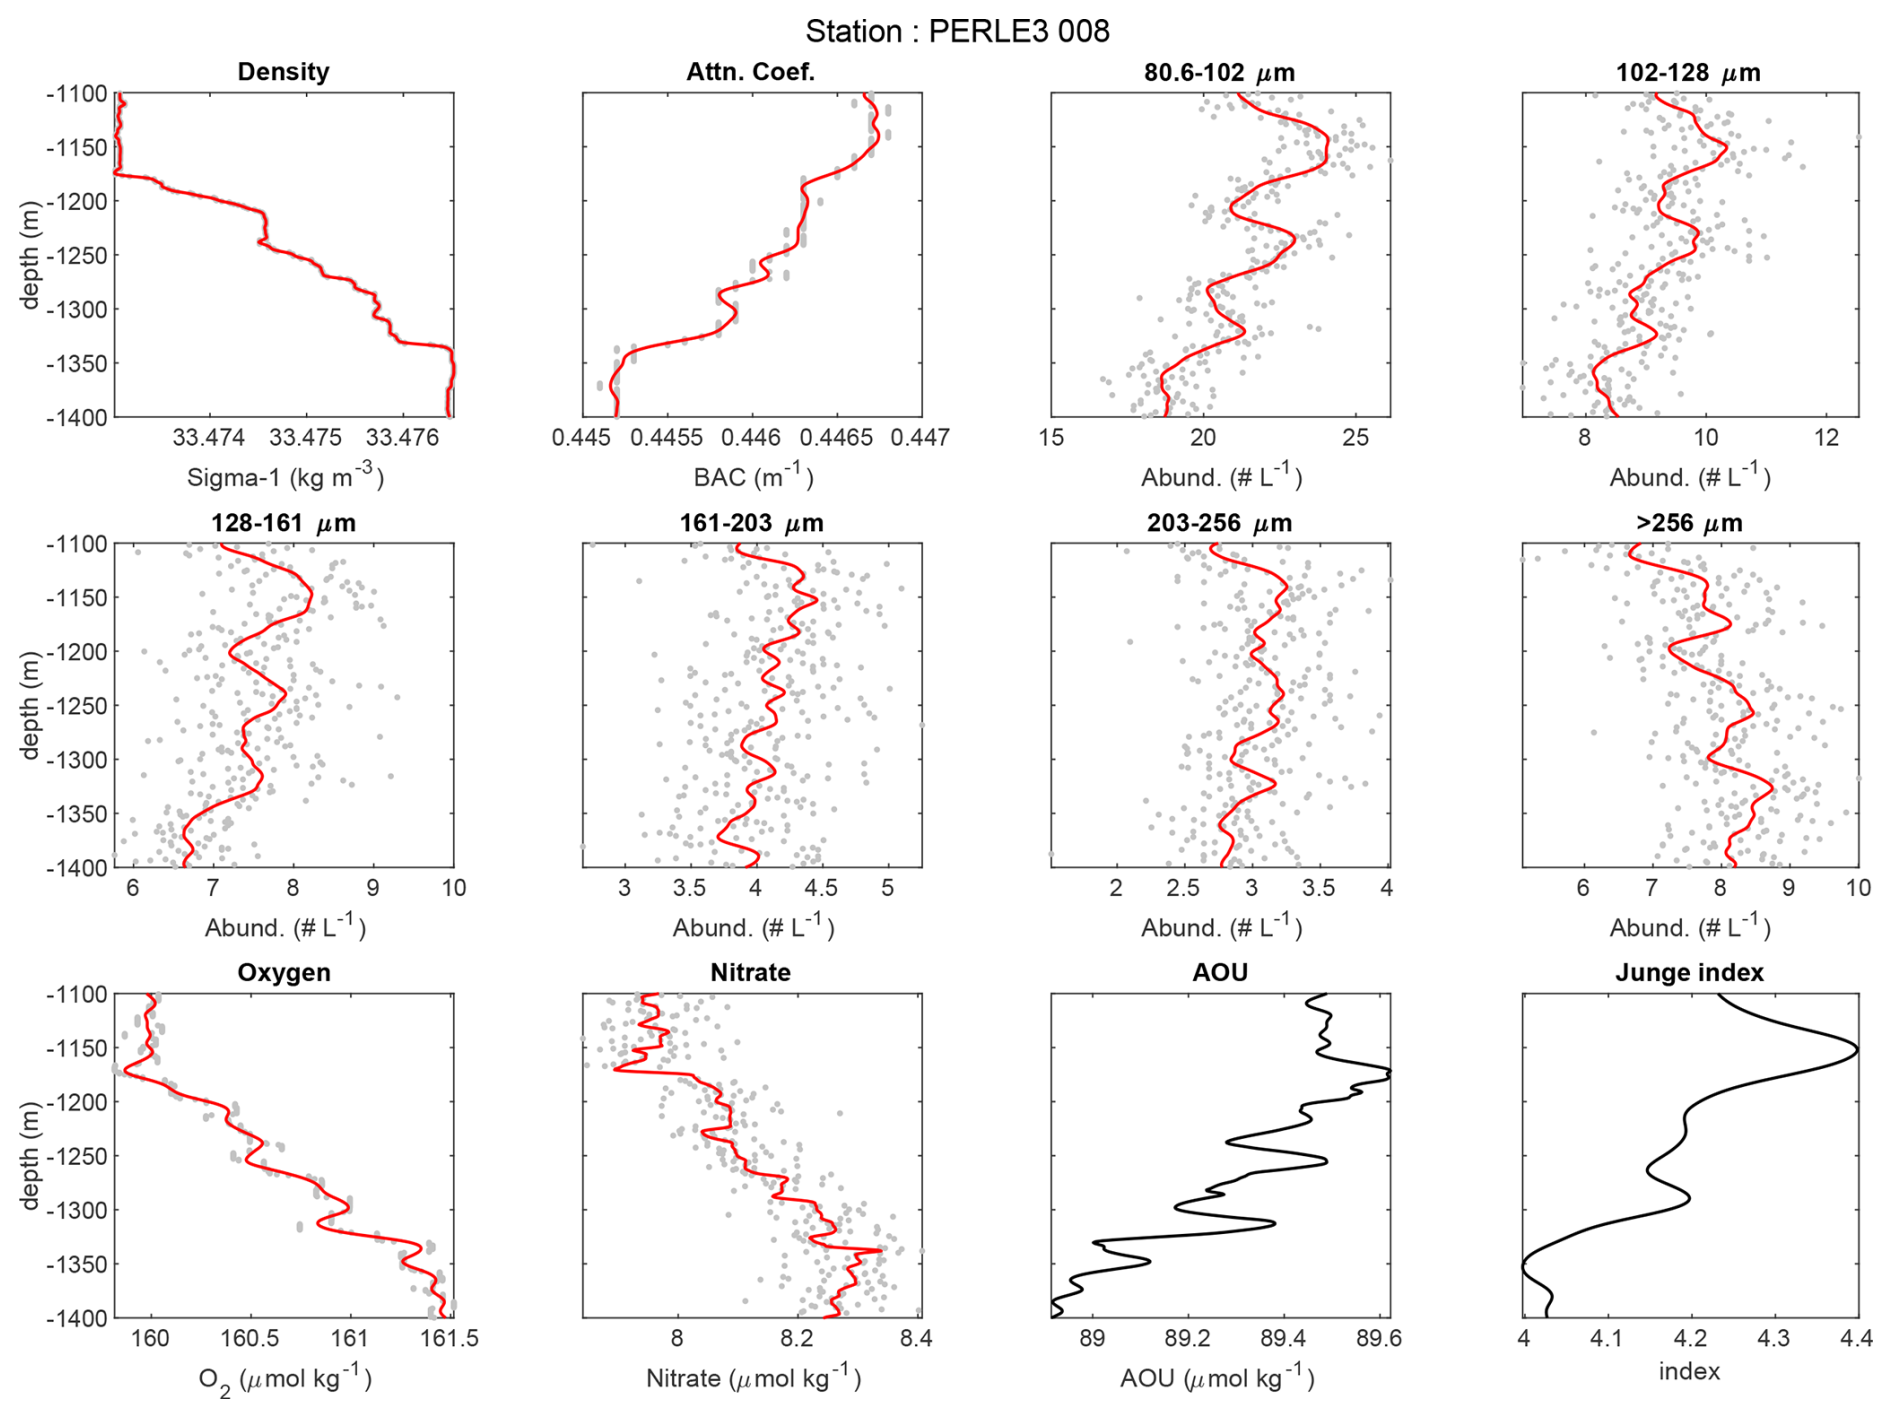
Figure 10Profiles of potential density anomaly (σ1 referenced to 1000 dbar pressure), the beam attenuation coefficient, large particle abundances for the first five size classes and for all sizes > 256 µm of the UVP, dissolved oxygen, nitrate, apparent oxygen utilization (AOU), and the Junge index between 1100 and 1400 m depth for PERLE3-08 station. Grey points show individual in situ measurements, whereas the red line represents the averaged vertical profile. See the station position in Fig. 1.
These examples show a significant reduction in the abundance of fine particles, as evidenced by transmissometry (BAC) measurements, across each interface. For coarse particles detected by a UVP, despite measurement variability, the change in abundance across the interface varies according to particle size. At stations 8 (Fig. 10) and 11 (Fig. 11), a slight decrease in abundance is observed for the smallest size fraction (80.6–161 µm), minimal variation is noted for intermediate sizes (161–256 µm) and an increase is evident for the largest particles (> 256 µm). At station 8, the Junge index exhibits a clear decrease across the density interface. The signal is less pronounced at station 11, where the index decreases at the interface's upper boundary but shows a localized increase at its base. For the interface at station 9 (Fig. 12), all parameters – turbidity, abundance across different size fractions and the Junge index – decrease across the interface. These depth-dependent variations provide evidence that these density interfaces exert an influence on particle abundance and size distribution.
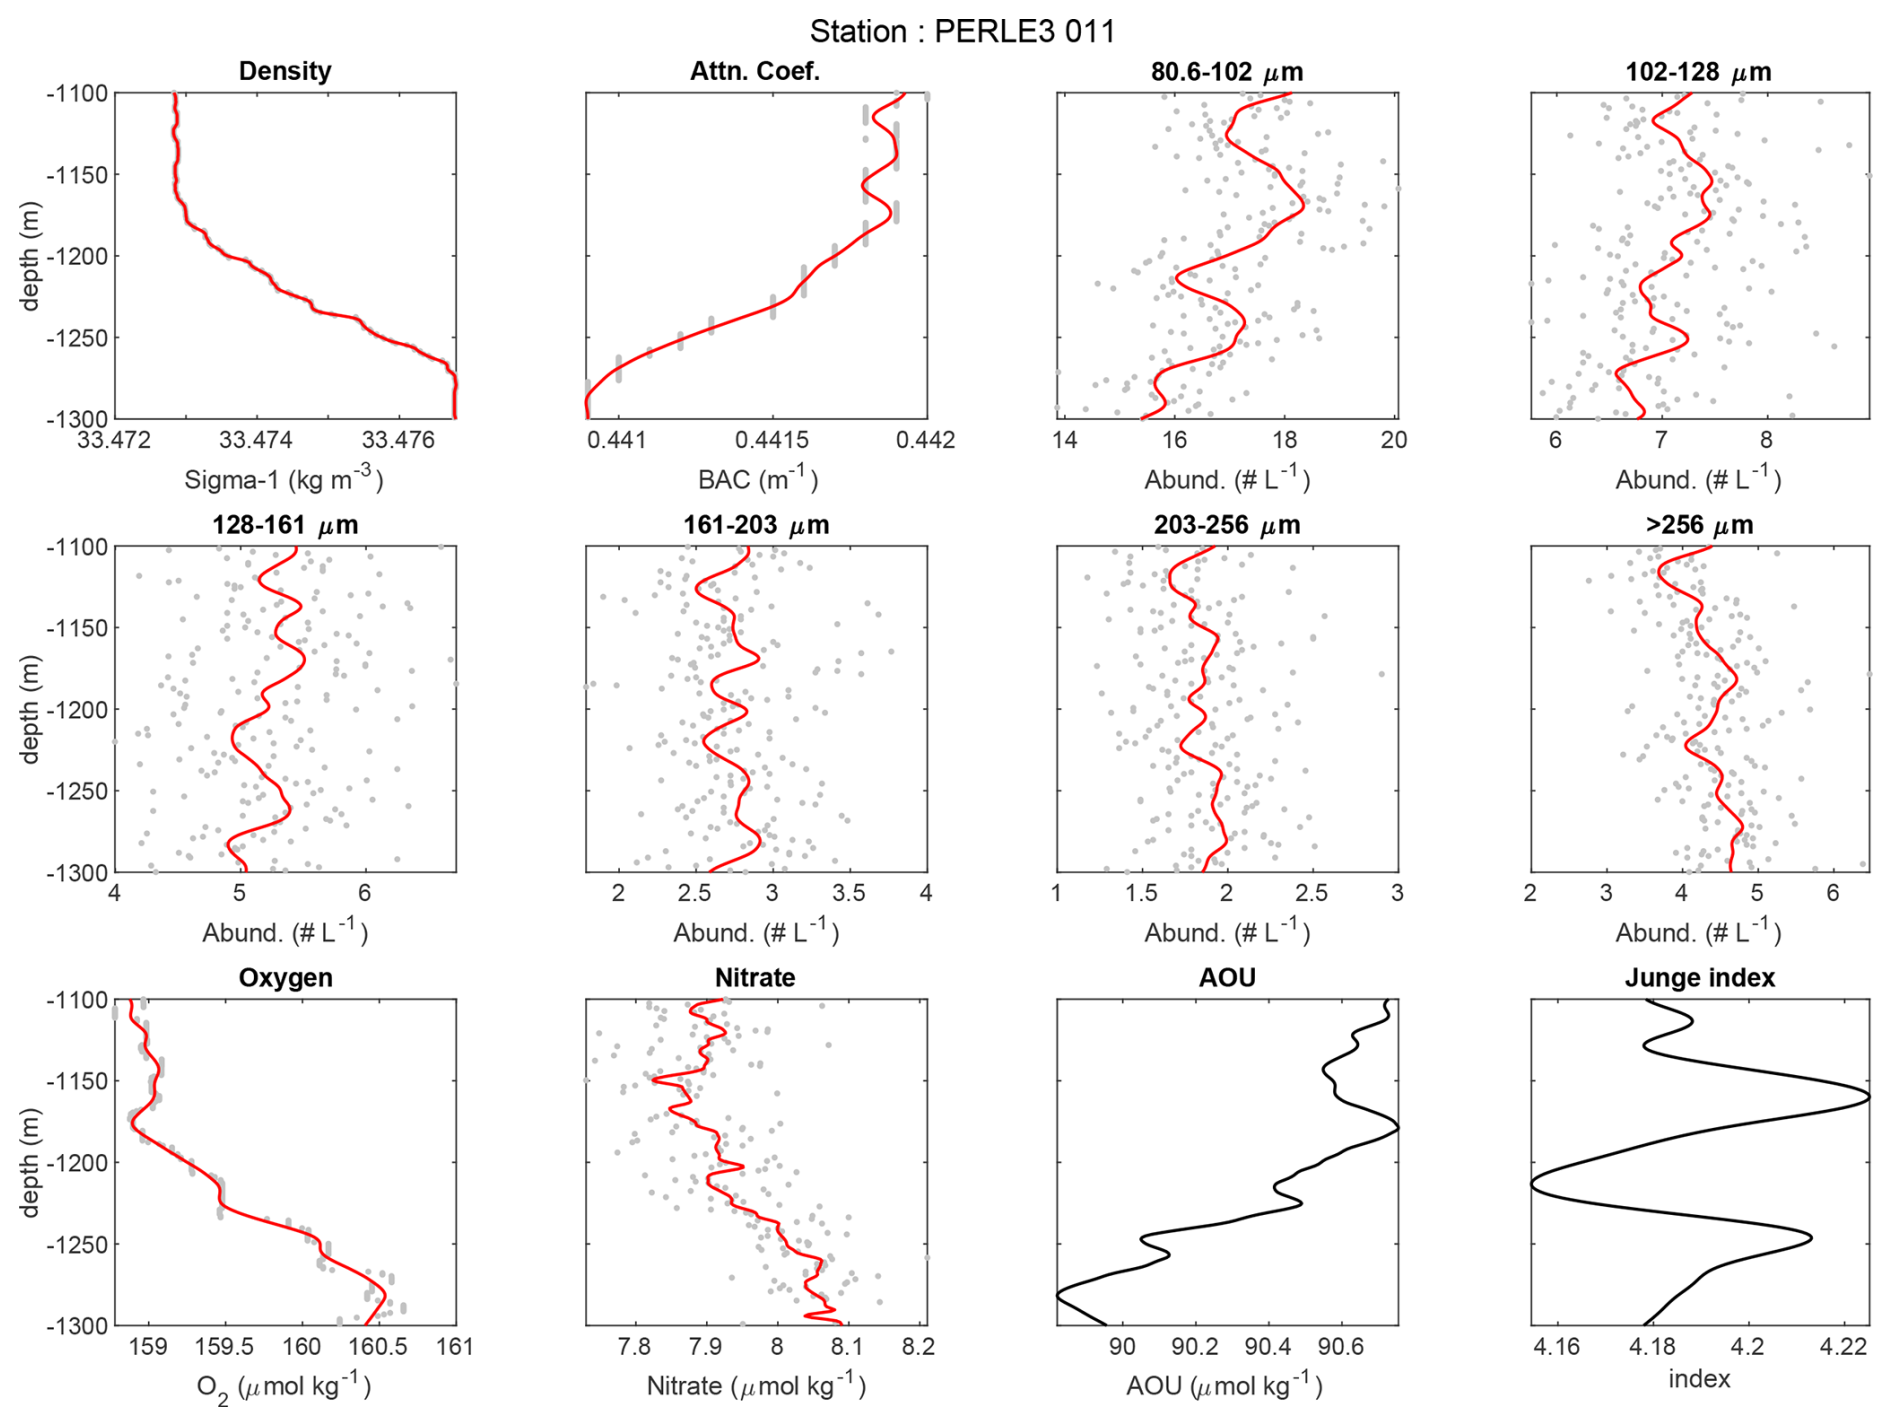
Figure 11Profiles of potential density anomaly (σ1 referenced to 1000 dbar pressure), the beam attenuation coefficient, large particle abundances for the first five size classes and for all sizes > 256 µm of the UVP, dissolved oxygen, nitrate, apparent oxygen utilization (AOU), and the Junge index between 1100 and 1300 m depth for PERLE3-11 station. Grey points show individual in situ measurements, whereas the red line represents the averaged vertical profile. See the station position in Fig. 1.
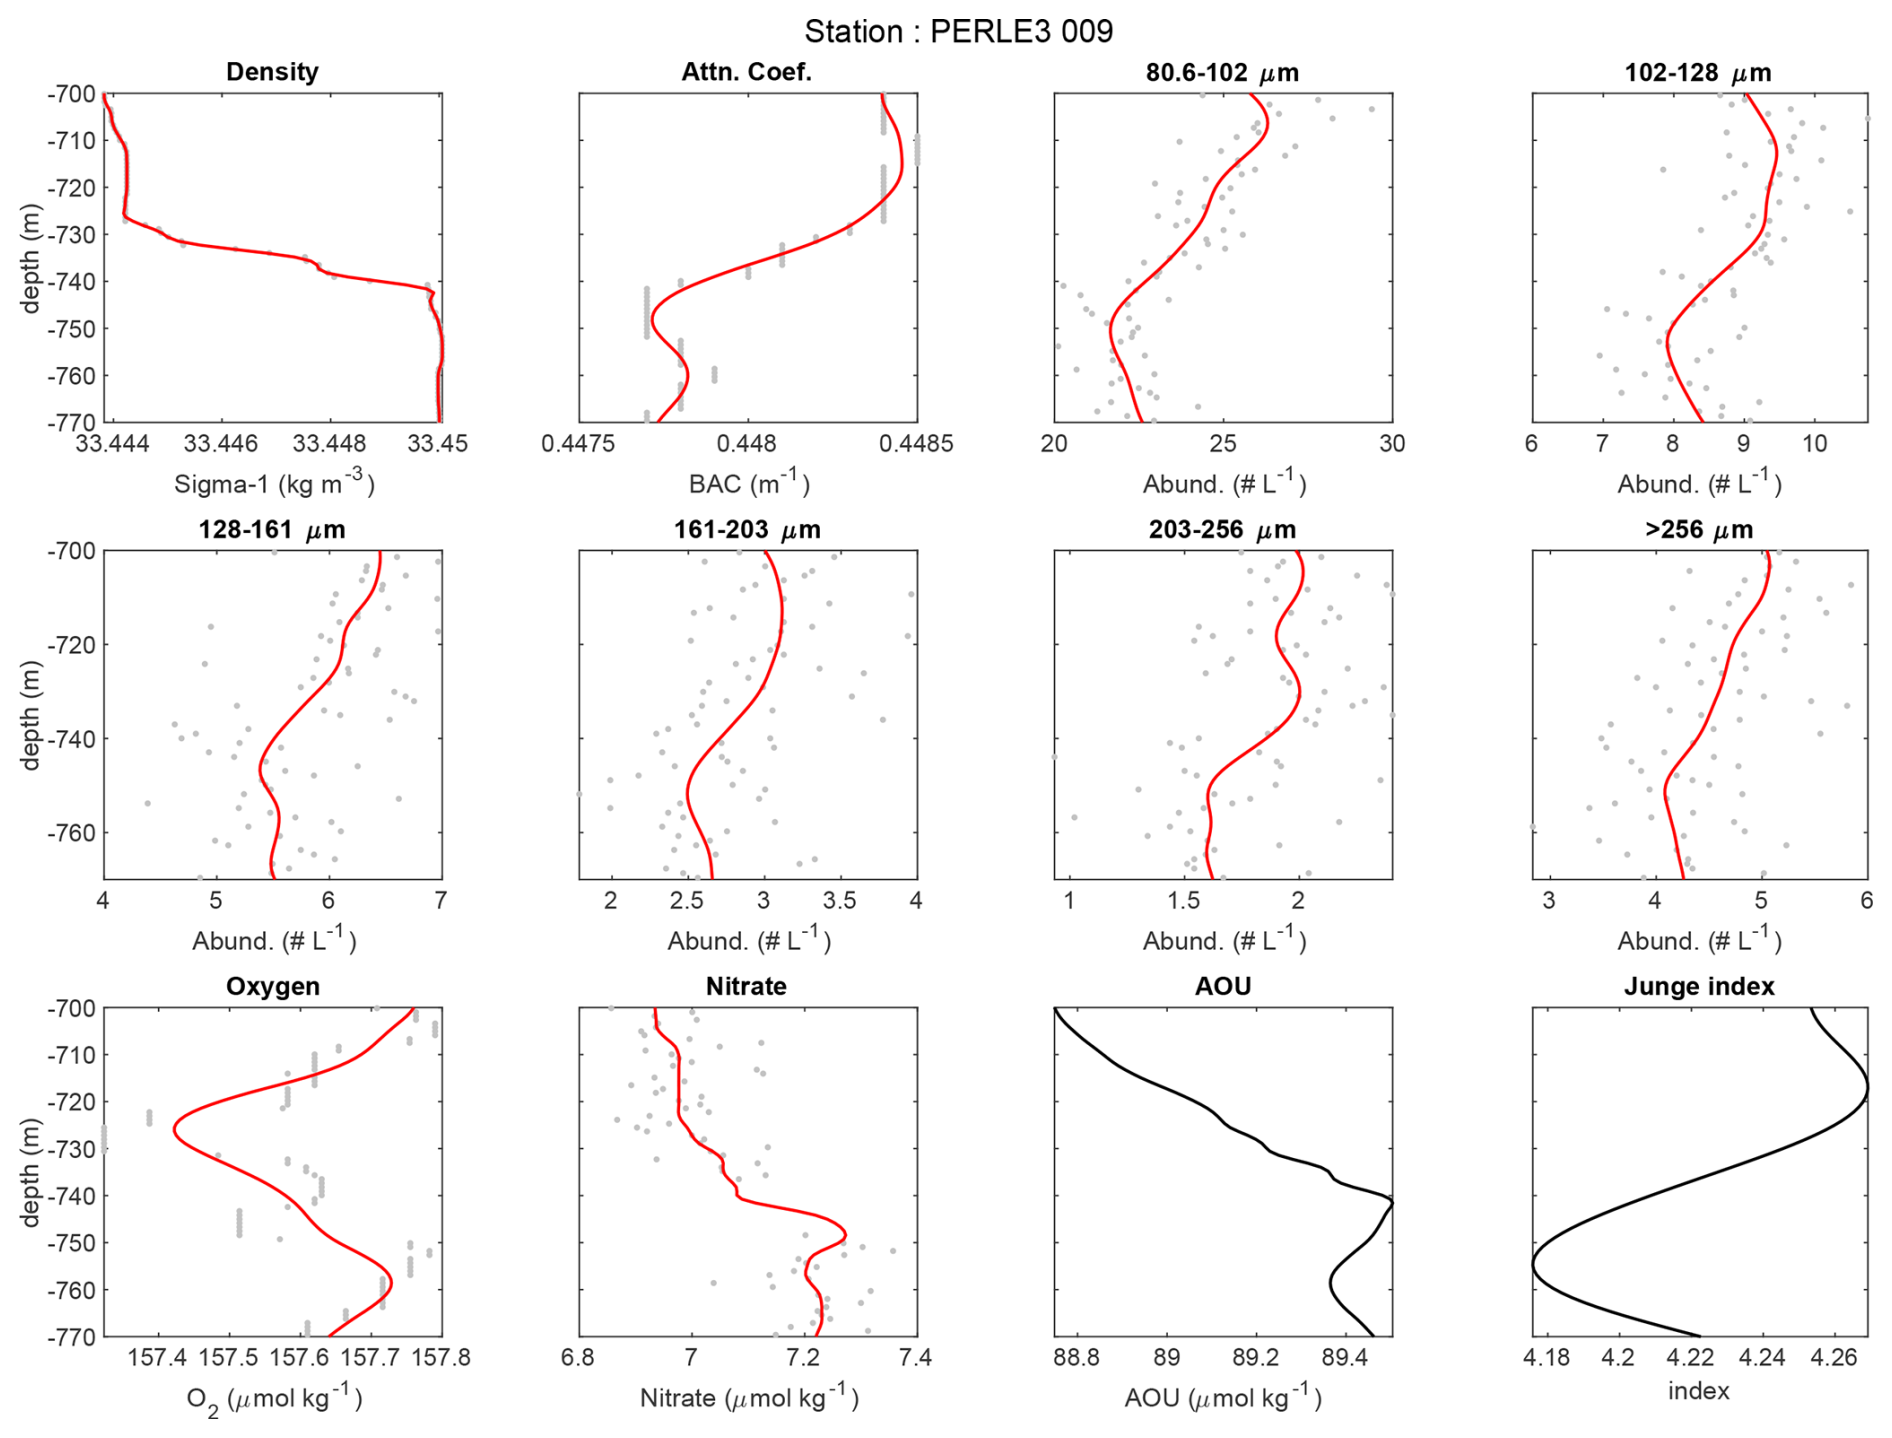
Figure 12Profiles of potential density anomaly (σ1 referenced to 1000 dbar pressure), the beam attenuation coefficient, large particle abundances for the first five size classes and for all sizes > 256 µm of the UVP, dissolved oxygen, nitrate, apparent oxygen utilization (AOU), and the Junge index between 700 and 770 m depth for PERLE3-09 station. Grey points show individual in situ measurements, whereas the red line represents the averaged vertical profile. See the station position in Fig. 1.
Based on laboratory and modelling experiments, strong density interfaces are known to cause particle retention and promote aggregation. According to Doostmohammadi and Ardekani (2015), density interfaces can induce preferential retention of fine, slow-sinking particles compared to larger particles and can, therefore, promote the formation of clusters of fine particles, which can then aggregate. This retention phenomenon can also act on coarse particles, which are often formed by high-porosity aggregates. According to Kindler et al. (2010), large, porous particles whose effective density is close to that of ambient water are much more dependent on transition zones, and large accumulations of porous particles can occur at interfaces due to their less dense water transport, which is also conducive to aggregation. In our case, the density difference at the interface between two staircases is really weak (a few thousandths of a kilogram per cubic metre), and despite the measurement uncertainty of the particle abundances, the results suggest that interfaces have an effect on the size distribution – through retention and aggregation – of the settling particles. The larger particles, which are generally denser and have higher settling velocities, are not affected by the change in water density.
In addition, convection phenomena in the mixed layers sandwiching the density interfaces are likely to even out the concentration of slowly sinking particles. The estimated vertical velocities of the current, on the order of a few millimetres per second, are likely to alter the settling of particles, helping to homogenize their abundance with depth and increase their residence time in each layer.
4.3 Potential impact of staircases on the biogeochemical activity
The vertical export of organic particles to the deep ocean is a crucial component of the oceanic carbon cycle, with flux decreasing significantly (> 70 %) in the mesopelagic zone (100–1000 m depth). Several biogeochemical processes are responsible for the reduction in this flux and particle lability decrease with depth. Briggs et al. (2020) suggested that particle fragmentation could account for approximately half of the observed particle loss in the mesopelagic zone. Additionally, remineralization by heterotrophic respiration and enzymatic solubilization both by free-living and particle-attached microbes play a key role in particle degradation (Karl et al., 1988; Collins et al., 2015). It is also well known that marine snow aggregates act as hotspots for microbial activity, hosting diverse communities of bacteria, protozoans and other microorganisms. The particle-attached microbial community evolves with depth, due to the evolution of the initial attached community rather than de novo colonization, detachment or grazing as the marine snow sinks (Thiele et al., 2015). These communities are often orders of magnitude more concentrated and active than those in the surrounding water, leading to intense localized degradation and remineralization of organic matter (Kiørboe, 2001; Baumas and Bizic, 2024).
The presence of multiple and marked thermohaline staircases (such as those in the “WStairs” group) appears to affect the sedimentation patterns, promoting particle retention and aggregation and increasing the time that particles spend in the water column. These structures also create distinct microenvironments with gradients of oxygen and nutrients, which are believed to be the result of the degradation of particulate organic matter. This effect is illustrated for three separate interfaces in Figs. 10–12. It can be then hypothesized that the increase in particle residence time favours the remineralization process of organic matter, which releases nutrients while consuming dissolved oxygen through heterotrophic respiration. Depending on the conditions and with a sufficiently long stability period, these activities can lead to localized oxygen depletion and an increase in AOU. In our data, this effect is observed in the shallower staircases, between 750 and 900 m, at station 9 (Fig. 12, bottom row). For deeper interfaces for stations 8 and 11, at around 1200 m (Figs. 10 and 11, bottom row), the increase in AOU and the potential accumulation of nitrate are masked by a stronger vertical oxygen gradient and higher nutrient concentrations compared to shallower depths. Moreover, biological activity within these deeper staircases is also reduced due to the decreased lability of organic matter with increasing depth (Ghiglione et al., 2009; Karl et al., 1988).
To assess the effect of thermohaline staircases on AOU profiles, we compared linear regressions of AOU vs. depth between stations with (“WStairs”) and without (“NoStair”) multiple staircases (Fig. 9b), focusing on the 1000–1900 m depth range where the relationship is approximately linear. The analysis shows a statistically significant difference in the slopes of the AOU between the “WStairs” and “NoStair” conditions (p<0.001). Specifically, the AOU decreases less rapidly with depth under the “WStairs” condition (slope = −0.0028) compared to the “NoStair” condition (slope = −0.0033). This difference suggests that oxygen demand decreases more slowly under the “WStairs” condition. This could indicate increased in situ mineralization activity compared to the “NoStair” condition. A slower decline in AOU may reflect a more active microbial cycle and a greater contribution of organic matter degradation to the oxygen budget within the “WStairs” setting. This pattern supports the idea that stairs may slow the decline in the respiration signal with depth, possibly due to retention at density interfaces, as previously proposed for particle dynamics.
The persistence of these staircase structures allows sufficient time for significant biogeochemical transformations to occur. Arístegui et al. (2009) and Nagata and Kirchman (1997) showed that the degradation kinetics of organic matter, which vary according to temperature, oxygen availability and microbial composition, can range from a few days to several months in deep marine environments. This can lead to the local accumulation of nitrates, creating pockets of higher concentration and intensifying vertical double-diffusive nitrate fluxes toward upper layers. However, observing these accumulations with the present resolution and precision remains challenging. Taillandier et al. (2020) already showed that the thermohaline staircases in the Tyrrhenian Sea significantly influence the biogeochemical dynamics by contributing to the nitrate enrichment of the EIW through diffusion. They estimated upward nitrate fluxes (assuming weak turbulent diapycnal diffusivity) in the transition zone between 400 and 2000 m depth to be about 4 µmol m−2 d−1 using the salt diffusivity formulation of Radko and Smith (2012) based on the density ratio, , where α and β are the thermal expansion and haline contraction coefficients of seawater, respectively, and the molecular diffusivity of heat is kT= 1.4 × 10⁻⁷ m2 s−1. We calculated nitrate diffusive vertical fluxes, assuming weak turbulent diapycnal diffusivity) at each interface using the same formulation. The nitrate flux () can be expressed as follows:
where Ksf is the salt-fingering diffusivity of nitrate and is the vertical gradient in nitrate concentration. At station 9, the diffusive nitrate flux was assessed at the depth of each step between 600 and 1600 m (Fig. 13). Fluxes ranged from 3.8 µmol m−2 d−1 at the deepest depth (1254 m) to 19.1 µmol m−2 d−1 for the three shallower depths (728–870 m). The fluxes at the interfaces are therefore stronger than the overall flux estimated by Taillandier et al. (2020) for the 400–2000 m depth range. Fluxes at interfaces are the major contributor to the total nitrate flux. In agreement with our estimation of double-diffusive upward nitrate flux, Durante et al. (2021) estimated that heat and salt fluxes are more pronounced in the upper part of the staircases zone (700–1600 m) but decrease below 1800 m, reaching a minimum near the base of the staircases.
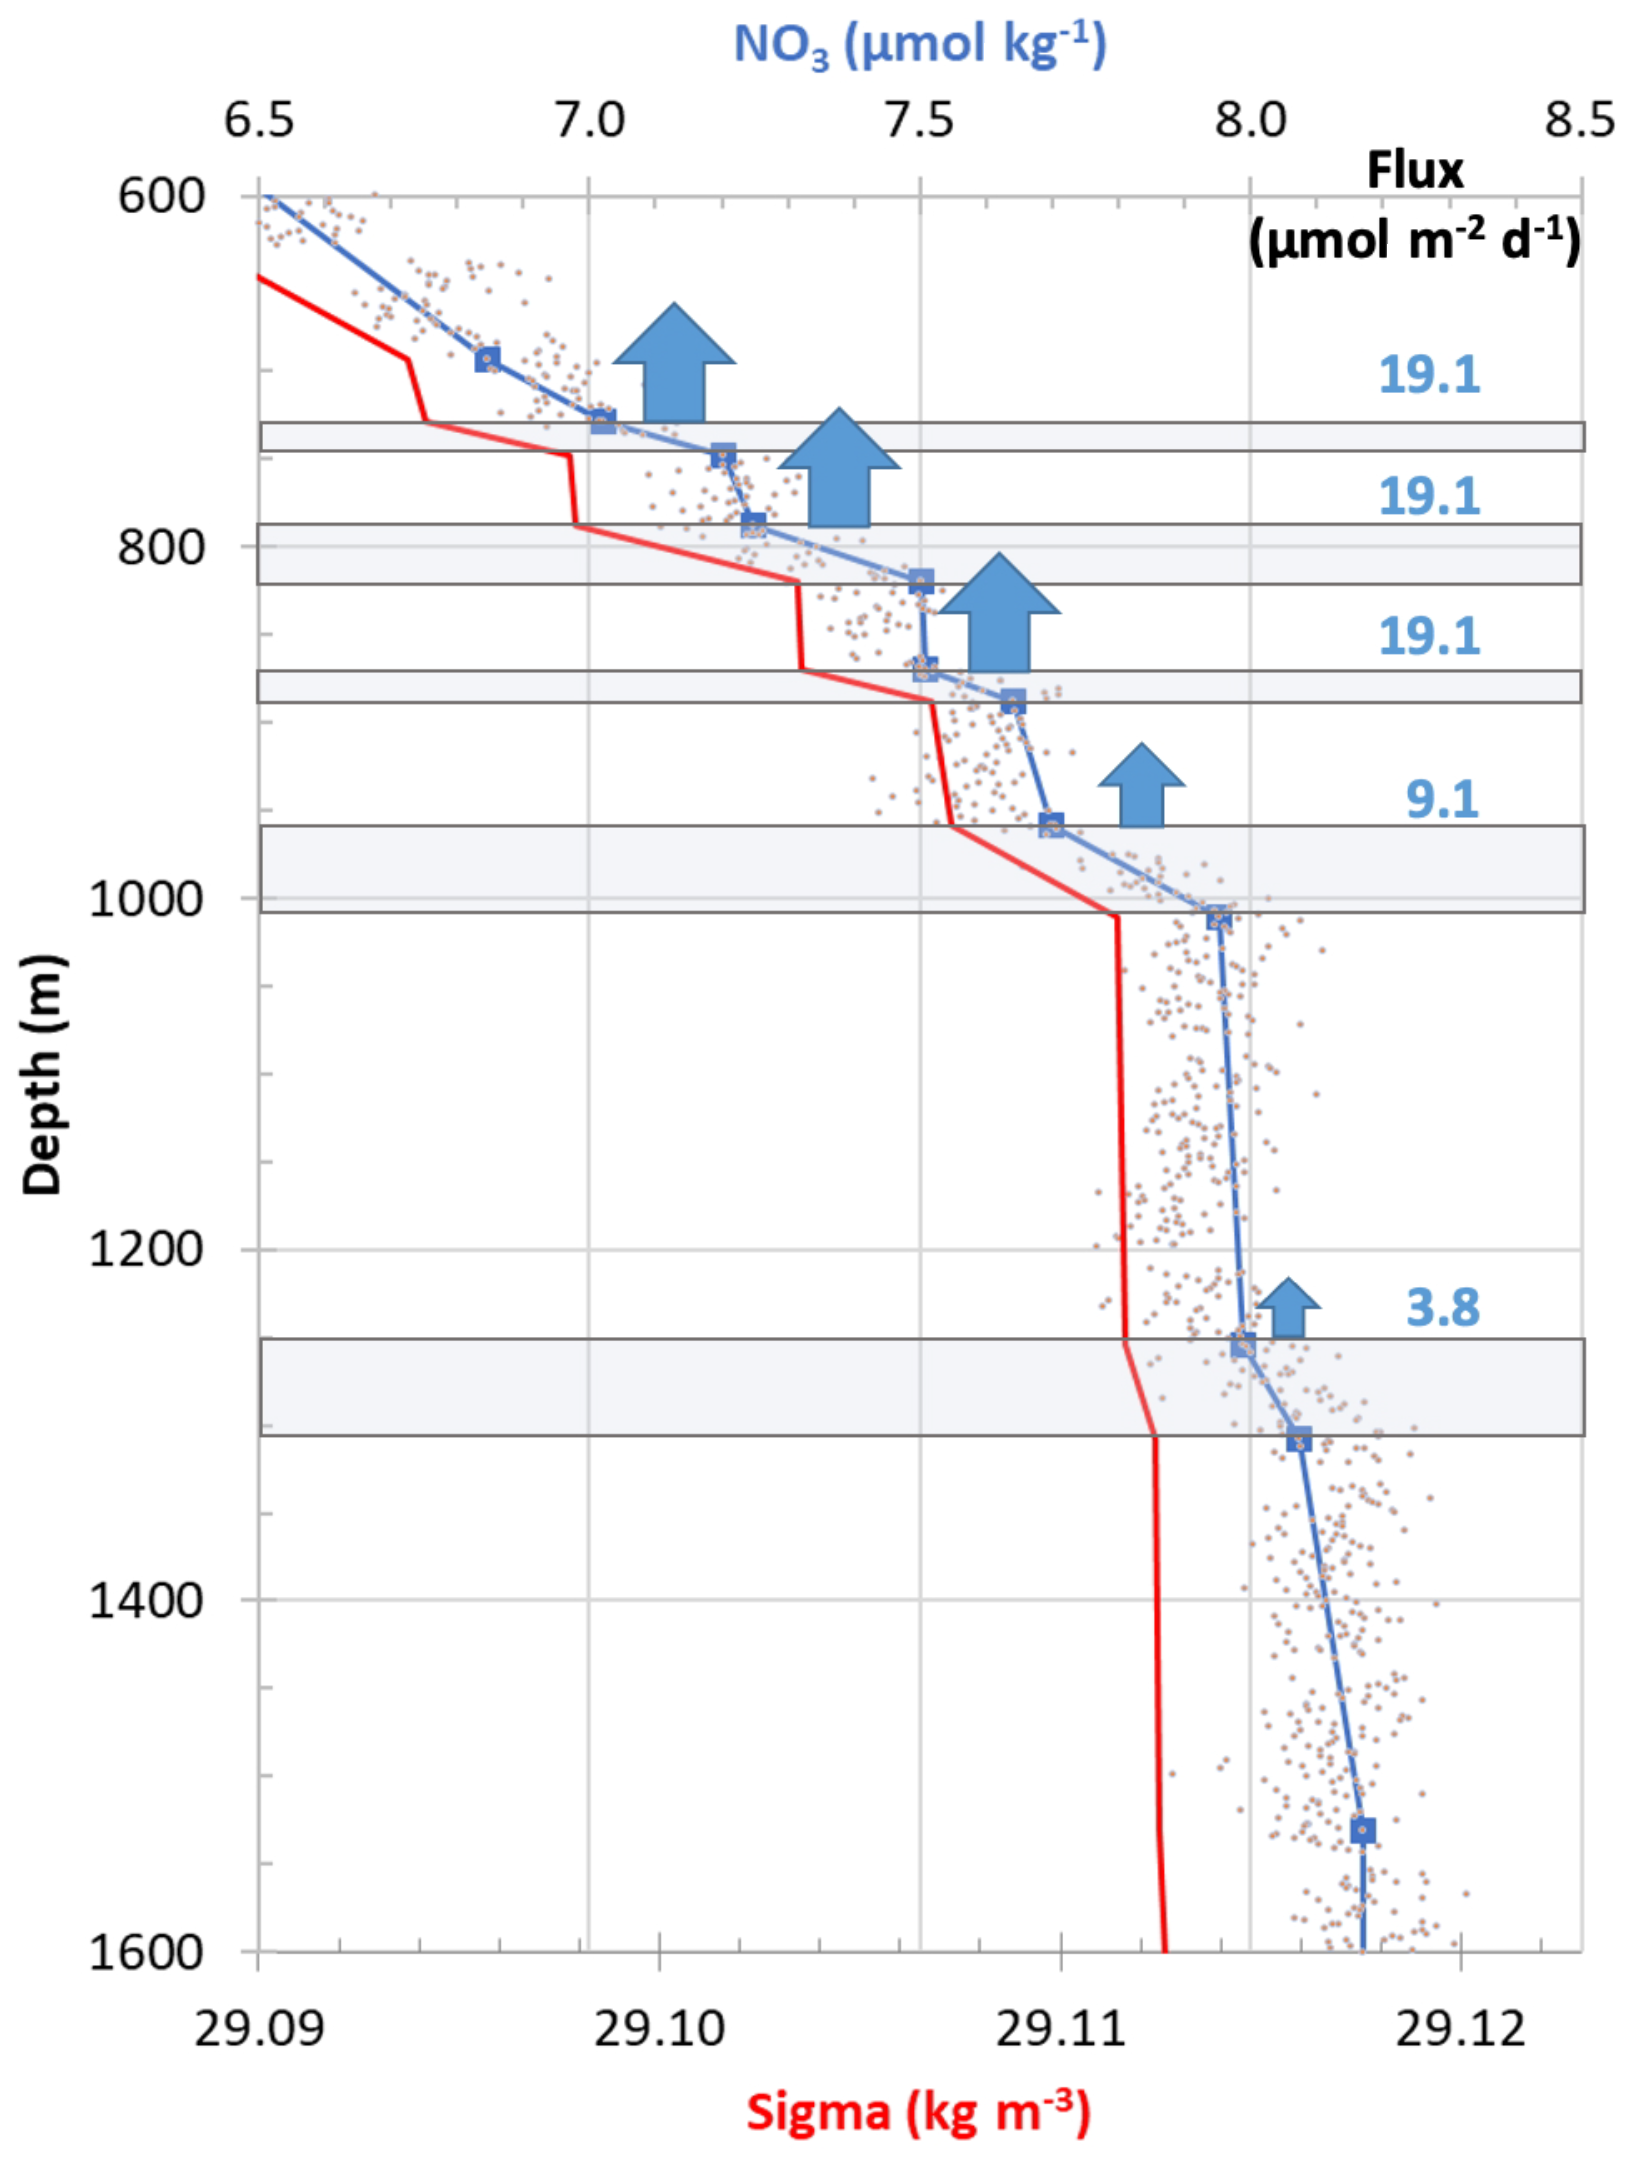
Figure 13Estimated double-diffusive nitrate vertical fluxes across each interface (annotated in blue and expressed in micromoles per square metre per day, µmol m−2 d−1) from station 9. The blue arrows indicate the direction of the flux, and the sizes are proportional to the intensity. The vertical profile of the potential density anomaly (σθ referenced to the surface pressure in kilograms per cubic metre, kg m−3) delimiting homogeneous and gradient zones is shown in red. The grey points correspond to nitrate measurements by the SUNA, whereas the blue squares are the values averaged over 1 m for each point at the upper and lower interfaces and are used to calculate the nitrate gradient in the shaded areas.
This study examines the effect of observed weakly stepped density gradients induced by salt fingering on the distribution and fluxes of particulate and dissolved elements. While the effect of density steps on particle settling has been well studied experimentally and demonstrated for strong density gradients in natural environments (i.e. buoyant river plumes and the pycnocline), this is the first time, to our knowledge, that this effect has been identified for steps with the extremely low density gradients that exist in the deep ocean.
In the Tyrrhenian Sea, the interface between the warm and saline intermediate waters (EIW) and the colder and less saline deep waters (TDW) presents thermohaline conditions favourable to the development of significant salt-fingering staircases. These structures are predominantly observed in regions characterized by minimal hydrodynamic activity, situated in the interior of the basin, distanced from boundary influences and beneath the depth of influence of mesoscale eddy dynamics. Furthermore, the investigation confirms that the thermohaline staircases in the central region of the Tyrrhenian Basin exhibit remarkable temporal stability, persisting for several years.
Overall, this study demonstrates that the interplay between physical oceanographic processes and biogeochemical dynamics in the deep Tyrrhenian Sea is strongly mediated by the presence of thermohaline staircases. The presence of thermohaline staircases appears to have a significant influence on the distribution of particulate and dissolved matter. Profiles of particle abundance resolved down to a few hundred micrometres or profiles of dissolved substances, such as oxygen and nitrate, tend to mirror the step-like structure observed in the density profiles.
Thermohaline staircases create distinct density interfaces that act as physical barriers, slowing the descent of particles. The retention of near-floating particles at density interfaces is thought to increase their residence time, promote particle aggregation and, incidentally, allow the larger particles thus formed to cross the density interface. At the same time, the staircases influence the concentration of nutrients (such as nitrate) and dissolved oxygen levels, thereby potentially affecting microbial activity and nutrient cycling within these interfaces. The retention of part of the particulate material at the density interfaces allows the mineralization of organic matter, contributing to nitrate enrichment and increasing the upward diapycnal diffusive fluxes of oxygen and nitrate. Ecologically, it is suggested that these staircases can play a crucial role in promoting diverse habitats and influencing the lability of organic matter and the nutrient distribution and fluxes. Such findings underscore the importance of fine-scale physical structures in shaping the biogeochemical landscape of the ocean interior and emphasize the need for further research to fully understand their implications for marine ecosystems.
Table A1Mean abundance (number per litre, no. L−1), percentage, and cumulative percentage by size class of UVP between 80 and 2000 mm for all stations between the surface and 2000 m depth.
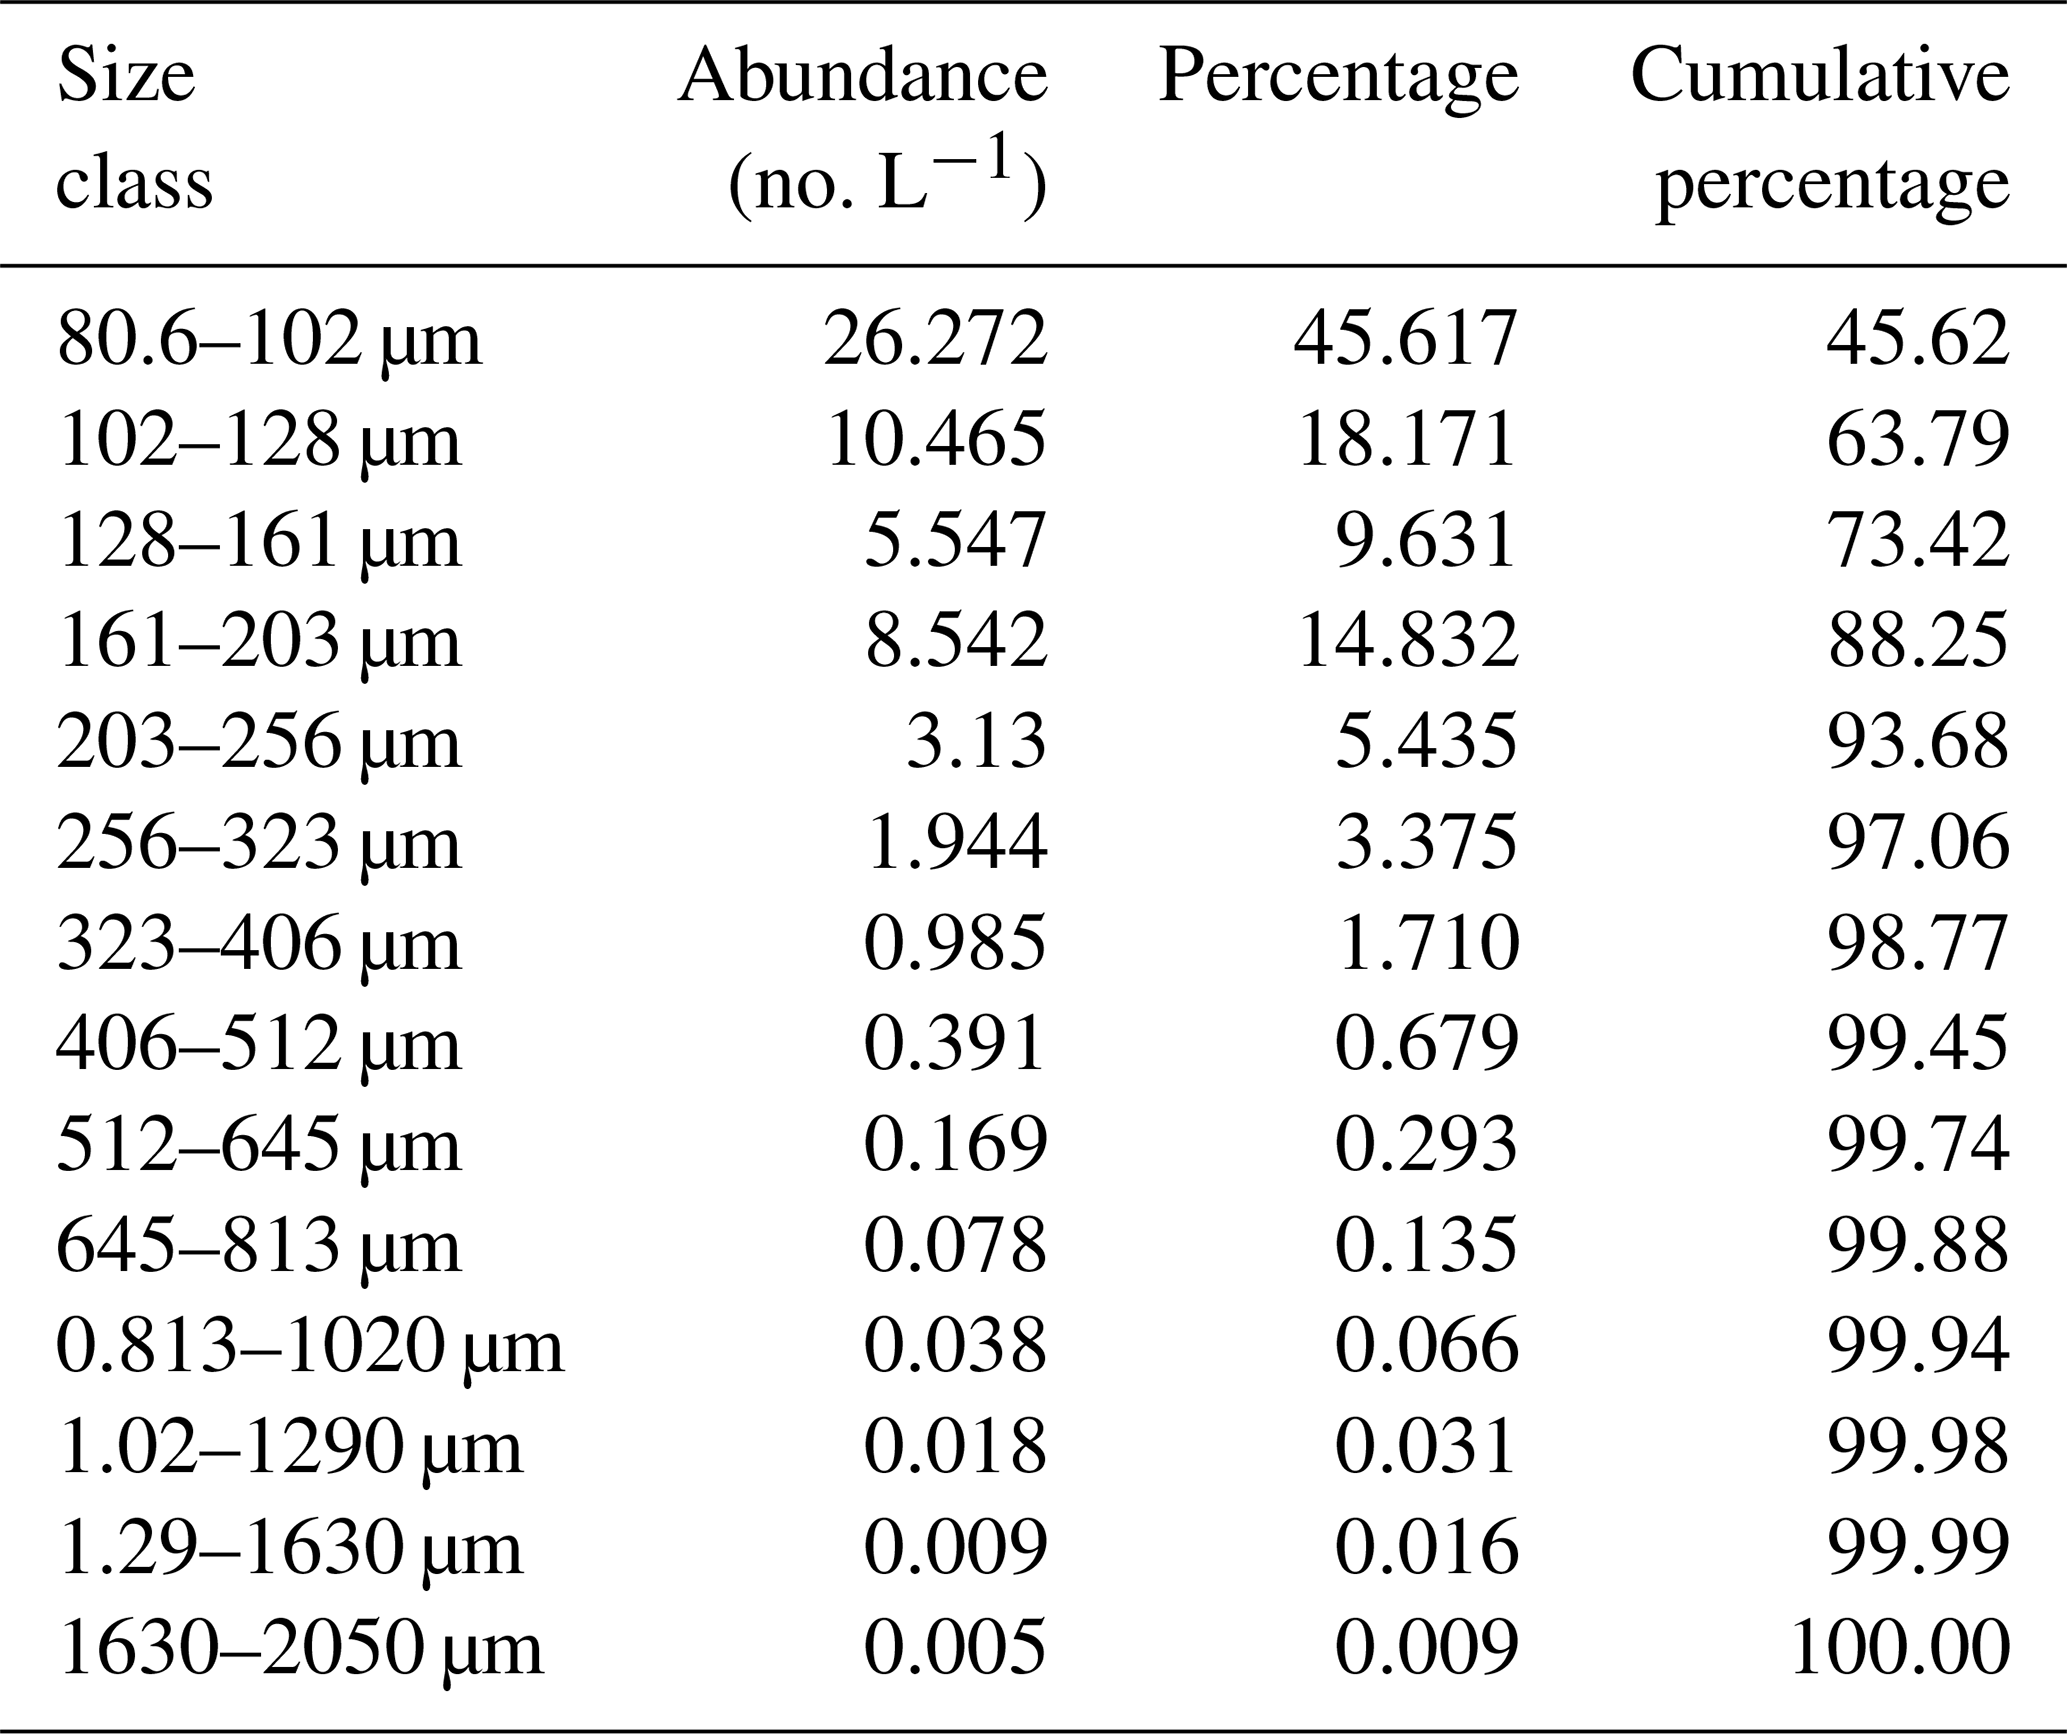
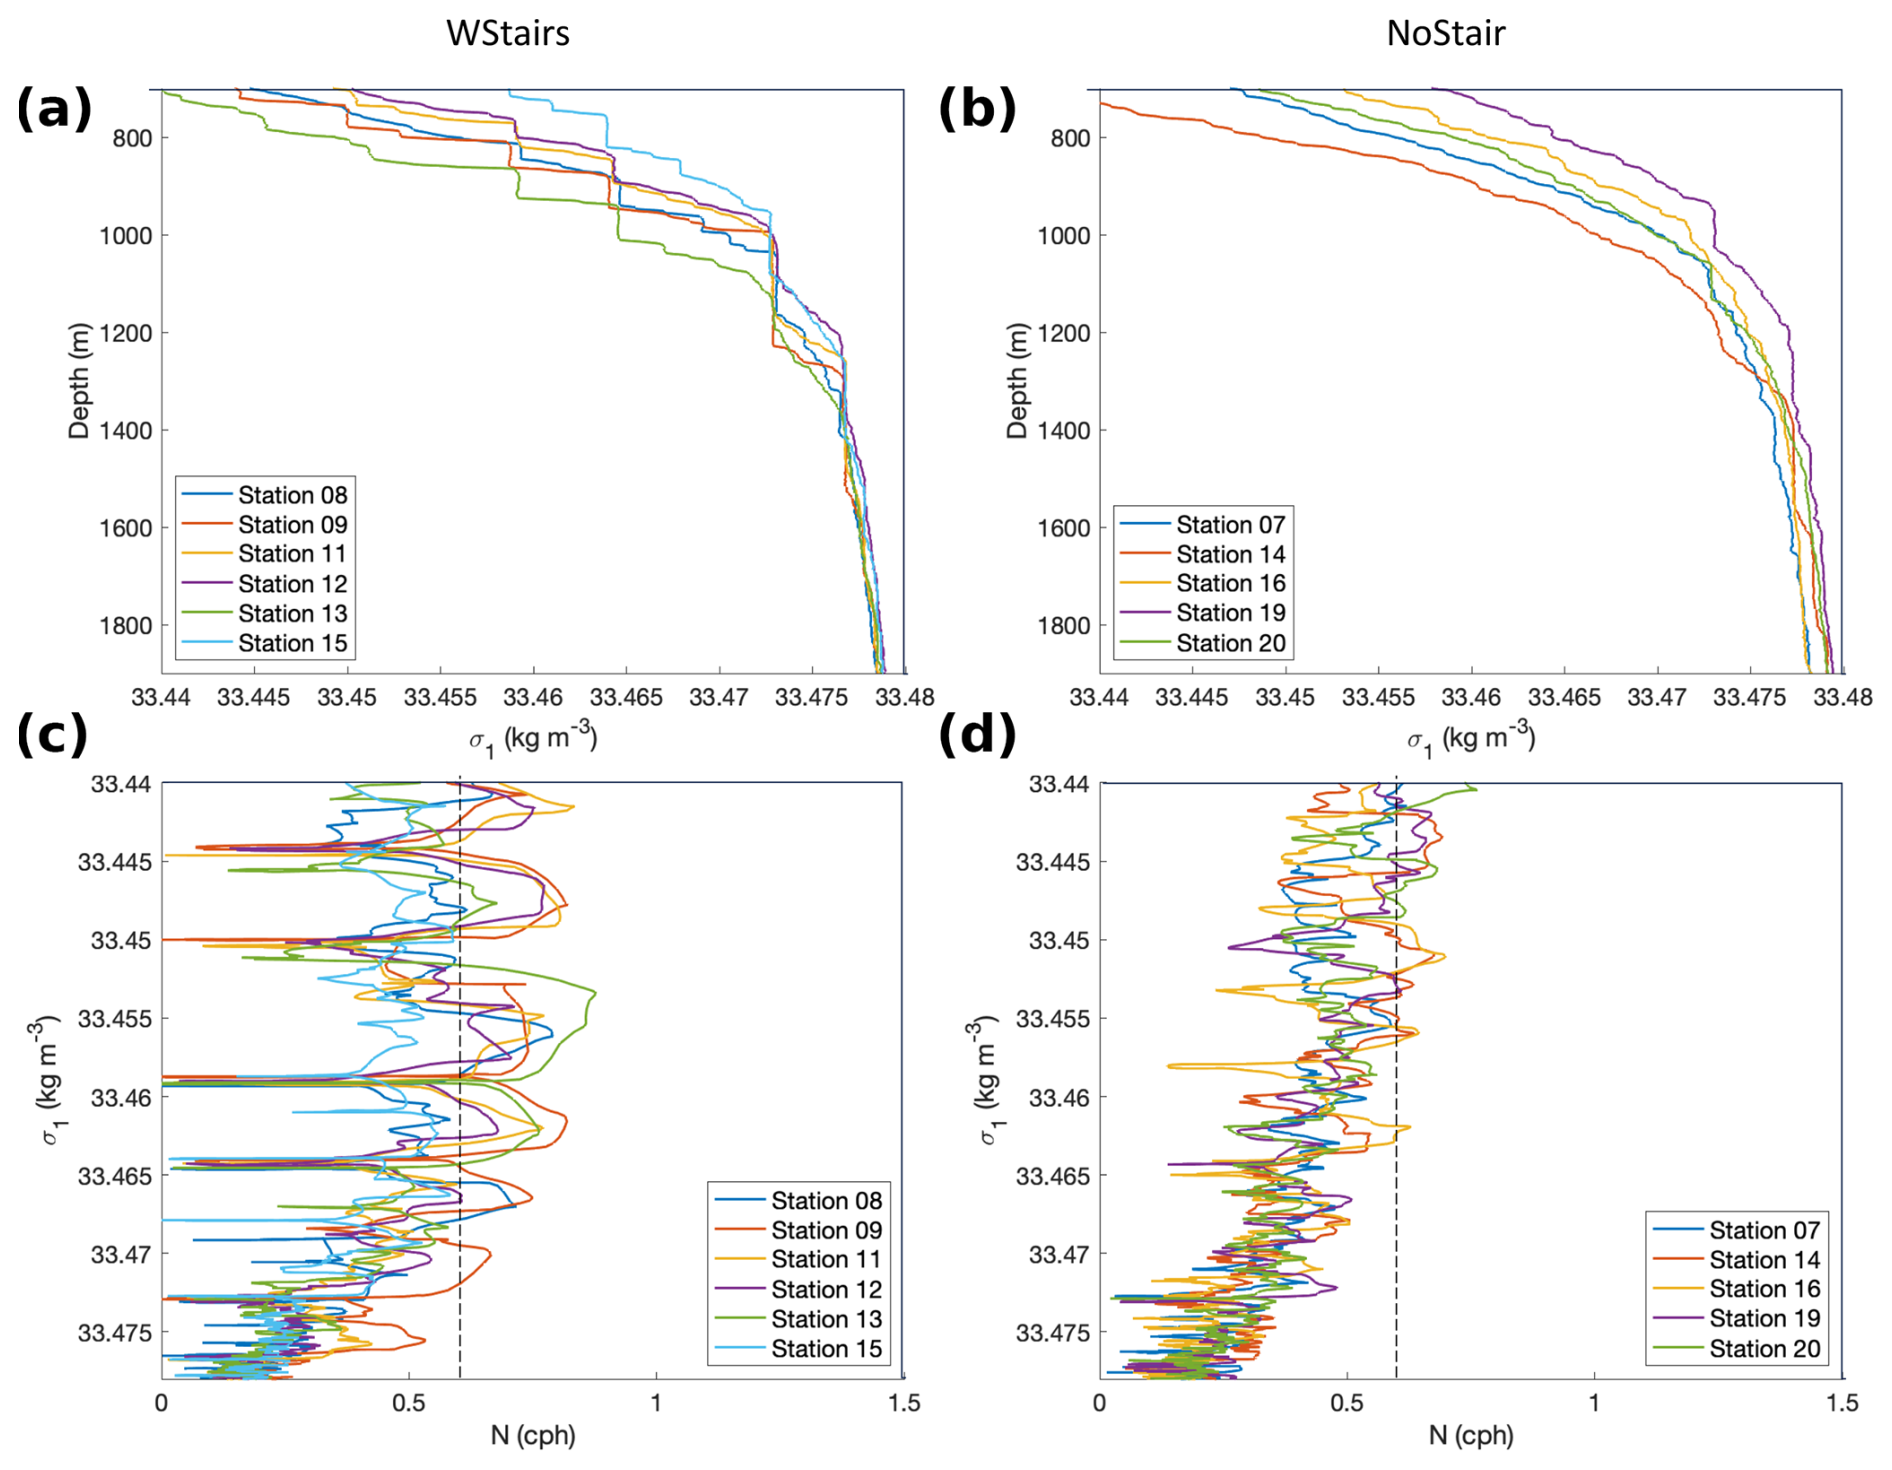
Figure B1Profiles of potential density anomaly (σ1 as a function of depth) and Brunt–Väisälä frequency (N as a function of σ1) for the two groups of stations (a, c) “WStairs” – category with stations 8, 9, 11, 12, 13 and 15 – and (b, d) “NoStair” – category with stations 7, 14, 16, 19 and 20. The dashed line highlights the 0.6 cph threshold. The buoyancy frequency for the “WStairs” group displays sharp, repeated peaks in N often reaching or exceeding 0.6 cph. In contrast, the buoyancy frequency for the “NoStair” group is generally below 0.6 cph.
The CTD and ADCP data used in this study are available at https://doi.org/10.17600/18001342 (Pujo-Pay et al., 2020). The UVP data are available at https://ecotaxa.obs-vlfr.fr (last access: 11 September 2025).
Conceptualization and methodology: XDDM, PB and MPP; writing – original draft preparation: XDDM and PB; writing – review and editing: all co-authors.
The contact author has declared that none of the authors has any competing interests.
Publisher's note: Copernicus Publications remains neutral with regard to jurisdictional claims made in the text, published maps, institutional affiliations, or any other geographical representation in this paper. While Copernicus Publications makes every effort to include appropriate place names, the final responsibility lies with the authors.
This study benefited from the data obtained during the PERLE-3 cruise (https://doi.org/10.17600/18001342, Pujo-Pay et al., 2020) with the R/V Pourquoi-Pas? and was supported by the MISTRALS-MERMEX project. We would like to express our sincere thanks to the three reviewers for their constructive criticism and comments, which greatly improved the manuscript.
This paper was edited by Ilker Fer and reviewed by Sara Durante and two anonymous referees.
Aiken, L. S., West, S. G., and Reno, R. R.: Interactions Between Continuous Predictors in Multiple Regression, in: Multiple Regression: Testing and Interpreting Interactions, Sage publications, Newbury Park (California), 9–27, ISBN 0-7619-0712-2, 1991.
Arístegui, J., Gasol, J. M., Duarte, C. M., and Herndld, G. J.: Microbial oceanography of the dark ocean's pelagic realm, Limnol. Oceanogr., 54, 1501–1529, https://doi.org/10.4319/lo.2009.54.5.1501, 2009.
Baumas, C. and Bizic, M.: A focus on different types of organic matter particles and their significance in the open ocean carbon cycle, Prog. Oceanogr., 224, 103233, https://doi.org/10.1016/j.pocean.2024.103233, 2024.
Briggs, N., Dall'Olmo, G., and Claustre, H.: Major role of particle fragmentation in regulating biological sequestration of CO2 by the oceans, Science, 367, 791–793, https://doi.org/10.1126/science.aay1790, 2020.
Buffett, G. G., Krahmann, G., Klaeschen, D., Schroeder, K., Sallarès, V., Papenberg, C., Ranero, C. R., and Zitellini, N.: Seismic Oceanography in the Tyrrhenian Sea: Thermohaline Staircases, Eddies, and Internal Waves, J. Geophys. Res.-Oceans, 122, 8503–8523, https://doi.org/10.1002/2017JC012726, 2017.
Chaikalis, S., Parinos, C., Möbius, J., Gogou, A., Velaoras, D., Hainbucher, D., Sofianos, S., Tanhua, T., Cardin, V., Proestakis, E., Amiridis, V., Androni, A., and Karageorgis, A.: Optical Properties and Biochemical Indices of Marine Particles in the Open Mediterranean Sea: The R/V Maria S. Merian Cruise, March 2018, Front. Earth. Sci., 9, 614703, https://doi.org/10.3389/feart.2021.614703, 2021.
Collins, J. R., Edwards, B. R., Thamatrakoln, K., Ossolinski, J. E., DiTullio, G. R., Bidle, K. D., Doney, S. C., and Van Mooy, B. A. S.: The multiple fates of sinking particles in the North Atlantic Ocean, Global Biogeochem. Cy., 29, 1471–1494, https://doi.org/10.1002/2014GB005037, 2015.
Doostmohammadi, A. and Ardekani, A. M.: Reorientation of elongated particles at density interfaces, Phys. Rev. E, 90, 033013, https://doi.org/10.1103/PhysRevE.90.033013, 2014.
Doostmohammadi, A. and Ardekani, A. M.: Suspension of solid particles in a density stratified fluid, Phys. Fluids, 27, 023302, https://doi.org/10.1063/1.4907875, 2015.
Durante, S., Schroeder, K., Mazzei, L., Pierini, S., Borghini, M., and Sparnocchia, S.: Permanent Thermohaline Staircases in the Tyrrhenian Sea, Geophys. Res. Lett., 46, 1562–1570, https://doi.org/10.1029/2018GL081747, 2019.
Durante, S., Oliveri, P., Nair, R., and Sparnocchia, S.: Mixing in the Tyrrhenian Interior Due to Thermohaline Staircases, Front. Mar. Sci., 8, 672437, https://doi.org/10.3389/fmars.2021.672437, 2021.
Falco, P., Trani, M., and Zambianchi, E.: Water mass structure and deep mixing processes in the Tyrrhenian Sea: Results from the VECTOR project, Deep-Sea Res. Pt. I, 113, 7–21, https://doi.org/10.1016/j.dsr.2016.04.002, 2016.
Fer, I., Bosse, A., Ferron, B., and Bouruet-Aubertot, P.: The Dissipation of Kinetic Energy in the Lofoten Basin Eddy, J. Phys. Oceanogr., 48, 1299–1316, https://doi.org/10.1175/JPO-D-17-0244.1, 2018.
Ferron, B., Bouruet Aubertot, P., Cuypers, Y., Schroeder, K., and Borghini, M.: How important are diapycnal mixing and geothermal heating for the deep circulation of the Western Mediterranean?, Geophys. Res. Lett., 44, 7845–7854, https://doi.org/10.1002/2017GL074169, 2017.
Ghiglione, J.-F., Conan, P., and Pujo-Pay, M.: Diversity of total and active free-living vs. particle-attached bacteria in the euphotic zone of the NW Mediterranean Sea, Fems Microbiol. Lett., 299, 9–21, https://doi.org/10.1111/j.1574-6968.2009.01694.x, 2009.
Giering, S. L. C., Cavan, E. L., Basedow, S. L., Briggs, N., Burd, A. B., Darroch, L. J., Guidi, L., Irisson, J.-O., Iversen, M. H., Kiko, R., Lindsay, D., Marcolin, C. R., McDonnell, A. M. P., Möller, K. O., Passow, U., Thomalla, S., Trull, T. W., and Waite, A. M.: Sinking Organic Particles in the Ocean – Flux Estimates From in situ Optical Devices, Front. Mar. Sci, 6, 834, https://doi.org/10.3389/fmars.2019.00834, 2020.
Guidi, L., Stemmann, L., Jackson, G. A., Ibanez, F., Claustre, H., Legendre, L., Picheral, M., and Gorskya, G.: Effects of phytoplankton community on production, size, and export of large aggregates: A world-ocean analysis, Limnol. Oceanogr., 54, 1951–1963, https://doi.org/10.4319/lo.2009.54.6.1951, 2009.
Hill, P. S., Boss, E., Newgard, J. P., Law, B. A., and Milligan, T. G.: Observations of the sensitivity of beam attenuation to particle size in a coastal bottom boundary layer, J. Geophys. Res.-Oceans, 116, C02023, https://doi.org/10.1029/2010JC006539, 2011.
Iacono, R., Napolitano, E., Marullo, S., Artale, V., and Vetrano, A.: Seasonal Variability of the Tyrrhenian Sea Surface Geostrophic Circulation as Assessed by Altimeter Data, J. Phys. Oceanogr., 43, 1710–1732, https://doi.org/10.1175/JPO-D-12-0112.1, 2013.
Iacono, R., Napolitano, E., Palma, M., and Sannino, G.: The Tyrrhenian Sea Circulation: A Review of Recent Work, Sustainability-Basel, 13, 6371, https://doi.org/10.3390/su13116371, 2021.
IOC, SCOR and IAPSO: The international thermodynamic equation of seawater – 2010: Calculation and use of thermodynamic properties, https://www.teos-10.org/ (last access: 11 September 2025), 2010.
Johannessen, O. M. and Lee, O. S.: A deep stepped thermo-haline structure in the Mediterranean, Deep-Sea Res., 21, 629–639, https://doi.org/10.1016/0011-7471(74)90047-3, 1974.
Kapelonis, Z., Siapatis, A., Machias, A., Somarakis, S., Markakis, K., Giannoulaki, M., Badouvas, N., and Tsagarakis, K.: Seasonal patterns in the mesopelagic fish community and associated deep scattering layers of an enclosed deep basin, Sci. Rep.-UK, 13, 17890, https://doi.org/10.1038/s41598-023-44765-5, 2023.
Karl, D. M., Knauer, G. A., and Martin, J. H.: Downward flux of particulate organic matter in the ocean: a particle decomposition paradox, Nature, 332, 438–441, https://doi.org/10.1038/332438a0, 1988.
Kermabon, C., Lherminier, P., Le Bot, P., and Gaillard, F.: Chaine Automatisée de Suivi des Courantomètres Acoustiques Doppler Embarqués – Cascade V7.2: Logiciel de validation et de visualisation des mesures ADCP de coque, https://www.umr-lops.fr/Technologies/Logiciels/ADCP-de-coque (last access: 11 September 2025), 2018.
Kiko, R., Picheral, M., Antoine, D., Babin, M., Berline, L., Biard, T., Boss, E., Brandt, P., Carlotti, F., Christiansen, S., Coppola, L., de la Cruz, L., Diamond-Riquier, E., Durrieu de Madron, X., Elineau, A., Gorsky, G., Guidi, L., Hauss, H., Irisson, J.-O., Karp-Boss, L., Karstensen, J., Kim, D., Lekanoff, R. M., Lombard, F., Lopes, R. M., Marec, C., McDonnell, A. M. P., Niemeyer, D., Noyon, M., O'Daly, S. H., Ohman, M. D., Pretty, J. L., Rogge, A., Searson, S., Shibata, M., Tanaka, Y., Tanhua, T., Taucher, J., Trudnowska, E., Turner, J. S., Waite, A., and Stemmann, L.: A global marine particle size distribution dataset obtained with the Underwater Vision Profiler 5, Earth Syst. Sci. Data, 14, 4315–4337, https://doi.org/10.5194/essd-14-4315-2022, 2022.
Kindler, K., Khalili, A., and Stocker, R.: Diffusion-limited retention of porous particles at density interfaces, P. Natl. Acad. Sci. USA, 107, 22163–22168, https://doi.org/10.1073/pnas.1012319108, 2010.
Kiørboe, T.: Formation and fate of marine snow: small-scale processes with large-scale implications, Sci. Mar., 65, 57–71, https://doi.org/10.3989/scimar.2001.65s257, 2001.
Kunze, E.: A review of oceanic salt-fingering theory, Prog. Oceanogr., 56, 399–417, https://doi.org/10.1016/S0079-6611(03)00027-2, 2003.
Maggi, F.: The settling velocity of mineral, biomineral, and biological particles and aggregates in water: SPM settling velocity in water, J. Geophys. Res.-Oceans, 118, 2118–2132, https://doi.org/10.1002/jgrc.20086, 2013.
McCave, I. N.: Vertical flux of particles in the ocean, Deep-Sea Res., 22, 491–502, https://doi.org/10.1016/0011-7471(75)90022-4, 1975.
McCave, I. N.: Size spectra and aggregation of suspended particles in the deep ocean, Deep-Sea Res., 31, 329–352, https://doi.org/10.1016/0198-0149(84)90088-8, 1984.
Millot, C. and Taupier-Letage, I.: Circulation in the Mediterranean Sea, in: The Mediterranean Sea, Handbook of Environmental Chemistry, edited by: Saliot, A., Springer Berlin Heidelberg, Berlin, Heidelberg, 29–66, https://doi.org/10.1007/b107143, 2005.
Molcard, R. and Tait, R. I.: The steady state of the step structure in the Tyrrhenian Sea, in: A Voyage of Discovery, George Deacon 70th Anniversary, Oxford, 221–233, ISBN: 978-0-08-021380-4, 1977.
Mrokowska, M. M.: Stratification-induced reorientation of disk settling through ambient density transition, Sci. Rep.-UK, 8, 412, https://doi.org/10.1038/s41598-017-18654-7, 2018.
Mullison, J.: Backscatter Estimation Using Broadband Acoustic Doppler Current Profilers-Updated, ASCE Hydraulic Measurements and Experimental Methods Conference, Durham, NH, 9–12 July 2017, https://www.researchgate.net/publication/318541921_Backscatter_Estimation_Using_Broadband_Acoustic_Doppler_Current_Profilers-Updated (last access: 11 September 2025), 2017.
Nagata, T. and Kirchman, D. L.: Roles of Submicron Particles and Colloids in Microbial Food Webs and Biogeochemical Cycles within Marine Environments, in: Adv. Microb. Ecol., Springer, Boston, MA, https://doi.org/10.1007/978-1-4757-9074-0_3, 1997.
Newton, P. P. and Liss, P. S.: Particles in the oceans (and other natural waters), Sci. Prog., 74, 91–114, https://www.jstor.org/stable/43423878 (last access: 11 September 2025), 1990.
Omand, M. M., Govindarajan, R., He, J., and Mahadevan, A.: Sinking flux of particulate organic matter in the oceans: Sensitivity to particle characteristics, Sci. Rep.-UK, 10, 5582, https://doi.org/10.1038/s41598-020-60424-5, 2020.
Peña, M.: Atlantic versus Mediterranean deep scattering layers around the Iberian peninsula, Prog. Oceanogr., 221, 103211, https://doi.org/10.1016/j.pocean.2024.103211, 2024.
Picheral, M., Guidi, L., Stemmann, L., Karl, D. M., Iddaoud, G., and Gorsky, G.: The Underwater Vision Profiler 5: An advanced instrument for high spatial resolution studies of particle size spectra and zooplankton, Limnol. Oceanogr.-Meth., 8, 462–473, https://doi.org/10.4319/lom.2010.8.462, 2010.
Prairie, J., Ziervogel, K., Arnosti, C., Camassa, R., Falcon, C., Khatri, S., McLaughlin, R., White, B., and Yu, S.: Delayed settling of marine snow at sharp density transitions driven by fluid entrainment and diffusion-limited retention, Mar. Ecol. Prog. Ser., 487, 185–200, https://doi.org/10.3354/meps10387, 2013.
Pujo-Pay, M., Durrieu De Madron, X., and Conan, P.: PERLE3 cruise, RV Pourquoi pas?, French Oceanographic Fleet [data set], https://doi.org/10.17600/18001342, 2020.
Radko, T. and Smith, D. P.: Equilibrium transport in double-diffusive convection, J. Fluid Mech., 692, 5–27, https://doi.org/10.1017/jfm.2011.343, 2012.
Radko, T., Bulters, A., Flanagan, J. D., and Campin, J.-M.: Double-Diffusive Recipes. Part I: Large-Scale Dynamics of Thermohaline Staircases, J. Phys. Oceanogr., 44, 1269–1284, https://doi.org/10.1175/JPO-D-13-0155.1, 2014.
Rinaldi, E., Buongiorno Nardelli, B., Zambianchi, E., Santoleri, R., and Poulain, P.-M.: Lagrangian and Eulerian observations of the surface circulation in the Tyrrhenian Sea, J. Geophys. Res.-Oceans, 115, 2009JC005535, https://doi.org/10.1029/2009JC005535, 2010.
Schroeder, K., Ben Ismail, S., Bensi, M., Bosse, A., Chiggiato, J., Civitarese, G., Falcieri M, F., Fusco, G., Gačić, M., Gertman, I., Kubin, E., Malanotte-Rizzoli, P., Martellucci, R., Menna, M., Ozer, T., Taupier-Letage, I., Vargas-Yáñez, M., Velaoras, D., and Vilibić, I.: A consensus-based, revised and comprehensive catalogue for Mediterranean water masses acronyms, Mediterr. Mar. Sci., 25, 783–791, https://doi.org/10.12681/mms.38736, 2024.
Sparnocchia, S., Gasparini, G. P., Astraldi, M., Borghini, M., and Pistek, P.: Dynamics and mixing of the Eastern Mediterranean outflow in the Tyrrhenian basin, J. Marine Syst., 20, 301–317, https://doi.org/10.1016/S0924-7963(98)00088-8, 1999.
Taillandier, V., Prieur, L., D'Ortenzio, F., Ribera d'Alcalà, M., and Pulido-Villena, E.: Profiling float observation of thermohaline staircases in the western Mediterranean Sea and impact on nutrient fluxes, Biogeosciences, 17, 3343–3366, https://doi.org/10.5194/bg-17-3343-2020, 2020.
Thiele, S., Fuchs, B. M., Amann, R., and Iversen, M. H.: Colonization in the Photic Zone and Subsequent Changes during Sinking Determine Bacterial Community Composition in Marine Snow, Appl. Environ. Microb., 81, 1463–1471, https://doi.org/10.1128/AEM.02570-14, 2015.
Thurnherr, A. M.: How To Process LADCP Data With the LDEO Software (Version IX.14), https://www.ldeo.columbia.edu/~ant/UserManuals/LDEO_IX.pdf (last access: 11 September 2025), 2021.
Thurnherr, A. M.: How to Process LADCP Data For Vertical Velocity (w) and Derive Parameterized Estimates for Turbulent Kinetic Energy Dissipation (ε) using LADCP_w Software V2.2, https://www.ldeo.columbia.edu/~ant/UserManuals/LADCP_w.pdf (last access: 11 September 2025), 2022.
van der Boog, C. G., Koetsier, J. O., Dijkstra, H. A., Pietrzak, J. D., and Katsman, C. A.: Global dataset of thermohaline staircases obtained from Argo floats and Ice-Tethered Profilers, Earth Syst. Sci. Data, 13, 43–61, https://doi.org/10.5194/essd-13-43-2021, 2021.
Verso, L., Reeuwijk, M. V., and Liberzon, A.: Transient stratification force on particles crossing a density interface, Int. J. Multiphas. Flow., 121, 103109, https://doi.org/10.1016/j.ijmultiphaseflow.2019.103109, 2019.
WET Labs Inc.: Transmissometer C-Star User's Guide, Sea-Bird Scientific, https://www.seabird.com/asset-get.download.jsa?id=69833853189 (last access: 11 September 2025), 2011.
Yang, S., Zhang, K., Song, H., Ruddick, B., Liu, M., and Meng, L.: Disruptions in thermohaline staircases caused by subsurface mesoscale eddies in the eastern Caribbean Sea, Commun. Earth Environ., 5, 408, https://doi.org/10.1038/s43247-024-01577-3, 2024.
Zodiatis, G. and Gasparini, G. P.: Thermohaline staircase formations in the Tyrrhenian Sea, Deep-Sea Res. Pt. I, 43, 655–678, https://doi.org/10.1016/0967-0637(96)00032-5, 1996.