the Creative Commons Attribution 4.0 License.
the Creative Commons Attribution 4.0 License.
 | 05 Aug 2025
Subsurface manifestation of marine heat waves in the southwestern Indian Ocean
Neil Malan
Daneeja Mawren
Tamaryn Morris
Janet Sprintall
Juliet C. Hermes
Marine heat waves (MHWs) are extreme events of prolonged, anomalously warm ocean temperatures. Globally, marine heat waves are increasing in frequency and intensity and are responsible for long-term impacts on marine ecosystems, which have devastating socio-economic consequences. A key gap in our understanding of MHWs is how they manifest in the subsurface. This paper uses satellite sea surface temperature (SST) data and in situ subsurface temperature observations from expendable bathythermographs (XBTs) to investigate the anomalous water temperature characteristics associated with surface-identified MHWs in the southwestern Indian Ocean (SWIO) and how they progress through the water column. We find that (1) regions of high eddy activity in the Mozambique Channel and southeast of Madagascar, where eddy kinetic energy is high and SST variability is low, are primarily characterised by the occurrence of abrupt and intense MHWs and that (2) the frequency, duration and intensity of these events are largely associated with mesoscale activity. In these eddy corridors, surface-detected MHW case studies demonstrate a strong, deep-reaching subsurface temperature anomaly signal with a maximum intensity below the surface. The majority of these MHWs are associated with anticyclonic eddies, which provide a possible mechanism for the deep extent of the surface MHWs. Improving our understanding of the interaction between mesoscale features and subsurface MHW characteristics will benefit the prediction of MHWs and management of the regions' biodiversity.
- Article
(3580 KB) - Full-text XML
- BibTeX
- EndNote


Marine heat waves (MHWs) are extreme, anomalously warm ocean events that are known to have devastating impacts on marine species, ecosystems and, ultimately, the socioeconomics of coastal countries that depend on a blue economy (Mills et al., 2013; Hobday and Pecl, 2014; Hermes et al., 2019). The thermal stress during MHWs has initiated coral bleaching events, destroyed marine foundation species, caused mass mortality events and species redistributions, and resulted in irreversible physiological damage to marine life (Mills et al., 2013; Frölicher et al., 2018; Oliver et al., 2021; Perez et al., 2021; Garrabou et al., 2022; Mawren et al., 2022b; Wyatt et al., 2023). The adverse effects of MHWs are especially concerning as, under scenarios of continued global ocean warming, MHWs are projected to increase globally, with events lasting longer and intensifying. If this trend continues many parts of the ocean are predicted to reach a near-permanent MHW state by the late 21st century (Hobday et al., 2016; Frölicher et al., 2018; Oliver et al., 2018; Holbrook et al., 2020). This highlights the need for rapid improvement in our understanding of MHWs and how to manage or adapt to their impacts (Elzahaby and Schaeffer, 2019).
A key gap in our understanding of MHW events is how they manifest in the subsurface (Oliver et al., 2018). MHW detection and characterisation is largely limited to the surface due to the lack of continuous, long-term and high-resolution subsurface temperature records (Elzahaby et al., 2021). However, MHWs themselves are not confined to the surface, as they can penetrate to considerable depths or even exist at depth with no surface signal (Elzahaby and Schaeffer, 2019; Holbrook et al., 2020; Scannell et al., 2020; Elzahaby et al., 2021; Schaeffer et al., 2023; Zhang et al., 2023). The lack of subsurface MHW characterisation limits our understanding of the true impacts that these events have, as it is the vertical extent of MHWs that directly impacts marine ecosystems (Elzahaby and Schaeffer, 2019; Holbrook et al., 2020; Scannell et al., 2020).
The subsurface extent of MHWs is often associated with different spatial MHW patterns and drivers compared to the surface (Elzahaby and Schaeffer, 2019; Scannell et al., 2020; Perez et al., 2021; Fragkopoulou et al., 2023; Zhang et al., 2023). Different ocean dynamical processes, such as large-scale circulation, oceanic planetary waves, boundary currents, eddies, local downwelling, seasonal stratification and mixing, influence the vertical structure of MHWs (Schaeffer et al., 2023; Zhang et al., 2023). Upper-ocean MHWs (0–150 m) have been shown to mostly originate from anomalous air–sea fluxes; however, even in cases where air–sea heat fluxes are the predominant driver of MHWs, ocean dynamical processes can extend the warm MHW signature into the subsurface (Schaeffer et al., 2023; Zhang et al., 2023). Deeper MHWs (that extend below 150 m) have been shown to be mostly driven by deep, warm-core, anticyclonic, mesoscale eddies (Schaeffer and Roughan, 2017; Elzahaby and Schaeffer, 2019; Perez et al., 2021; Fragkopoulou et al., 2023); boundary current shifts (Großelindemann et al., 2022); and Ekman pumping (Hu et al., 2021). In particular, eddies in subtropical western boundary currents (WBCs) are known to drive deeper and longer-lasting MHWs (Schaeffer and Roughan, 2017; Elzahaby and Schaeffer, 2019; Benthuysen et al., 2020; Elzahaby et al., 2021; Zhang et al., 2023).
Here, the focus is on the southwestern Indian Ocean (SWIO), which is part of the greater western Indian Ocean global warming hotspot (Roxy et al., 2014) and is host to a highly unique, complex and variable WBC system that supports one of the six primary global marine biodiversity hotspots (Ramírez et al., 2017). This makes assessing MHWs in this region even more crucial and urgent; however, to date, MHW characterisation in this region is sparse and limited to the surface (Mawren et al., 2022a).
A key feature in the SWIO is the Greater Agulhas Current System, which consists of the eddying flow through the Mozambique Channel (MC) and two dynamic WBCs, the South East Madagascar Current (SEMC) and the Agulhas Current (AC), the latter of which is the largest and strongest Southern Hemisphere WBC and, thus, plays a vital role in global thermohaline circulation (Fig. 1; Beal et al., 2011). Flow through the MC is characterised by large, deep-reaching, mostly anticyclonic and anomalously warm southward-propagating mesoscale eddies, which are formed from baroclinic instability in the South Equatorial Current (SEC), around the Comoros Islands (Quartly and Srokosz, 2004; Swart et al., 2010; Collins et al., 2012; Halo et al., 2014; Voldsund et al., 2017). South of Madagascar, the SEMC retroflects and sheds pairs of counter-rotating mesoscale eddies that converge with eddies from the MC (Voldsund et al., 2017). The persistence of eddies from the MC and SEMC creates a state of instability, which is the main source of variability and sea surface temperature (SST) anomalies in the region, making this region especially susceptible to the occurrence of MHWs (DiMarco et al., 2000; Halo et al., 2014; Phillips et al., 2021; Mawren et al., 2022a).
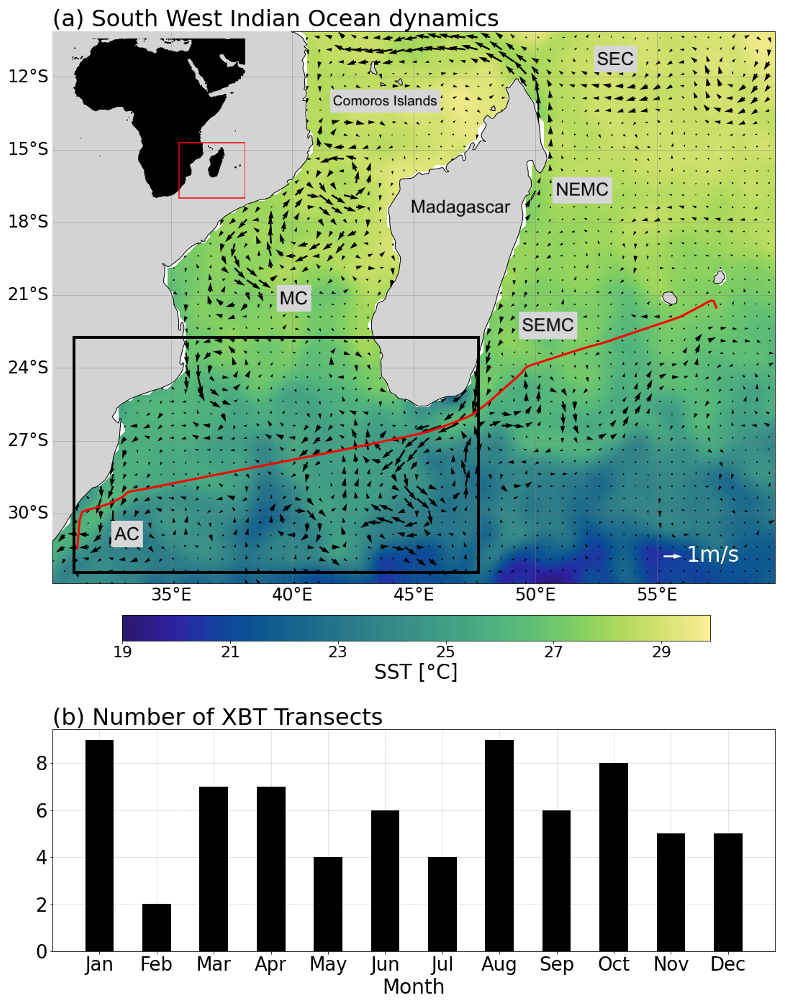
Figure 1(a) A snapshot of sea surface temperature conditions on 13 April 2021 (OISST V2) in the southwestern Indian Ocean, with geostrophic current velocities overlaid (AVISO satellite altimeter). The following key ocean circulation features are highlighted: SEMC – South East Madagascar Current; NEMC – North East Madagascar Current; SEC – South Equatorial Current; MC – Mozambique Channel; and AC – Agulhas Current. The black box (22–32° S and 31–48° E) indicates the study area. The red line represents the IX21 HR-XBT transect from Durban, South Africa, to Port Louis, Mauritius. (b) The number of XBT transects available for each month from the IX21 transect for the period from 1994 to 2022.
Where the MC and SEMC converge, eddy activity is highest; moreover, surface-identified MHWs in this region are increasing in frequency, intensity and duration more rapidly than anywhere else in the MC (Mawren et al., 2022a). The intensification of mesoscale eddies has subsequently increased ocean warming trends and SST anomalies, which may largely explain these observed MHW trends (Wu et al., 2012; Schaeffer and Roughan, 2017; Benthuysen et al., 2020; Mawren et al., 2022a). The most intense and longest-lasting MHW in the MC occurred in February 2017 (Mawren et al., 2022a). The 2017 MHW event was found to be modulated by horizontal advection and the presence of mesoscale eddies, with maximum temperature anomalies peaking when the core of an anticyclonic eddy passed through (Mawren et al., 2022a). This suggests that, as seen in other WBC regions (Bian et al., 2023), mesoscale eddies significantly influence the occurrence and intensity of MHWs in the SWIO (Mawren et al., 2022a). Nevertheless, the exact role that mesoscale eddies play in driving surface MHW characteristics and their subsurface extent remains unclear. This is of particular concern as the SWIO supports a variety of temperature-sensitive, pristine ecosystems with high biological diversity, high endemism and the presence of endangered species. Thus, disruption to the ecosystem can have significant socioeconomic impacts, as neighbouring East African countries rely heavily on these ecosystems for fish stocks and marine ecotourism (Obura, 2012; Pereira et al., 2014; Beal et al., 2020).
This study aims to build on the limited work that has previously explored MHW events and trends in the SWIO with a focus on their subsurface characteristics. In Sect. 2, the data sets and methodology are described. Section 3 investigates surface MHW characteristics, and – using temperature profiles from in situ expendable bathythermograph (XBT) observations – the subsurface extent of surface-identified MHWs is then explored. This provides the first description of subsurface characteristics of MHWs in the SWIO. Particular focus is also placed on understanding the role that mesoscale eddies play in both the surface and subsurface extent of MHWs. For this reason, the study area is confined to 22–32° S and 31–48° E, which encompasses the region of greatest ocean variability and mesoscale eddy activity south and southwest of Madagascar (Fig. 1). A discussion follows in Sect. 4, and conclusions are provided in Sect. 5.
2.1 Sea surface temperature and surface marine heat wave identification
Mesoscale-resolving (0.25°), gridded National Oceanic and Atmospheric Administration (NOAA) Optimum Interpolation Sea Surface Temperature (OISST) V2 data (Huang et al., 2020; NOAA Physical Sciences Laboratory, 2024) were used to explore SST conditions and identify surface MHWs in the SWIO region from 1 January 1993 to 31 December 2022. This time period matches the same time period of available XBT data used to investigate the subsurface extent of surface-identified MHWs. OISST data have been widely used to identify and characterise global and regional MHW events and trends globally (Reynolds et al., 2007; Banzon et al., 2016; Frölicher et al., 2018; Sen Gupta et al., 2020; Guo et al., 2022; Saranya et al., 2022) and in the SWIO (Mawren et al., 2022a; Mawren et al., 2022b).
MHWs were identified and quantified in the SWIO using the Hobday et al. (2016) definition, which defines a MHW as a discrete, anomalously warm water event, with temperatures that exceed the 90th percentile (the threshold) of the 30-year historical baseline period and have a duration of at least 5 consecutive days. This definition was implemented using the MHW detection code by Oliver (2015). For consistency with previous studies, a fixed climatological baseline, 1993–2022, and a 31 d smoothing window were used to identify surface MHWs (Smith et al., 2025). The properties of MHWs over the region were described by set metrics: mean duration (the time, in days, between the start and end of a MHW), mean frequency (the number of events that occurred during a year or season), mean intensity (the average temperature anomaly over the duration of the event) and the cumulative intensity (integrated temperature anomaly for the duration of the event). Seasonal MHW patterns were also investigated using the cumulative intensity metric, which provides a good description of the severity of MHW events (Mawren et al., 2022a). Detected MHW events over the entire climatological mean were grouped by austral season (summer – December, January and February; autumn – March, April and May; winter – June, July and August; and spring – September, October and November).
2.2 Subsurface temperature measurements from in situ data
The subsurface expression of surface MHWs (detected from OISST data) was investigated using XBT data from the near-repeat IX21 HR-XBT transect (Scripps High Resolution XBT project, https://www-hrx.ucsd.edu/ix15.html, last access: 3 May 2024). XBTs provide temperature profiles from 0 to 850 m depth. IX21 is nominally from Durban (29.9° S, 31.0° E), South Africa, to Port Louis (20.2° S, 57.5° E), Mauritius (Chandler et al., 2022); however, for this study, the portion of the IX21 transect from Durban to south of Madagascar was used.
The IX21 HR-XBT transect is nominally occupied four times a year and has a horizontal resolution of 6–10 km between XBT profiles within the boundary current and 20–30 km offshore (Goni et al., 2019; Chandler et al., 2022). The transect takes 3 d to complete and is, therefore, considered synoptic. Each transect is assigned the date of the first temperature profile acquired for the cruise. Temperature was objectively mapped to 10 m depth intervals from 0 to 800 m and 0.1° intervals in longitude (Chandler et al., 2022). Data were available from 8 September 1994 to 6 September 2022. As XBT data from the IX21 transect are collected nominally four times a year, there are not enough data to produce a high-resolution climatological baseline period, which is required to identify MHWs using the Hobday et al. (2016) definition. Instead, subsurface temperature anomalies calculated relative to the seasonal climatological means, calculated using the XBT data (Fig. 1b), from 1994 to 2022 were used as the measure of the subsurface extent of surface MHWs, which is an approach commonly employed when studying subsurface MHW signals using in situ data (Schaeffer and Roughan, 2017; Elzahaby and Schaeffer, 2019; Elzahaby et al., 2021; Perez et al., 2021). Each seasonal mean consisted of ∼ 15–20 XBT transects (Fig. 1b). To calculate temperature anomalies, the seasonal climatological means were subtracted from the daily temperature profiles for each day with data available.
2.3 Sea level anomaly data
To investigate the influence of mesoscale eddies on the properties of surface-identified MHWs, mesoscale-resolving (0.25°), optimally integrated, gridded, daily sea level anomalies (SLAs) and geostrophic currents over a 30-year period (1 January 1993–31 December 2022) were extracted from satellite altimeter data distributed by AVISO (Archiving, Validation, and Interpretation of Satellite Oceanographic data) (CMEMS, 2024). Satellite altimeter gridded SLAs are computed with respect to a 20-year [1993, 2012] mean. These data have previously been used to track eddies during MHWs in the SWIO by Mawren et al. (2022a). In the SWIO, where in situ observations are sparse, satellite altimetry provides useful information about mesoscale ocean variability and is the best way to identify the presence of mesoscale eddies (Halo et al., 2014). Positive (negative) SLAs associated with anticyclonic (cyclonic) geostrophic currents indicate the presence of warm-core (cold-core) eddies (Halo et al., 2014).
Mean eddy kinetic energy (EKE) for the entire time period was calculated using SLA and geostrophic velocity values and was used as a measure of eddy activity across the region. Mean EKE was calculated as follows:
where represents the mean-squared anomaly of the horizontal velocity component u from its spatial mean and represents the mean-squared anomaly of the vertical velocity component v from its spatial mean (Bai et al., 2024).
2.4 Investigation of subsurface anomaly signals associated with surface MHWs
For each day when subsurface data from the IX21 XBT transect were available and a MHW signal was detected at the corresponding location at the surface, the associated subsurface temperature anomaly, from the XBT data, was isolated and further investigated to determine the subsurface characteristics of surface-identified MHWs. Warm temperature anomalies extending below surface-identified MHWs were only considered subsurface if they extended below the mean climatological mixed-layer depth (MLD).
The climatological MLD was calculated using the temperature threshold method, similar to the approach by de Boyer Montégut et al. (2004) and Elzahaby and Schaeffer (2019). The MLD was determined as follows:
where T(z) represents temperature at depth z and T(10) is the reference temperature at 10 m depth. The threshold temperature (0.2 °C) and reference depth (10 m) were chosen based on the recommendations of de Boyer Montégut et al. (2004). The final climatological MLD was obtained by averaging MLD values across the study region, providing a robust estimate of 47.15 m.
Using the mean climatological MLD, three metrics for subsurface MHWs were identified: (1) the maximum depth extent (m) of the warm anomaly, (2) the maximum subsurface temperature anomaly (°C) and (3) the corresponding depth (m) of this maximum subsurface temperature anomaly.
The corresponding surface SLA for each anomaly profile was also recorded to further investigate the influence of mesoscale eddies on the characteristics of the subsurface anomaly. By correlating the SLA with the temperature anomaly profiles, the analysis aimed to uncover potential links between mesoscale ocean dynamics and the vertical extent, intensity and structure of subsurface temperature anomalies associated with surface MHWs. This dual focus on both subsurface and surface parameters provides a comprehensive framework for investigating the complex interactions driving the subsurface expression of marine heat waves.
3.1 Surface MHW variability
The SWIO is defined by distinct spatial patterns that characterise MHW-related variability (Fig. 2c–f), and these patterns are underpinned by pre-existing mean SST conditions and variability (Fig. 2). On the other hand, despite distinct seasonality in the mean SST and variability, MHWs do not exhibit strong seasonality, as the spatial pattern of the MHW cumulative intensity remains similar during each season (not shown). Due to the lack of observed MHW seasonality, the mean MHW trends and their relationship with SST variability and mesoscale eddies are further investigated.
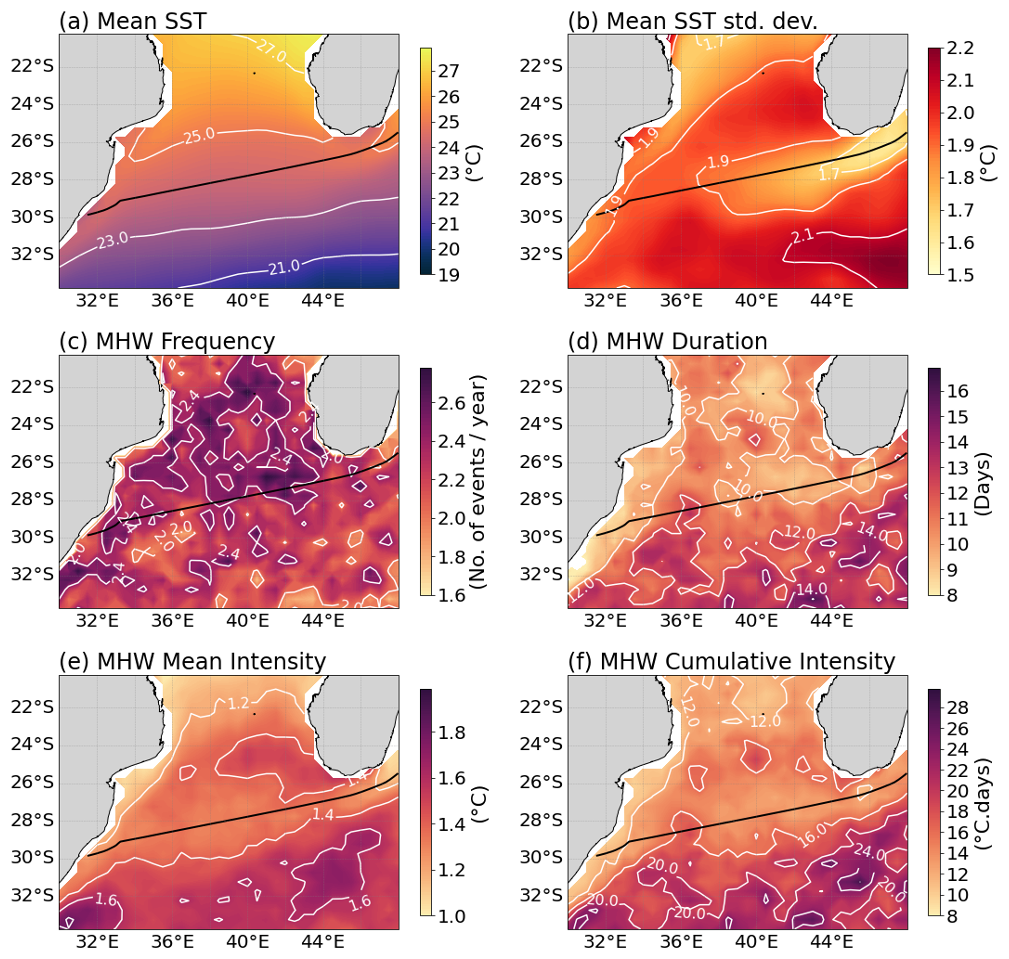
Figure 2Climatological mean (a) SST (°C) and (b) SST standard deviation (°C). Surface mean annual MHW (c) frequency, (d) duration (in days), (e) mean intensity (°C) and (f) cumulative intensity (in °C d) calculated from mesoscale-resolving (0.25°), gridded NOAA OISST V2 SST data for the climatological period from 1993 to 2023. The solid black line in all the figures denotes the IX21 XBT transect.
The SWIO experiences warm mean ocean temperatures, up to 28 °C, in the Mozambique Channel (21° S) that decrease southward, reaching a minimum of 19 °C at 33° S (Fig. 2a). The SST standard deviation shows that, on average, the majority of the region experiences SSTs that exceed the mean by between 1.5 and 2.2 °C (Fig. 2b). On average, surface MHWs occur one to three times per year, last 8–18 d and reach intensities of 1.0–2.0 °C, but they have varying spatial characteristics (Fig. 2b–f). These observed mean values of MHW frequency, duration, intensity and cumulative intensity are consistent with previous findings by Mawren et al. (2022a) in the SWIO and with global WBC studies by Oliver et al. (2018) and Holbrook et al. (2020). Within the southern MC, MHWs occur most frequently (between two and three times on average per year), but they are shorter-lived (8–12 d) and less intense (1.2–1.5 °C), whereas MHWs occur less frequently (between one and two times on average per year) in the southeast open-ocean region, but they are longer-lasting (12–18 d) and more intense (1.4–2.2 °C) (Fig. 2c, d). Similarly, as cumulative intensity is the integration of duration and intensity, MHWs are the most severe (16–19 °C d) in the southeast open ocean, whereas they are the least severe in the southern MC (8–16 °C d) (Fig. 2f).
The mean annual spatial distribution of MHW characteristics is closely linked to the underlying patterns in SST variability. Regions with higher SST variability are associated with more intense MHW intensity, as evidenced by a strong correlation (r= 0.75, p value > 0.05) (Fig. 3b). SST variance is highest off the west coast of Madagascar (1.5 °C) and in the southernmost open ocean (1.9–2.2 °C), but it is weakest along the west coast of Africa and in the region of SEMC leakage (Fig. 3b), confirming the spatial relationship between SST variance and MHW intensity (Figs. 2e, 3b). Weaker SST variance within the southern MC and along the west coast of Africa, compared to the southernmost open-ocean region, also closely resembles the patterns in the MHW duration and cumulative intensity, suggesting that longer-lasting (shorter) and more (less) severe MHWs are associated with higher (lower) SST variance (Fig. 2b, d, f). Unlike the MHW duration, intensity and cumulative intensity, the mean spatial distribution of the MHW frequency reflects an inverse pattern compared to SST variance, suggesting that where SST variance is high (low), MHWs occur less (more) often (Fig. 2b, c).
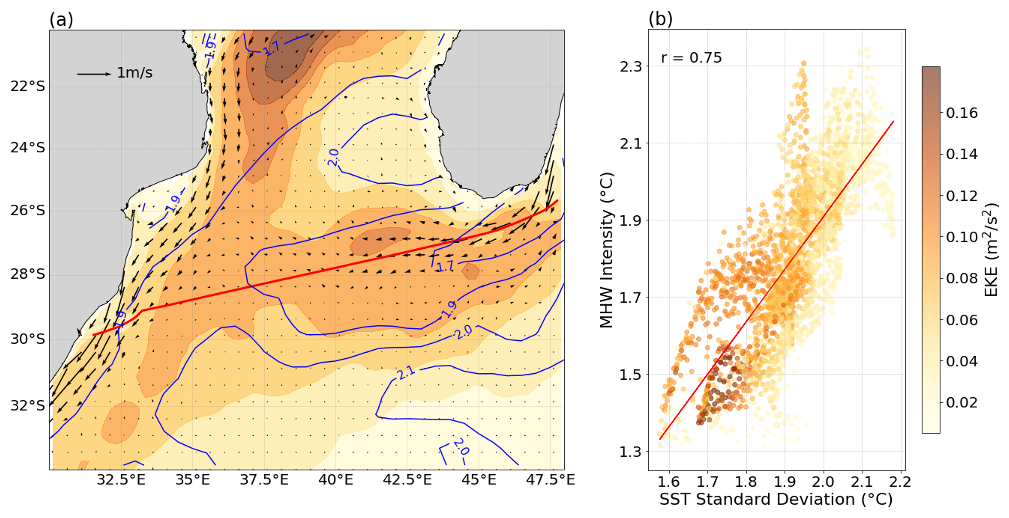
Figure 3(a) Mean eddy kinetic energy (EKE), with mean geostrophic velocities overlaid, calculated from mesoscale-resolving AVISO data for the climatological period from 1993 to 2023. The blue contour lines indicate SST standard deviation (°C) calculated from mesoscale-resolving (0.25°), gridded NOAA OISST V2 SST data for the same period from 1993 to 2023. The solid red line denotes the IX21 XBT transect. (b) Scatterplot of mean annual MHW intensity (°C) and SST standard deviation (°C). Colours indicate the EKE at these points. The regression line (red) between MHW intensity and SST standard deviation and the significant correlation coefficient are indicated.
To investigate the role that underlying oceanographic processes play in driving the observed mean surface MHW characteristics, we investigate the relationship between EKE, geostrophic velocities and SST variability (Fig. 3a). The westward-flowing SEMC leakage is visible, as is the train of eddies flowing southward through the MC and the fast, southward-flowing AC (Figs. 1a, 3a). The EKE is strongest on the western side of the MC and between the southern tip of Madagascar and the continent, where stronger poleward and southwesterly currents are present, respectively (Fig. 3b).
Furthermore, the significant correlation between SST variability and MHW intensity is closely linked to the EKE (Fig. 3b). Regions with a high EKE (0.08–0.16 m2 s−2) exhibit low SST variability and are characterised by frequent, short-lived and less intense MHWs. This suggests that a high EKE, driven by the mean surface flow, not only promotes the formation of MHWs but also accelerates their dissipation due to shorter residence times. Conversely, regions with a low EKE (0.0–0.08 m2 s−2) experience higher SST variability and support less frequent but more intense and longer-lasting MHWs. This implies that a reduced EKE allows for more stable thermal conditions, fostering the persistence of intense MHW events (Figs. 2b, c and 3). This observed relationship reinforces the role of local thermal fluctuations in driving extreme ocean warming.
3.2 Subsurface temperature anomaly properties associated with surface-identified MHWs
To examine the subsurface signal of MHWs, we identified when surface MHWs (detected from SST satellite data) were both co-located with and occurred simultaneously along the IX21 XBT line. MHWs of varying intensities and sizes were identified in the SST data on 65 d with corresponding XBT transects.
For each day and location where a MHW signal was detected over the XBT transect, all but two events exhibited warm temperature anomalies that extended from the surface down to the climatological MLD (47.15 m), with 68 % of them reaching down to 800 m. Furthermore, 80.25 % of the events experienced maximum temperature anomalies below the climatological MLD (47.15 m). Given that anomalies are considered subsurface if they extend below the MLD, these results suggest that the majority of surface-identified MHWs were associated with deep-reaching, subsurface-intensified warm anomalies.
A significant relationship was found between the surface temperature anomalies and the maximum subsurface temperature anomalies (r= 0.67, p value < 0.0001), as subsurface anomalies tend to increase with increasing surface anomalies (Fig. 4a). Furthermore, deeper MHW events, where the maximum depth extent of the warm anomaly is greater than 500 m, tend to have warmer subsurface maximum temperature anomalies than shallower events. On average, events that extend deeper in the water column have surface temperature anomalies of 1.17 °C and maximum subsurface anomalies of 2.27 °C. In contrast, shallower events, where the maximum depth extent of the warm anomaly is less than 500 m, have, on average, surface temperature anomalies of 1.18 °C and maximum subsurface temperature anomalies of 1.91 °C. This observed depth-dependent pattern suggests that the depth extent of the subsurface temperature anomalies may play a role in modulating subsurface thermal responses to surface anomalies. According to the distribution of surface and subsurface anomalies, there is a significant difference between the surface and subsurface anomalies (p value < 0.001) (Fig. 5b). Subsurface anomalies are, on average, 1.04 °C warmer than the anomalies at the surface and experience a larger range of warmer temperatures than that of surface anomalies (Fig. 4b). These differences in mean values and variability indicate that temperature anomalies associated with surface MHWs intensify below the surface.
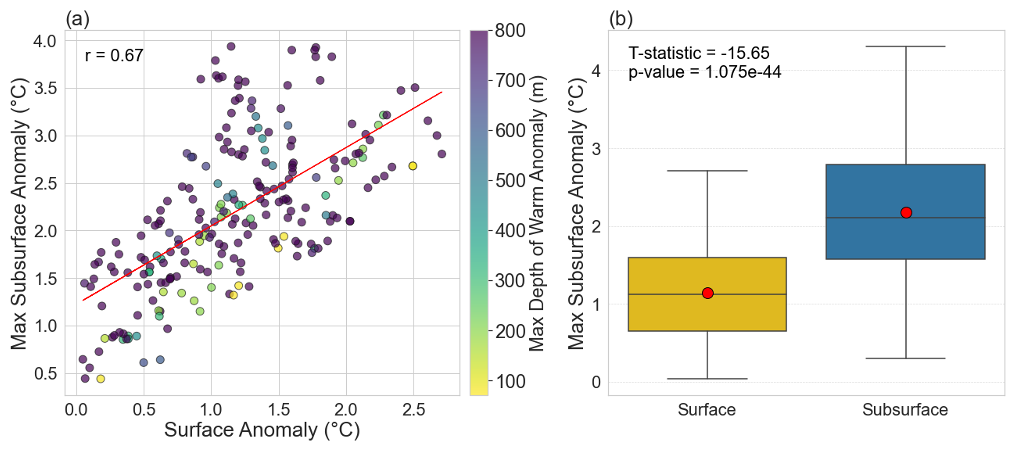
Figure 4(a) Scatterplot of surface anomalies and maximum subsurface anomalies at points where surface MHWs were identified. Colours indicate the maximum depth of the warm anomaly (m). The regression line (red) between surface and subsurface anomalies and the correlation coefficient are indicated. (b) Box plot comparing surface and subsurface anomalies. Red markers indicate mean values, while the central line shows the median. Boxes represent the interquartile range (IQR), with whiskers extending to 1.5 times the IQR. The t statistic and p value from a two-sample t test are displayed, highlighting the significance of the difference. Subsurface anomalies were only considered below the mean climatological MLD (47.15 m).
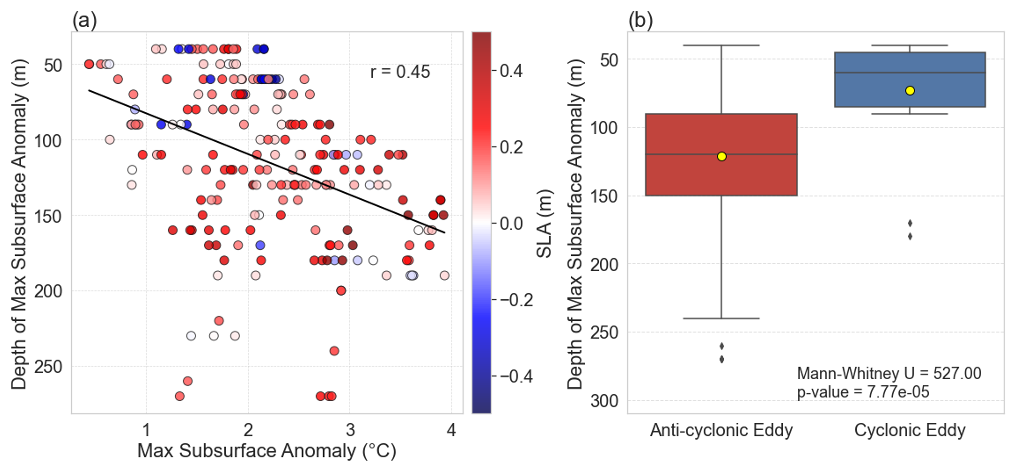
Figure 5(a) Scatterplot showing the relationship between maximum subsurface temperature anomalies (°C) and their corresponding depths (m), colour-coded by sea level anomaly (SLA) values (m). Positive SLA values (red) indicate anticyclonic eddies, whereas negative SLA values (blue) represent cyclonic eddies. (b) Box plot comparing the depths of maximum subsurface anomalies between anticyclonic and cyclonic eddies. Yellow markers indicate mean values, while the central line shows the median. Boxes represent the interquartile range (IQR), with whiskers extending to 1.5 times the IQR. The Mann–Whitney U and p value from a two-sample t test are displayed, highlighting the significance of the difference. Subsurface anomalies were only considered below the mean climatological MLD (47.15 m).
To further explore subsurface intensification of the temperature anomaly signals associated with MHWs, the relationship between maximum subsurface temperature anomalies (°C) and their corresponding depths (m) was evaluated in relation to sea level anomalies (SLAs) (Fig. 5). A positive, statistically significant relationship between maximum subsurface anomaly temperature was found, with a correlation of 0.45 (p value < 0.0001), showing that the warmest subsurface temperatures are typically associated with greater depths (Fig. 6a). This highlights a positive association between the magnitude of the subsurface temperature anomaly and the depth at which it occurs and points to an underlying physical or environmental mechanism linking these variables.
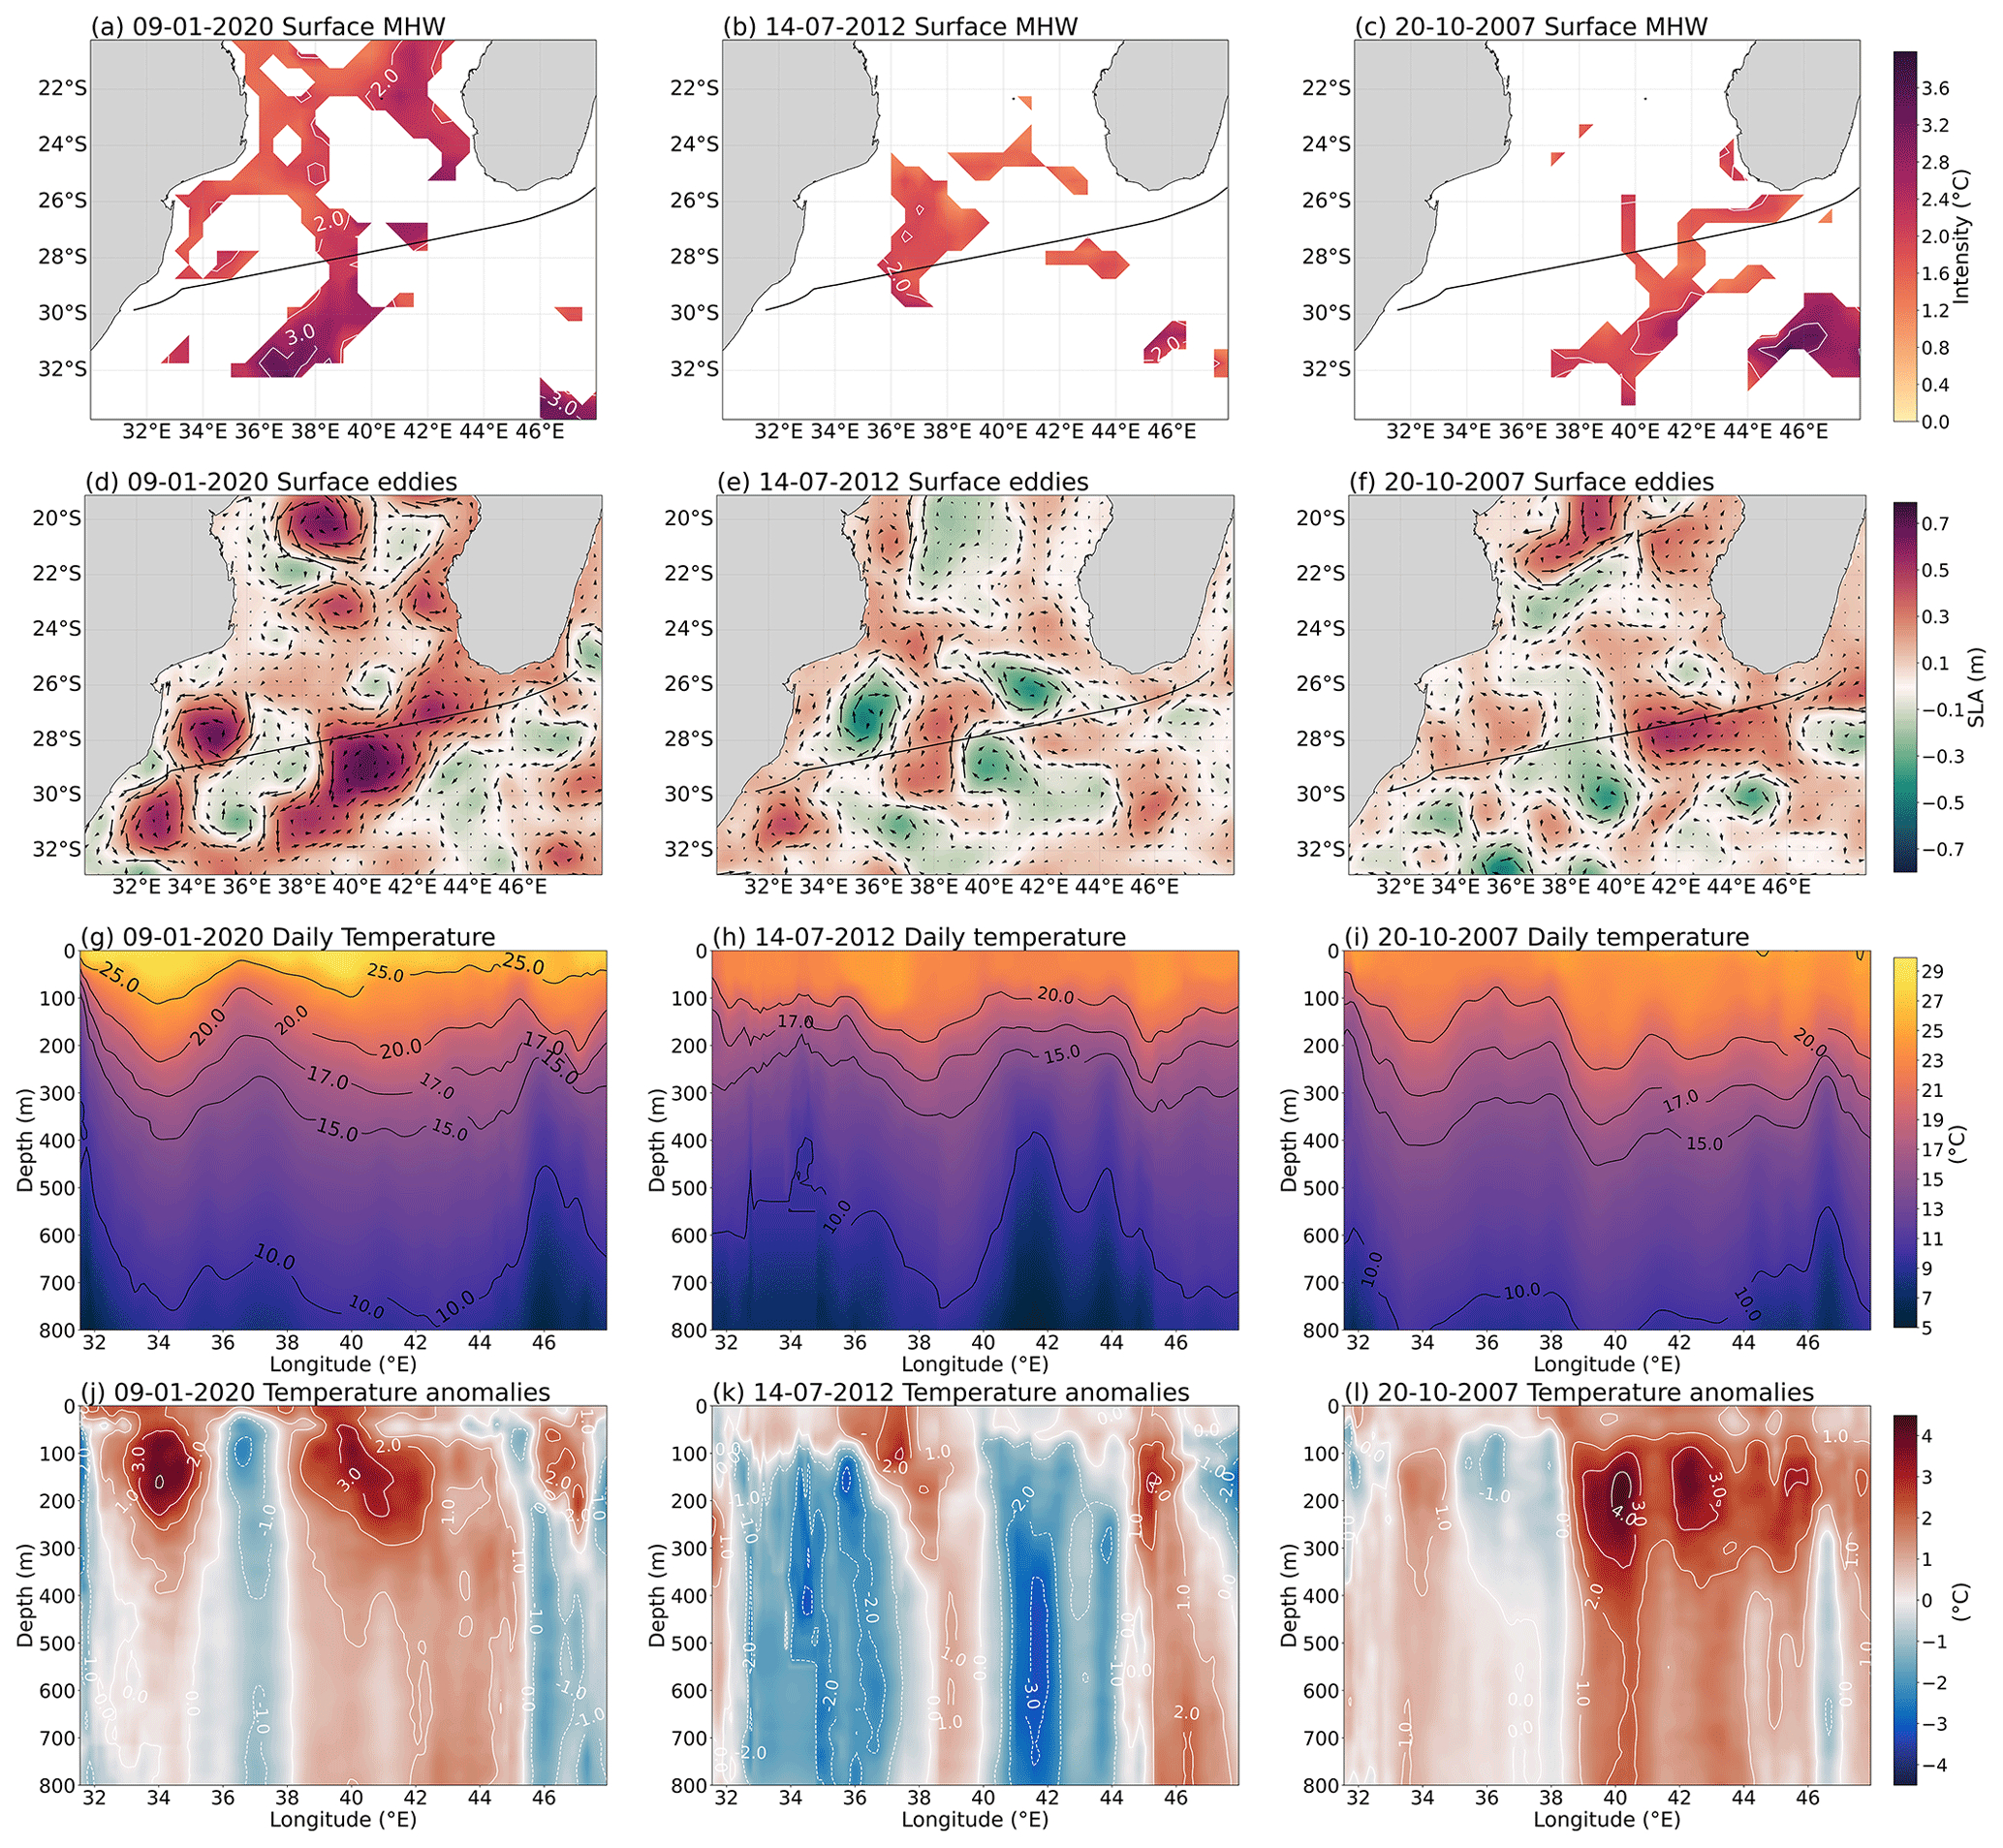
Figure 6Surface MHW intensity using NOAA OISST V2 data (°C) for (a) 9 January 2020, (b) 14 July 2012 and (c) 20 October 2007. Sea level anomalies (m) and geostrophic current velocities (m s−1) for the three MHW case study days of (d) 9 January 2020, (e) 13 July 2012 and (f) 20 October 2007 using optimally interpolated AVISO altimetry satellite data. The solid black line indicates the position of the XBT transect (IX21). Subsurface temperature (g–i) and temperature anomalies from (j–l) 9–13 January 2020 (g, j), 14–17 July 2012 (h, k) and 20–24 October 2007 (i, l). The subsurface profiles are from in situ XBT data from the IX21 transect line (see Sect. 2).
As the SWIO is an eddy-dominated region, the influence of mesoscale eddies on the depth of the maximum subsurface anomalies is investigated. The majority of the subsurface temperature anomaly profiles are associated with anticyclonic eddies, with 78.62 % of the profiles associated with positive SLAs (Fig. 5a). These subsurface maximum temperature anomalies occur at depths ranging from 0 to 270 m, whereas profiles associated with cyclonic eddies experience maximum temperature anomaly depths ranging from 0 to 60 m, with two outliers extending to depths of 170 and 180 m (Fig. 5b). Furthermore, the mean maximum subsurface anomaly associated with anticyclonic eddies (positive SLAs) is significantly deeper than the mean maximum subsurface anomaly depth associated with cyclonic eddies (p value < 0.0001), with mean depths of 100 and 51 m, respectively (Fig. 5b). This highlights the significant role of mesoscale eddies in shaping the vertical distribution of subsurface temperature anomalies in the SWIO, with anticyclonic eddies driving temperature anomalies to greater depths compared to the shallower depths associated with cyclonic eddies.
Case studies of MHW events in the SWIO and their subsurface manifestation
Given the statistically significant relationship between surface MHW signals and subsurface temperature anomalies, as well as the depth-dependent structure of these anomalies in relation to mesoscale eddies, three surface-identified MHW events (9 January 2020, 14 July 2012 and 20 October 2007) were selected as case studies. These events, which persisted over the IX-21 XBT transect, were analysed to further investigate their spatial and subsurface characteristics in the SWIO (Fig. 6).
For all three case studies, the spatial distribution of the MHWs are aligned with the spatial distribution of the warm-core, anticyclonic eddies, with maximum MHW intensities directly surrounding the cores of the largest anticyclonic eddies (Fig. 6a–d). For example, for the 9 January 2020 MHW case study, the maximum MHW intensities (2.5 °C) are identified surrounding the largest warm-core, anticyclonic eddies of 0.5 m a.s.l., at 27–32° S and 36–42° E (Fig. 6a, d). Likewise, on 14 July 2012 and 20 October 2007, the most intense surface MHW temperatures were recorded (2 °C and 1.5 °C, respectively) surrounding the largest sea level anomalies (0.4–0.5 m a.s.l.) (Fig. 6b, c, e, f).
Moreover, anomalously warm temperatures surrounding warm-core eddies are present with depth at the locations where MHWs persist over the XBT transect line (Fig. 6a–c, g–l). During the January 2020 MHW event, two distinct columns of anomalously warm temperatures (1–4 °C) extend from the surface to 800 m at 34 and 38–45° E (Fig. 6j). At 36–38° E, the location of the surface-identified July 2012 MHW, anomalously warm water (1–2 °C) extends from the surface to 800 m (Fig. 6h). Between 39 and 46° E, the October 2007 MHW has temperature anomalies (1–4 °C) that extend below the surface-identified MHW to 800 m (Fig. 6l).
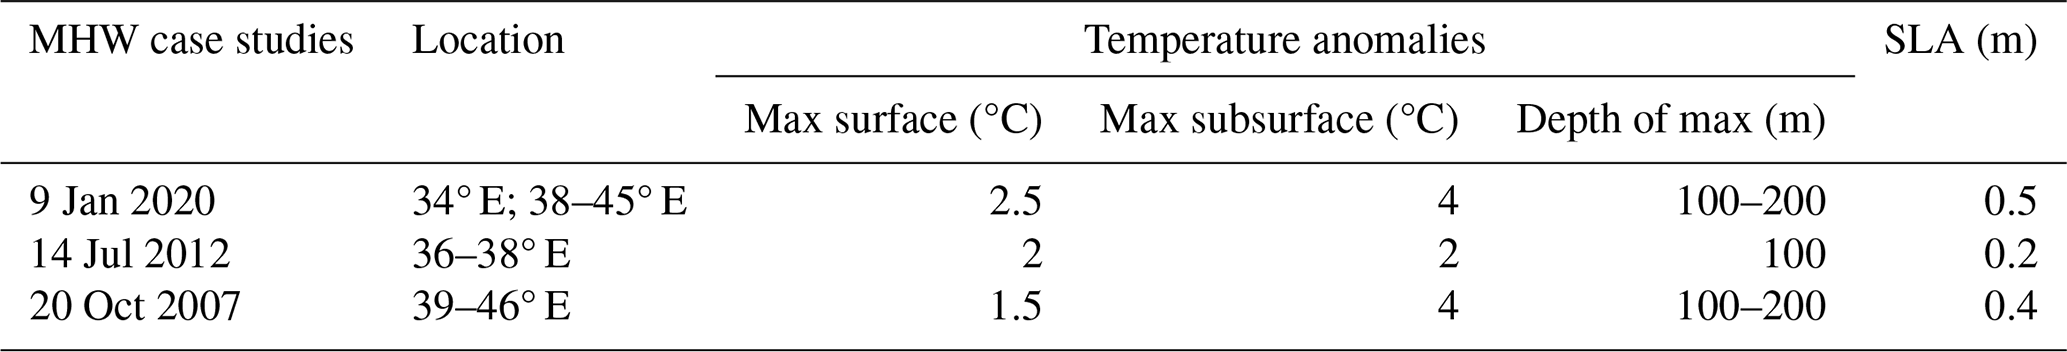
The subsurface temperature anomalies associated with surface-identified MHWs intensify below the surface (Fig. 6a, b, c, j, k, l and Table 1). During the January 2020 MHW case study, the subsurface temperature anomalies, relative to the surface MHW intensity (2.5 °C) at 34° E and between 38 and 45° E, are most extreme from 50 to 200 m, reaching up to 4 °C (Fig. 6a, j and Table 1). Similarly, subsurface temperature anomalies during the October 2007 MHW event reach maximum temperatures (4°C) above the seasonal mean below 100 m at 40, 42 and 45° E (Fig. 6l and Table 1). Although much weaker, at 38° E, the subsurface temperature anomaly that extends below the surface-identified July 2012 MHW has a maximum anomaly of 2 °C that extends from 0 to 150 m (Fig. 6k and Table 1). Given that the MLD does not exceed 100 m, on average, in this region (de Boyer Montégut et al., 2004), the most intense MHW temperatures are experienced below the mixed layer, not at the surface.
Table 1Surface and subsurface MHW characteristics for all three case studies: the location of the surface MHW over the XBT transect (Location); temperature anomalies (maximum surface intensity – “Max surface”; maximum temperature anomaly – “Max subsurface”; and the depth at which it occurs – “Depth of max”); and the SLA at the location of surface-identified MHWs (SLA), where positive values indicate the presence of a warm-core eddy.
However, weaker subsurface temperature anomalies are associated with warm-core eddies where there is no surface-identified MHW signal (Fig. 6a–l). At 46° E, during both the January 2020 and July 2012 MHW case studies, a weak subsurface temperature anomaly (1–2 °C) extends below the surface where no surface MHW was identified, but a warm-core, mesoscale eddy (SLAs of 0.2–0.4 m) is found (Fig. 6 a, b, j, k). Similarly, between 32 and 36° E during the October 2007 MHW, a weak column of anomalously warm water (1–2 °C) extends from 0 to 800 m and is associated with an eddy (SLA of 0.3 m) rather than a surface-identified MHW (Fig. 6c, f, l). Nonetheless, the most extreme subsurface temperature anomalies strongly reflect the vertical extent of the surface MHW, rather than a warm-core-eddy signature, as the anomalies associated with surface-identified MHWs and mesoscale eddies are larger than those associated with mesoscale eddies alone (Fig. 6a–c, g–l).
Overall, the three MHW case studies have different spatial distributions and intensities, but there are several commonalities between all three events (Fig. 6). All three case studies indicate that MHWs are associated with warm-core, anticyclonic eddies and subsurface temperature anomalies that extend down to at least 800 m and intensify below the surface (typically within the thermocline).
Our study reveals distinct spatial patterns in the surface and subsurface extent of MHW characteristics within the SWIO and emphasises the critical role of mesoscale eddies in shaping both surface and subsurface anomalies. The subsurface intensification of surface-identified MHW signals, which is modulated by mesoscale processes, highlights the importance of understanding the subsurface dynamics when assessing MHW impacts and underscores the importance of an integrated approach to studying MHW variability in this region.
On average, the ranges of the mean annual surface MHW metrics (frequency, intensity, duration and cumulative intensity) are considered typical of highly dynamic WBC systems and are classified as intense and abrupt events (Oliver et al., 2018; Holbrook et al., 2020; Marin et al., 2022). However, across the SWIO, MHW metrics exhibit distinct spatial distributions that are linked to the underlying patterns in SST variability and mesoscale eddy activity. These regional differences in MHW characteristics are likely driven by the local processes that drive SST variability and the variable circulation itself (Oliver et al., 2018).
In particular, areas of low SST variance are characterised by more frequent, less intense and shorter events, whereas areas of high SST variance have less frequent MHW events, but these events are more intense and last longer. The regions of low SST variance fall within the main passageway of the eddies through the MC and from the SEMC leakage into the AC source region (Schouten and De Ruijter, 2003; Quartly and Srokosz, 2004). Here, less intense but frequent MHWs are expected and found in our study, as these are typical characteristics of MHWs in WBCs, where the high abundance of rapidly propagating eddies is known to dictate the growth and decay of MHWs (Frölicher et al., 2018; Oliver et al., 2018; Oliver, 2019; Spillman et al., 2021; Fragkopoulou et al., 2023). As the IX21 XBT transect runs through the region of high eddy activity, our results capture the subsurface anomalies associated with MHW events that are influenced by mesoscale eddy activity and occur frequently but have reduced annual duration, intensity and cumulative intensity, compared to the rest of the region.
Moreover, mesoscale eddies play a critical role in shaping the depth of subsurface temperature anomalies associated with surface MHWs. Distinct columns of deep, anomalously warm temperatures were located below surface-identified MHWs. The majority of the subsurface anomalies associated with MHWs extend to depths down to 800 m, with maximum temperature anomalies occurring beneath the surface. Surface temperature anomalies are correlated with their associated maximum subsurface temperature anomalies as well as the depth of the subsurface anomalies, meaning that more intense MHWs experience deeper and warmer maximum subsurface anomalies. Specifically, anticyclonic, warm-core eddies are associated with much deeper maximum subsurface anomalies. This is observed during all three case studies, where the MHWs persist within anticyclonic eddies that vary in magnitude. The more intense 2007 and 2020 MHWs experience much stronger and deeper maximum subsurface temperature anomalies, associated with stronger anticyclonic eddies, compared to the 2012 MHW subsurface temperature anomaly, associated with a weaker anticyclonic eddy. This further demonstrates that, as is seen in other WBCs, anomalously warm anticyclonic eddies may act as a mechanism for MHW intensification below the surface (Schaeffer and Roughan, 2017; Elzahaby et al., 2021; Mawren et al., 2022a; Azarian et al., 2024; Elzahaby and Schaeffer, 2019; Perez et al., 2021; Amaya et al., 2023; Fragkopoulou et al., 2023). Furthermore, the intensification of warm-core eddies, under the current WBC warming trends, may subsequently amplify MHW events and intensify their subsurface signals in the future (Wu et al., 2012; Schaeffer and Roughan, 2017; Benthuysen et al., 2020). This growing influence of mesoscale eddies on subsurface MHWs, under ongoing global warming, may be driven by the faster response of the mixed layer compared to the slower response of the deep ocean, which affects the vertical distribution of heat and emphasises the value of considering vertical structures in future ocean warming studies (Zhang et al., 2023; Azarian et al., 2024; He et al., 2024).
As regions with high eddy abundance are likely to experience a large proportion of deep, subsurface-intensified MHWs, the exposure of vital coastal ecosystems to these events may be significantly underestimated when MHWs are studied using satellite data alone (Elzahaby and Schaeffer, 2019; Fragkopoulou et al., 2023). This underestimation is particularly concerning in the SWIO, where MHWs have previously been linked to severe coral bleaching events, such as the extreme bleaching of the Grand Récif de Toliara, one of the largest and most biodiverse barrier reef systems (Mawren et al., 2022a). In addition, the co-occurrence of MHWs and tropical cyclones in the SWIO exacerbates their impacts, as cyclones can intensify MHW events, leading to more severe thermal stress. These combined phenomena have had devastating consequences for coastal marine ecosystems, particularly off southeastern Africa, where frequent and intense MHWs have triggered severe coral bleaching (Mawren et al., 2022b). Damage to habitat-forming coral species initiates cascading effects on marine ecosystems, threatening biodiversity and fisheries that are essential to the livelihoods of coastal communities in Madagascar and surrounding regions (Obura, 2012; Pereira et al., 2014; Obura et al., 2021; Mawren et al., 2022b). This highlights the importance of examining subsurface MHW signals, as satellite-based analyses alone may overlook the full extent of the thermal stress and ecological consequences for mesopelagic fishes, including changes in prey availability for deep-diving predators (Iglesias et al., 2024).
However, it should be noted that, although mesoscale eddies do influence the subsurface characteristics of anomalies associated with MHWs, past heat budget studies of global MHWs have shown that abrupt and intense MHWs are likely driven by a combination of processes, such as local advection, eddy heat flux, air–sea heat flux and large-scale climate modes, which control heat variations over various spatiotemporal scales (Hayashida et al., 2020; Marin et al., 2022). The complexity of the SWIO therefore suggests that it is likely a combination of different oceanic and atmospheric processes that drive MHWs and warrant further investigation. Ultimately, this will enhance our understanding of subsurface biological impacts and inform management strategies aimed at preventing irreversible damage to ocean ecosystems.
To date, our study is the first to describe the subsurface extent of MHWs in the Greater Agulhas Current System, the WBC of the SWIO. Furthermore, the distinct spatial patterns in the surface and subsurface extent of MHW characteristics emphasise the critical influence of mesoscale eddies in shaping these thermal anomalies. The strong relationship between surface MHW signals and subsurface temperature anomalies highlights the importance of considering subsurface dynamics when assessing MHW impacts. By analysing case studies of persistent MHW events, we demonstrate how mesoscale processes modulate both the intensity and vertical structure of these anomalies, underscoring the need for an integrated approach to studying MHW variability in this region. This finding demonstrates that investigation of MHWs using only surface satellite data may significantly underestimate the severity and impacts of MHWs. The presence of anticyclonic, warm-core eddies influences both the surface distribution and subsurface signals of MHWs, in particular their depth extent.
Our results highlight the need for consistent and long-term subsurface data to better understand the progression, frequency and duration of MHWs below the surface. Investigating heat budgets and the drivers of MHWs will provide deeper insights into the mechanisms behind these events, enhancing the accuracy of forecasting models and improving management strategies to mitigate the impacts on marine ecosystems.
Future research should prioritise specific locations within the SWIO where MHWs are most extreme or frequent, focusing on areas with high marine biodiversity, such as coral reef systems. These targeted studies will be crucial for understanding local MHW characteristics and their effects on fisheries and coastal economies, ultimately contributing to more effective conservation and resource management efforts.
MHWs were detected using the marineHeatWaves Python package from https://github.com/ecjoliver/marineHeatWaves (Oliver, 2015).
All data used in this study are open access. The daily NOAA OISST V2 data are available at https://psl.noaa.gov/data/gridded/data.noaa.oisst.v2.highres.html (NOAA Physical Science Laboratory, 2024) and at https://doi.org/10.25921/RE9P-PT57 (Huang et al., 2020). The HR-XBT data are made available by the Scripps Institution of Oceanography HR-XBT programme (IX21 – http://www-hrx.ucsd.edu/ix15.html, Scripps Institution of Oceanography, 2024) The AVISO product is available from https://doi.org/10.48670/moi-00148 (EU Copernicus Marine Service Information, 2024).
CBW performed the analysis and led the writing of the manuscript at the University of Cape Town, South Africa. JCS, JS, TM, DM and NM supervised, proposed and guided the project, and contributed to the writing and analysis.
The contact author has declared that none of the authors has any competing interests.
Publisher’s note: Copernicus Publications remains neutral with regard to jurisdictional claims made in the text, published maps, institutional affiliations, or any other geographical representation in this paper. While Copernicus Publications makes every effort to include appropriate place names, the final responsibility lies with the authors.
This article is part of the special issue “Extremes in the marine environment: analysis of multi-temporal and multi-scale dynamics using observations, models, and machine learning techniques”. It is not associated with a conference.
The authors thank the reviewers for their constructive comments, which helped improve the quality of the manuscript. We are grateful to all collaborators and institutions involved in the collection, curation and maintenance of the observational datasets described in the “Data Availability” section. We also acknowledge the financial support provided by various national and international funding agencies.
The research leading to these results has received funding from the National Research Foundation (NRF), through grant no. PMDS230630125138; the South African Environmental Observation Network (SAEON); and the University of Cape Town. Janet Sprintall was supported by the NOAA Global Ocean Monitoring and Observing programme, through grant no. NA20OAR4320278. Neil Malan was supported by an Australian Research Council Future Fellowship (grant no. FT220100475).
This paper was edited by Meric Srokosz and reviewed by Fatma Jebri and one anonymous referee.
Amaya, D. J., Jacox, M. G., Alexander, M. A., Scott, J. D., Deser, C., Capotondi, A., and Phillips, A. S.: Bottom marine heatwaves along the continental shelves of North America, Nat. Commun., 14, 1038, https://doi.org/10.1038/s41467-023-36567-0, 2023.
Azarian, C., Bopp, L., Sallée, J.-B., Swart, S., Guinet, C., and d'Ovidio, F.: Marine heatwaves and global warming impacts on winter waters in the Southern Indian Ocean, J. Marine Syst., 243, 103962, https://doi.org/10.1016/j.jmarsys.2023.103962, 2024.
Bai, L., Zhu, G., Huang, H., Zhang, L., Lü, H., and Zhang, Y.: Characteristics of mesoscale eddies in the Mozambique Channel, PLOS ONE, 19, e0302367, https://doi.org/10.1371/journal.pone.0302367, 2024.
Banzon, V., Smith, T. M., Chin, T. M., Liu, C., and Hankins, W.: A long-term record of blended satellite and in situ sea-surface temperature for climate monitoring, modeling and environmental studies, Earth Syst. Sci. Data, 8, 165–176, https://doi.org/10.5194/essd-8-165-2016, 2016.
Beal, L. M., De Ruijter, W. P. M., Biastoch, A., Zahn, R., SCOR/WCRP/IAPSO Working Group 136, Cronin, M., Hermes, J., Lutjeharms, J., Quartly, G., Tozuka, T., Baker-Yeboah, S., Bornman, T., Cipollini, P., Dijkstra, H., Hall, I., Park, W., Peeters, F., Penven, P., Ridderinkhof, H., and Zinke, J.: On the role of the Agulhas system in ocean circulation and climate, Nature, 472, 429–436, https://doi.org/10.1038/nature09983, 2011.
Beal, L. M., Vialard, J., Roxy, M. K., Li, J., Andres, M., Annamalai, H., Feng, M., Han, W., Hood, R., Lee, T., Lengaigne, M., Lumpkin, R., Masumoto, Y., McPhaden, M. J., Ravichandran, M., Shinoda, T., Sloyan, B. M., Strutton, P. G., Subramanian, A. C., Tozuka, T., Ummenhofer, C. C., Unnikrishnan, A. S., Wiggert, J., Yu, L., Cheng, L., Desbruyères, D. G., and Parvathi, V.: A Road Map to IndOOS-2: Better Observations of the Rapidly Warming Indian Ocean, B. Am. Meteorol. Soc., 101, E1891–E1913, https://doi.org/10.1175/BAMS-D-19-0209.1, 2020.
Benthuysen, J. A., Oliver, E. C. J., Chen, K., and Wernberg, T.: Editorial: Advances in Understanding Marine Heatwaves and Their Impacts, Front. Mar. Sci., 7, 147, https://doi.org/10.3389/fmars.2020.00147, 2020.
Bian, C., Jing, Z., Wang, H., Wu, L., Chen, Z., Gan, B., and Yang, H.: Oceanic mesoscale eddies as crucial drivers of global marine heatwaves, Nat. Commun., 14, 2970, https://doi.org/10.1038/s41467-023-38811-z, 2023.
Chandler, M., Zilberman, N. V., and Sprintall, J.: Seasonal to Decadal Western Boundary Current Variability From Sustained Ocean Observations, Geophys. Res. Lett., 49, e2022GL097834, https://doi.org/10.1029/2022GL097834, 2022.
Collins, C., Reason, C. J. C., and Hermes, J. C.: Scatterometer and reanalysis wind products over the western tropical Indian Ocean, J. Geophys. Res.-Oceans, 117, 2011JC007531, https://doi.org/10.1029/2011JC007531, 2012.
de Boyer Montégut, C., Madec, G., Fischer, A. S., Lazar, A., and Iudicone, D.: Mixed layer depth over the global ocean: An examination of profile data and a profile-based climatology, J. Geophys. Res., 109, 2004JC002378, https://doi.org/10.1029/2004JC002378, 2004.
DiMarco, S. F., Chapman, P., and Nowlin, W. D.: Satellite observations of upwelling on the continental shelf south of Madagascar, Geophys. Res. Lett., 27, 3965–3968, https://doi.org/10.1029/2000GL012012, 2000.
Elzahaby, Y. and Schaeffer, A.: Observational Insight Into the Subsurface Anomalies of Marine Heatwaves, Front. Mar. Sci., 6, 745, https://doi.org/10.3389/fmars.2019.00745, 2019.
Elzahaby, Y., Schaeffer, A., Roughan, M., and Delaux, S.: Oceanic Circulation Drives the Deepest and Longest Marine Heatwaves in the East Australian Current System, Geophys. Res. Lett., 48, e2021GL094785, https://doi.org/10.1029/2021GL094785, 2021.
EU Copernicus Marine Service Information: Global Ocean Gridded L4 Sea Surface Heights and Derived Variables Reprocessed 1993–ongoing, Copernicus Marine Service [data set], https://doi.org/10.48670/moi-00148, 2024.
Fragkopoulou, E., Sen Gupta, A., Costello, M. J., Wernberg, T., Araújo, M. B., Serrão, E. A., De Clerck, O., and Assis, J.: Marine biodiversity exposed to prolonged and intense subsurface heatwaves, Nat. Clim. Change, 13, 1114–1121, https://doi.org/10.1038/s41558-023-01790-6, 2023.
Frölicher, T. L., Fischer, E. M., and Gruber, N.: Marine heatwaves under global warming, Nature, 560, 360–364, https://doi.org/10.1038/s41586-018-0383-9, 2018.
Garrabou, J., Gómez-Gras, D., Medrano, A., Cerrano, C., Ponti, M., Schlegel, R., Bensoussan, N., Turicchia, E., Sini, M., Gerovasileiou, V., Teixido, N., Mirasole, A., Tamburello, L., Cebrian, E., Rilov, G., Ledoux, J., Souissi, J. B., Khamassi, F., Ghanem, R., Benabdi, M., Grimes, S., Ocaña, O., Bazairi, H., Hereu, B., Linares, C., Kersting, D. K., La Rovira, G., Ortega, J., Casals, D., Pagès-Escolà, M., Margarit, N., Capdevila, P., Verdura, J., Ramos, A., Izquierdo, A., Barbera, C., Rubio-Portillo, E., Anton, I., López-Sendino, P., Díaz, D., Vázquez-Luis, M., Duarte, C., Marbà, N., Aspillaga, E., Espinosa, F., Grech, D., Guala, I., Azzurro, E., Farina, S., Cristina Gambi, M., Chimienti, G., Montefalcone, M., Azzola, A., Mantas, T. P., Fraschetti, S., Ceccherelli, G., Kipson, S., Bakran-Petricioli, T., Petricioli, D., Jimenez, C., Katsanevakis, S., Kizilkaya, I. T., Kizilkaya, Z., Sartoretto, S., Elodie, R., Ruitton, S., Comeau, S., Gattuso, J., and Harmelin, J.: Marine heatwaves drive recurrent mass mortalities in the Mediterranean Sea, Glob. Change Biol., 28, 5708–5725, https://doi.org/10.1111/gcb.16301, 2022.
Goni, G. J., Sprintall, J., Bringas, F., Cheng, L., Cirano, M., Dong, S., Domingues, R., Goes, M., Lopez, H., Morrow, R., Rivero, U., Rossby, T., Todd, R. E., Trinanes, J., Zilberman, N., Baringer, M., Boyer, T., Cowley, R., Domingues, C. M., Hutchinson, K., Kramp, M., Mata, M. M., Reseghetti, F., Sun, C., Bhaskar Tvs, U., and Volkov, D.: More Than 50 Years of Successful Continuous Temperature Section Measurements by the Global Expendable Bathythermograph Network, Its Integrability, Societal Benefits, and Future, Front. Mar. Sci., 6, 452, https://doi.org/10.3389/fmars.2019.00452, 2019.
Großelindemann, H., Ryan, S., Ummenhofer, C. C., Martin, T., and Biastoch, A.: Marine Heatwaves and Their Depth Structures on the Northeast U.S. Continental Shelf, Front. Clim., 4, 857937, https://doi.org/10.3389/fclim.2022.857937, 2022.
Guo, X., Gao, Y., Zhang, S., Wu, L., Chang, P., Cai, W., Zscheischler, J., Leung, L. R., Small, J., Danabasoglu, G., Thompson, L., and Gao, H.: Threat by marine heatwaves to adaptive large marine ecosystems in an eddy-resolving model, Nat. Clim. Change, 12, 179–186, https://doi.org/10.1038/s41558-021-01266-5, 2022.
Halo, I., Backeberg, B., Penven, P., Ansorge, I., Reason, C., and Ullgren, J. E.: Eddy properties in the Mozambique Channel: A comparison between observations and two numerical ocean circulation models, Deep-Sea Res. Pt. II, 100, 38–53, https://doi.org/10.1016/j.dsr2.2013.10.015, 2014.
Hayashida, H., Matear, R. J., Strutton, P. G., and Zhang, X.: Insights into projected changes in marine heatwaves from a high-resolution ocean circulation model, Nat. Commun., 11, 4352, https://doi.org/10.1038/s41467-020-18241-x, 2020.
He, Q., Zhan, W., Feng, M., Gong, Y., Cai, S., and Zhan, H.: Common occurrences of subsurface heatwaves and cold spells in ocean eddies, Nature, 634, 1111–1117, https://doi.org/10.1038/s41586-024-08051-2, 2024.
Hermes, J. C., Masumoto, Y., Beal, L. M., Roxy, M. K., Vialard, J., Andres, M., Annamalai, H., Behera, S., D'Adamo, N., Doi, T., Feng, M., Han, W., Hardman-Mountford, N., Hendon, H., Hood, R., Kido, S., Lee, C., Lee, T., Lengaigne, M., Li, J., Lumpkin, R., Navaneeth, K. N., Milligan, B., McPhaden, M. J., Ravichandran, M., Shinoda, T., Singh, A., Sloyan, B., Strutton, P. G., Subramanian, A. C., Thurston, S., Tozuka, T., Ummenhofer, C. C., Unnikrishnan, A. S., Venkatesan, R., Wang, D., Wiggert, J., Yu, L., and Yu, W.: A Sustained Ocean Observing System in the Indian Ocean for Climate Related Scientific Knowledge and Societal Needs, Front. Mar. Sci., 6, 355, https://doi.org/10.3389/fmars.2019.00355, 2019.
Hobday, A. J. and Pecl, G. T.: Identification of global marine hotspots: sentinels for change and vanguards for adaptation action, Rev. Fish Biol. Fisher., 24, 415–425, https://doi.org/10.1007/s11160-013-9326-6, 2014.
Hobday, A. J., Alexander, L. V., Perkins, S. E., Smale, D. A., Straub, S. C., Oliver, E. C. J., Benthuysen, J. A., Burrows, M. T., Donat, M. G., Feng, M., Holbrook, N. J., Moore, P. J., Scannell, H. A., Sen Gupta, A., and Wernberg, T.: A hierarchical approach to defining marine heatwaves, Prog. Oceanogr., 141, 227–238, https://doi.org/10.1016/j.pocean.2015.12.014, 2016.
Holbrook, N. J., Sen Gupta, A., Oliver, E. C. J., Hobday, A. J., Benthuysen, J. A., Scannell, H. A., Smale, D. A., and Wernberg, T.: Keeping pace with marine heatwaves, Nat. Rev. Earth Environ., 1, 482–493, https://doi.org/10.1038/s43017-020-0068-4, 2020.
Hu, S., Li, S., Zhang, Y., Guan, C., Du, Y., Feng, M., Ando, K., Wang, F., Schiller, A., and Hu, D.: Observed strong subsurface marine heatwaves in the tropical western Pacific Ocean, Environ. Res. Lett., 16, 104024, https://doi.org/10.1088/1748-9326/ac26f2, 2021.
Huang, B., Liu, C., Banzon, V. F., Freeman, E., Graham, G., Hankins, W., Smith, T. M., and Zhang, H.-M.: NOAA 0.25-degree Daily Optimum Interpolation Sea Surface Temperature (OISST), Version 2.1, NOAA National Centers for 8 Environmental Information [data set], https://doi.org/10.25921/RE9P-PT57, 2020.
Iglesias, I. S., Fiechter, J., Santora, J. A., and Field, J. C.: Vertical distribution of mesopelagic fishes deepens during marine heatwave in the California Current, ICES J. Mar. Sci., 81, 1837–1849, https://doi.org/10.1093/icesjms/fsae129, 2024.
Marin, M., Feng, M., Bindoff, N. L., and Phillips, H. E.: Local Drivers of Extreme Upper Ocean Marine Heatwaves Assessed Using a Global Ocean Circulation Model, Front. Clim., 4, 788390, https://doi.org/10.3389/fclim.2022.788390, 2022.
Mawren, D., Hermes, J., and Reason, C. J. C.: Marine heatwaves in the Mozambique Channel, Clim. Dynam., 58, 305–327, https://doi.org/10.1007/s00382-021-05909-3, 2022a.
Mawren, D., Hermes, J., and Reason, C. J. C.: Marine heat waves and tropical cyclones – Two devastating types of coastal hazard in South-eastern Africa, Estuar. Coast. Shelf S., 277, 108056, https://doi.org/10.1016/j.ecss.2022.108056, 2022b.
Mills, K., Pershing, A., Brown, C., Chen, Y., Chiang, F.-S., Holland, D., Lehuta, S., Nye, J., Sun, J., Thomas, A., and Wahle, R.: Fisheries Management in a Changing Climate: Lessons From the 2012 Ocean Heat Wave in the Northwest Atlantic, Oceanography, 26, 191–195, https://doi.org/10.5670/oceanog.2013.27, 2013.
NOAA Physical Sciences Laboratory: Daily NOAA Optimum Interpolation Sea Surface Temperature (OISST) V2 High Resolution Dataset, NOAA [data set], https://psl.noaa.gov/data/gridded/data.noaa.oisst.v2.highres.html, last access: 4 May 2024.
Obura, D.: The Diversity and Biogeography of Western Indian Ocean Reef-Building Corals, PLoS ONE, 7, e45013, https://doi.org/10.1371/journal.pone.0045013, 2012.
Obura, D., Gudka, M., Samoilys, M., Osuka, K., Mbugua, J., Keith, D. A., Porter, S., Roche, R., Van Hooidonk, R., Ahamada, S., Araman, A., Karisa, J., Komakoma, J., Madi, M., Ravinia, I., Razafindrainibe, H., Yahya, S., and Zivane, F.: Vulnerability to collapse of coral reef ecosystems in the Western Indian Ocean, Nat. Sustain., 5, 104–113, https://doi.org/10.1038/s41893-021-00817-0, 2021.
Oliver, E. C. J.: Mean warming not variability drives marine heatwave trends, Clim. Dynam., 53, 1653–1659, https://doi.org/10.1007/s00382-019-04707-2, 2019.
Oliver, E. C. J.: marineHeatWaves – detect marine heatwaves based on Hobday et al. (2016), GitHub [code], https://github.com/ecjoliver/marineHeatWaves (last access: 5 May 2024), 2015.
Oliver, E. C. J., Donat, M. G., Burrows, M. T., Moore, P. J., Smale, D. A., Alexander, L. V., Benthuysen, J. A., Feng, M., Sen Gupta, A., Hobday, A. J., Holbrook, N. J., Perkins-Kirkpatrick, S. E., Scannell, H. A., Straub, S. C., and Wernberg, T.: Longer and more frequent marine heatwaves over the past century, Nat. Commun., 9, 1324, https://doi.org/10.1038/s41467-018-03732-9, 2018.
Oliver, E. C. J., Benthuysen, J. A., Darmaraki, S., Donat, M. G., Hobday, A. J., Holbrook, N. J., Schlegel, R. W., and Sen Gupta, A.: Marine Heatwaves, Annu. Rev. Mar. Sci., 13, 313–342, https://doi.org/10.1146/annurev-marine-032720-095144, 2021.
Pereira, M., Litulo, C., Santos, R., Leal, M., Fernandes, R., Tibiriçá, Y., Williams, J., Atanassov, B., Carreira, F., Massingue, A., and Silva, I. M. D.: Mozambique Marine Ecosystems Review, final report submitted to Fondation Ensemble, Biodinâmica/CTV, Maputo, Mozambique, 139 pp., https://doi.org/10.13140/2.1.2092.5766, 2014.
Perez, E., Ryan, S., Andres, M., Gawarkiewicz, G., Ummenhofer, C. C., Bane, J., and Haines, S.: Understanding physical drivers of the 2015/16 marine heatwaves in the Northwest Atlantic, Sci. Rep., 11, 17623, https://doi.org/10.1038/s41598-021-97012-0, 2021.
Phillips, H. E., Tandon, A., Furue, R., Hood, R., Ummenhofer, C. C., Benthuysen, J. A., Menezes, V., Hu, S., Webber, B., Sanchez-Franks, A., Cherian, D., Shroyer, E., Feng, M., Wijesekera, H., Chatterjee, A., Yu, L., Hermes, J., Murtugudde, R., Tozuka, T., Su, D., Singh, A., Centurioni, L., Prakash, S., and Wiggert, J.: Progress in understanding of Indian Ocean circulation, variability, air–sea exchange, and impacts on biogeochemistry, Ocean Sci., 17, 1677–1751, https://doi.org/10.5194/os-17-1677-2021, 2021.
Quartly, G. D. and Srokosz, M. A.: Eddies in the southern Mozambique Channel, Deep-Sea Res. Pt. II, 51, 69–83, https://doi.org/10.1016/j.dsr2.2003.03.001, 2004.
Ramírez, F., Afán, I., Davis, L. S., and Chiaradia, A.: Climate impacts on global hot spots of marine biodiversity, Sci. Adv., 3, e1601198, https://doi.org/10.1126/sciadv.1601198, 2017.
Reynolds, R. W., Smith, T. M., Liu, C., Chelton, D. B., Casey, K. S., and Schlax, M. G.: Daily High-Resolution-Blended Analyses for Sea Surface Temperature, J. Climate, 20, 5473–5496, https://doi.org/10.1175/2007JCLI1824.1, 2007.
Roxy, M. K., Ritika, K., Terray, P., and Masson, S.: The Curious Case of Indian Ocean Warming, J. Climate, 27, 8501–8509, https://doi.org/10.1175/JCLI-D-14-00471.1, 2014.
Saranya, J. S., Roxy, M. K., Dasgupta, P., and Anand, A.: Genesis and Trends in Marine Heatwaves Over the Tropical Indian Ocean and Their Interaction With the Indian Summer Monsoon, J. Geophys. Res.-Oceans, 127, e2021JC017427, https://doi.org/10.1029/2021JC017427, 2022.
Scannell, H. A., Johnson, G. C., Thompson, L., Lyman, J. M., and Riser, S. C.: Subsurface Evolution and Persistence of Marine Heatwaves in the Northeast Pacific, Geophys. Res. Lett., 47, e2020GL090548, https://doi.org/10.1029/2020GL090548, 2020.
Schaeffer, A. and Roughan, M.: Subsurface intensification of marine heatwaves off southeastern Australia: The role of stratification and local winds, Geophys. Res. Lett., 44, 5025–5033, https://doi.org/10.1002/2017GL073714, 2017.
Schaeffer, A., Sen Gupta, A., and Roughan, M.: Seasonal stratification and complex local dynamics control the sub-surface structure of marine heatwaves in Eastern Australian coastal waters, Commun. Earth Environ., 4, 304, https://doi.org/10.1038/s43247-023-00966-4, 2023.
Schouten, M. W., De Ruijter, W. P. M., Van Leeuwen, P. J., and Ridderinkhof, H.: Eddies and variability in the Mozambique Channel, Deep-Sea Res. Pt. II, 50, 1987–2003, https://doi.org/10.1016/S0967-0645(03)00042-0, 2003.
Scripps Institution of Oceanography: High Resolution XBT Program – IX15 Transect, Scripps Institution of Oceanography [data set], https://www-hrx.ucsd.edu/ix15.html, last access: 3 June 2024.
Sen Gupta, A., Thomsen, M., Benthuysen, J. A., Hobday, A. J., Oliver, E., Alexander, L. V., Burrows, M. T., Donat, M. G., Feng, M., Holbrook, N. J., Perkins-Kirkpatrick, S., Moore, P. J., Rodrigues, R. R., Scannell, H. A., Taschetto, A. S., Ummenhofer, C. C., Wernberg, T., and Smale, D. A.: Drivers and impacts of the most extreme marine heatwave events, Sci. Rep., 10, 19359, https://doi.org/10.1038/s41598-020-75445-3, 2020.
Smith, K. E., Sen Gupta, A., Amaya, D., Benthuysen, J. A., Burrows, M. T., Capotondi, A., Filbee-Dexter, K., Frölicher, T. L., Hobday, A. J., Holbrook, N. J., Malan, N., Moore, P. J., Oliver, E. C. J., Richaud, B., Salcedo-Castro, J., Smale, D. A., Thomsen, M., and Wernberg, T.: Baseline matters: Challenges and implications of different marine heatwave baselines, Prog. Oceanogr., 231, 103404, https://doi.org/10.1016/j.pocean.2024.103404, 2025.
Spillman, C. M., Smith, G. A., Hobday, A. J., and Hartog, J. R.: Onset and Decline Rates of Marine Heatwaves: Global Trends, Seasonal Forecasts and Marine Management, Front. Clim., 3, 801217, https://doi.org/10.3389/fclim.2021.801217, 2021.
Swart, N. C., Lutjeharms, J. R. E., Ridderinkhof, H., and De Ruijter, W. P. M.: Observed characteristics of Mozambique Channel eddies, J. Geophys. Res.-Oceans, 115, 2009JC005875, https://doi.org/10.1029/2009JC005875, 2010.
Voldsund, A., Aguiar-González, B., Gammelsrød, T., Krakstad, J.-O., and Ullgren, J.: Observations of the East Madagascar Current system: Dynamics and volume transports, J. Mar. Res., 75, 531–555, https://elischolar.library.yale.edu/journal_of_marine_research/442 (last access: 6 June 2024), 2017.
Wu, L., Cai, W., Zhang, L., Nakamura, H., Timmermann, A., Joyce, T., McPhaden, M. J., Alexander, M., Qiu, B., Visbeck, M., Chang, P., and Giese, B.: Enhanced warming over the global subtropical western boundary currents, Nat. Clim. Change, 2, 161–166, https://doi.org/10.1038/nclimate1353, 2012.
Wyatt, A. S. J., Leichter, J. J., Washburn, L., Kui, L., Edmunds, P. J., and Burgess, S. C.: Hidden heatwaves and severe coral bleaching linked to mesoscale eddies and thermocline dynamics, Nat. Commun., 14, 25, https://doi.org/10.1038/s41467-022-35550-5, 2023.
Zhang, Y., Du, Y., Feng, M., and Hobday, A. J.: Vertical structures of marine heatwaves, Nat. Commun., 14, 6483, https://doi.org/10.1038/s41467-023-42219-0, 2023.