the Creative Commons Attribution 4.0 License.
the Creative Commons Attribution 4.0 License.
 | 29 Jul 2025
Ventilation of the Bay of Bengal oxygen minimum zone by the Southwest Monsoon Current
Benjamin G. M. Webber
Alejandra Sanchez-Franks
Bastien Y. Queste
Oxygen minimum zones (OMZs) occupy large areas of the tropical subsurface oceans and substantially alter regional biogeochemical cycles. In particular, the removal rate of bio-available nitrogen (denitrification) from the water column in OMZs is disproportionate to their size. The Bay of Bengal is one of the strongest OMZs in the global oceans; however, variable sources of oxygen prevent the onset of large-scale denitrification. The various oxygen-supply mechanisms that maintain oxygen concentrations in the OMZ above the denitrification threshold are currently unknown. Here, using a combination of multi-platform observations and model simulations, we identify an annual supply of oxygen to the Bay of Bengal in the high-salinity core of the Southwest Monsoon Current, a seasonal circulation feature that flows northward into the bay during the South Asian southwest monsoon (i.e. June–September). Oxygen concentrations within the Southwest Monsoon Current (80–100 µmol kg−1) are higher than those of waters native to the bay (i.e. <20 µmol kg−1). These high-oxygen waters spread throughout the central and western Bay of Bengal, leading to substantial spatio-temporal variability in observed oxygen concentrations. Moreover, the northward oxygen transport of the Southwest Monsoon Current is a spatially and temporally distinct event that stands out from background oxygen transport. Model results indicate that, interannually, oxygen supply to the bay varies with the strength of the Southwest Monsoon Current more closely than with its oxygen concentration. Consequently, we suggest that predictability of the annual oxygen flux is likely aided by understanding and predicting the physical forcing of the Southwest Monsoon Current. Our results demonstrate that the current, in particular its high-salinity and high-oxygen core, is a feature relevant to the processes and communities that drive denitrification within the Bay of Bengal that has heretofore not been considered.
- Article
(7630 KB) - Full-text XML
- BibTeX
- EndNote


Oxygen minimum zones (OMZs) are intermediate-depth (i.e. around 300–1000 m) regions of the ocean that contain very little dissolved oxygen – below 60 µmol kg−1 (Hofmann et al., 2011) – and in which macrofauna struggle to survive. The atypical chemical pathways of these regions play an important role in biogeochemical cycling, exerting an influence on the global cycles of nitrogen and carbon (Bange et al., 2005; Gruber, 2008) that is disproportionate to their size (Johnson et al., 2019). The solubility of oxygen in sea water decreases with temperature and, globally, the oxygen content of the oceans has declined over the last 6 decades (Kwiatkowski et al., 2020); however, predicting the fate of OMZs in a warming 21st-century ocean is not straightforward. While OMZs have generally expanded since the middle of the last century (e.g. Zhou et al., 2022), recent work has pointed to a varied future response to climate change across different regions of OMZs: the outermost layer, which is highest in oxygen, increases in volume even as the innermost, low-oxygen core decreases in volume (Busecke et al., 2022; Ditkovsky et al., 2023).
OMZs occur throughout the tropical ocean; in the Indian Ocean, prominent OMZs are found in the Arabian Sea and the Bay of Bengal (Fig. 1), semi-enclosed basins open only along their southern boundaries. Of these, the Bay of Bengal, in which oxygen concentrations are generally below 10 µmol kg−1 at depths between 100 and 500 m (D'Asaro et al., 2020), is thought to be intensifying and approaching a tipping point, beyond which the rate of denitrification might accelerate (Bristow et al., 2017). The bay is characterised by strong stratification, a consequence of high freshwater input from river runoff and monsoon precipitation. Because this haline stratification limits vertical oxygen fluxes (Rixen et al., 2020), lateral advection is a key component of the bay's oxygen budget (Johnson et al., 2019). Biogeochemical Argo (Bio-Argo) observations have strongly suggested a role for physical processes at the bay's open southern boundary: the sporadic injection of relatively oxygen-rich water is thought to provide sufficient oxygen to hinder denitrification and to generate a system that is highly variable in time and space (Johnson et al., 2019; D'Asaro et al., 2020; Sheehan et al., 2020). Previous work has emphasised the potential role of eddies in driving such an oxygen injection (Johnson et al., 2019; D'Asaro et al., 2020), although their impact is difficult to quantify, not least because they can contribute to both the supply and consumption of oxygen (Rixen et al., 2020). The role of the bay's basin-scale circulation, in particular the influence of its pronounced seasonal variability, on the OMZ has received less attention, despite the documented influence of basin-scale circulation in defining the intensity and outline of the neighbouring Arabian Sea OMZ (Lachkar et al., 2023; Font et al., 2024).
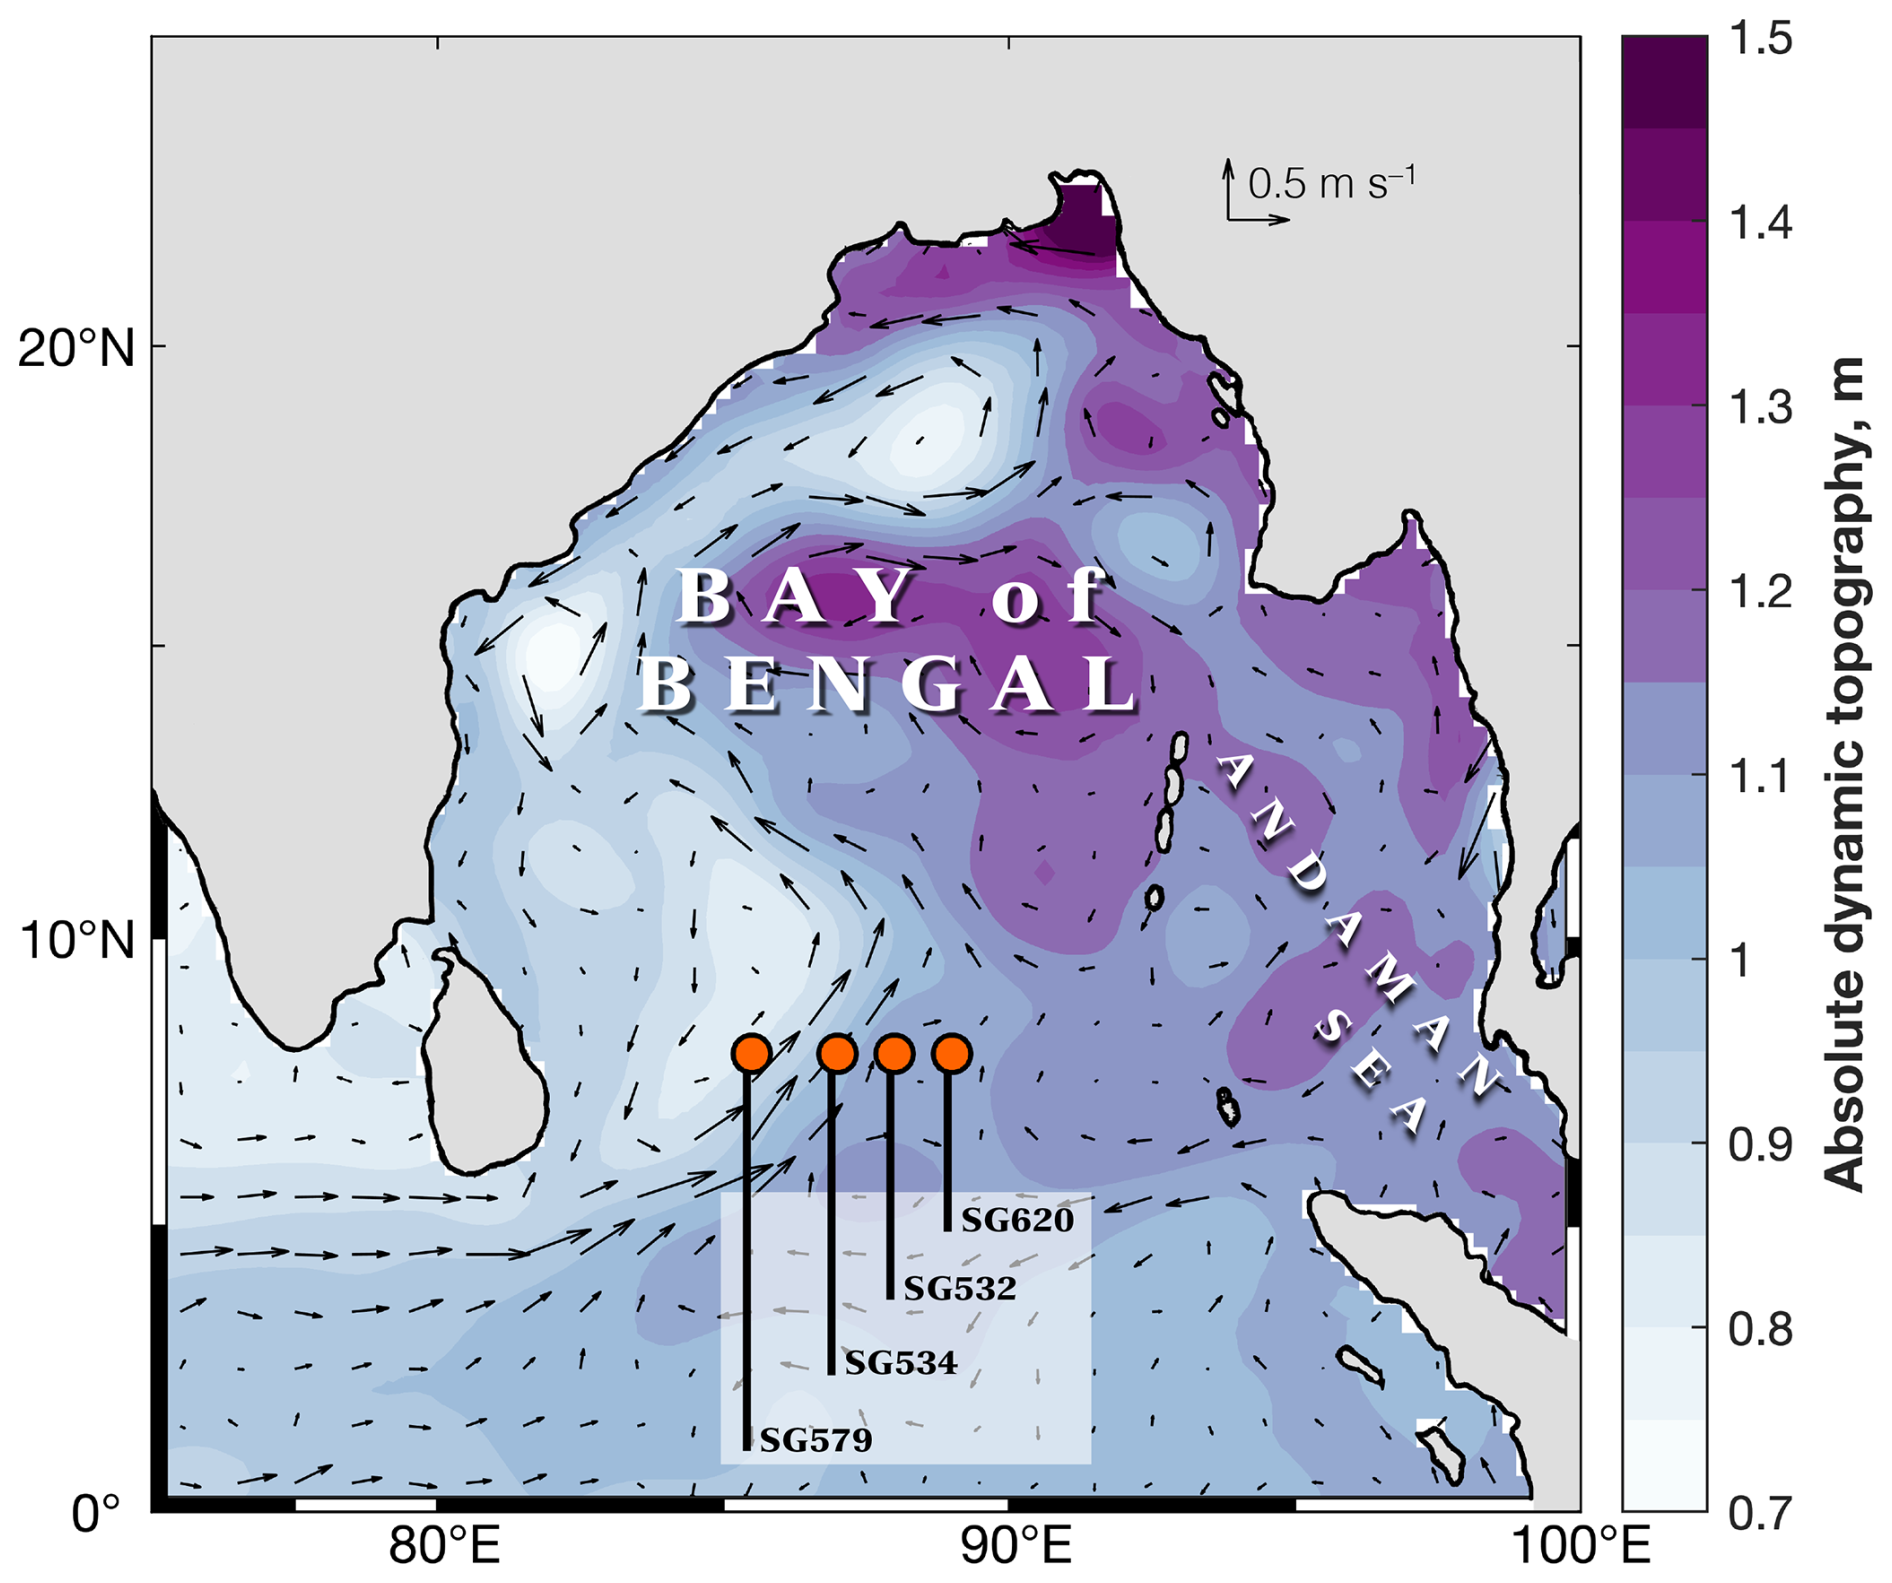
Figure 1Mean absolute dynamic topography (m; shading) and surface geostrophic velocity (m s−1; vectors) from satellite altimetry, averaged over July 2016. The locations of the ocean gliders used in this study are indicated by the orange circles.
The most prominent basin-scale features of the Bay of Bengal are its seasonally reversing monsoon currents. Between January and March, the Northeast Monsoon Current flows southward off the eastern coast of Sri Lanka; between June and September, the situation is reversed: the Southwest Monsoon Current (SMC) flows northward in the same region (Fig. 1; Vinayachandran et al., 1999; Webber et al., 2018). This latter current, forced initially by local wind stress at the ocean surface, entrains recently ventilated Arabian Sea High-Salinity Water (ASHSW) from the Indian Ocean's equatorial current systems (Sanchez-Franks et al., 2019). The horizontal pressure gradient between the ASHSW's core, which is denser than the low-salinity waters native to the Bay of Bengal, further strengthens the geostrophic flow of the SMC. Consequently, the high-salinity core of ASHSW is found on the eastern flank of the northward-flowing SMC, which reaches a peak where the horizontal salinity gradient is strongest (Webber et al., 2018).
The SMC has been found to advect trace amounts of oxygenated Persian Gulf Water into the Bay of Bengal's OMZ (Sheehan et al., 2020). However, besides the relatively minor oxygen contribution of Persian Gulf Water, the (1) oxygen transport of the relatively oxygen-rich ASHSW and (2) extent to which ASHSW penetrates into and circulates around the bay have only very recently received attention. Nayak et al. (2025) identified and quantified the oxygen content of the ASHSW advected into the Bay of Bengal by the SMC, and they also estimated the downward flux of oxygen into the upper OMZ driven by both turbulent mixing and salt fingering.
Here, we present ocean glider observations from across the SMC that further demonstrate the high oxygen content of the ASHSW – especially in comparison to the low oxygen content of the OMZ. In particular, we extend the results of Nayak et al. (2025) by placing the oxygen transport of the SMC into its annual and interannual contexts. Further, we analyse particle-tracking experiments conducted using an ocean reanalysis product to determine the spread of this high-salinity, high-oxygen water within the Bay of Bengal, as well as demonstrating the geographic origin of the bay's high- and low-salinity waters. Identifying transport and pathways of oxygenated inflows can help shed light on the processes limiting denitrification in the Bay of Bengal OMZ.
2.1 Observations
Hydrographic observations were collected using four ocean gliders (Eriksen et al., 2001) in the southwestern Bay of Bengal as part of the Bay of Bengal Boundary Layer Experiment (Vinayachandran et al., 2018; Webber et al., 2019). The gliders were deployed in early July 2016, east to west along 8° N, at 86, 87, 88 and 89° E. Deployed at 86° E, SG579 transited to 85.3° E after 7 d (38 dives), where it stayed for the remaining 12 d of the deployment (78 dives). Otherwise, the gliders were operated as “virtual moorings”; i.e. they remained at the same location for the entire deployment (between 10 and 17 d). The gliders remained an average of 7 km from the exact location of the virtual mooring, and they travelled an average of 2–3 km during a single dive; this is typical of gliders diving to 700 m, as was largely the case during this deployment. We consider each glider's observations as a time series, although a very small degree of spatial variability may be present in an individual glider's record.
The glider observations were processed to optimise the hydrodynamic model of the glider's flight path (Frajka-Williams et al., 2011) and to correct for thermal lag of the un-pumped conductivity cell (Garau et al., 2011). Oxygen sensors were calibrated using a sodium sulfite solution to find the zero-concentration end point; subsequently, we calibrated the glider-observed oxygen concentration against the Winkler-calibrated ship observations of Nayak et al. (2025). We linearly regressed glider oxygen concentrations against ship oxygen concentrations in temperature–salinity space to avoid variability induced by internal waves or oxygen gradients along isopycnals. This second step results in only a minor change in oxygen concentrations. Hydrographic observations were interpolated in time and potential density using Gaussian windows of 6 h and 0.25 kg m−3 respectively.
We supplemented our glider observations with data from the following sources:
-
the World Ocean Atlas observation-based climatology (Fig. 1a; Locarnini et al., 2024; Reagan et al., 2024; Garcia et al., 2024), which we interpolated onto isopycnals;
-
satellite altimetry observations of surface velocity, provided by the Copernicus Marine Data Service (product ID: SEALEVEL_GLO_PHY_L4_MY_008_047);
-
Bio-Argo float observations, to which salinity, oxygen and pressure corrections were applied, following Bittig et al. (2018). Oxygen observations were compared to World Ocean Atlas surface observations to correct for storage drift following Bittig et al. (2019). We identify spikes in the Argo observations associated with high-salinity, high-oxygen water on the 24 kg m−3 isopycnal using the criteria of absolute salinity > 35 g kg−1 and oxygen concentration > 30 µmol kg−1 corresponding to properties of the SMC. These criteria were selected to best match the spikes identified in the Argo float observations on this isopycnal.
2.2 The NEMO-MEDUSA biogeochemical model
We extend and contextualise our observations using output from NEMO-MEDUSA, a coupled physical–biogeochemical model. The physical simulation uses version 3.6 of the global-ocean NEMO (Nucleus for European Modelling of the Ocean) model (Madec, 2016) and is forced with reanalysed atmospheric data from the Drakkar Surface Forcing dataset (version 5.2; Brodeau et al., 2010). The physical model is coupled to the biogeochemical model MEDUSA-2 (Yool et al., 2013a). NEMO-MEDUSA has a 1/12° resolution in latitude and longitude as well as 75 vertical levels, the upper 35 of which (i.e. to 300 m) are within the depth range of the Southwest Monsoon Current; vertical resolution decreases with depth. The physical model is run from 1958 and is coupled to the biogeochemical model from 1990. Here, we use monthly mean output from 1998 to 2011 in order to exclude a period of spin-up of the biogeochemical model in the 8 years after coupling. Physical and biogeochemical output are available at a monthly resolution.
We calculate meridional oxygen transport, (mol s−1), in NEMO-MEDUSA across 8∘N between the 24 and 26 kg m−3 (potential density) isopycnals according to the following equation:
where [O2] is oxygen concentration (µmol kg−1) and v (m s−1) is meridional velocity, both averaged between the 24 and 26 kg m−3 isopycnals; Δx is the horizontal width of each model grid cell (m); Δz is the vertical distance between the 24 and 26 kg m−3 isopycnals (m); and ρ is density (kg m−3). The final two terms in Eq. (1) convert the oxygen concentration from micromoles per kilogram to moles per cubic metre. The 24–26 kg m−3 density range covers the SMC and its high-salinity core; by using the 24 kg m−3 isopycnal as the upper limit, we exclude the mixed layer and, thus, waters with an oxygen concentration that is in equilibrium with the atmosphere.
To investigate interannual variability, we need an average value of for each year's southwest monsoon. We integrate over the width of the Bay of Bengal in two ways: first, we include all grid points across the bay; second, to better approximate the oxygen transport of the northward-flowing SMC, we include only those grid points with a northward meridional velocity. We then average the integrated oxygen transport over the 4 months of the southwest monsoon to derive a mean value for each year. Similarly, we calculate the average northward volume transport across 8° N, integrating between the 24 and 26 kg m−3 isopycnals and across the width of the bay, before averaging over the 4 months of the southwest monsoon. Finally, we calculate the mean oxygen concentration across the bay, including only model grid cells with a northward velocity, and average over the 4 months of the southwest monsoon.
2.2.1 Model validation
The NEMO-MEDUSA coupled model employed here has been used extensively globally (e.g. Yool et al., 2013a, b; Popova et al., 2016), including in the Indian Ocean (e.g. Jacobs et al., 2020; Jebri et al., 2020; Asdar et al., 2022). The SMC is present as a northward flow in the southwestern Bay of Bengal, albeit some 2–3° further west than its position during the period of the observations presented here (Figs. 1 and 2b); this same westward offset in the model is also apparent when compared with the glider observations (Fig. 3).
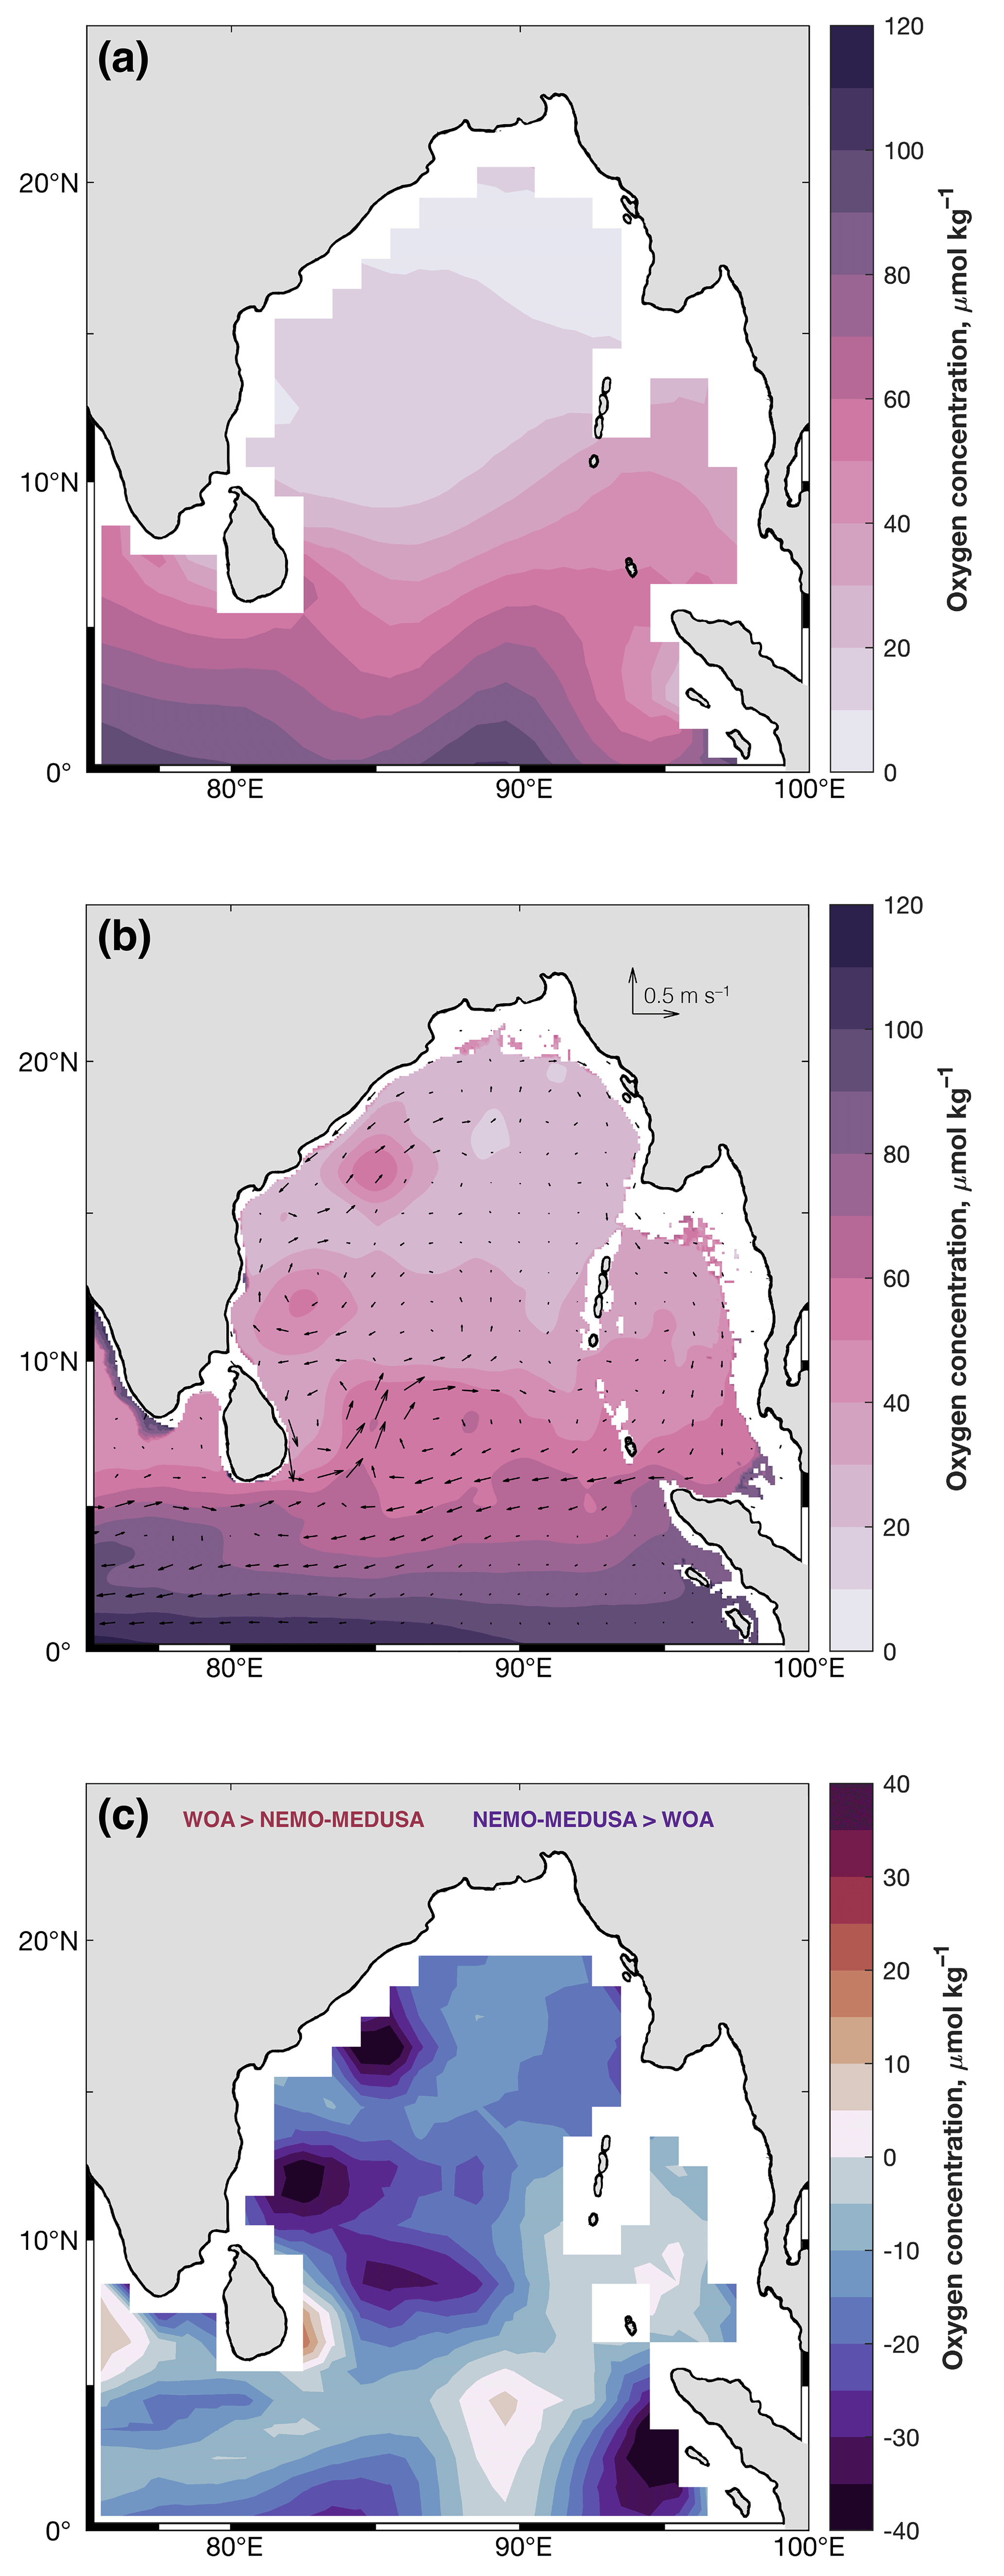
Figure 2(a) Mean July oxygen concentration (µmol kg−1; shading) between the 24 and 26 kg m−3 isopycnals from the World Ocean Atlas. (b) Mean July oxygen concentration (µmol kg−1; shading) and velocity (m s−1; vectors), similarly between the 24 and 26 kg m−3 isopycnal, from NEMO-MEDUSA. (c) The difference (µmol kg−1) between the mean July oxygen concentrations in the World Ocean Atlas and NEMO-MEDUSA (the former minus the latter).
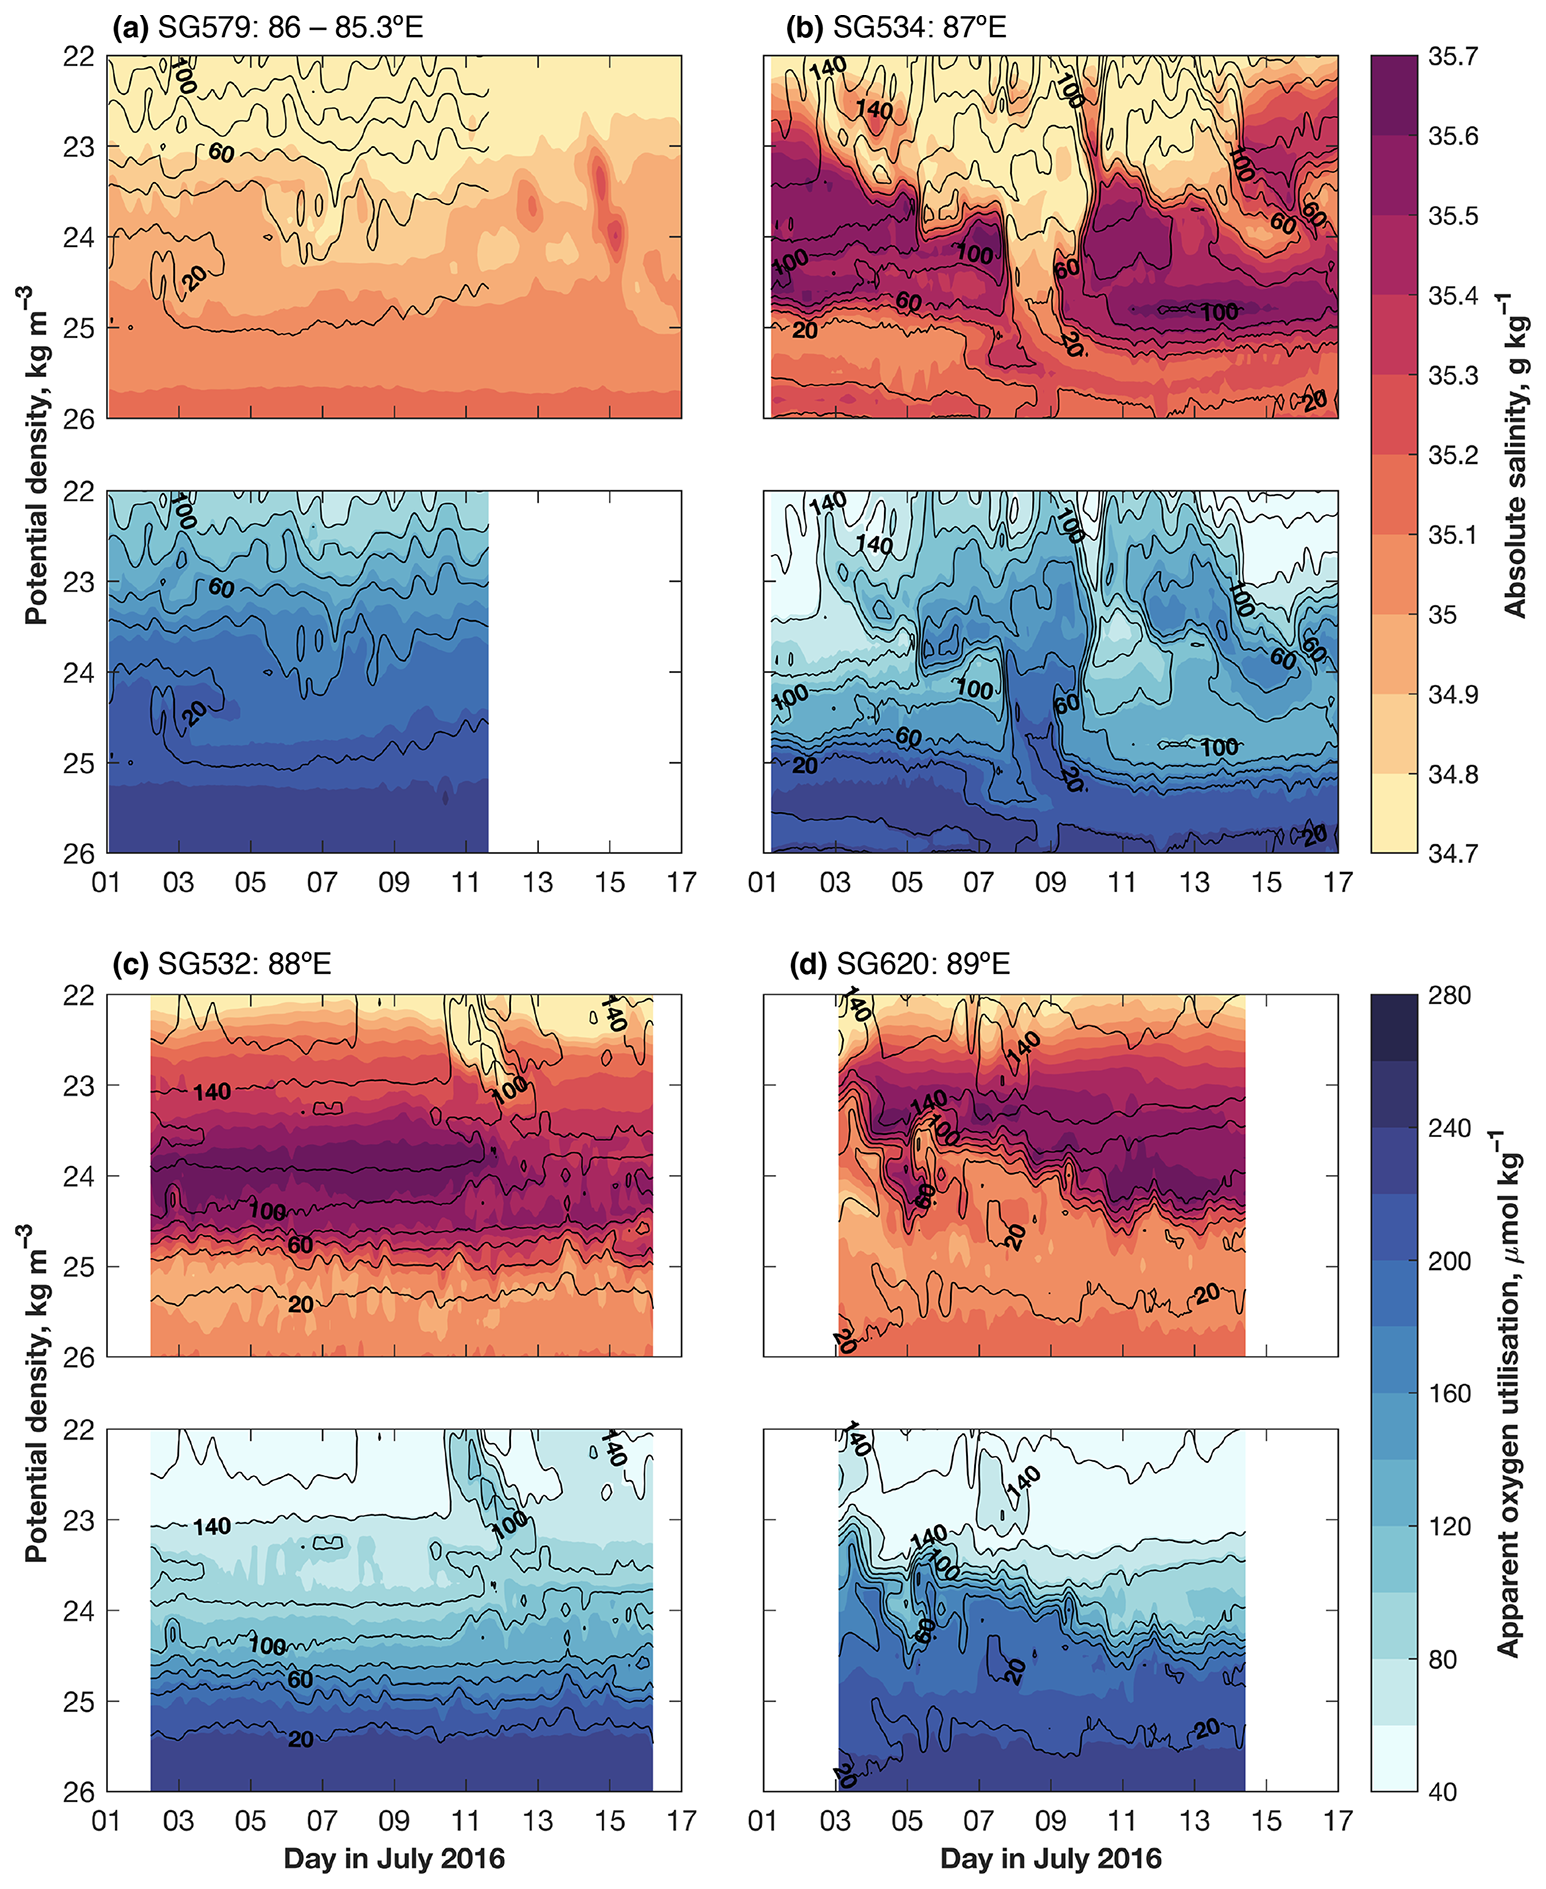
Figure 3Time series of glider observations from (a) SG579, (b) SG534, (c) SG532 and (d) SG620. In each pair of panels, orange-coloured shading in the upper panel represents absolute salinity (g kg−1), whereas blue-coloured shading in the lower panel represents apparent oxygen utilisation (µmol kg−1); in all panels, contours represent oxygen concentration (µmol kg−1). Time series are plotted against potential density (kg m−3). The location of each glider is shown in Fig. 1. Note that the oxygen sensor on SG579 malfunctioned on 11 July.
The basin-scale distribution of oxygen is reasonably well reproduced: oxygen concentrations are highest between the Equator and approximately 5° N, whereas they are lower within the bay proper (Fig. 2a). Immediately north of the Equator, modelled oxygen concentrations of approximately 120 µmol kg−1 compare favourably to the World Ocean Atlas observational climatology (Fig. 2). However, the model does not manage to fully reproduce the intensity of the OMZ, at least in an average July: north of approximately 10°, climatological observed oxygen concentrations are in the region of 20 µmol kg−1 everywhere (Fig. 2a), while modelled oxygen concentrations are between 20 and 80 µmol kg−1 higher than this (Fig. 2b and c). The larger differences are associated with roughly circular regions of elevated oxygen concentration found in the western Bay of Bengal in the model. The glider observations, in which we find ambient oxygen concentrations below 20 µmol kg−1 (Fig. 3), similarly suggest that oxygen concentrations in the Bay of Bengal as simulated by NEMO-MEDUSA are too high. OMZ concentrations in the model representation suffer from the inadequate representation of biogeochemical cycling and the representation of sub-mesoscale or ageostrophic processes (Armstrong McKay et al., 2021; Lévy et al., 2024); however, our analysis focuses on the physical representation of the SMC, rather than the biogeochemical properties in the model, similar to other such studies of the Indian Ocean (Queste et al., 2018).
2.3 Particle-tracking experiments
We conduct particle-tracking experiments using the GLORYS12 ocean physics reanalysis (Lellouche et al., 2021, product ID: GLOBAL_MULTIYEAR_PHY_001_030), covering the 26-year period between 1994 and 2019 (inclusive). This NEMO-based reanalysis product has the same horizontal and vertical resolutions as the NEMO-MEDUSA simulation described above and is available at daily resolution. It has been shown to compare particularly well to physical observations in the Indian Ocean (Webber et al., 2018; Sheehan et al., 2020) and has been used previously in particle-tracking experiments in the region by Sanchez-Franks et al. (2019) and Sheehan et al. (2020), whose methods we repeat here. Salinity and velocity fields from the reanalysis are interpolated onto the 24 kg m−3 isopycnal – i.e. the core density of ASHSW previously used when tracing this water mass (Sanchez-Franks et al., 2019) – on which the particle-tracking experiments are then conducted. Reanalysis velocities are bi-linearly interpolated onto the particle locations, and the particles are advected forward or backward as desired using a fourth-order Runge–Kutta scheme with a time step of 24 h. This method determines advective transport along an isopycnal and does not account for isopycnal or diapycnal diffusivity; however, we note that the results presented below are qualitatively very similar to those from versions of the same experiments conducted on the 24.5 and 25 kg m−3 isopycnals.
First, we conduct forward-trajectory particle-tracking experiments to determine the distribution of the SMC's high-salinity core within the Bay of Bengal. Particles are initialised daily between 1 June and 30 September (inclusive), with those being the months during which the SMC is present (Webber et al., 2018), and only where salinity is greater than 35.1 PSU (practical salinity units). (Note that the GLORYS12 reanalysis outputs practical salinity.) Given this salinity constraint, the number of particles released each day is not constant. Particles are initialised every 0.1° longitude across 8° N, between the eastern coast of Sri Lanka and 88° E. Particles that travel south of 6° N are removed.
Second, to determine the origin of the oxygen-rich waters, we conduct backward-trajectory particle-tracking experiments in which particles are initialised at 5 d intervals, backward from 31 December 2020 to 1 January 1994, on a 0.2° grid between 82 and 92° E and between 10 and 15° N. In separate experiments, particles are initialised at grid points with (1) salinity greater than 35.1 PSU and (2) salinity less than 34.8 PSU. Individual particles are tracked backward for up to 1 year.
3.1 Observations of the Southwest Monsoon Current
Between 85.3 and 86° E (SG579), on the western edge of the SMC, there is no evidence of the high-salinity core (Fig. 3a), in line with previous observations and the dynamics of the SMC (Webber et al., 2018). From 22 to 26 kg m−3, salinity increases from 34.7 to 35.1 g kg−1. The situation is markedly different further east: all three remaining gliders capture the high-salinity core of the SMC. The gradual and steady increase in salinity with depth in ambient waters – i.e. as observed by SG579 – is interrupted by a pronounced increase in salinity centred on the 24 kg m−3 isopycnal (Fig. 3b–d). Peak salinity values within the high-salinity core are in excess of 35.6 g kg−1. Below the core, salinity decreases sharply such that, at the 26 kg m−3 isopycnal, salinity values are similar to those observed in the west where the core is absent (Fig. 3).
The distribution of oxygen is also markedly different in the presence of the high-salinity core. In the west, outside of the core, oxygen decreases with depth from 100 µmol kg−1 to below 20 µmol kg−1 (Fig. 3a). Within the core, oxygen levels are elevated and increase with increasing salinity: the highest salinities are associated with oxygen concentrations between 60 and 100 µmol kg−1 (Fig. 3b–d). We note that these oxygen concentrations are an order of magnitude greater than background concentrations within the Bay of Bengal OMZ (D'Asaro et al., 2020). At the base of the high-salinity core, contours of oxygen follow contours of salinity particularly closely (Fig. 3b–d). Further, the temporal discontinuity in the high-salinity core observed at 87° E (SG534) makes the close relationship between salinity and oxygen within the core particularly clear: when the core is absent, the distributions of oxygen and salinity resemble those observed in the west between 85.3 and 86° E (Fig. 3a and b).
Apparent oxygen utilisation (AOU; i.e. the difference between concentration at saturation and the observed oxygen concentration) further demonstrates the difference between background water masses and the high-salinity core (Fig. 3). As oxygen is less soluble in the warm, salty waters of the high-salinity core, the difference in oxygen concentration is less apparent than with AOU, which reveals the actual deficit in oxygen in these water masses. This AOU gradient is evidence of the general lack of ventilation and high respiration that occurs in the sub-surface waters of the OMZ; the substantially lower AOU in the high-salinity core suggests more recent subduction of this water mass.
3.2 Oxygen transport of the Southwest Monsoon Current
We use the NEMO-MEDUSA physical–biogeochemical model to investigate the seasonal and longitudinal variability in oxygen transport into the Bay of Bengal. Meridional oxygen transport at 8∘N in the bay is generally low (between −2 and 2×10³ mol s−1), save for (1) a narrow, near-year-round strip of pronounced southward transport in the far west (82° E) and (2) a region of pronounced northward transport to the immediate east of this during the 4 months of the southwest monsoon (83 to 87°; Fig. 4a). This latter feature is clearly associated with the SMC: both its longitudinal and temporal extent match the northward velocities associated with the SMC, being enclosed within the 0.1 m s−1 velocity contour (Fig. 4a). Furthermore, the gradual westward movement of the SMC's core over the duration of the southwest monsoon matches observations (Webber et al., 2018).
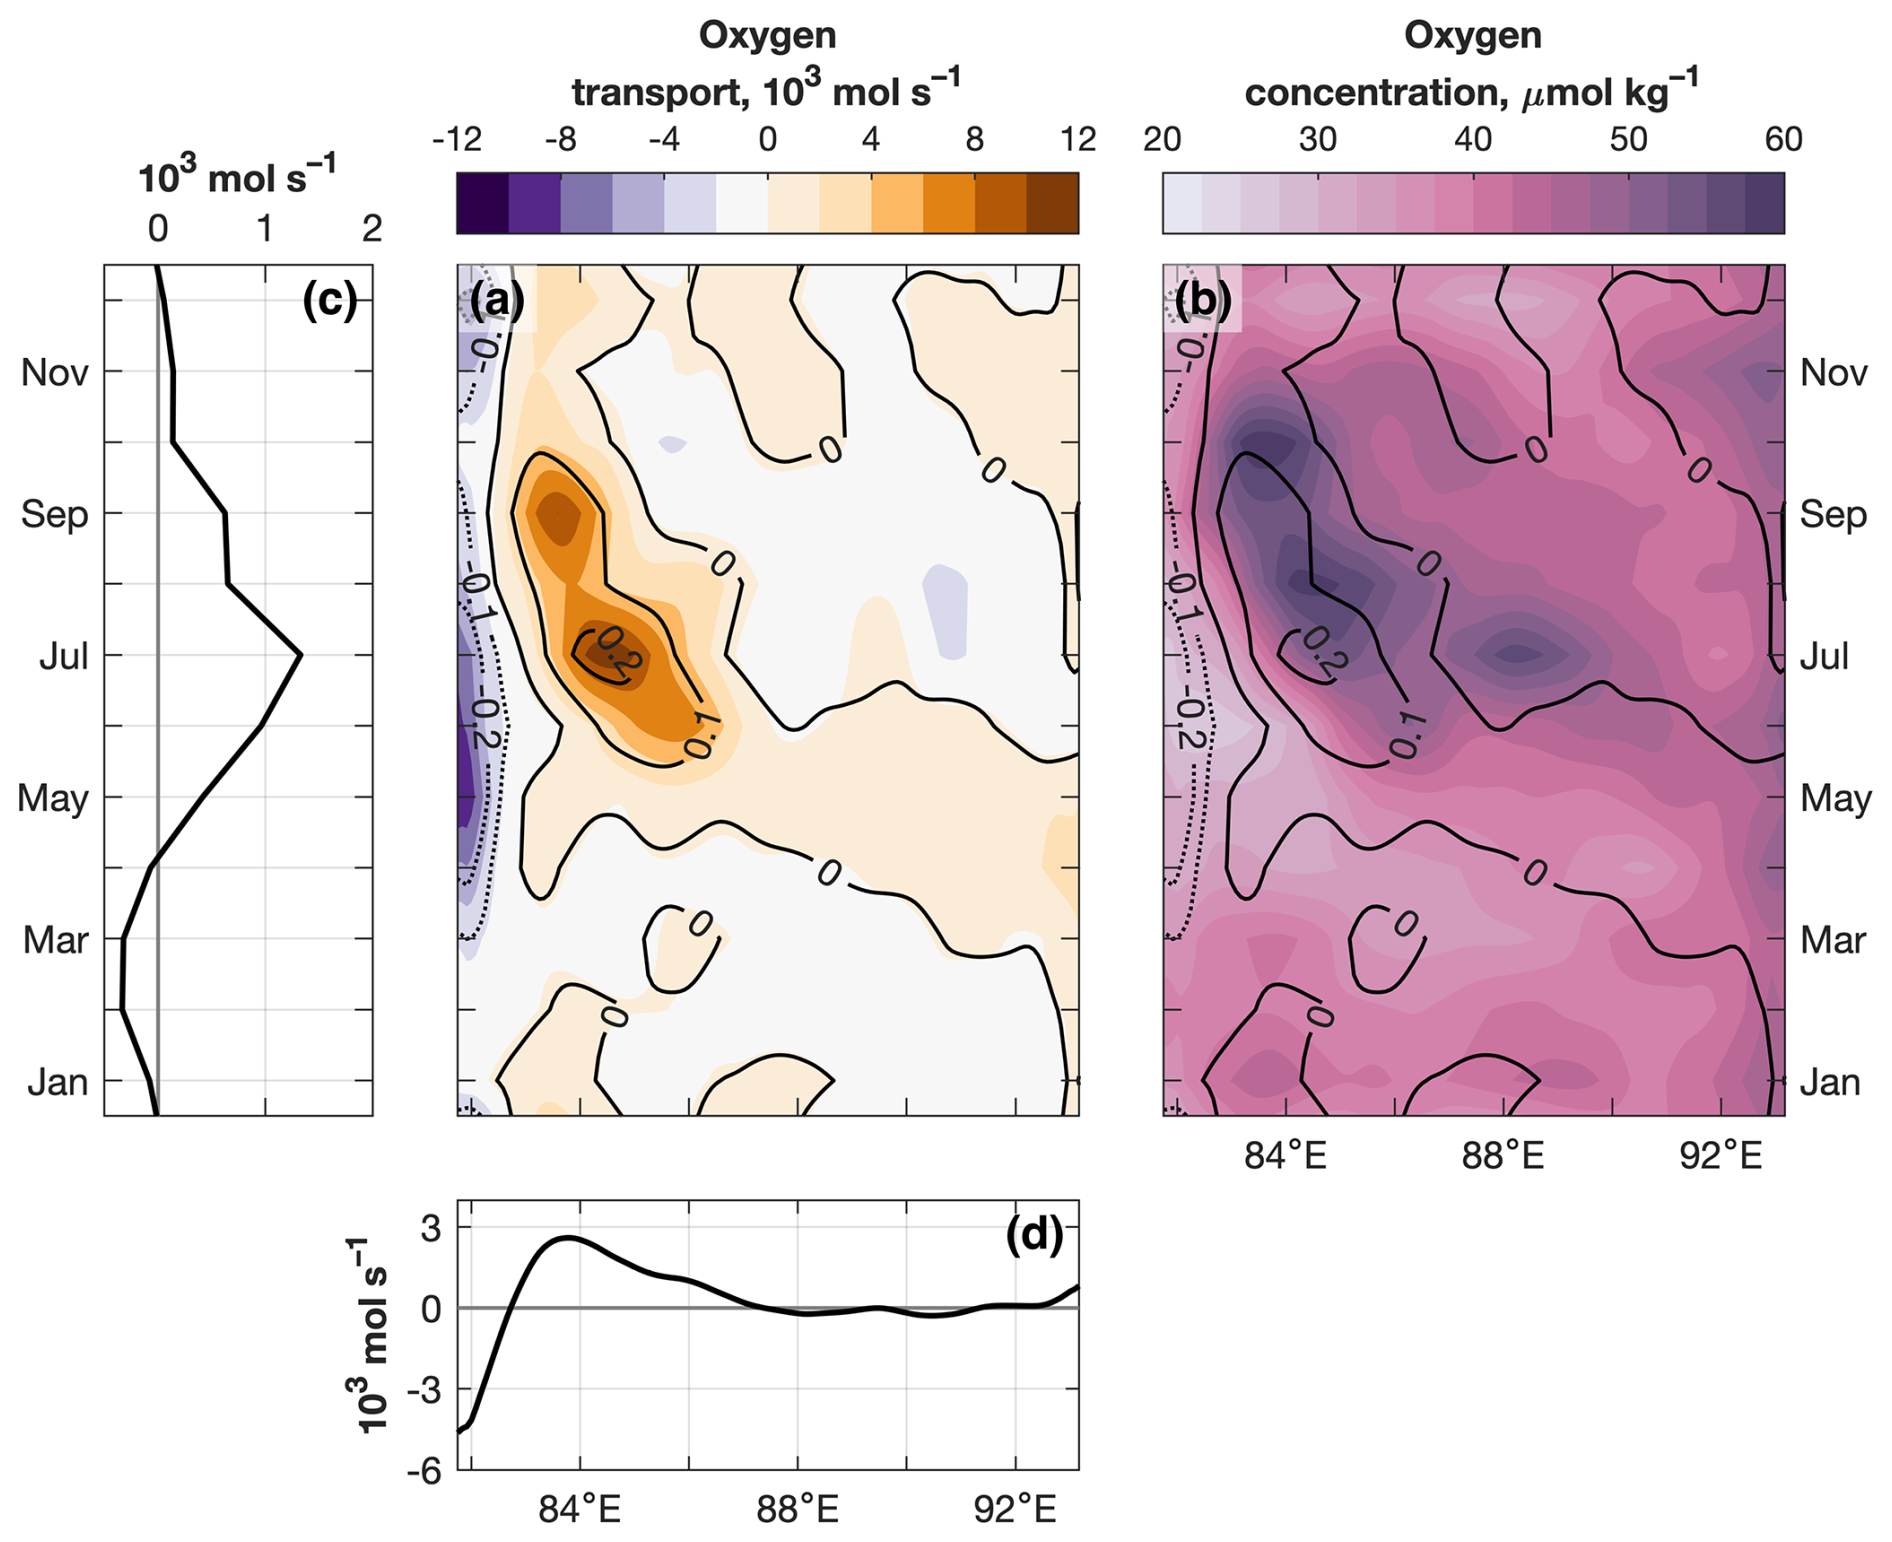
Figure 4Annual cycle of (a) meridional oxygen transport (; Eq. 1; 103 mol s−3) and (b) oxygen concentration (µmol kg−1) at 8° N between the 24 and 26 kg m−3 isopycnals. Contours indicate meridional velocity (m s−1); positive contours are solid, whereas negative contours are dotted. In panels (c) and (d), the oxygen transport plotted in panel (a) is averaged over longitude and time respectively.
Northward oxygen transport increases markedly between May and June as the SMC strengthens (Fig. 4a and c). Transport peaks at 12×103 mol s−1 in July at about 85° E; it decreases to around 6×10³ mol s−1 in August – although this is still considerably higher than background values – before attaining a second peak of 12×103 mol s−1 in September at about 83° E (Fig. 4a). The July peak in oxygen transport is associated with a peak in the SMC's meridional velocity (i.e. >0.2 m s−1; Fig. 4a). The September peak in oxygen transport is associated with lower meridional velocity than the July peak but with a higher oxygen concentration (Fig. 4b). The oxygen concentration in the SMC at 8° N is elevated relative to background levels, but there is a 1-month lag between the increase in velocity and the increase in oxygen concentration (Fig. 4b).
Maximum oxygen concentrations in the SMC are located approximately 1° east of the velocity maximum. This mirrors the salinity distribution: the SMC's high-salinity core is 1° or so east of the velocity core (Webber et al., 2018; Sanchez-Franks et al., 2019), and, as noted above, it is the salinity gradient between the core and low-salinity ambient waters further west that in part drives the northward flow. This agreement in the location of the oxygen and salinity maxima is, therefore, consistent with the correlation between salinity and oxygen concentration in the inflowing water identified in the glider observations (Fig. 3).
Oxygen is not a conservative tracer, and the oxygen content of the Bay of Bengal OMZ depends on the interplay of biogeochemical and physical processes; nevertheless, the annual cycle in the oxygen content of the OMZ is consistent with an injection of oxygen by the SMC. The oxygen content between the 24 and 26 kg m−3 isopycnals is lower before the southwest monsoon than after, according to both NEMO-MEDUSA and the World Ocean Atlas. In the observations, the oxygen content increases from a near-minimum in July (8.25×10¹⁰ mol) to a maximum in September (11.19×10¹⁰ mol; Fig. 5). The July-to-September increase is 31% of the annual mean. The annual cycle in NEMO-MEDUSA is smoother and has a reduced amplitude compared to observations, but it similarly indicates an increase in the oxygen content between the 24 and 26 kg m−3 isopycnals during the southwest monsoon (Fig. 5; standard deviations are not plotted for World Ocean Atlas observations, which are available only as climatological monthly means).
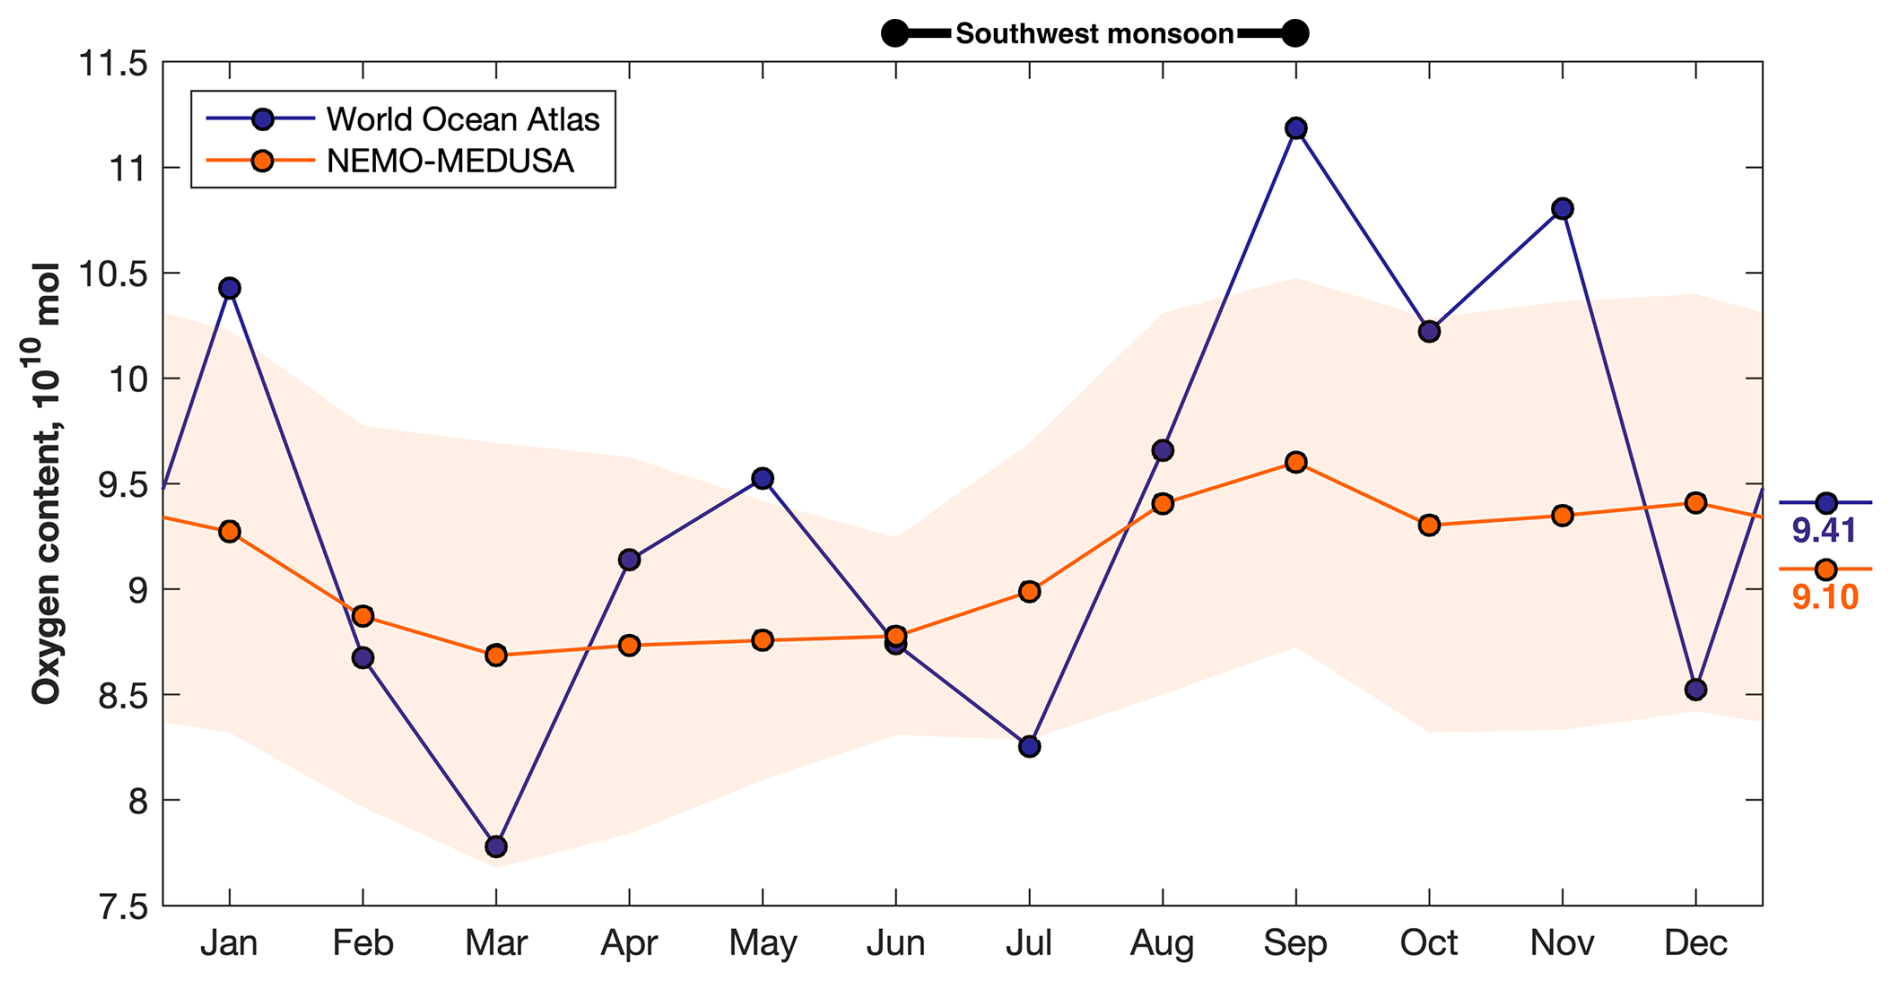
Figure 5Monthly oxygen content (1010 mol), from the World Ocean Atlas (in blue) and NEMO-MEDUSA (in orange), of the Bay of Bengal oxygen minimum zone, north of 8° N, between the 24 and 26 kg m−3 isopycnals. The shaded region indicates ± 1 SD (1 standard deviation) (NEMO-MEDUSA only); standard deviations are not plotted for World Ocean Atlas observations, which are available only as climatological monthly means. The annual mean oxygen content (1010 mol) from the World Ocean Atlas (blue) and NEMO-MEDUSA (orange) is shown to the right of the plot; the period of the southwest monsoon is indicated by the bar above the plot.
The annual mean northward oxygen transport into the Bay of Bengal during the southwest monsoon (between the 24 and 26 kg m−3 isopycnals across 8° N) is commonly between 0.4 and 1.2×10⁵ mol s−1 – the notable exception being the exceptionally large transport in 1998 (2.03×10⁵ mol s−1; Fig. 6a; we note that there was a particularly strong El Niño event and pronounced anomalies in the Indian Ocean in 1997 and 1998; Murtugudde et al., 2000). Considering only northward transport necessarily ignores the potential for southward transport (i.e. transport out of the bay) to remove oxygen from the OMZ; however, net oxygen transport (again, between the 24 and 26 kg m−3 isopycnals across 8° N) is also always positive, being generally between 0 and 0.8×10⁵ mol s−1 (Fig. 6a).
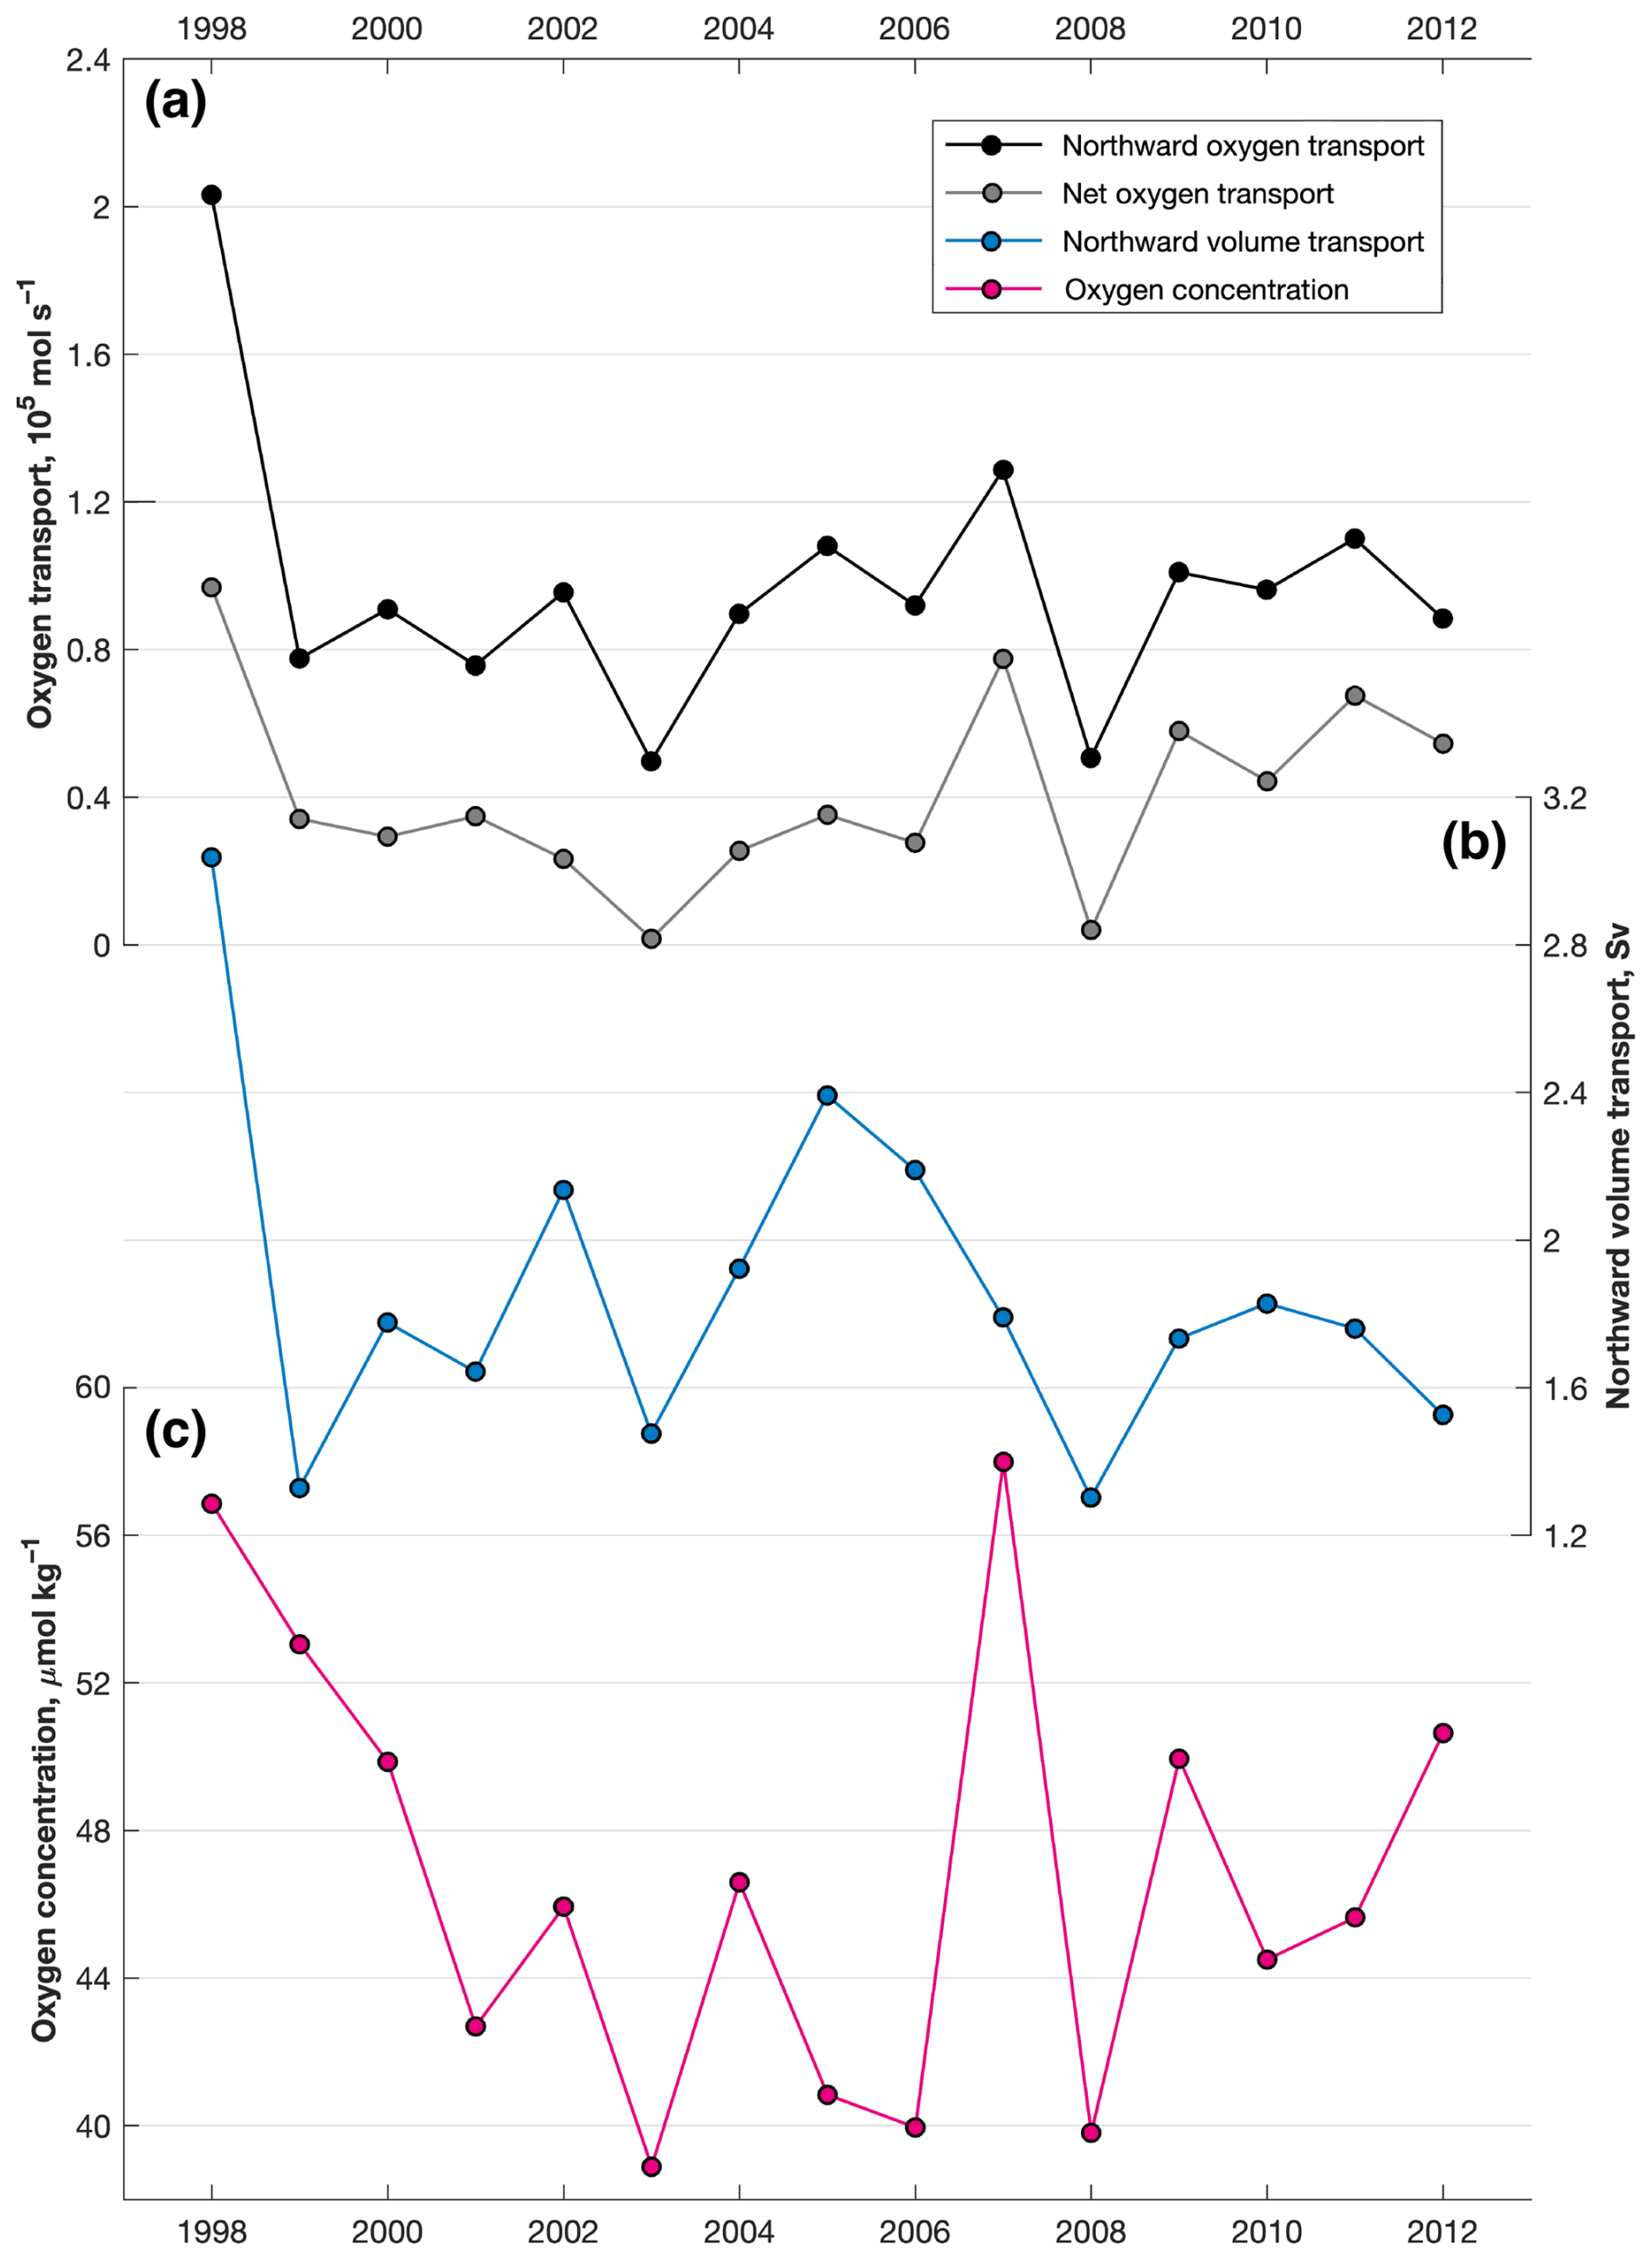
Figure 6(a) Northward oxygen transport (black line) and net oxygen transport (grey line; both 105 mol s−1) averaged over the 4 months of the southwest monsoon (i.e. June–September). (b) Annual mean northward volume transport (in sverdrup, Sv) during the southwest monsoon. (c) Annual mean oxygen concentration in northward-flowing waters during the southwest monsoon (µmol kg−1). All quantities are calculated at 8° N, between the 24 and 26 kg m−3 isopycnals; see Sect. 2.2.
The prominence of the SMC as an advective source of oxygen to the Bay of Bengal OMZ is clear in both space and time, on annual and interannual timescales. It appears to be the dominant driver of oxygen transport across the southern boundary of the Bay of Bengal: its oxygen transport is clearly apparent in both spatial and temporal averages and is sufficient to ensure a net inflow of oxygen to the OMZ, even as ocean currents to its west act to remove oxygen.
The magnitude of the oxygen flux into the Bay of Bengal varies more strongly with the northward volume transport across 8° N (averaged between 24 and 26 kg m−3 over the southwest monsoon; R2=0.69; Fig. 6b) than with the oxygen concentration of the northward-flowing water (also averaged between 24 and 26 kg m−3 over the southwest monsoon; R2=0.43; Fig. 6c). This is consistent with the results presented above: that the location of the strongest oxygen flux within the SMC matches the location of the strongest northward velocity, with the highest oxygen concentrations being located, like the highest salinities, to the east of this velocity maximum.
3.3 Spreading of Southwest Monsoon Current water in the Bay of Bengal
We conduct forward-trajectory particle-tracking experiments performed using the GLORYS12 ocean reanalysis data to determine the distribution of the high-salinity, high-oxygen water of the SMC as it spreads across the Bay of Bengal. In the forward-tracking particle experiment, where particles are initialised at grid points with a salinity greater than 35.2 PSU, the presence of SMC water in the bay increases steadily throughout the southwest monsoon (i.e. June–September; Fig. 7). In June, the particles cover a small area in the immediate vicinity of the SMC, before spreading out to cover the entire southwestern portion of the bay by September (Fig. 7a–d).
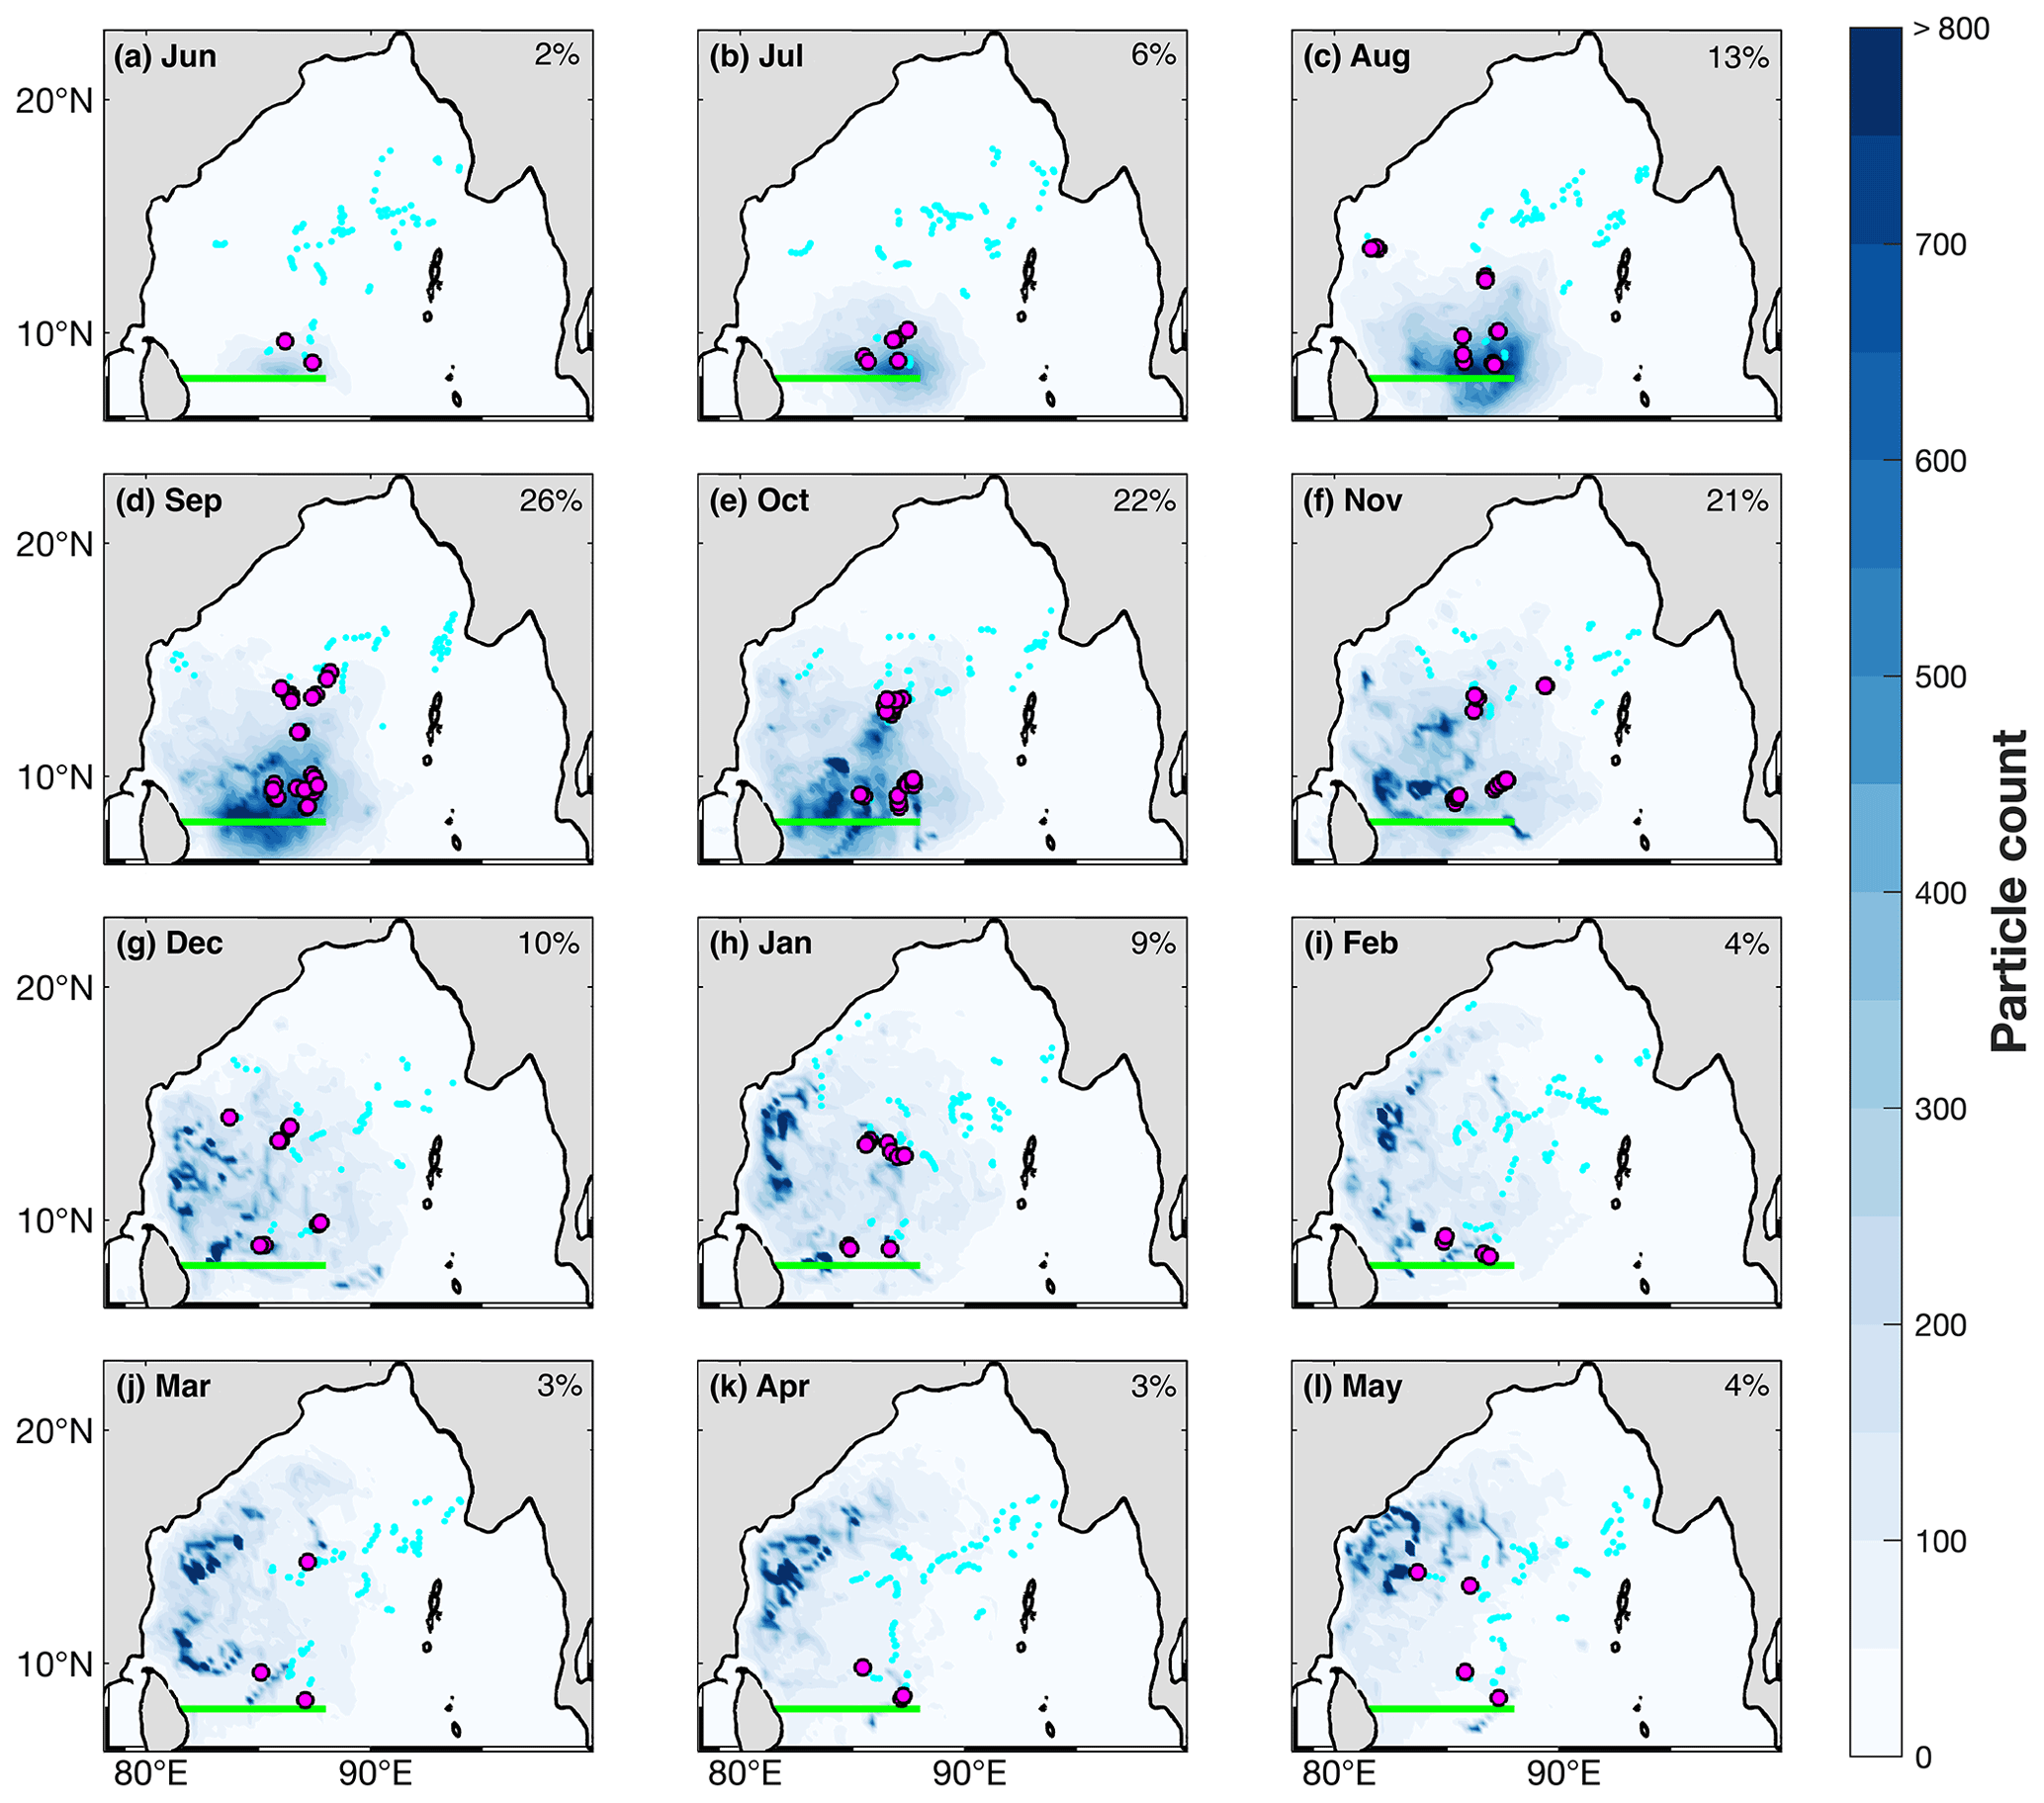
Figure 7Monthly mean particle count, in 0.25° bins, from the forward-trajectory particle-tracking experiments. Particles were released on the 1024 kg m−3 isopycnal at 8° N at 0.01° intervals between the Sri Lankan coast and 88° E (i.e. along the green line) where and when salinity is greater than 35.1 PSU; releases are daily between 1 June and 30 September (inclusive; from 1994 to 2019), and particles are tracked forward for 1 year; see Sect. 2.3 for details. (Note that the GLORYS12 reanalysis outputs practical salinity in PSU.) Small, light-blue dots indicate the locations of all Bio-Argo profiles in each month; large, pink dots indicate profiles with a salinity–oxygen spike indicative of Southwest Monsoon Current water at the 24 kg m−3 isopycnal; see Sect. 2.1 for details. The percentage of Argo profiles with a high-salinity, high-oxygen spike is shown in the top-right corner of each panel.
The density of particles begins to decrease from November (Fig. 7e), even as particles penetrate further northward. The northernmost extent of SC-origin water in the bay is in agreement with that reported by Nayak et al. (2025), who find SMC-origin water as far north as 19° N. By May, immediately before the onset of the following southwest monsoon, particles are clustered in a broad region in the western central bay, off the eastern coast of India (Fig. 7l). At no point in the year does SMC-origin water significantly penetrate the Andaman Sea – i.e. the eastern portion of the Bay of Bengal (Fig. 7). The overall distribution of particles demonstrates the northward spread of water in the SMC's high-salinity core: it reaches all but the most northern and eastern parts of the bay.
There is broad agreement between the regions of the Bay of Bengal in which SMC-origin water is found and the locations in which relatively high-oxygen, high-salinity spikes (i.e. salinity >35 g kg−3 and oxygen >30 µmol kg−1; referred to as spikes hereafter) are found on the 24 kg m−3 isopycnal in Bio-Argo profiles (Fig. 7). (Note that the thresholds for identifying spikes in the Bio-Argo float data within the bay are lower than the thresholds used in the SMC region; these lower thresholds allowed for spikes to be identified further north in the bay where the signal is eroded due to mixing with the surrounding water masses.) Spikes are confined to the very south in June and July and are not found in any Bio-Argo profiles in the central and northern bay. The area in which high-salinity, high-oxygen spikes are found expands as SMC-origin water spreads northward between August and November (Fig. 7c–f); moreover, the percentage of Bio-Argo profiles with spikes increases markedly during months in which the amount of SMC-origin water is at its highest (Fig. 7). The high-oxygen, high-salinity signal of SMC-origin water must, therefore, be preserved up to this time as the water spreads in the bay. Between December and May, most Bio-Argo profiles do not contain spikes (Fig. 7g–l), even though many profiles are from regions in which SMC-origin water may be found. This suggests that the high-oxygen, high-salinity signature of the SMC within the Bay of Bengal becomes eroded from December onward, in agreement with the seasonal cycle of the oxygen content within the OMZ (Fig. 5).
We conduct backward-trajectory particle-tracking experiments to determine source regions of the relatively low-salinity (<35 PSU) and relatively high-salinity (>35.2 PSU) waters found on the 24 kg m−3 isopycnal in the central Bay of Bengal. Low-salinity particles originate and circulate predominantly within the bay, with high track density even reaching into the northern Andaman Sea (Fig. 8a). This is in contrast to the high-salinity particles, which have a higher track density in the southwestern bay than in the northern bay (Fig. 8b). Furthermore, more high-salinity particles originate in the western equatorial Indian Ocean, off the coast of East Africa, than do low-salinity particles; this is consistent with trajectories of high-salinity SMC water previously identified (Sanchez-Franks et al., 2019). Very few particles, of either high or low salinity, originate from the southeastern Indian Ocean (Fig. 8). These results demonstrate the separation in the Bay of Bengal's source waters: the high-salinity, high-oxygen water is transported from the southwest and much of it originates in the southeastern Arabian Sea or western Indian Ocean; moreover, the SMC is likely a key conduit for this water. Meanwhile, the relatively fresh water found within the central Bay of Bengal is more likely native to the bay, particularly given that the large influx of river water that occurs after each year's southwest monsoon.
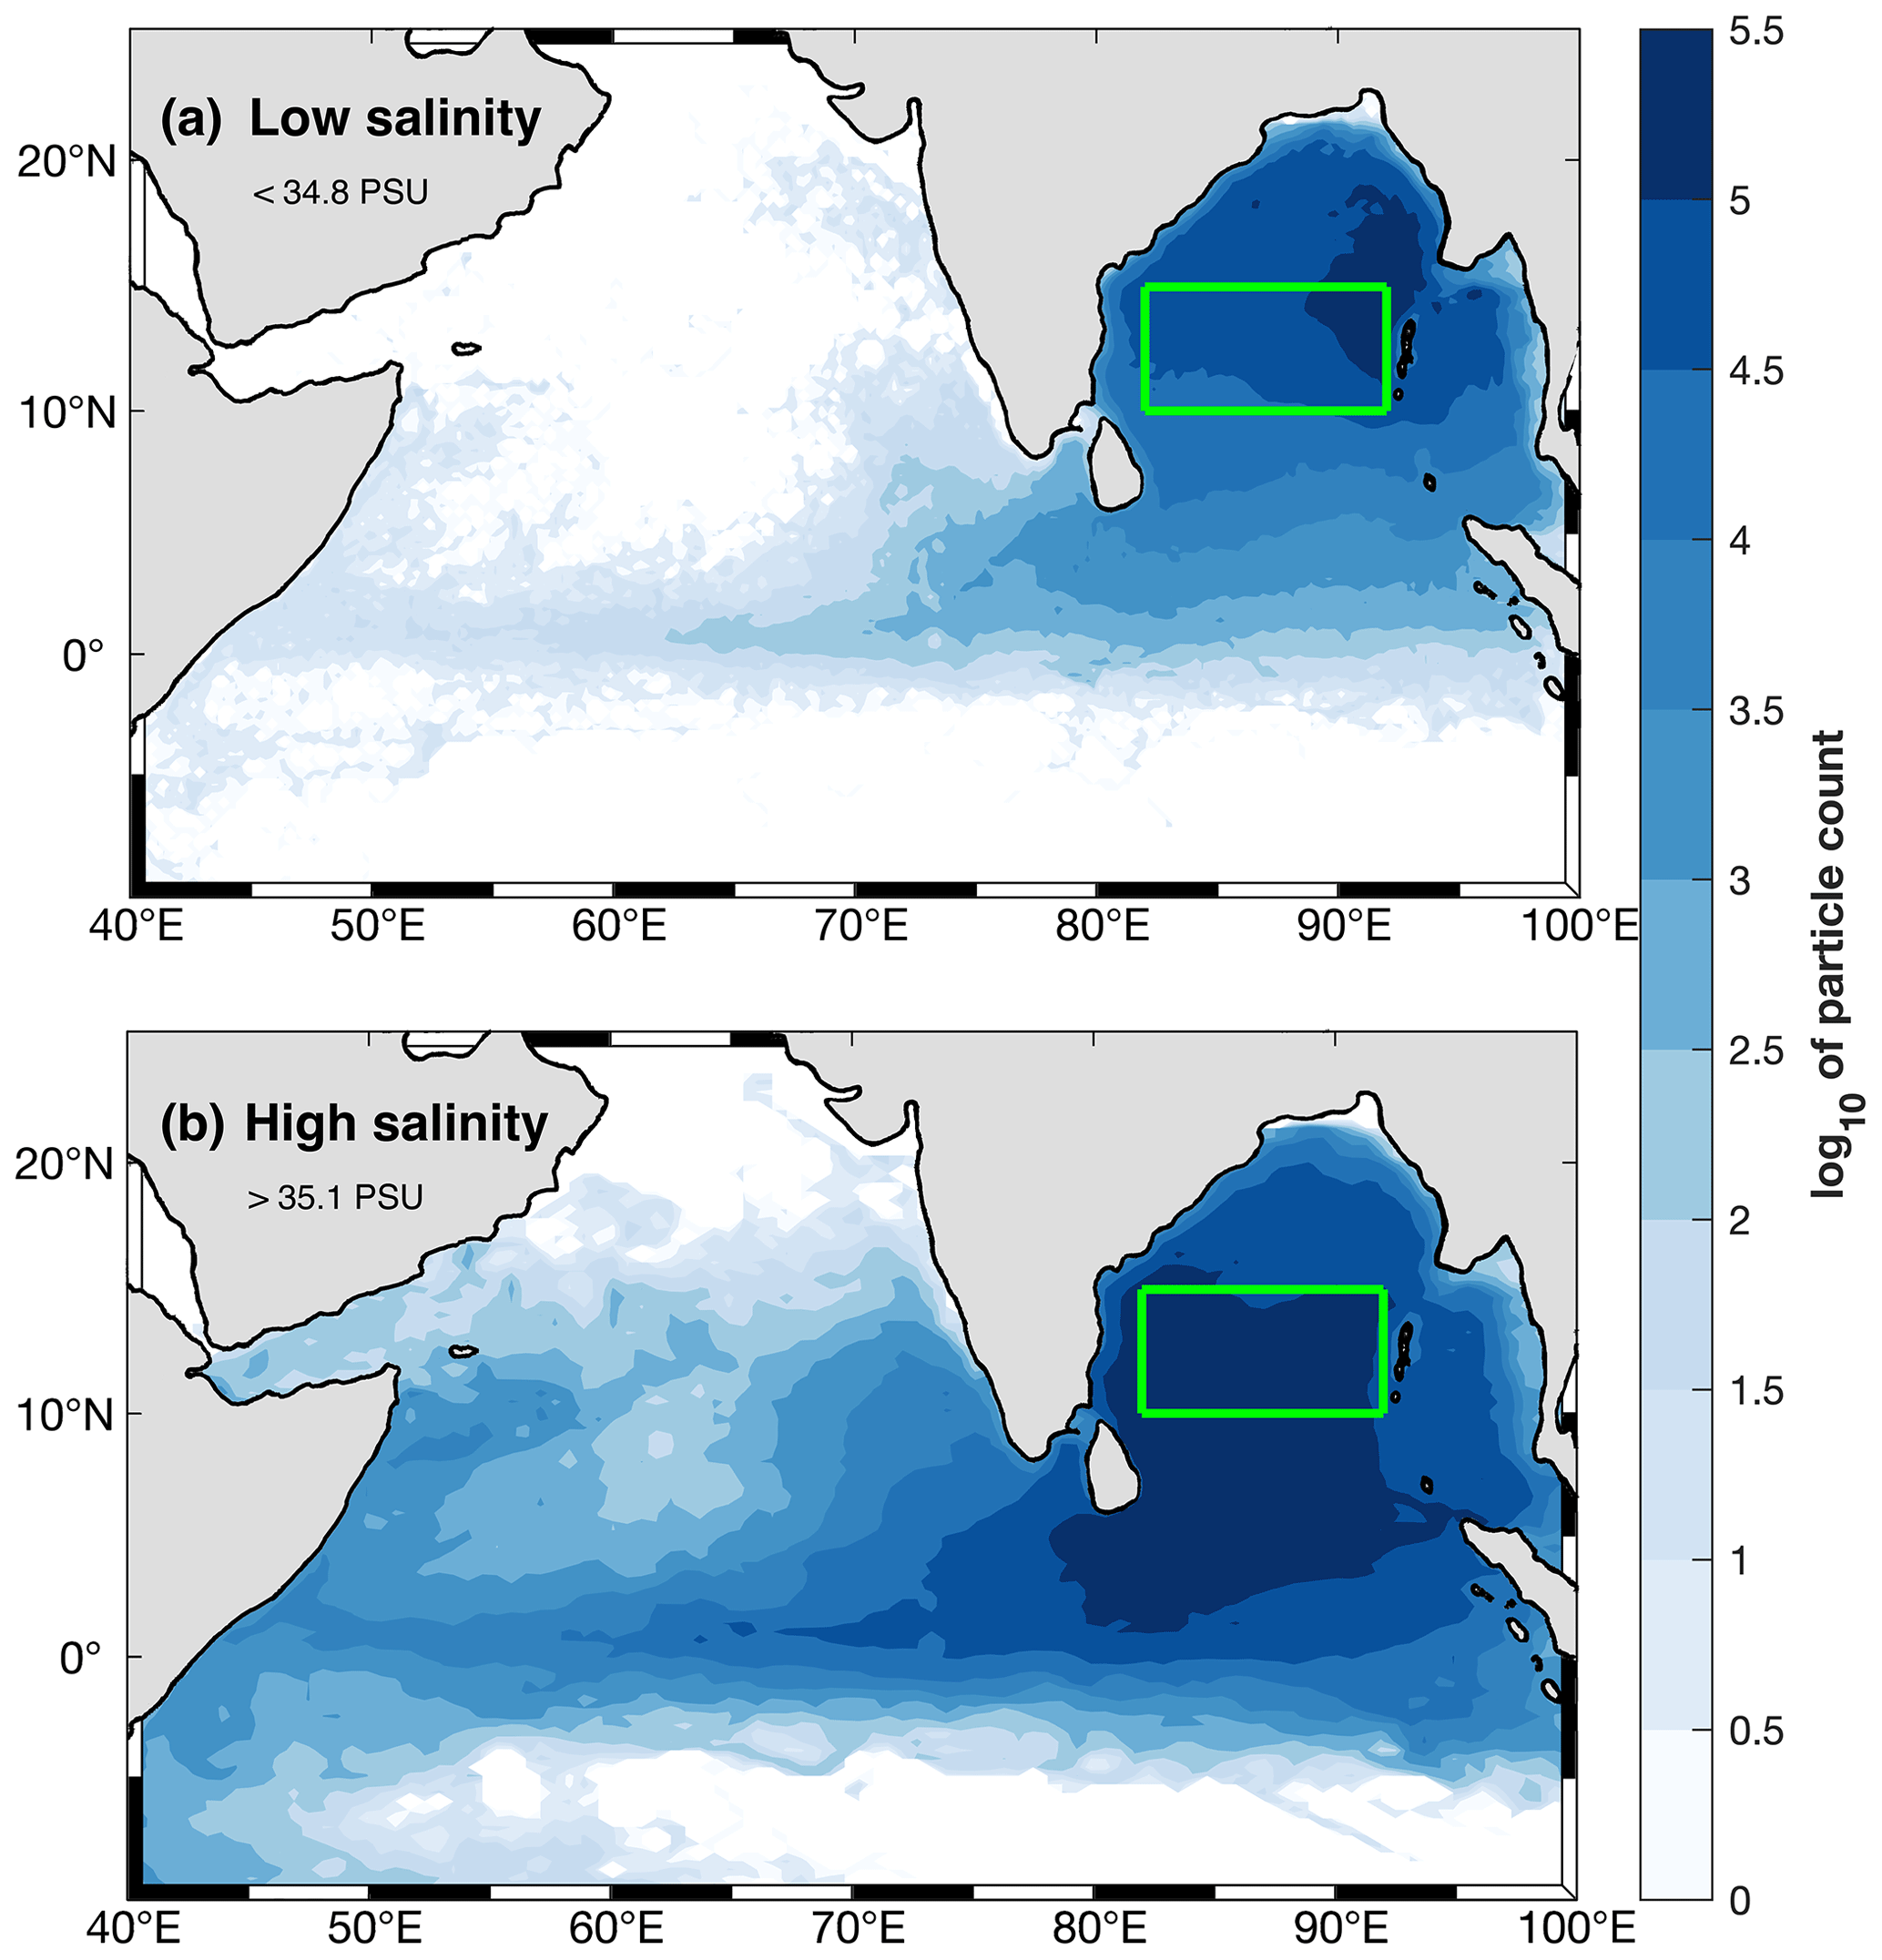
Figure 8Logarithm (base 10) of particle count, in 0.25° bins, from the backward-trajectory experiments. Particles were released on the 1024 kg m−3 isopycnal within the green-outlined box where (a) salinity was less than 34.8 PSU and (b) salinity was greater than 35.1 PSU. (Note that the GLORYS12 reanalysis outputs practical salinity in PSU.)
The high-salinity core of the SMC has been the subject of previous investigation (e.g. Vinayachandran et al., 2013; Sanchez-Franks et al., 2019), but its high oxygen transport has not previously been identified. Indeed, it has been suggested that ASHSW entering the Bay of Bengal is low in oxygen and so is unlikely to contribute to the oxygen budget of the OMZ (Rixen et al., 2020). Our observations suggest the contrary: the high-salinity core of the SMC is markedly less depleted in oxygen than the waters native to the bay. This high-oxygen core represents a considerable advective oceanic transport of oxygen to the upper Bay of Bengal OMZ, with consequences for the OMZ's annual cycle of oxygen. Ditkovsky et al. (2023) have recently highlighted the importance of outflows from marginal seas, similar to the SMC in size and transport, for defining the expansion–redistribution–contraction behaviour observed in OMZs. Our work provides clear observational evidence of how mesoscale advective currents, not similar to marginal sea outflows, can play an important role in ventilating the upper boundary of the OMZ.
We suggest that both the intensity and location of the SMC's oxygen signature are determined by physical processes more strongly than by biogeochemical processes: the peak in meridional oxygen transport is co-located not with oxygen concentration but with meridional velocity (Fig. 4); furthermore, the magnitude of the SMC's oxygen flux in a given year depends more on that current's volume transport than on the oxygen concentration of its ASHSW core (Fig. 6). Consequently, it appears that (1) processes which drive variability in the oxygen concentration of ASHSW have only a modulating effect on the SMC's oxygen flux and (2) the predictability of the SMC's oxygen flux derives primarily from understanding and predicting the SMC's physics. Hence, Earth system models used to predict the future state of the Bay of Bengal's OMZ under climate change must correctly represent the physical forcing mechanisms of the local and dynamic SMC – for instance, local wind forcing and Kelvin and Rossby waves (Webber et al., 2018). Nevertheless, significant future changes to the oxygen concentration of the SMC's ASHSW core will necessarily influence oxygen delivery to the Bay of Bengal, although the evolution of the oxygen concentration of ASHSW remains highly uncertain: opposing trends are predicted over different timescales and there is significant disagreement between models (Lachkar et al., 2023). Oxygen concentration changes could result from changes to the upstream respiration rate within ASHSW. While the waters of the SMC core are more oxygenated than those native to the Bay of Bengal, the ASHSW core is, nevertheless, undersaturated (Fig. 3) and has, therefore, been subducted for some time. Prolonged residence time, perhaps as a result of circulation changes, or increased particulate export and respiration upstream before ASHSW enters the Bay of Bengal would reduce the oxygen content of the SMC.
The identification of the considerable oxygen delivery to the Bay of Bengal by the SMC places this seasonal inflow as a candidate phenomenon for maintaining the oxygen concentration of the OMZ above the level at which large-scale denitrification occurs – and below which biogeochemical pathways within the OMZ would be significantly altered. The onset of large-scale denitrification within the Bay of Bengal would likely have global ramifications and is thought to be presently avoided by even fairly modest injections of oxygenated water (Bristow et al., 2017; Johnson et al., 2019). Constructing an oxygen budget for the Bay of Bengal is beyond the scope of the present contribution – clearly this will depend on many more processes, both physical and biogeochemical, than on those considered here. However, while previous work has emphasised the importance of eddies as an means by which oxygen is supplied to the Bay of Bengal OMZ (Queste et al., 2018; Johnson et al., 2019), our results suggest that the SMC, in particular its core of ASHSW, should be considered an additional means by which oxygen is supplied to the OMZ.
The Southwest Monsoon Current (SMC) flows northward into the Bay of Bengal during the 4 months of the South Asian southwest monsoon (i.e. June–September). The SMC advects a core of Arabian Sea High-Salinity Water (ASHSW) into the bay, the presence of which further, through geostrophy, intensifies the SMC to the core's immediate west. The present observations have demonstrated that this core of ASHSW is also high in oxygen: its characteristic oxygen concentration of 80–100 µmol kg−1 is much higher than that of those waters found at similar densities that are native to the bay (i.e. <20 µmol kg−1). Moreover, the northward oxygen transport of the SMC is an annual event that stands out as such in both temporal and spatial averages: at no other time of year and at no other longitude, from India to Thailand, is there an advective oxygen event of comparable duration or magnitude. The high-salinity, high-oxygen waters of the SMC spread throughout the Bay of Bengal, and their origin is largely different to that of low-salinity waters also found in the bay. Given the proximity of the Bay of Bengal's OMZ to the denitrification threshold, the SMC and its attendant oxygen supply may well be a key feature of biogeochemical cycles in the world ocean.
Year to year, the magnitude of the SMC's annually integrated oxygen flux varies with physical factors (i.e. volume transport) much more closely than with the oxygen concentration of the inflowing ASHSW. Consequently, present and future predictability of the SMC's annual oxygen flux likely lies in understanding and predicting the physical forcing of the current itself. Nevertheless, attributing the high-oxygen signal of the inflowing water to ASHSW highlights the importance of understanding the oxygen dynamics within both the Arabian Sea source region and equatorial transport pathways over which biogeochemical changes might influence the oxygen concentration in the future.
Seaglider observations (Webber et al., 2019)) are available from the British Oceanographic Data Centre: https://doi.org/10.5285/996bf53d-5448-297a-e053-6c86abc0b996. The code for MEDUSA-2 (Yool et al., 2013a) is available from the repository of Geoscientific Model Development: http://gmd.copernicus.org/articles/6/1767/2013/gmd-6-1767-2013-supplement.zip (last access: 23 July 2025, Yool et al., 2013a). The GLORYS12 ocean physics reanalysis is available from the Copernicus Marine Data Centre; here, we use GLOBAL_MULTIYEAR_PHY_001_030, which is available under the following DOI: https://doi.org/10.48670/moi-00021 (Madec, 2008; Lellouche et al., 2021). Satellite-altimeter-derived surface currents are also available from the Copernicus Marine Data Centre; here, we use SEALEVEL_GLO_PHY_L4_MY_008_047, which is available under the following DOI: https://doi.org/10.48670/moi-00148 (CLS, 2025). The observation-based climatology from the World Ocean Atlas 2023 (Locarnini et al., 2024; Reagan et al., 2024; Garcia et al., 2024) is available from https://www.ncei.noaa.gov/data/oceans/woa/WOA23/DATA/ (NOAA, 2025).
BGMW conceived the research. PMFS and BGMW conducted the research, with input from ASF and BYQ. PMFS wrote the paper, with input and revisions from all authors.
The contact author has declared that none of the authors has any competing interests.
Publisher's note: Copernicus Publications remains neutral with regard to jurisdictional claims made in the text, published maps, institutional affiliations, or any other geographical representation in this paper. While Copernicus Publications makes every effort to include appropriate place names, the final responsibility lies with the authors.
This article is part of the special issue “Advances in ocean science from underwater gliders”. It is not associated with a conference.
This research has been supported by the Natural Environment Research Council (grant nos. NE/L013827/1, NE/L013835/1 and NE/W003813/1), the European Research Council H2020 programme (grant no. 741120), the Office of Naval Research Global (grant no. N62909-21-1-2008) and the Svenska Forskningsrådet Formas (grant no. 2022-01536).
This paper was edited by Charitha Pattiaratchi and reviewed by two anonymous referees.
Armstrong McKay, D. I., Cornell, S. E., Richardson, K., and Rockström, J.: Resolving ecological feedbacks on the ocean carbon sink in Earth system models, Earth Syst. Dynam., 12, 797–818, https://doi.org/10.5194/esd-12-797-2021, 2021. a
Asdar, S., Jacobs, Z. L., Popova, E., Noyon, M., Sauer, W. H., and Roberts, M. J.: Projected climate change impacts on the ecosystems of the Agulhas Bank, South Africa, Deep-Sea Res. Pt. II, 200, 105092, https://doi.org/10.1016/j.dsr2.2022.105092, 2022. a
Bange, H. W., Wajih, A., Naqvi, S., and Codispoti, L. A.: The nitrogen cycle in the Arabian Sea, Prog. Oceanogr., 65, 145–158, 2005. a
Bittig, H., Körtzinger, A., Johnson, K., Claustre, H., Emerson, S., Fennel, K., Garcia, H., Gilbert, D., Gruber, N., Kang, D.-J., Naqvi, W., Prakash, S., Riser, S., Thierry, V., Tilbrook, B., Uchida, H., Ulloa, O., and Xing, X.: SCOR WG 142: Quality control procedures for oxygen and other biogeochemical sensors on floats and gliders. Recommendations on the conversion between oxygen quantities for Bio-Argo floats and other autonomous platforms, Ifremer, https://doi.org/10.13155/45915, 2018. a
Bittig, H. C., Maurer, T. L., Plant, J. L., Schmechtig, C., Wong, A. P. S., Claustre, H., Trull, T. W., Udaya Bhaskar, T. V. S., Boss, E., Dall'Olmo, G., Organelli, E., Poteau, A., Johnson, K. S., Hanstein, C., Leymarie, E., Le Reste, S., Riser, S. C., Rupan, A. R., Taillandier, V., Thierry, V., and Xing, X.: A BGC-Argo guide: planning, deployment, data handling and usage, Front. Mar. Sci., 6, 502, https://doi.org/10.3389/fmars.2019.00502, 2019. a
Bristow, L. A., Callbeck, C. M., Larsen, M., Altabet, M. A., Dekaezemacker, J., Forth, M., Gauns, M., Glud, R. N., Kuypers, M. M. M., Lavik, G., Milucka, J., Naqvi, S. W. A., Pratihary, A., Revsbech, N. P., Thamdrup, B., Treusch, A. H., and Canfield, D. E.: N2 production rates limited by nitrite availability in the Bay of Bengal oxygen minimum zone, Nat. Geosci., 10, 24–31, 2017. a, b
Brodeau, L., Barnier, B., Penduff, T., Treguier, A. M., and Gulev, S.: An ERA40-based atmospheric forcing for global ocean circulation models, Ocean Model., 31, 88–104, 2010. a
Busecke, J. J. M., Resplandy, L., Ditkovsky, S., and John, J. G.: Diverging fates of the Pacific Ocean oxygen minimum zone and its core in a warming world, AGU Adv., 3, e2021AV000470, https://doi.org/10.1029/2021AV000470, 2022. a
CLS: Global Ocean Gridded L 4 Sea Surface Heights And Derived Variables Reprocessed 1993 Ongoing, CLS [data set], https://doi.org/10.48670/moi-00148, 2024. a
D'Asaro, E., Altaet, M., Suresh Kumar, N., and Ravichandran, M.: Structure of the Bay of Bengal oxygen deficient zone, Deep-Sea Rese. Pt. II, 179, 104650, https://doi.org/10.1016/j.dsr2.2019.104650, 2020. a, b, c, d
Ditkovsky, S., Resplandy, L., and Busecke, J.: Unique ocean circulation pathways reshape the Indian Ocean oxygen minimum zone with warming, Biogeosciences, 20, 4711–4736, https://doi.org/10.5194/bg-20-4711-2023, 2023. a, b
Eriksen, C. C., James Osse, T., Light, R. D., Wen, T., Lehman, T., Sabin, P. L., Ballard, J. W., and Chiodi, A. M.: Seaglider: a long-range autonomous underwater vehicle for oceanographic research, IEEE J. Ocean. Eng., 26, 424–436, 2001. a
Font, E., Swart, S., Bruss, G., Sheehan, P. M. F., Heywood, K. J., and Queste, B. Y.: Ventilation of the Arabian Sea oxygen minimum zone by Persian Gulf Water, J. Geophys. Res.-Oceans, 129, e2023JC020668, https://doi.org/10.1029/2023JC020668, 2024. a
Frajka-Williams, E., Eriksen, C. C., Rhines, P. B., and Harcourt, R. R.: Determining vertical water velocities from Seaglider, J. Atmos. Ocean. Tech., 28, 1641–1656, 2011. a
Garau, B., Ruiz, S., Zhang, W. G., Pascual, A., Heslop, E., Kerfoot, J., and Tintoré, J.: Thermal lag correction on Slocum CTD glider data, J. Atmos. Ocean. Tech., 28, 1065–1071, 2011. a
Garcia, H. E., Wang, Z., Bouchard, C., Cross, S. L., Paver, C. R., Reagan, J. R., Boyer, T. P., Locarnini, R. A., Mishonov, A. V., Baranova, O. K., Seidov, D., and Dukhovskoy, D.: World Ocean Atlas 2023, Volume 3: Dissolved Oxygen, Apparent Oxygen Utilization, and Oxygen Saturation, NOAA Atlas NESDID 91, NOAA, https://www.ncei.noaa.gov/products/world-ocean-atlas (last access: 23 July 2025), 2024. a, b
Gruber, N.: The marine nitrogen cycle: overview and challenges, in: Nitrogen in the marine environment, edited by: Capone, D. G., Bronk, D. A., Mulholland, M. R., and Carpenter, E. J., Burlington, USA, 1–50, ISBN 978-0-12-372522-6, 2008. a
Hofmann, A. F., Peltzer, E. T., Walz, P. M., and Brewer, P. G.: Hypoxia by degrees: establishing definitions for a changing ocean, Deep-Sea Res. Pt. I, 58, 1212–1226, 2011. a
Jacobs, Z. L., Jebri, F., Raitsos, D. E., Popova, E., Srokosz, M., Painter, S. C., Nencioli, F., Roberts, M., Kamau, J., Palmer, M., and Wihsgott, J.: Shelf-break upwelling and productivity over the North Kenya Banks: the importance of large-scale ocean dynamics, J. Geophys. Res.-Oceans, 125, e2019JC015519, https://doi.org/10.1029/2019JC015519, 2020. a
Jebri, F., Jacobs, Z. L., Raitsos, D. E., Srokosz, M., Painter, S. C., Kelly, S., Roberts, M. J., Scott, L., Taylor, S. F. W., Palmer, M. R., Kizenger, H., Shaghude, Y., and Popova, E.: Interannual monsoon wind variability as a key driver of East African small pelagic fisheries, Sci. Rep., 10, 13247, https://doi.org/10.1038/s41598-020-70275-9, 2020. a
Johnson, K. S., Riser, S. C., and Ravichandran, M.: Oxygen variability controls denitrification in the Bay of Bengal oxygen minimum zone, Geophys. Res. Lett., 46, 804–811, 2019. a, b, c, d, e, f
Kwiatkowski, L., Torres, O., Bopp, L., Aumont, O., Chamberlain, M., Christian, J. R., Dunne, J. P., Gehlen, M., Ilyina, T., John, J. G., Lenton, A., Li, H., Lovenduski, N. S., Orr, J. C., Palmieri, J., Santana-Falcón, Y., Schwinger, J., Séférian, R., Stock, C. A., Tagliabue, A., Takano, Y., Tjiputra, J., Toyama, K., Tsujino, H., Watanabe, M., Yamamoto, A., Yool, A., and Ziehn, T.: Twenty-first century ocean warming, acidification, deoxygenation, and upper-ocean nutrient and primary production decline from CMIP6 model projections, Biogeosciences, 17, 3439–3470, https://doi.org/10.5194/bg-17-3439-2020, 2020. a
Lachkar, Z., Lévy, M., Hailegeorgis, D., and Vallivattathillam, P.: Differences in recent and future trends in the Arabian Sea oxygen minimum zone: processes and uncertainties, Front. Mar. Sci., 10, 1122043, https://doi.org/10.3389/fmars.2023.1122043, 2023. a, b
Lellouche, J.-M., Grenier, E., Romain, B.-B., Garric, G., Melet, A., Drévillon, M., Bricaud, C., Hamon, M., Le Galloudec, O., Regnier, C., Candela, T., Testut, C.-E., Gasparin, F., Ruggiero, G., Benkiran, M., Drillet, Y., and Le Traon, P.-Y.: The Copernicus global 1/12° oceanic and sea ice GLORYS12 re-analysis, Front. Mar. Sci., 9, 698876, https://doi.org/10.3389/feart.2021.698876, 2021. a, b
Lévy, M., Couespel, D., Haëck, C., Keerthi, M. G., Mangolte, I., and Prend, C. J.: The impact of fine-scale currents on biogeochemcial cycles in a changing ocean, Annu. Rev. Mar. Sci., 16, 191–215, 2024. a
Locarnini, R. A., Mishonov, A. V., Baranova, O. K., Reagan, J. R., Boyer, T. P., Seidov, D., Wang, Z., Garcia, H. E., Bouchard, C., Cross, S. L., Paver, C. R., and Dukhovskoy, D.: World Ocean Atlas 2023, Volume 1: Temperature, NOAA Atlas NESDID 89, NOAA, https://www.ncei.noaa.gov/products/world-ocean-atlas (last access: 23 July 2025), 2024. a, b
Madec, G.: NEMO ocean engine. Note du Pôle de modélisation, Tech. Rep. 27, Institute Pierre-Simon Laplace, France, https://www.nemo-ocean.eu/doc/ (last access: 23 July 2025), 2016. a
Mercator Ocean International: Global Ocean Physics Reanalysis, Mercator Ocean International [data set], https://doi.org/10.48670/moi-00021, 2023. a
Murtugudde, R., McCreary, J. P., and Busalacchi, A. J.: Oceanic processes associated with anomalous events in the Indian Ocean with relevance to 1997–1998, J. Geophys. Res., 105, 3295–3306, 2000. a
Nayak, A. A., Vinayachandran, P. N., and George, J. V.: Arabian Sea high salinity core supplies oxygen to the Bay of Bengal, Deep-Sea Res. Pt. II, 221, 105477, https://doi.org/10.1016/j.dsr2.2025.105477, 2025. a, b, c, d
NOAA: Index of /data/oceans/woa/WOA23/DATA, NOAA [data set], https://www.ncei.noaa.gov/data/oceans/woa/WOA23/DATA/ (last access: 23 July 2025), 2025. a
Popova, E., Yool, A., Byfield, V., Cochrane, K., Coward, A. C., Salim, S. S., Gasalla, M. A., Henson, S. E., Hobday, A. J., Pecl, G. T., Sauer, W. H., and Roberts, M. J.: From global to regional and back again: common climate stressors of marine ecosystems relevant for adaptation across five ocean warming hotspots, Global Change Biol., 22, 2038–2053, 2016. a
Queste, B. Y., Vic, C., Heywood, K. J., and Piontkovski, S. A.: Physical controls on oxygen distribution and denitrification potential in the northwest Arabian Sea, Geophys. Res. Lett., 45, 4143–4152, 2018. a, b
Reagan, J. R., Seidov, D., Wang, Z., Dukhovskoy, D., Boyer, T. P., Locarnini, R. A., Baranova, O. K., Mishonov, A. V., Garcia, H. E., Bouchard, C., Cross, S. L., and Paver, C. R.: World Ocean Atlas 2023, Volume 2: Salinity, NOAA Atlas NESDID, NOAA Atlas NESDID 90, NOAA, https://www.ncei.noaa.gov/products/world-ocean-atlas (last access: 23 July 2025), 2024. a, b
Rixen, T., Cowie, G., Gaye, B., Goes, J., do Rosário Gomes, H., Hood, R. R., Lachkar, Z., Schmidt, H., Segschneider, J., and Singh, A.: Reviews and syntheses: Present, past, and future of the oxygen minimum zone in the northern Indian Ocean, Biogeosciences, 17, 6051–6080, https://doi.org/10.5194/bg-17-6051-2020, 2020. a, b, c
Sanchez-Franks, A., Webber, B. G. M., King, B. A., Vinayachandran, P. N., Matthews, A. J., Sheehan, P. M. F., Behara, A., and Neema, C. P.: The railroad switch effect of seasonally reversing currents on the Bay of Bengal high-salinity core, Geophys. Res. Lett., 46, 6005–6014, 2019. a, b, c, d, e, f
Sheehan, P. M. F., Webber, B. G. M., Sanchez-Franks, A., Matthews, A. J., Heywood, K. J., and Vinayachandran, P. N.: Injection of oxygenated Persian Gulf Water into the southern Bay of Bengal, Geophys. Res. Lett., 47, e2020GL087773, https://doi.org/10.1029/2020GL087773, 2020. a, b, c, d
Vinayachandran, P. N., Masumoto, Y., Mikawa, T., and Yamagata, T.: Intrusion of the Southwest Monsoon Current into the Bay of Bengal, J. Geophys. Res., 104, 11077–11085, 1999. a
Vinayachandran, P. N., Shankar, D., Vernekar, S., Sandeep, K. K., Amol, P., Neema, C. P., and Chatterjee, A.: A summer monsoon pump to keep the Bay of Bengal salty, Geophys. Res. Lett., 40, 1777–1782, 2013. a
Vinayachandran, P. N., Matthews, A. J., Vijay Kumar, K., Sanchez-Franks, A., Thushara, V., George, J., Vijith, V., Webber, B. G. M., Queste, B. Y., Roy, R., Sarkar, A., Baranowski, D. B., Bhat, G. S., Klingaman, N. P., Peatman, S. C., Parida, C., Heywood, K. J., Hall, R. A., King, B., Kent, E. C., Nayak, A. A., Neema, C. P., Amol, P., Lotliker, A., Kankonkar, A., Gracias, D. G., Vernekar, S., Souza, A. C. D. Valluvan, G., Pargaonkar, S. M., Dinesh, K., Giddings, J., and Joshi, M.: BoBBLE (Bay of Bengal Boundary Layer Experiment): ocean-atmosphere interaction and its impact of the South Asian monsoon, B. Am. Meteorol. Soc., 99, 1569–1587, 2018. a
Webber, B. G. M., Matthews, A. J., Vinayachandran, P. N., Neema, C. P., Sanchez-Franks, A., Vijith, V., Amol, P., and Baranowski, D. B.: The dynamics of the Southwest Monsoon Current in 2016 from high-resolution observations and models, J. Phys. Oceanogr., 48, 2259–2282, 2018. a, b, c, d, e, f, g, h
Webber, B. G. M., Matthews, A. J., Queste, B. Y., Lee, G. A., Cobas-Garcia, M., Heywood, K. J., and Vinayachandran, P. N.: Ocean glider data from five Seagliders deployed in the Bay of Bengal during the BoBBLE (Bay of Bengal Boundary Layer Experiment) project in July 2016, British Oceanographic Data Centre, National Oceanography Centre, NERC [data set], https://doi.org/10.5285/996bf53d-5448-297a-e053-6c86abc0b996, 2019. a, b
Yool, A., Popova, E. E., and Anderson, T. R.: MEDUSA-2.0: an intermediate complexity biogeochemical model of the marine carbon cycle for climate change and ocean acidification studies, Geosci. Model Dev., 6, 1767–1811, https://doi.org/10.5194/gmd-6-1767-2013, 2013a. a, b, c, d
Yool, A., Popova, E. E., Coward, A. C., Bernie, D., and Anderson, T. R.: Climate change and ocean acidification impacts on lower trophic levels and the export of organic carbon to the deep ocean, Biogeosciences, 10, 5831–5854, https://doi.org/10.5194/bg-10-5831-2013, 2013b. a
Zhou, Y., Gong, H., and Zhou, F.: Responses of horizontally expanding oceanic oxygen minimum zones to climate change based on observations, Geophys. Res. Lett., 49, e2022GL097724, https://doi.org/10.1029/2022GL097724, 2022. a