the Creative Commons Attribution 4.0 License.
the Creative Commons Attribution 4.0 License.
 | 25 Jul 2025
Drivers of the spatiotemporal distribution of dissolved nitrous oxide and air–sea exchange in a coastal Mediterranean area
Mercedes de la Paz
Fiz Fernández Pérez
Núria Marbà
Carlos Morell
Eva Alou-Font
Joaquín Tintoré
Iris E. Hendriks
Among the well-known greenhouse gases (GHGs), nitrous oxide (N2O) is the third most impactful, possessing a global warming potential approximately 300 times greater than that of carbon dioxide (CO2) over a century. The distribution of N2O in aquatic environments exhibits notable spatial and temporal variations, and emissions remain inadequately constrained and underrepresented in global N2O emission inventories, particularly for coastal zones. This study focuses on N2O levels and air–sea fluxes in the coastal waters of the Balearic Islands Archipelago in the Western Mediterranean basin. Data were gathered between 2018 and 2023 at three coastal monitoring stations: two on the densely populated island of Mallorca and the third in the well-preserved National Park of the Cabrera Archipelago. Seawater N2O concentrations varied from 6.5 to 9.9 nmol L−1, with no significant differences being detected across the sites. When these sink–source strengths are integrated on an annual basis, the Balearic Sea is close to equilibrium with atmospheric N2O, resulting in a neutral atmosphere–ocean exchange (0.1 ± 0.2 ). A consistent seasonal pattern was noted during the study period. Machine learning analysis indicated that seawater temperature was the primary factor influencing N2O concentrations, with lesser contributions from chlorophyll levels and salinity.
- Article
(5738 KB) - Full-text XML
-
Supplement
(738 KB) - BibTeX
- EndNote


Nitrous oxide (N2O) is a potent greenhouse gas (GHG) with 300 times higher warming potential per mole than carbon dioxide (CO2) on a 100-year timescale (Solomon et al., 2007). Atmospheric N2O levels have risen by more than 18 % since preindustrial times and increased by 332 ppb between 2011 and 2019 (Masson-Delmotte et al., 2021). The ocean N2O budget is highly sensitive to climate change and influences the climate system significantly (Ravishankara et al., 2009). Variations in temperature, ocean circulation, and biological activity can alter the production and release of N2O from the oceans. Consequently, the concentration of N2O in the atmosphere influences global warming and climate patterns, creating a feedback loop between oceanic processes and the climate system. Marine N2O sources account for one-third of the natural emissions to the atmosphere, yielding a net source of 3.5 (2.5–4.7) Tg N yr−1, excluding coastal contributions (Tian et al., 2024). N2O is primarily produced through nitrification and denitrification pathways (Freing e al., 2012. Nitrification is an aerobic process in which ammonium () is oxidized to nitrate (), producing N2O as a byproduct, favoured by low-oxygen conditions. In contrast, denitrification occurs under suboxic to anoxic conditions and involves the stepwise reduction of nitrate to dinitrogen gas (N2), also releasing N2O as an intermediate. These microbial processes are particularly sensitive to environmental gradients in oxygen, nutrients, and the availability of organic matter. The nitrogen cycle is one of the most complex regulating factors of primary production, highly dependent on dissolved oxygen concentration and the prevailing redox conditions (Codispoti, 2010). In coastal environments, significant variability exists in the nitrogen cycle, where land-derived nutrient inputs, coastal upwelling events, and complex biogeochemical processes play crucial roles (Doney, 2010), contributing significantly to the spatiotemporal variability of the N2O concentrations (Nevison et al., 1995). In estuarine and coastal waters, the effects of climate change may be more pronounced, such as in ocean acidification (OA, Carstensen and Duarte, 2019), which can enhance the generation of N2O (Wan et al., 2023; Zhou et al., 2023). Despite the necessity of a better understanding of atmospheric and oceanic inventories of non-CO2 GHGs to provide realistic and accurate models for future scenarios, there are limited open-ocean and coastal monitoring time series networks compared to for CO2 (Bakker et al., 2014; de la Paz et al., 2015; Farías et al., 2007; Ma et al., 2019; Wilson et al., 2017).
The Mediterranean Sea is a semi-enclosed basin surrounded by highly sensitive coastal zones that are particularly vulnerable to human activities. Factors such as high population density, widespread urbanization, and intensive agriculture have escalated the risks of pollution and habitat degradation in the region (UNEP/MAP, 2012). Due to its distinct biogeochemical and hydrodynamic features, this basin has been identified as a “hotspot” for climate change research (Giorgi, 2006). The impacts of global warming and extreme weather events are expected to be more severe in the Mediterranean compared to in other oceanic regions (Giorgi, 2006; Giorgi and Lionello, 2008; Masson-Delmotte et al., 2021). Despite representing just 0.82 % of the global ocean surface, the Mediterranean hosts 4 %–18 % of the world's marine biodiversity, including numerous endemic species (Bianchi and Morri, 2000; Mouillot et al., 2011). Rising temperatures and OA threaten the biodiversity of the region (Micheli et al., 2013). Additionally, anthropogenic pressures along the Mediterranean coast have intensified due to rapid population growth and economic activities. In the Western Mediterranean, high tourism and coastal development levels have left only a small fraction of the coastline in a natural state, with even fewer areas under protection (EEA, 1999).
The Balearic Islands Archipelago, located in the Western Mediterranean, comprises the islands of Mallorca, Menorca, Ibiza, and Formentera, with a combined coastline of 1723 km. Renowned as a major European tourist destination, tourism accounts for approximately 45 % of the total gross domestic product of the archipelago. Visitor numbers have surged dramatically over the past century, reaching nearly 18 million in 2023 (Institut d'Estadística de les Illes Balears, Spain) compared to a resident population of around 1.2 million. Coastal ecosystems in the Balearic Islands are vital for the local economy. Meadows of the endemic seagrass Posidonia oceanica extend across depths of up to 45 m in the Balearic Sea (del Valle Villalonga et al., 2023), providing critical ecosystem services such as carbon sequestration (Duarte et al., 2005), oxygen production (Hendriks et al., 2022), biodiversity support, coastal erosion prevention, sediment stabilization, and water transparency (Barbier et al., 2011). However, these ecosystems face increasing pressure from recreational activities and other anthropogenic impacts.
Given the increasing threats to these ecosystems, understanding the relationship between anthropogenic pressures and GHG emissions, particularly N2O, has become urgent. The absence of long-term N2O datasets for the Mediterranean Sea, along with the uncertainties surrounding current emission estimates, underscores the importance of assessing coastal areas with varying human impacts. These evaluations are essential for improving coastal N2O emission estimates and refining global ocean N2O budgets. In this study, we evaluate the spatial and temporal N2O concentrations in surface waters and the air–sea exchange in the coastal area of the Balearic Islands Archipelago and estimate the potential drivers of the observed variability in N2O concentrations. We focused on three different sites in the coastal zone: a highly impacted site and a medium-impacted site, both located near the island of Mallorca, and a pristine site in the Cabrera National Park Archipelago.
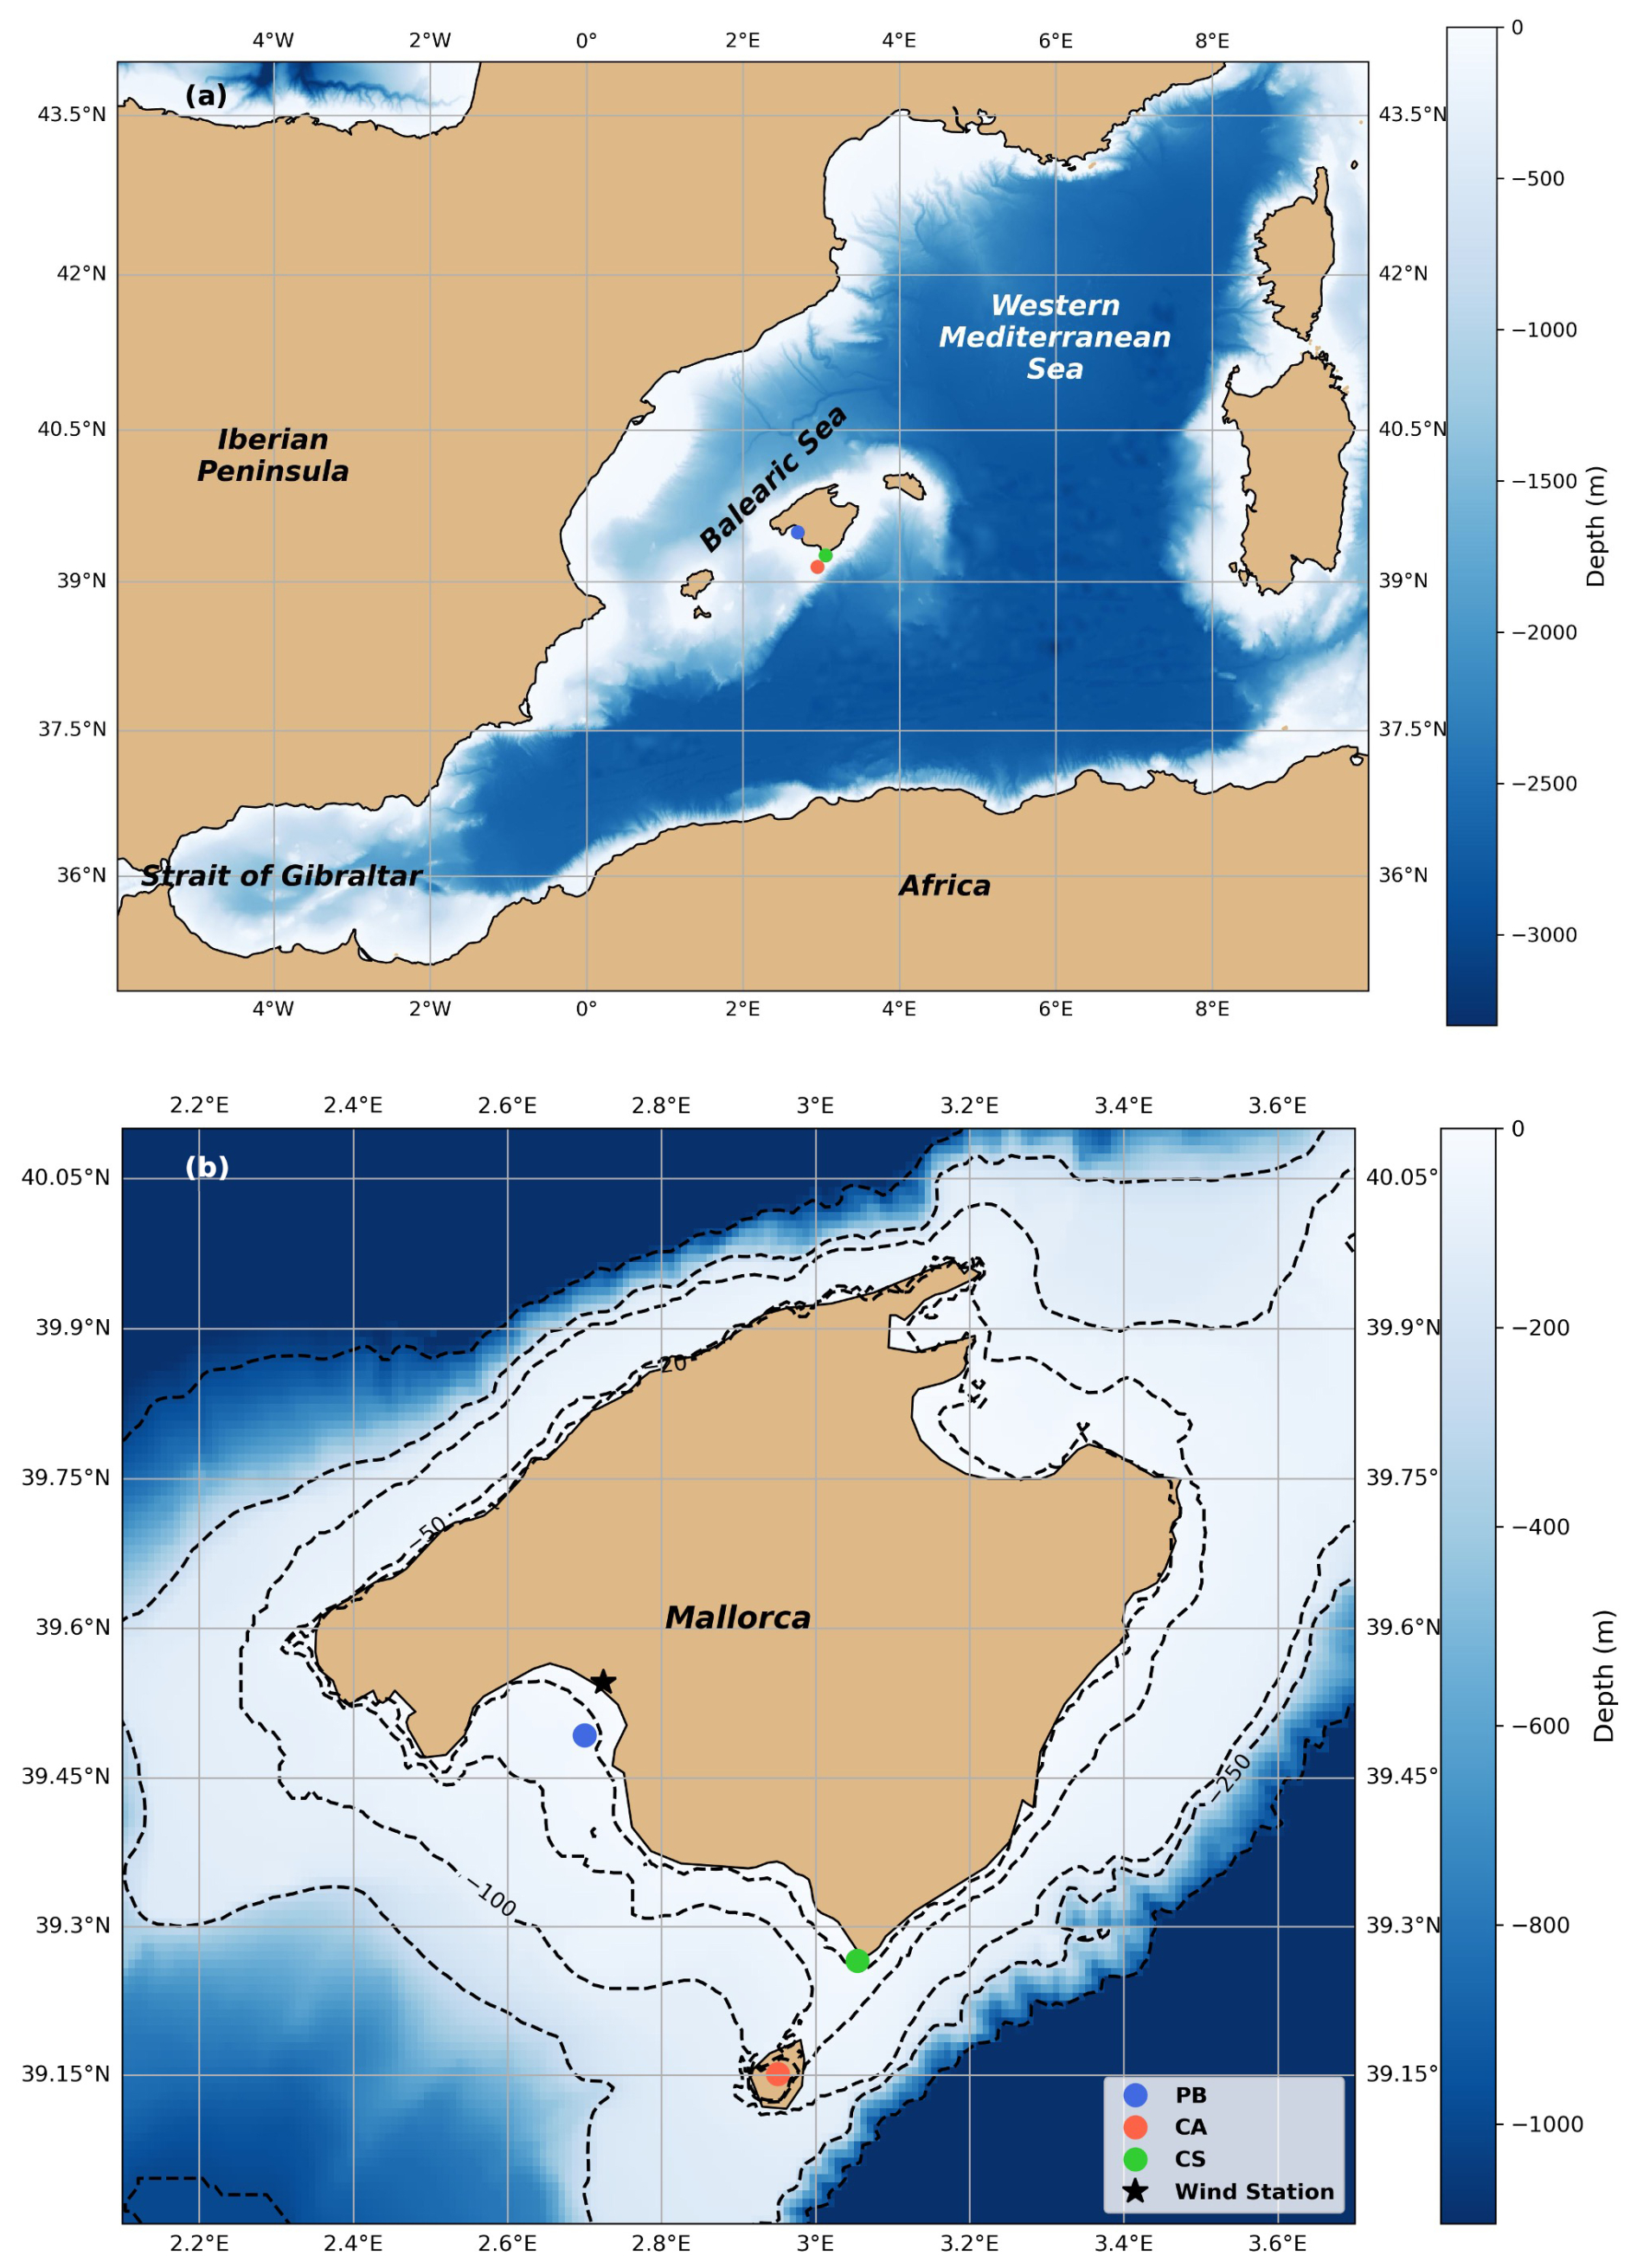
Figure 1(a) Map of the stations location in the Western Mediterranean basin and (b) detailed locations of the Bay of Palma (PB; blue dot), Cabrera National Park (CA, red dot), and Cape Ses Salines (CS; green dot) study sites and Palma Airport wind station (black star). Dashed lines represent bathymetry levels. Maps were developed with the Python software version 3.12.3.
2.1 Study area
We collected physicochemical and biogeochemical parameters from three stations in the Balearic Sea within the Western Mediterranean basin (Fig. 1a); these are part of the Balearic Ocean Acidification Time Series (BOATS; Flecha et al., 2022). The data presented here were collected from 2018 to 2023; however, the data availability varies among the different stations.
Two sampling sites are fixed monitoring stations equipped with autonomous sensors. The first station, established in December 2018, is located in the Bay of Palma (PB: 39.492848° N, 2.700405° E; at a depth of approximately 30 m; Fig. 1b) and is part of the fixed monitoring network of the Balearic Islands Coastal Observing and Forecasting System (Tintoré et al., 2019; 2013-SOCIB; https://www.socib.es/, last access: December 2024). Temperature (°C) and salinity (PSU) data were obtained from the SOCIB buoy sensors; see Tintoré and Casas (2022) for details about the sensors. Additionally, a MiniDot sensor (PME Inc.©) recorded dissolved oxygen (DO) hourly, with a manufacturer accuracy of ± 5 %. The sensor location and water sampling depth were set at 1 m.
The second fixed monitoring station is located in the Bay of Santa Maria (Fig. 1b) within the Cabrera Archipelago National Park (CA: 39.151395° N, 2.950823° E; ∼ 8 m depth) and was installed in November 2019. It is situated in an area under governmental protection and is regarded to be a pristine site with no apparent human influence. Temperature (°C), salinity (PSU), and DO data were collected hourly using SBE37-SMP-ODO (Sea-Bird Scientific Electronics®) and a MiniDot. Both sensors were secured to a mooring line at approximately 4 m depth, and water samples were taken at the same depth. The manufacturer accuracy of measurements was ± 0.002 °C, ± 0.003 mS cm−1, and ± 5 % for temperature, conductivity, and oxygen sensors, respectively.
At PB and CA stations, samples of dissolved N2O; DO; dissolved organic carbon (DOC); Chlorophyll a (Chl a); and inorganic nutrients, including nitrate (), nitrite (), phosphate (), silicate (Si(OH)4), ammonia (NH4), and total nitrogen (TN) were collected monthly.
The third sampling point is located in the coastal area near the Cape Ses Salines lighthouse (CS: 39.2649° N, 3.0535° E; Fig. 1b). At this site, with a total bottom depth of 2 m, data were collected biweekly from surface water directly off the coast at approximately 0.5 m depth. Sampling began in August 2018. Temperature (°C), salinity (PSU), N2O, DOC, Chl a, and inorganic nutrients were collected from the same volume of surface water. DO data were gathered using a MiniDot sensor starting in August 2018. Validation of DO sensor data was performed with DO water samples collected from PB and CA stations, as detailed in Agueda-Aramburu et al. (2024).
The three sites differ in terms of their physical setting and benthic characteristics. PB is located in an open bay with moderate anthropogenic influence and limited seagrass coverage within the sampling area. CA, on the other hand, is located in a semi-enclosed bay within a protected marine park and is surrounded by extensive Posidonia oceanica meadows, which are known to influence nutrient and gas dynamics. CS is a shallow nearshore site with intermittent seagrass patches and high exposure to coastal land–sea interactions. These contrasts are relevant to the interpretation of local biogeochemical processes, including N2O production and air–sea fluxes.
2.2 Data collection and analysis
2.2.1 Biogeochemical variables
To determine N2O levels, samples were collected in duplicate using 120 mL serum vials sealed with grey-butyl rubber stoppers and aluminium crimps. After being sealed, the samples were preserved with HgCl2 and stored upside-down until analysis. N2O concentrations were analysed at the AQUANITROMET laboratory (https://www.iim.csic.es/en/about-iim/organization/aquanitromet-analysis-greenhouse-effect-gases-natural-waters, last access: December 2024) of the Instituto de Investigaciones Marinas (IIM-CSIC, Vigo, Spain), employing a static headspace equilibration technique combined with gas chromatography (GC) equipped with electron capture detection, following the methodology detailed by De la Paz et al. (2015). To create the headspace, 20 mL of nitrogen gas from a Tedlar bag at atmospheric pressure was introduced into the vials while simultaneously extracting the same volume of water sample using a double-needle setup. The vials were shaken and left to equilibrate for at least 12 h in a temperature-controlled environment. For injection into the GC, a brine solution was added through one needle to displace the headspace gas into the GC via the second needle.
The GC, an Agilent 7890 GC, was calibrated using three standard gas mixtures: a NOAA-certified primary standard resembling atmospheric air composition and two additional N2O-in-N2 mixtures supplied by Air Liquide (De la Paz et al., 2015). While participating in the first large-scale international inter-laboratory comparison experiment for seawater N2O measurements (Wilson et al., 2018), an additional certified standard from the Scientific Committee for Oceanographic Research (SCOR) was utilized. The precision of the analysis was determined to be 0.5 %, calculated based on the average coefficient of variation across 400 replicate measurements.
To determine the DO concentration, samples were collected in five borosilicate bottles and then analysed using the Winkler method modified by Benson and Krause (1984), employing potentiometric titration with a Metrohm 808 Titrando. The precision of the DO analysis was estimated to be less than ± 2 µmol kg−1.
Chl a samples were collected in glass bottles, and three replicates were filtered in the laboratory using a Whatman GF/F glass fibre filter. Chl a extraction was performed with 90 % acetone for 24 h under dark conditions, and the samples were measured with a fluorometer (Turner Designs Instrument, Model 7200-00). The fluorometer was calibrated with a pure Chl a standard derived from Anacystis nidulans algae (Sigma Chemical Company) (Knap et al., 1996).
DOC samples were collected in two pre-combusted borosilicate bottles and then filtered through pre-combusted Whatman GF/F glass fibre filters and stored in two pre-combusted borosilicate vials containing 25 µL of orthophosphoric acid (H3PO4). The samples were analysed with a Shimadzu TOC-L analyser following the method described by Álvarez-Salgado and Miller (1998), which is based on catalytic oxidation at a high temperature of 680 °C.
Inorganic nutrient samples were collected in four 10 mL Falcom vials at the same time as the DOC sample processing. Concentrations of , , , Si(OH)4, NH4, and total nitrogen were obtained from the analysis laboratory at the Mediterranean Center for Marine and Environmental Research (CMIMA, Barcelona, Spain) using the Autoanalyser AA3 HR (Seal Analytical, United Kingdom) through continuous flow analysis. The precision, estimated from the coefficient of variation based on replicate analyses of the same water samples (n = 10), ranged from 0.13 % to 0.5 %.
2.2.2 Meteorological and atmospheric data
Wind speed at a height of 10 m was provided by the Agencia Estatal de Meteorología (AEMET) from the Sant Joan Airport station in Palma, Spain (Fig. 1b). Monthly averaged data of atmospheric N2O molar fraction were obtained from the monitoring station at Lampedusa (LMP), Italy, as part of the NOAA (National Oceanic and Atmospheric Administration) monitoring network (http://www.esrl.noaa.gov/gmd/dv/site/, last access: December 2024; Lan et al. 2024).
2.3 Flux estimation and other calculations
To calculate the water–atmosphere N2O fluxes (), the following equation was used:
where k (cm h−1) is the gas transfer velocity, Cw is the concentration of N2O dissolved in water samples (mol−1), and C∗ is the gas saturation concentration calculated as the product of the atmospheric fraction of N2O and the solubility coefficient proposed by Weiss et al. (1980). To compute the fluxes of N2O, we used the monthly mean atmospheric molar N2O obtained from NOAA.
The most suitable parameterization for gas transfer (k) in coastal areas with seagrass ecosystems, which are characterized by limited wind fetch, representing the study area in the Balearic Sea, was utilized, the equation for which was described by Dobashi and Ho (2023) as follows:
Emissions to the atmosphere are indicated by positive values. Additionally, due to the bottom depth differences between stations and to compare with other studies, the gas transfer parameterizations described by Wanninkhof (2014) and Cole and Caraco (1998) were also used to determine water–atmosphere N2O fluxes, and differences are presented in the obtained annual N2O fluxes.
Annual N2O fluxes were calculated by integrating daily flux estimates over time for each station and year using the trapezoidal rule. For each group of samples, the area under the flux–time curve was computed based on the sampling dates, providing an estimate of the total annual air–sea flux. This method accounts for the uneven temporal distribution of data and offers a reliable approach to derive annual fluxes from discrete observations.
Furthermore, saturation levels for N2O (Sat % N2O) are expressed as a percentage, determined by the ratio of the observed N2O concentration to the calculated equilibrium concentration. ΔN2O represents the difference between the observed N2O concentrations. The apparent oxygen utilization (AOU) is calculated using the DO values along with the measured solubility of oxygen in seawater (Benson and Krause, 1989).
2.4 Data analysis
To test for differences in N2O concentrations and fluxes across regions and over temporal scales, simple multifactorial general linear model analyses were conducted using MATLAB version 9.10.0 (R20211, MathWorks Inc.).
Prior to model fitting, we performed a preliminary screening of all available environmental variables to identify those with the highest potential predictive value for N2O dynamics. We tested the influence of environmental drivers on N2O levels using the supervised machine learning (ML) method known as gradient-boosting machine (GBM), which is based on decision tree models using a cross-validated boosting (CVB). GBM utilizes a specific implementation of an ensemble method that combines sequenced base weak models to create a stronger one by applying gradient descent to minimize the model loss function. This process included correlation analysis, variance inflation factors, and variable importance metrics derived from preliminary GBM models. In each iteration, a new model is adapted to the residuals of the previously combined model. The combination of all of the base models is achieved by summing their predictions, and, to prevent overestimation, a weighted learning factor is applied. The CVB technique allows for more precise model evaluation by repeatedly using different data sheets to train and test the model. Both GBM and CVB were implemented in Python version 3.12.3 using the XGBoost library (Chen and Guestrin, 2016). Although and were included in the initial evaluation, they were excluded from the final model due to either lower relative importance or missing data across sites, which would have compromised model consistency.
The three most influential variables identified (temperature, Chl a, and salinity) were further analysed to explore their individual and combined effects using ordinary least squares regression (OLS) and generalized additive models (GAMs). The correlation between the response of N2O and the resulting dominant environmental variables (relative importance > 10 %) obtained from the CVB was assessed through OLS using the Statsmodels library (Seabold and Perktold, 2010) in Python version 3.12.3 and by employing a GAM with the pyGAM library (Servén and Brummitt, 2020) in Python version 3.12.3 to address the nonlinear dependency. This multi-step approach enabled robust variable selection and the identification of mechanistic relationships driving N2O spatiotemporal patterns.
To determine the simple linear correlation between environmental variables and FN2O, Pearson correlation coefficients and p values were calculated for each station using the SciPy library (Virtanen et al., 2020) in Python version 3.12.3. Furthermore, a multiple linear regression analysis was performed to assess the impact of various predictor variables on FN2O by applying an OLS.
Table 1Seasonally averaged values of temperature (°C), salinity (PSU), Chlorophyll a (Chl a; µg L−1), dissolved oxygen (DO; µmol kg−1), apparent oxygen utilization (AOU; µmol kg−1), nitrate (µM), nitrite (µM), silicate (µM), dissolved organic carbon (DOC; µM), N2O (nanomol L−1), and percentage saturation of N2O measured in samples collected from PB (Palma Bay), CA (Cabrera National Park), and CS (Cape Ses Salines). Variability is represented as ± standard deviation.
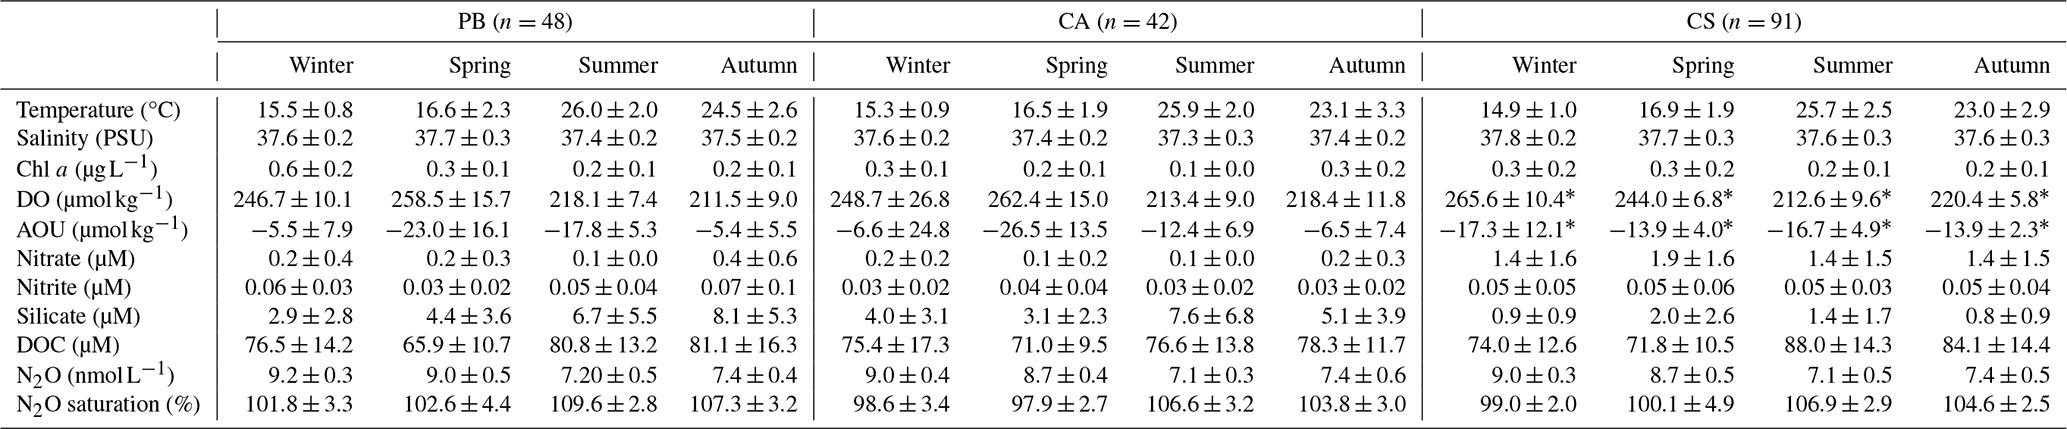
∗ DO data are only available from August 2022 at the CS station. N2O saturation percentages differ significantly from 100 %, as evaluated by a t test (p > 0.005).
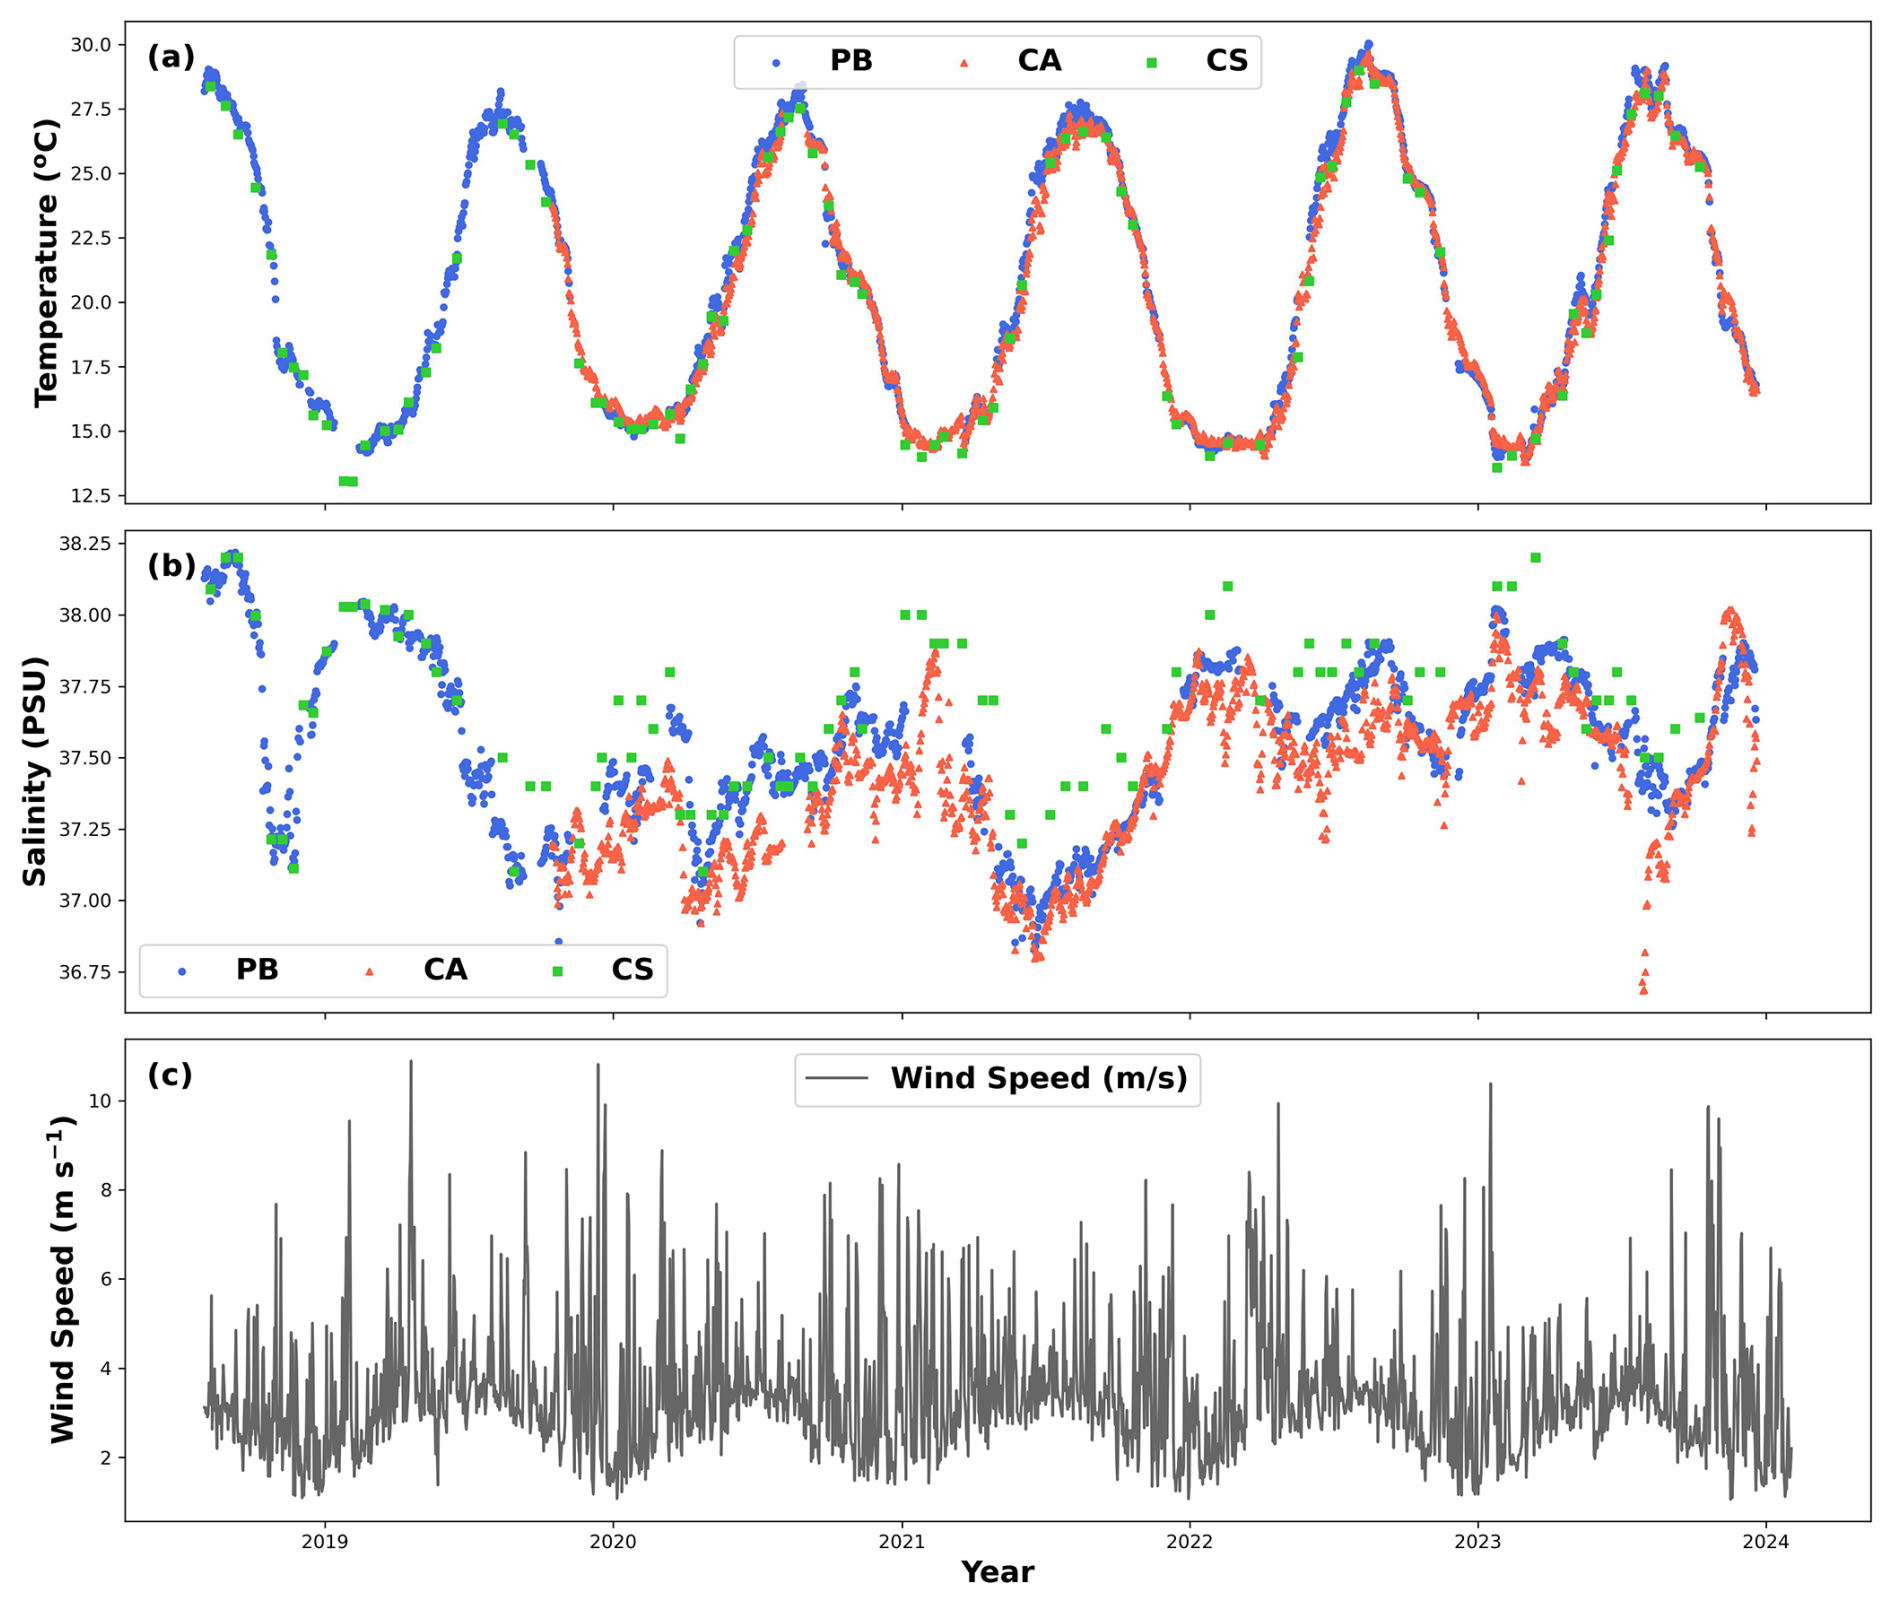
Figure 2Time series of (a) daily averaged temperature (°C) for PB (blue dots) and CA (red dots) stations, as well as instantaneous values for the CS site (green dots). (b) Daily averaged salinity (PSU) for the PB (blue dots) and CA (red triangles) stations, along with instantaneous values for the CS site (green squares). (c) Daily averaged wind speed (m s−1) at 10 m height from the Palma station (Spain). Data for PB, CA, and CS were collected at depths of 1, 4, and 0.5 m, respectively. Figures were created using Python software version 3.12.3.
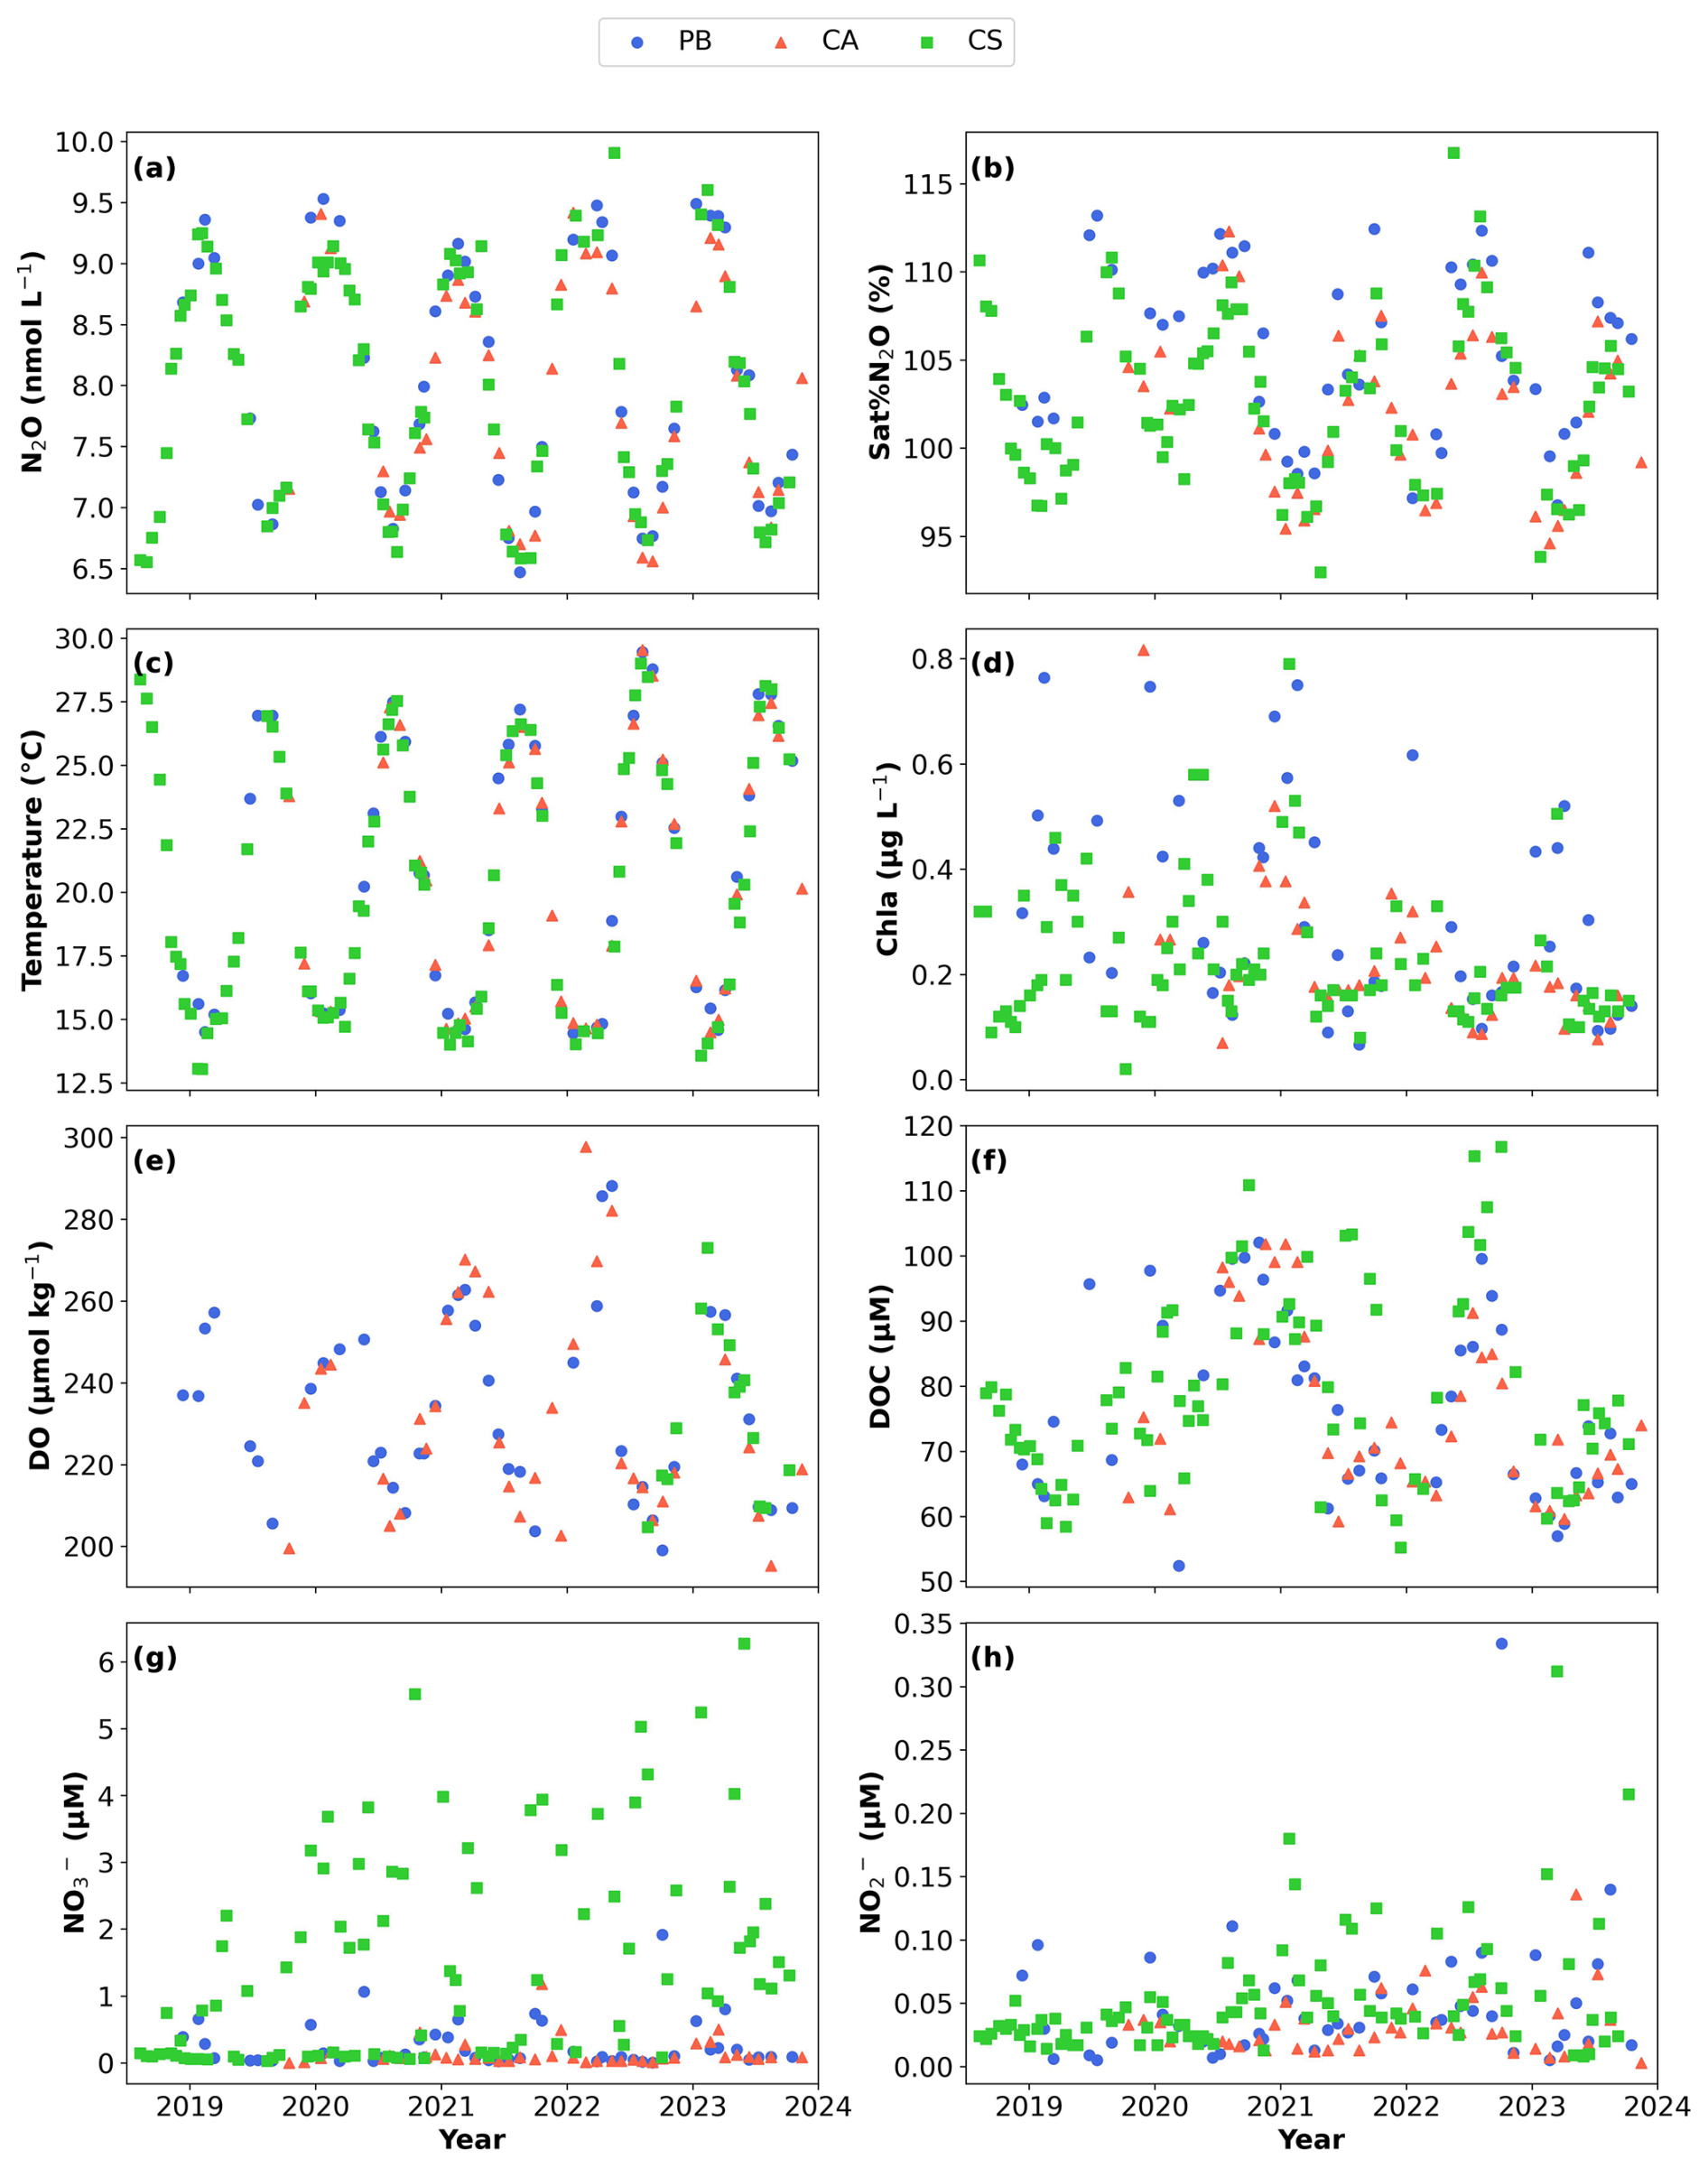
Figure 3Time series of (a) nitrous oxide (N2O) concentrations in nmol L−1, (b) N2O saturation percentage (Sat % N2O, %), (c) temperature (°C), (d) Chlorophyll a (Chl a) in µg L−1, (e) dissolved oxygen (DO) in µmol kg−1, (f) dissolved organic carbon (DOC) in µM, (g) nitrate () in µM, and (h) nitrite () in µM as measured in the samples collected from PB (blue dots), CA (red triangles), and CS (green squares). Data for PB, CA, and CS were collected at depths of 1, 4, and 0.5 m, respectively. Figures were developed with the Python software version 3.12.3.
3.1 Environmental variables description
The observed seawater temperature patterns during the study period reflect the climatic characteristics of the Mediterranean region, with peak temperatures being recorded in summer (June–August), notably reaching their maximum in August 2022 at 30.3, 29.9, and 29 °C at the PB, CA, and CS sites, respectively (Figs. 2a and 3c and Table 1). Conversely, minimum temperatures recorded during winter (December–February) were 13.7 °C in 2023 for PB, 13.04 °C in 2023 for CA, and 13 °C in 2019 for CS. Over the entire study period, average (± standard deviation) temperature values stood at 20.9 ± 5.1, 20.7 ± 4.9, and 20.4 ± 5.0 °C for PB, CA, and CS, respectively, with no statistical differences between sites (p > 0.05, Table 1), but variability was denoted between months and years (p < 0.005, Table 1).
Surface salinity levels showed significant differences between sites (p < 0.005 with CS values), months (p < 0.005), and years (p < 0.05), maintaining average values of 37.5 ± 0.2 practical salinity units (PSU) for PB, 37.4 ± 0.2 PSU for CA, and 37.7 ± 0.3 PSU for CS. The highest salinity levels were recorded during the summer of 2018 at PB (38.2 PSU), during the winter of 2023 at CA (38.0 PSU), and during both the summer of 2018 and the winter of 2023 at CS (38.2 PSU) (Fig. 2b, Table 1). The differences in the factory precision of the sensors that measure conductivity – and, thus, salinity – could explain the variations observed between the CS, PB, and CA stations in terms of salinity.
Wind speed measurements taken at a height of 10 m displayed a noticeable seasonal trend (Fig. 2c). However, no statistical differences were found between years and months (p > 0.05). The highest average values occurred during spring (March–May), averaging around 3.7 ± 0.4 m s−1, and decreased during winter to 2.9 ± 0.5 m s−1 over the study period. Maximum peak values were recorded in December and January, reaching levels of up to 19.9 m s−1.
DO levels showed distinct seasonal patterns across all stations, with the highest values being recorded in spring (up to 300 µmol kg−1) and the lowest being recorded during late summer, particularly at CA, reaching around 195 µmol kg−1. Average DO concentrations were similar at PB and CA at 233.5 ± 22.0 and 231.8 ± 25.3 µmol kg−1, respectively, while limited data were available for CS. AOU values were primarily negative, indicating net photosynthetic production. Nutrient concentrations displayed spatial and temporal variability. concentrations ranged from 0.1 to 6.3 µM, with higher values being observed at CS (average 1.5 ± 1.5 µM) compared to at PB and CA. levels were generally low (0.1–0.3 µM) but exhibited significant interannual differences. DOC showed seasonal variation, with values ranging from 52 to 116 µM, with the highest values in summer and lower concentrations in winter (Table 1).
3.2 Nitrous oxide and related biogeochemical variables
Over the monitored period from 2018 to 2023, dissolved N2O concentrations exhibited a seasonal pattern (p < 0.005, Fig. 3a), ranging from 6.5 to 9.9 nmol L−1, with no significant differences between stations and years (p > 0.05). The highest concentrations were recorded during winter, averaging 9.0 ± 0.2 nmol L−1 (with a peak in February), followed closely by autumn (September–November) at 8.2 ± 0.6 nmol L−1 and spring at 7.9 ± 0.7 nmol L−1 (Table 1). In contrast, the lowest values were observed in summer, averaging 6.9 ± 0.2 nmol L−1, with the minimum recorded in August 2021 at PB. The opposite trends were noted in Sat % N2O percentages, with maximum values in summer and autumn and minimum values in winter, ranging from 93 % to 116.7 % (Fig. 3b).
Chl a followed a distinct seasonal pattern (Fig. 3d, Table 1), with significant differences being observed between sites, years, and months (p < 0.005). In January, we recorded the highest productivity, with a mean Chl a value of 0.4 ± 0.2 µg L−1, while May showed the lowest productivity at 0.2 ± 0.05 µg L−1. PB exhibited the highest levels at 0.3 ± 0.2 µg L−1, whereas CA (0.2 ± 0.2 µg L−1) and CS (0.2 ± 0.1 µg L−1) displayed comparable concentrations. In 2019, all stations showed the strongest Chl a signal (Fig. 3d).
DO presents significant monthly differences observed across all stations (p < 0.005, Fig. 3e and Table 1). During the spring, DO levels peaked at up to 300 µmol kg−1, while at the end of the summer, minimum values around 160 µmol kg−1 were recorded, particularly at the CA site. The average levels from 2018 to 2023 were consistent between PB and CA at 233.5 ± 22.0 and 231.8 ± 25.3 µmol kg−1, respectively. In contrast, only limited sensor data were available for CS (Fig. 3e, green dots). However, it is well-known that relevant oxygen production in the area is closely related to the presence of seagrass meadows, dominated by the endemic species Posidonia oceanica, as previously noted by Agueda-Aramburu et al. (2024) for the precise CA station location of this study.
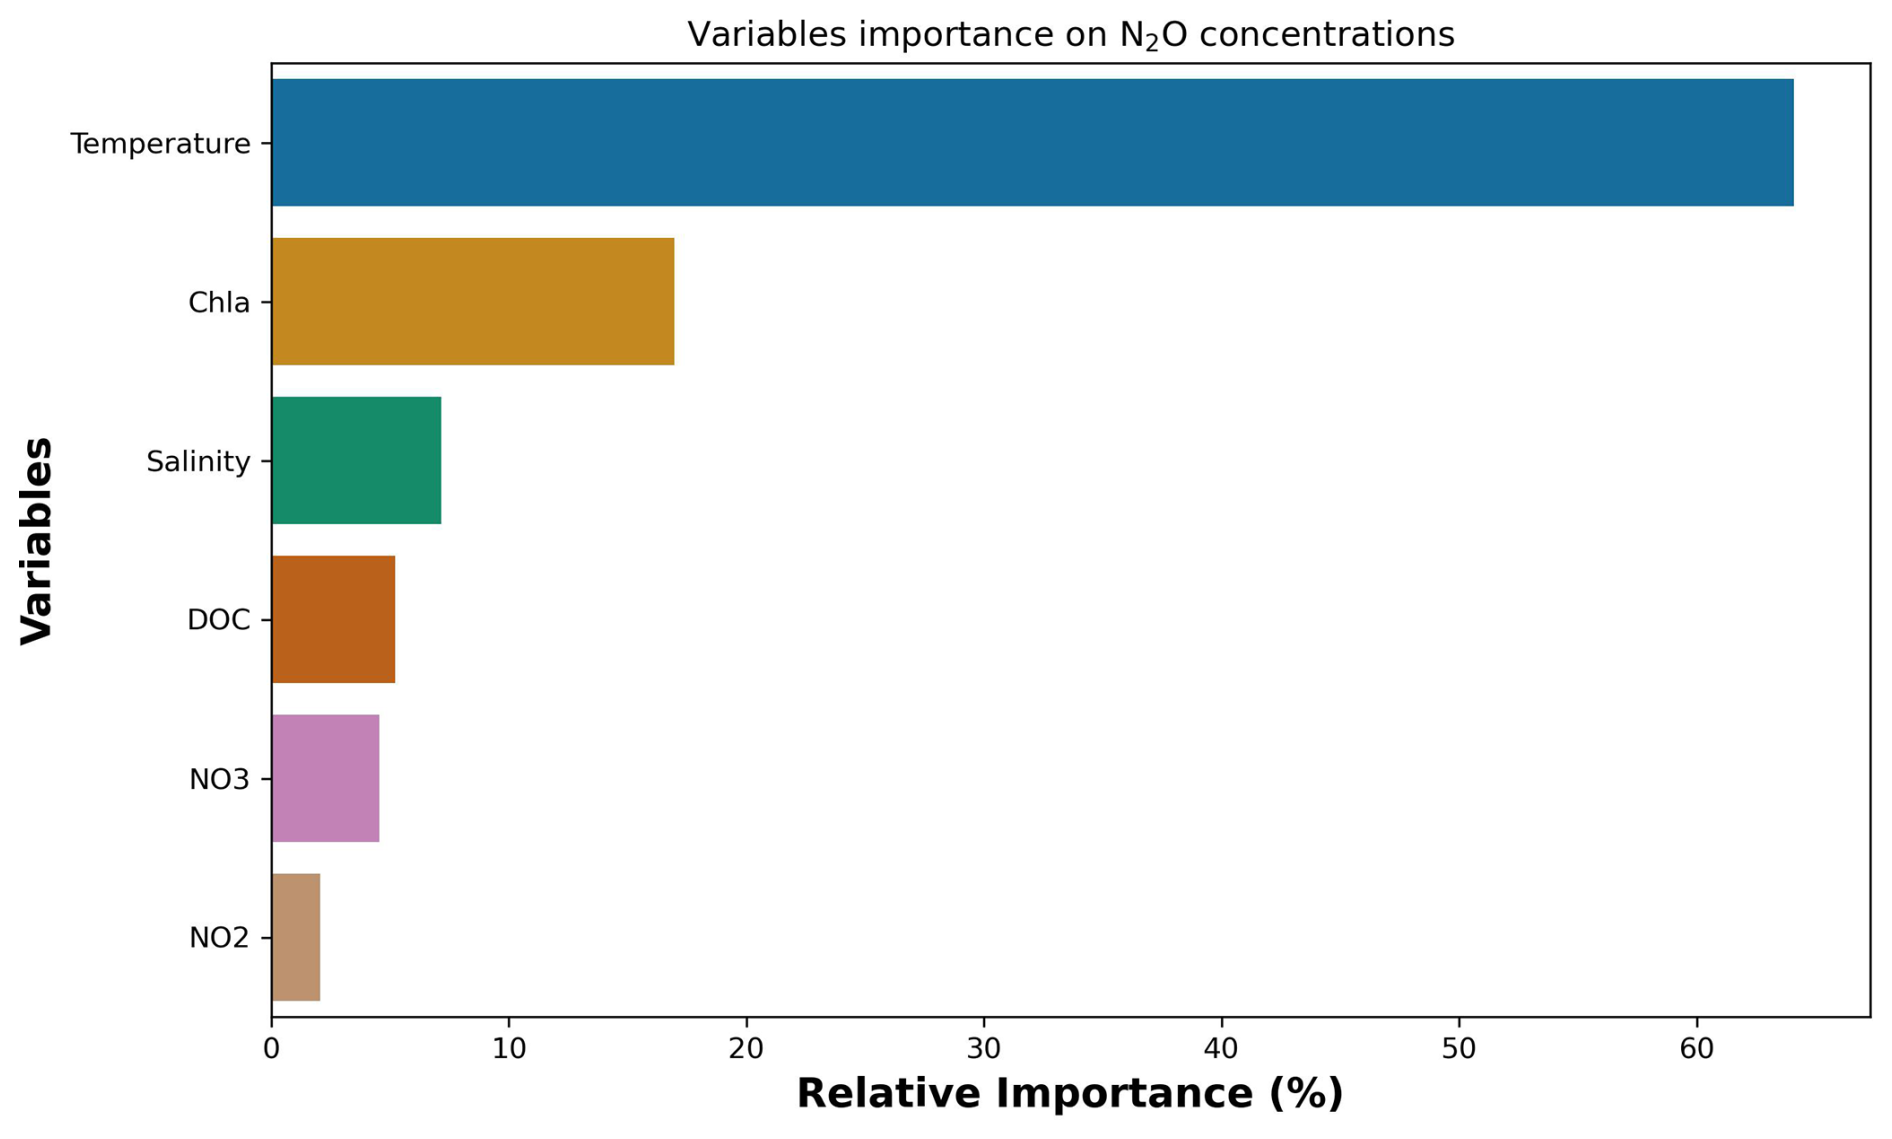
Figure 4The relative importance of the leading environmental and biogeochemical variables driving the variability of nitrous oxide concentration variability analysed through cross-valued boosting (CVB). These are, in decreasing order, temperature, Chlorophyll a (Chl a), salinity, dissolved organic carbon (DOC), nitrate (NO3), and nitrite (NO2). The figure was developed using Python software version 3.12.3.
AOU values were predominantly negative (Table 1), with average values of −14.1 ± 12.0, −11.9 ± 15.3, and −15.1 ± 4.9 µmol kg−1 for the PB, CA, and CS sites, respectively. The negative AOU levels indicate that the DO produced by the excess of photosynthesis compared to respiration, which aligns well with the organic matter content observed from the DOC data (Fig. 3f). In the coastal Balearic Sea, DOC showed similarities between sites and years (p > 0.05), with significant differences among months (p < 0.05). During the summer season, the highest average levels of 83.9 ± 0.9 µM were recorded, while winter exhibited the lowest at 73.8 ± 1.5 µM (Fig. 3f, Table 1). Variability in DOC data was notable in spring and autumn, with average values of 76.0 ± 5.9 and 76.6 ± 3.1 µM, respectively.
levels ranged from 0.1 to 6.3 µM during the study period, showing no significant differences between months but significant differences between years (p < 0.005) and sites (p < 0.005). CS exhibited the highest levels, with an average of 1.5 ± 1.5 µM, followed by PB with 0.3 ± 0.4 µM, while CA had the lowest at 0.1 ± 0.2 µM (Fig. 3g, Table 1). concentrations were significantly different between years (p < 0.005; Fig. 3h, Table 1) and between stations (p < 0.05 for CA; Table 1), with total average values of 0.03 ± 0.02, 0.05 ± 0.05, and 0.07 ± 0.06 µM for CA, PB, and CS, respectively.
The analysis of the effects of environmental and biogeochemical variables on N2O concentrations through the CVB revealed only seven main parameters associated with the variability of N2O concentrations (Fig. 4). These parameters, in order of importance, were temperature (65 %), Chl a (17 %), salinity (7 %), DOC (5 %), (4 %), and (2 %).
Temperature values, the first variable modelling N2O concentrations, exhibited a strong linear decreasing correlation with N2O levels, with p < 0.005 and an R2 value of 0.94 for all evaluated stations (not shown). The solubility of N2O declines in warmer waters, which explains the observed maximum and minimum seasonal patterns of N2O, primarily governed by the thermodynamic effects of temperature on N2O concentrations. This strong correlation reflects the thermodynamic influence of temperature on N2O solubility and its broader role in regulating stratification and microbial activity. The Sat % N2O used here as a proxy for the biological consumption and production of N2O shows a positive linear correlation with temperature (p < 0.005 and an R2 value of 0.59; Fig. 5). This positive correlation is anticipated since the microbial activities of nitrification and denitrification are expected to increase with rising temperatures, leading to greater N2O production (Wu et al., 2018). However, our results indicate that the seasonality control of N2O by thermodynamic solubility surpassed the enhancement of microbial activity. The dominant role of temperature observed here aligns with previous large-scale coastal assessments (e.g. Yang et al., 2020), which identified temperature as a key variable influencing both gas solubility and microbial turnover, particularly in surface waters affected by seasonal thermal stratification.
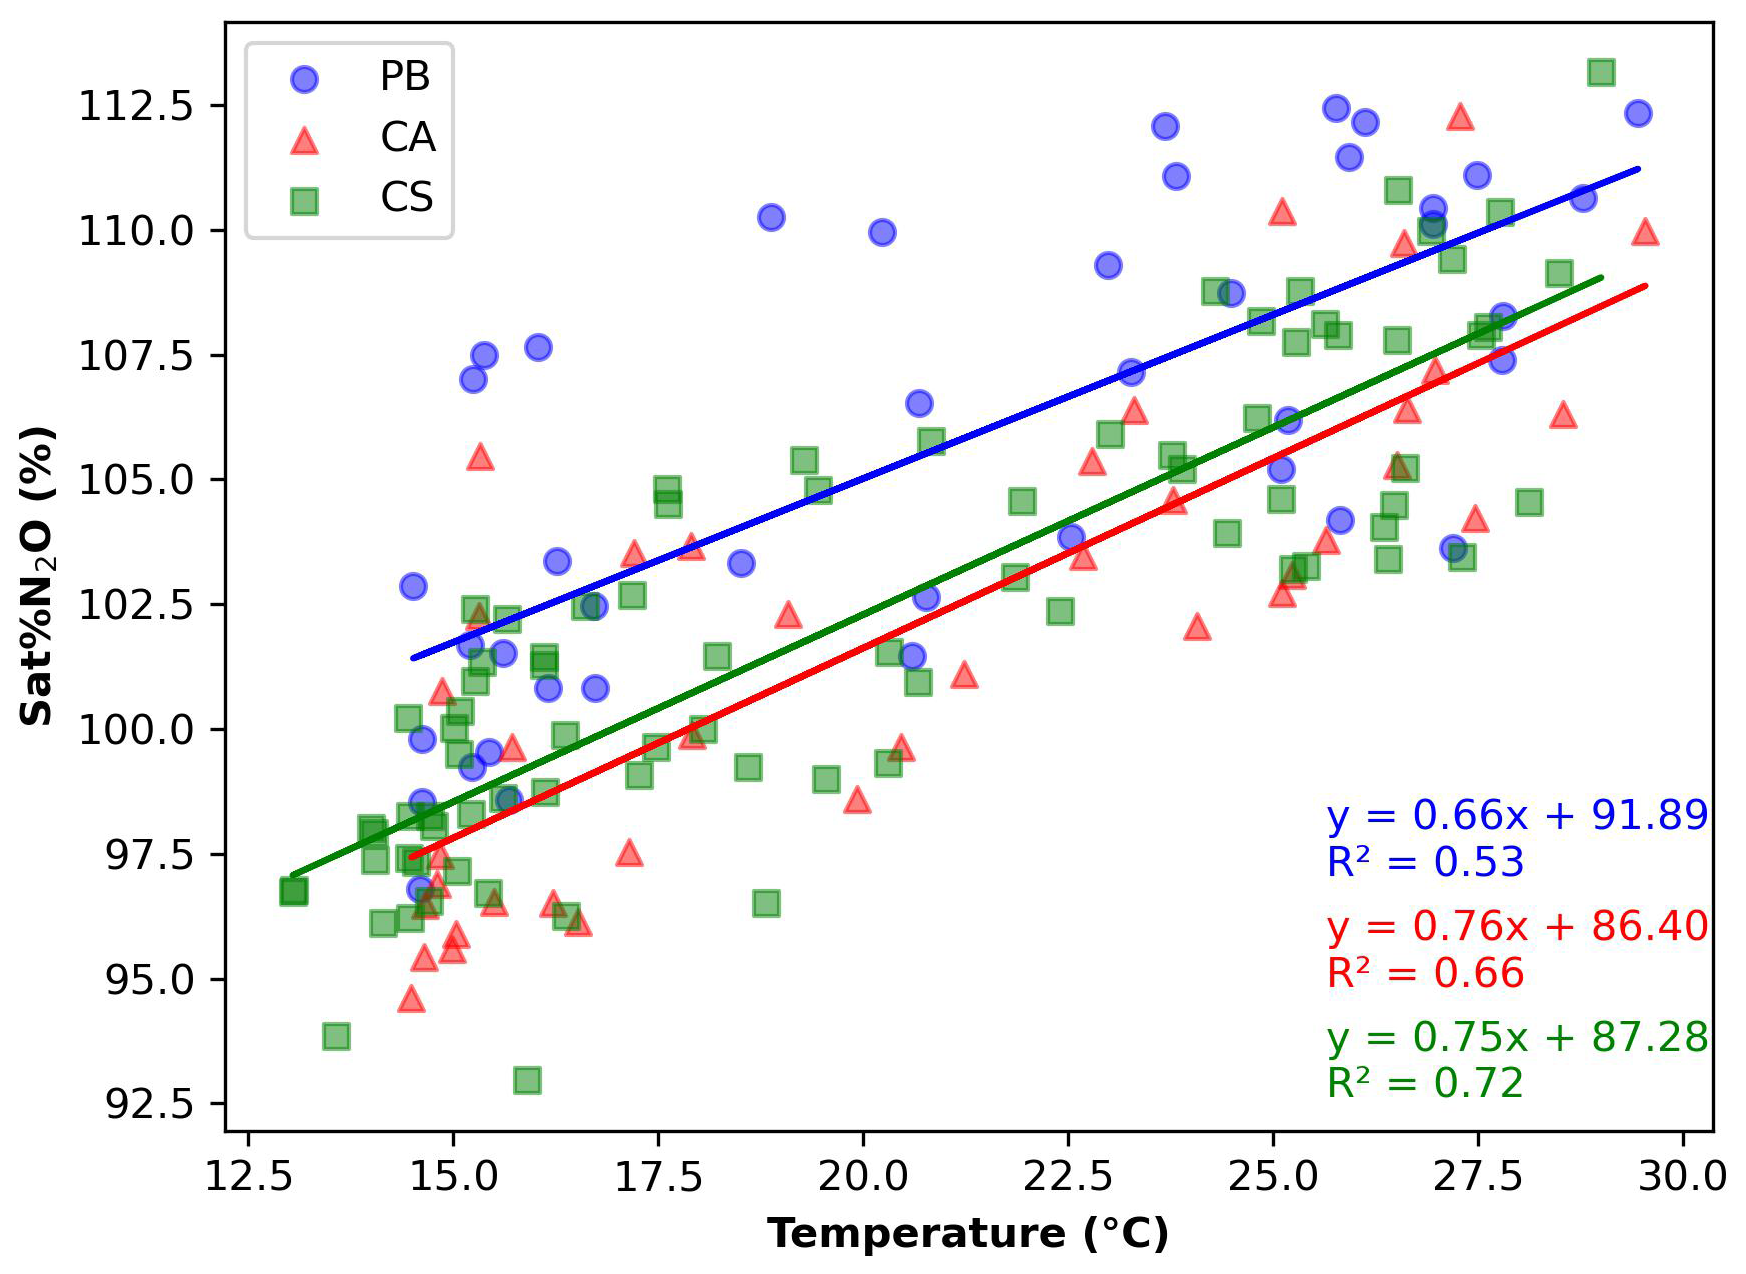
Figure 5Linear relation saturation percentage of N2O (Sat % N2O) versus temperature (°C) from the data obtained at PB (blue dots), CA (red triangles), and CS (green squares). Linear equations are represented in blue for PB, red for CA, and green for CS stations. Figures were developed with the Python software version 3.12.3.
The DO availability and the predominance of negative AOU levels, with no correlation to Sat % N2O (p > 0.05, R2 = 0.002), suggest that in situ N2O production makes a minor contribution to the observed temporal variability of N2O concentration. Overall, the low significance of predictors in the CVB analysis, such as Chl a, DO, DOC, , and , is consistent with limited N2O production from nitrification, which is associated with the seasonal remineralization cycle of organic matter, particularly enhanced under high-productivity conditions. This interpretation aligns with previous studies in coastal and shelf environments that also reported low N2O accumulation under oxygenated and nutrient-limited conditions (e.g. Babbin et al., 2015; Lin et al., 2016). These conditions can suppress canonical N2O production through nitrification and denitrification, emphasizing the sensitivity of microbial N2O cycling to ambient redox and substrate gradients.
DOC and Chl a also contribute to the availability of organic substrates and oxygen fluctuations, shaping microbial N2O dynamics, especially under stratified or high-productivity conditions. In fact, DOC enrichment has been linked to elevated heterotrophic activity and subsequent shifts in nitrogen cycling pathways in productive coastal areas (Herbert, 1999), potentially influencing the balance between N2O production and consumption. Microbial production by nitrification and denitrification are generally considered to be the dominant pathways of N2O biological production in the shelf sea and open ocean (Burgos et al., 2017; Chen et al., 2021; de la Paz et al., 2024; Sierra et al., 2020). However, in the oxygenated coastal Balearic Sea waters, near-equilibrium values for Sat % N2O and low and concentrations (Figs. 3b, g, and h and 5, Table 1) suggest a negligible contribution from pelagic nitrification. Nevertheless, variability may still indicate diffuse anthropogenic inputs, potentially enhancing local nitrification under favourable conditions. While benthic N2O fluxes were not measured during this study due to logistical constraints, their contribution cannot be dismissed. A follow-up study is being conducted to evaluate potential sediment-derived N2O inputs at the same study sites.
In addition, the CVB analysis identifies Chl a as the second driver explaining the observed variability in N2O concentrations. The seasonal cycle of Chl a is closely coupled to that of N2O, with maximum values in winter and minimum values in summer. A hypothetic mechanism that could be contributing to the N2O concentration variability at our study site is the poorly described production of N2O by epipelagic photosynthetic organisms in the light through NO reduction. Given the low and concentrations, the lack of correlation between AOU and N2O, and the seasonal coupling between Chl a and N2O peaks, we propose that an additional, non-canonical pathway may contribute to N2O production in our system. Recent studies have identified a light-dependent mechanism in which marine photosynthetic organisms, including green algae and cyanobacteria, reduce intracellular nitric oxide (NO) to N2O, potentially as a detoxification strategy under fluctuating nitrogen conditions or during photosynthetic stress. This NO reduction pathway involves the activity of flavodiiron proteins (FLVs) or other reductases and may become relevant in oxygenated, nutrient-depleted surface waters with active phytoplankton populations (Burlacot et al., 2020). While our dataset does not allow for direct confirmation of this process, the observed seasonal patterns and weak traditional N2O signals warrant further consideration of this alternative mechanism, especially in coastal systems dominated by epipelagic productivity.
Finally, significant unexpected negative linear correlations (p < 0.05) were found between N2O concentrations and silicate only at the PB and CA sites (Table 1), with correlation coefficients of −0.41 and −0.34, respectively. This relationship and the differences in salinity values between PB and CA compared to CS may indicate the presence or absence of groundwater input pulses in these areas (Basterretxea et al., 2010; Sospedra et al., 2018), which can affect N2O concentrations in specific coastal regions (Calvo-Martin et al., 2024). Since this relationship was only observed at two of the three stations considered, this parameter was excluded from the CVB analysis. Together, these factors illustrate a multifactorial control of N2O production and accumulation in the coastal Balearic Sea, where solubility, productivity, and nutrient inputs act in combination.
An OLS regression was conducted to evaluate the relationship among the three variables with the highest relative importance for N2O concentrations (importance > 5 %), accounting for 89 % of the variability (temperature, Chl a, and salinity; Fig. 4) identified in the CVB analysis. The resulting equation is as follows: N2O = 7.42 − 0.18 ⋅ temperature + 0.28 ⋅ Chl a + 0.11 ⋅ salinity (R2 = 0.94), with a p value of < 0.005 for temperature and p values of 0.07 for Chl a and 0.152 for salinity.
To resolve the nonlinear dependency of Chl a and salinity on N2O concentrations, a GAM was applied, explaining 96 % of the response variable, with a p value of < 0.005 for temperature, < 0.05 for Chl a, and 0.1390 for salinity (see Fig. S2b–c in the Supplement). The non-significance of salinity may be due to the fact that GAM smooth terms are designed to capture broader, nonlinear effects. In this case, salinity may not have a robust and smooth effect, or its impact may be masked by other variables, such as temperature. Salinity also influences stratification dynamics and can indirectly affect oxygen availability and microbial processes linked to N2O. The GAM residuals ranged from −0.6 to 0.6 nmol L−1 (see the figures in the Supplement).
When compared to other temperate and subtropical coastal regions, our results support the emerging view that N2O dynamics in seagrass-dominated systems may diverge substantially from classic estuarine and shelf models, with solubility and light-driven processes playing an increasingly relevant role (Rosentreter et al., 2023; Al-Haj et al., 2021). Placing the obtained data into a global ocean context, specifically among studied coastal areas, the Balearic Sea presents N2O concentrations similar to those found in 2008 in the Bohai Sea, ranging from 7.14 to 8.32 nmol L−1 (Gu et al., 2022), but these are low in comparison to the values of upwelling and estuarine coastal areas. The maximum N2O concentrations found in this study represent approximately baseline levels for the other coastal and open-ocean areas evaluated previously (Bange, 2006; Bange et al., 1996; de la Paz et al., 2024; Yang et al., 2009; Zhang et al., 2008).
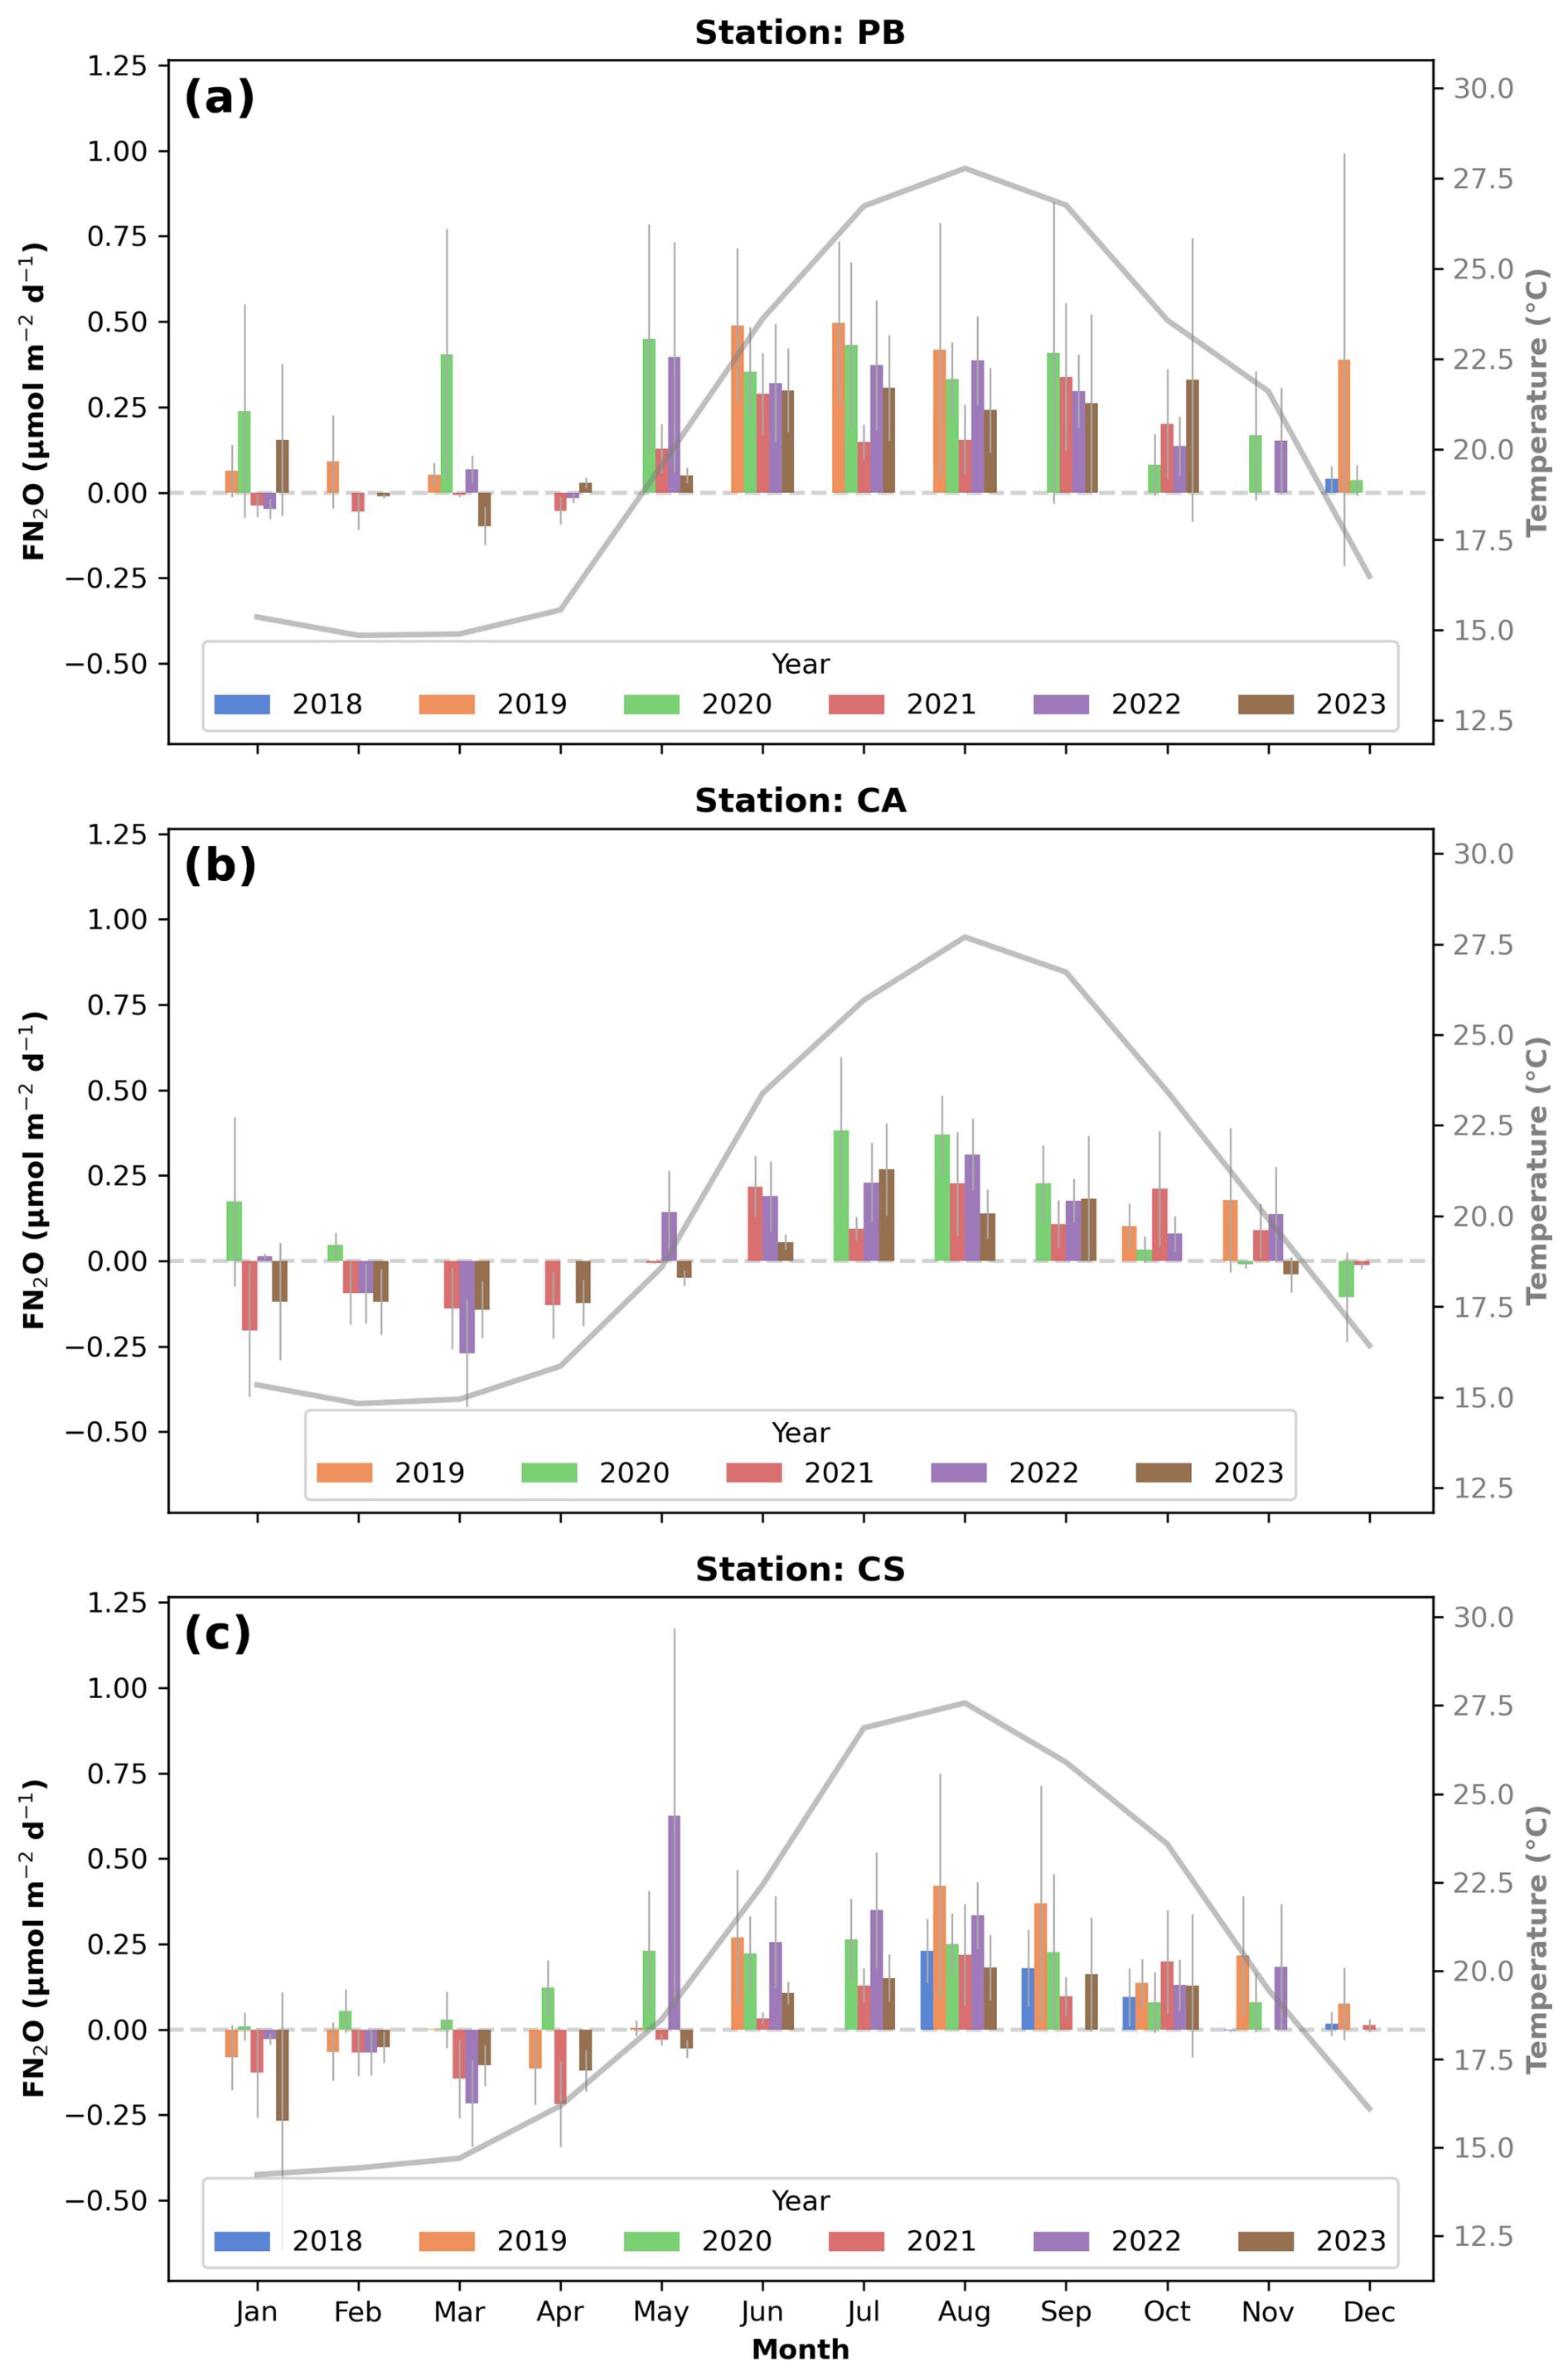
Figure 6Bar chart of monthly averaged values of air–sea nitrous oxide (N2O) transfer (FN2O) in for all study years (left axis) and averaged temperature (°C) values (right axis; grey line) for the PB (a), CA (b), and CS (c) sites. Error bars represent ± standard deviation. Analysis of individual FN2O flux measurements revealed that none differed significantly from zero (p > 0.5). Figures were developed using Python software version 3.12.3.
3.3 Air–sea N2O exchange
FN2O values ranged from −0.3 to 0.6 during the study period, indicating that the coastal Balearic Sea functions as a minor sink or is nearly in equilibrium in winter and spring and acts as a light source in summer and autumn (Fig. 6; p < 0.005), closely following the seasonal temperature variations (Fig. 6, grey line). No differences between years were observed. However, significant differences were noted between sites, with PB exhibiting the highest FN2O levels and CA showing the lowest (p < 0.05).
At the PB site, positive linear correlations were found between FN2O and temperature (R2 = 0.67; p < 0.005) and between FN2O and ΔN2O (R2 = 0.96; p < 0.005). In the OLS analysis, wind speed also appears to exert a positive influence on FN2O values, detectable only in PB data (OLS, R2 = 0.94, p < 0.05). This effect is likely to be attributable to PB site geographical characteristics as it represents an open bay, which is in contrast to the enclosed CA station in the Santa Maria Bay sampling site and the shallow coastal waters of CS.
FN2O at the most pristine station (CA) showed positive correlations with temperature (R2 = 0.79; p < 0.005), ΔN2O (R2 = 0.97; p < 0.005), and Sat % N2O (R2 = 0.97; p < 0.005).
The CS shallow site showed positive linear correlations with temperature (R2 = 0.73; p < 0.005), ΔN2O (R2 = 0.98; p < 0.005), and Sat % N2O (R2 = 0.97; p < 0.005). Salinity was also a predictive variable included in the OLS analysis (OLS, R2 = 0.96, p < 0.05) and was negatively related. This characteristic may be associated with the differences in CS salinity values compared to the other stations.
Table 2Annual N2O flux () per station since 2019 for the PB (Buoy of Palma) and CS (Cape Ses Salines) stations and from 2020 for the CA (Cabrera National Park) site, obtained using the Dobashi and Ho (2023), Wanninkhof (2014), and Cole and Caraco (1998) gas transfer parameterizations. Variability is represented as ± propagated error.
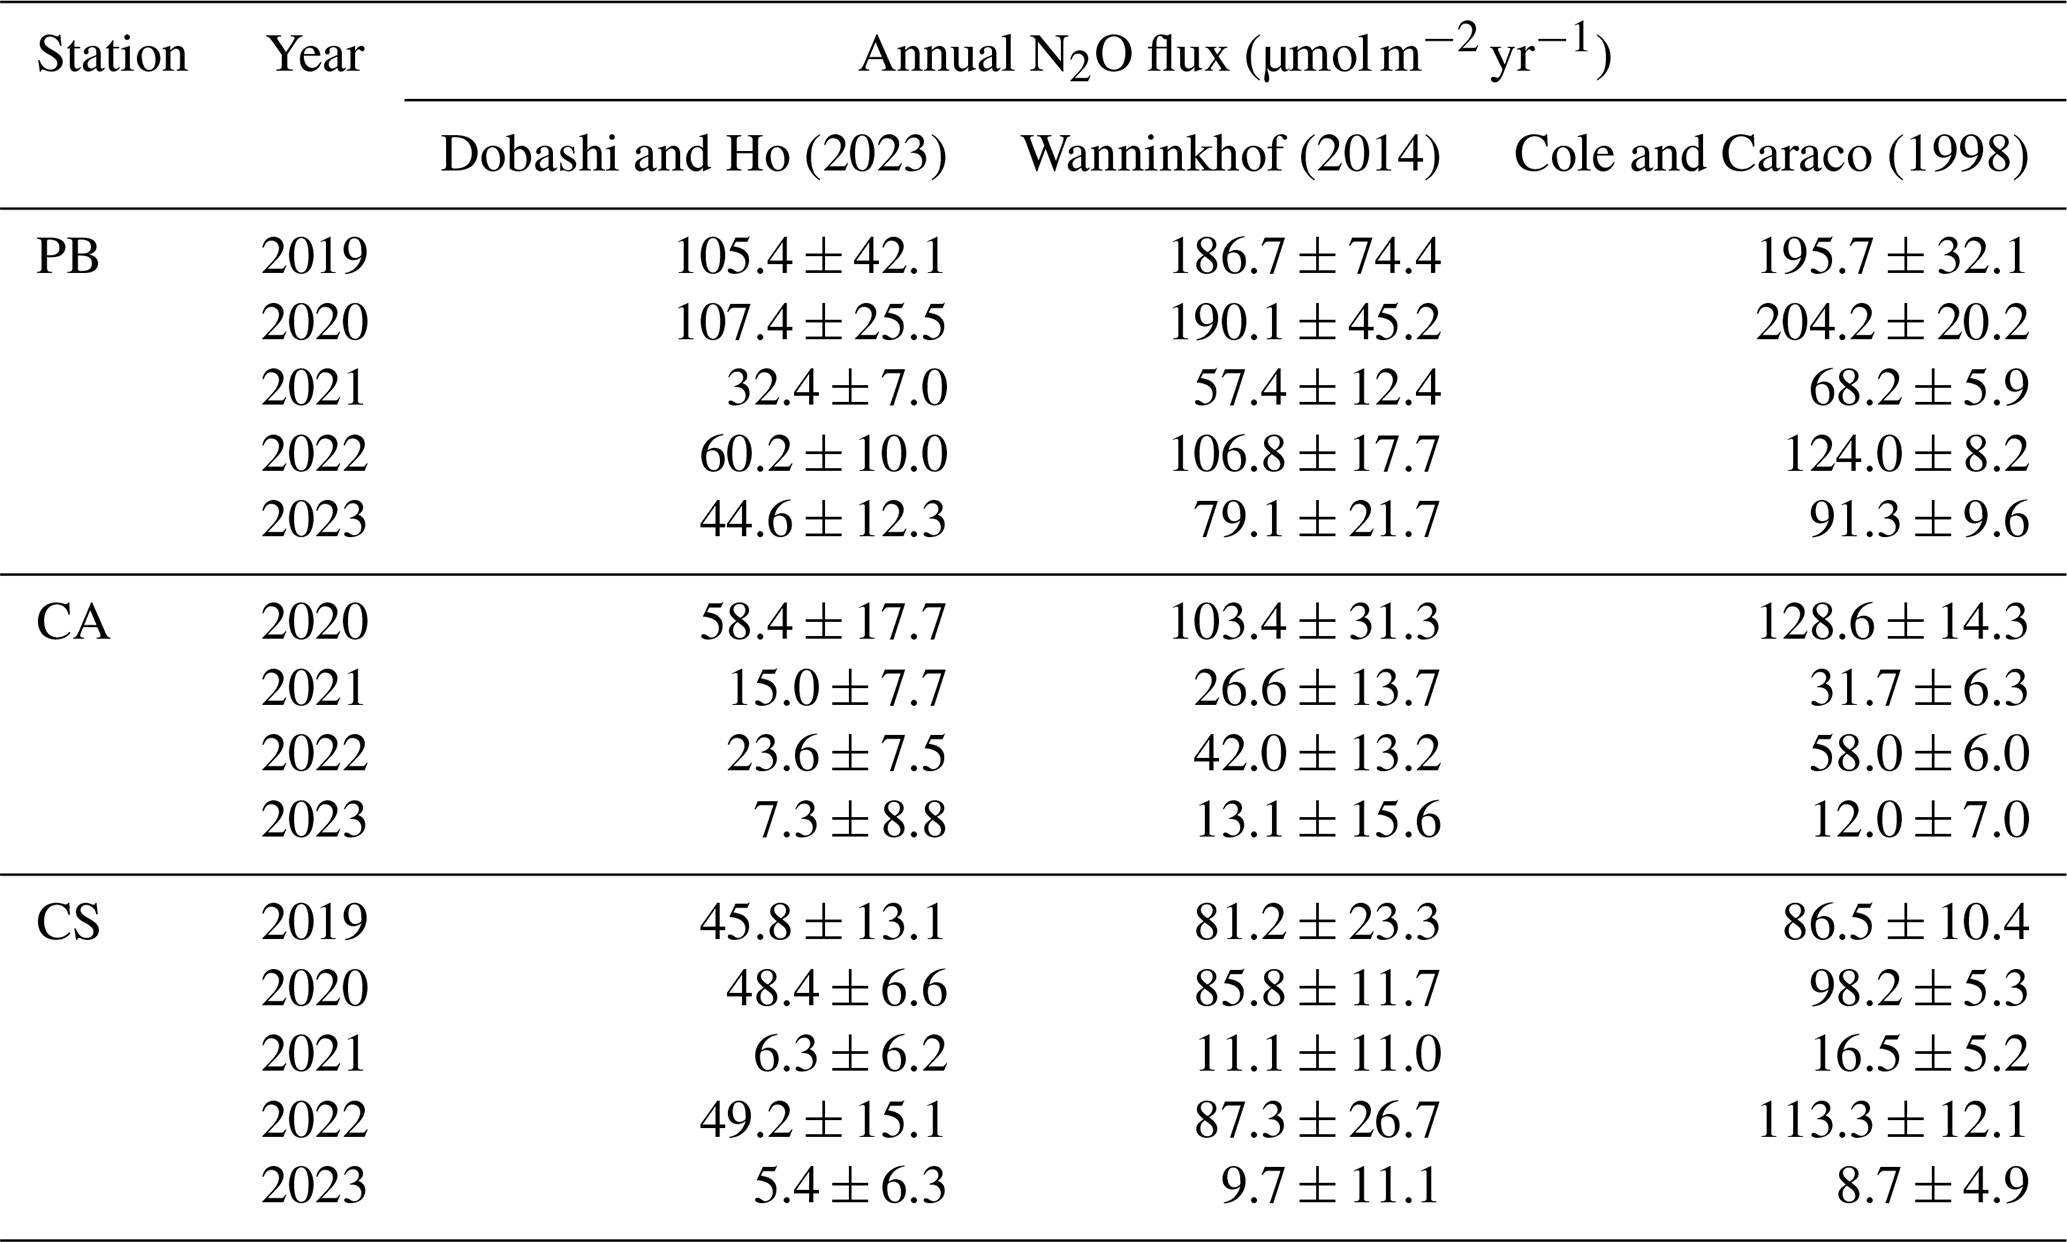
Annual average fluxes for the three sites were calculated; when monthly data were unavailable, linear interpolation was applied (Table 2). The different parameterizations for the gas transfer velocity indicate higher values using the approach of Cole and Caraco (1998), ranging from 8.7 to 204.2 , followed by results obtained with the Wanninkhof (2014) equation, which range from 9.9 to 190.1 , and the lowest values defined by Dobashi and Ho (2023), ranging from 5.4 to 107.4 (Table 2). These differences are clearly influenced by the environment since the Dobashi and Ho (2023) equation was derived from studies conducted in shallow areas at approximately 3.5 m depth, while Wanninkhof (2014) and Cole and Caraco (1998) focused on deeper ocean areas and a lake, respectively. However, since the benthic zone of this study is heavily covered with P. oceanica seagrass meadows and because the fetch area is limited, we opted to retain the equation of Dobashi and Ho (2023) for the primary results.
Similar low air–sea N2O fluxes have also been reported in shallow vegetated environments, such as seagrass-dominated coastal lagoons in Australia (Rosentreter et al., 2023), where negative or near-zero fluxes reflect the combined effects of high primary production, oxygenation, and limited nitrogen availability. In contrast, higher fluxes, often exceeding 1 , are typical of eutrophic estuaries or upwelling regions (Bange, 2006; Zhang et al., 2008), highlighting the relatively pristine nature of the Balearic coastal zone.
The results showed that all the stations are significantly neutral with regard to N2O emissions to the atmosphere. However, notably higher values were detected at the PB station, as seen in the daily FN2O values (Fig. 6). PB exhibited significant interannual variability during the study period (Table 2). The CS and CA sites followed the same trend as the PB station but had considerably lower values, particularly for CA. Observed annual N2O fluxes in the Balearic Sea are much lower than the expected ranges for this ocean region, as described by Resplandy et al. (2024) based on global reconstruction products from 1985 to 2018 (Yang et al., 2020). These differences may relate to the substantial variability in local N2O fluxes in coastal areas with vegetation. Coastal regions with seagrass meadows are expected to exhibit the lowest N2O flux ranges (Rosentreter et al., 2023). These areas are considered to be negligible sources (Al-Haj et al., 2021) or sinks in near-pristine seagrasses, leading to significantly biased coastal global estimations (Chen et al., 2022). These low fluxes can be partly attributed to the biogeochemical effects of seagrass meadows. Furthermore, elevated rates of primary production reduce the availability of inorganic nitrogen in the water column, thereby limiting N2O generation. Additionally, the dense root systems and organic exudates of seagrass meadows support microbial communities that further facilitate N2O consumption under oxic conditions (Rosentreter et al., 2023; Al-Haj et al., 2021). Collectively, these mechanisms contribute to the role of vegetated coastal systems as potential N2O sinks.
These observations place the Balearic Sea at the lower end of the global N2O flux spectrum for coastal systems. For example, in the East China Sea and Pearl River Estuary coastal areas, fluxes ranged from 5 to 17 (Zhang et al., 2008; Lin et al., 2016), often driven by hypoxia and strong anthropogenic nitrogen inputs – conditions absent in our study area.
Considering the fact that European seagrasses represent approximately 6 % of global seagrass cover and that most of this is found in the Mediterranean Sea (Jordà et al., 2012), it is crucial to understand more about the drivers of N2O formation, consumption seasonality, and transport pathways. Additionally, increasing the number of observations is vital since N2O data in the Mediterranean Sea are limited. Furthermore, we must consider the ongoing coastal eutrophication linked to anthropogenic inputs from estuaries, sewage discharge from densely populated coastal areas, and industrial effluents that may significantly alter seagrass habitats, along with current emissions of N2O from coastal zones (Bakker et al., 2014).
The low N2O fluxes observed in our study are in line with recent assessments that emphasize the underestimated climate mitigation potential of seagrass meadows and vegetated coastal habitats (Al-Haj et al., 2021; Chen et al., 2022). Therefore, understanding the ecological conditions that suppress N2O emissions in these systems is crucial for refining regional and global GHG budgets.
As coastal N2O emissions are assumed to offset 30 %–58 % of the net CO2 coastal uptake radiative effect (Resplandy et al., 2024), estimating the water N2O emission-based global warming potential (GWP) can provide a clear picture by comparing it with existing data on CO2 and methane fluxes in the area (Flecha et al., 2023). By following the Intergovernmental Panel on Climate Change (IPCC) Assessment Report 6 (Arias et al., 2021) updated 100-year GWP, we obtained the (i.e. the 100-year time-integrated radiative forcing from the instant release of 1 kg of N2O is 273 times larger than the forcing of 1 kg of CO2).
In the coastal Balearic Sea, considering an area 1 km offshore and 1428 km in coastal longitude, the average obtained in this study is 8.1 × 10⁷ ± 5.7 × 10⁷ Pg CO2-eq yr−1 for all sites from 2020 to 2022, which was the period with the most available data. This area estimate was used as a first-order approximation of the active N2O exchange zone in the Balearic region, following a similar approach to other regional-scale studies (e.g. Resplandy et al., 2024; Rosentreter et al., 2023). It encompasses both vegetated and non-vegetated shallow coastal habitats and is not intended to represent specific benthic types. Therefore, it reflects a conservative estimate of the total coastal footprint, acknowledging that further habitat-specific refinement would improve spatial resolution. The associated uncertainty in the GWP estimate incorporates the observed variability in fluxes across sites and seasons.
N2O concentrations in seawater during the study period ranged from 6.5 to 9.9 nmol L−1 without significant differences between the three sampling sites. Several drivers dominated the variability of N2O concentration, with temperature being the most essential factor, followed by the less critical Chlorophyll a and salinity. Even with the possible biological implications in N2O formation, atmospheric forcing may control the surface concentrations in this area. Averaged estimated N2O fluxes oscillated between −0.3 and 0.6 , with the most influenced stations showing the highest N2O fluxes. Some sites appear to be weak sources of N2O, although many fluxes are close to equilibrium and are not significantly different from zero, following a robust seasonal pattern throughout the sampling period. Reducing anthropogenic pressures in coastal regions is crucial to preserving marine ecosystems as increasing human impacts, such as pollution, overfishing, and habitat destruction, can lead to irreversible damage, loss of biodiversity, and the degradation of vital ecosystem services. If these pressures continue to escalate, future projections indicate more frequent and severe environmental crises, including increased coastal erosion, declining fish stocks, and heightened vulnerability to climate change, threatening marine life and human coastal communities. There is a strong need to enhance observations of the GHG N2O in coastal areas to better understand dominant drivers and to make more accurate predictions of future consequences under additional anthropogenic impacts. Moreover, the values presented for the coastal Balearic Sea will aid in improving global N2O emission budgets in coastal vegetated areas overall.
Data were obtained from the MetOcean Data Repository of the Balearic Islands Coastal Observing and Forecasting System (SOCIB). Data from the instruments on the Palma Bay Station platform (https://doi.org/10.25704/s6jb-ck61, Tintoré and Casas, 2022) were consulted on 30 January 2024. Data are also available through Hendriks et al. (2023, https://doi.org/10.20350/digitalCSIC/15491), and Hendriks et al. (2025, https://doi.org/10.20350/digitalCSIC/17284).
The supplement related to this article is available online at https://doi.org/10.5194/os-21-1515-2025-supplement.
IEH, JT, and SF conceptualized the research, data acquisition approach, and methodology. IEH, SF, MdlP, CM, and EAF collected the samples and conducted the measurements. SF, MdP, and IEH analysed the data, while SF wrote the paper draft. All of the authors reviewed and edited the paper.
The contact author has declared that none of the authors has any competing interests.
Publisher's note: Copernicus Publications remains neutral with regard to jurisdictional claims made in the text, published maps, institutional affiliations, or any other geographical representation in this paper. While Copernicus Publications makes every effort to include appropriate place names, the final responsibility lies with the authors.
We express our gratitude to the Cabrera National Park staff for facilitating the work done during this study and to the staff of the Balearic Islands Coastal Observing and Forecasting System (SOCIB) for their invaluable assistance and for the use of their fixed station in the Bay of Palma. We thank Juan Mártinez-Ayala (SOCIB) for their support with the sample collection and analysis. This work contributes to CSIC Thematic Interdisciplinary Platform PTI OCEANS+. We appreciate the AQUANITROMET service of the Instituto Investigaciones Marinas for conducting the methane analyses, and we thank the Agencia Estatal de Meteorología (AEMET) for providing the meteorological data.
Funding for this work was provided by the Spanish Ministry of Science (SumaEco, grant no. RTI2018–095441-B-C21; CYCLE, grant no. PID2021-123723OB-C21, the Government of the Balearic Islands through la Consellería d'Innovació, Recerca i Turisme (Projecte de recerca científica i tecnològica SEPPO, grant no. PRD2018/18), and the 2018 call of the BBVA Foundation “Ayudas a equipos de investigación científica” for the Posi-COIN project. Susana Flecha acknowledges the financial support of the “Margalida Comas-2017” and “Vicenç Munt Estabilitat-2022” postdoctoral contracts, as well as grant no. AAEE111/2017 from the Balearic Islands Government. Susana Flecha is staff hired under the Generation D initiative, promoted by Red.es, an organization attached to the Ministry for Digital Transformation and the Civil Service, for the attraction and retention of talent through grants and training contracts financed by the Recovery, Transformation, and Resilience Plan through the European Union's Next Generation funds. Mercedes de la Paz acknowledges the financial support during the study period for the contracts financed by the Spanish Ministry of Science under grant nos. CTM2015–74510-JIN and PTA2019–017983-I. Fiz Fernández Pérez was supported by the FICARAM+ project (grant no. PID2023 – 148924OB – l00).
The article processing charges for this open-access publication were covered by the CSIC Open Access Publication Support Initiative through its Unit of Information Resources for Research (URICI).
This paper was edited by Xinping Hu and reviewed by Chen Jian-jhih and one anonymous referee.
Agueda-Aramburu, P., Flecha, S., Lujan-Williams, C. A. M., and Hendriks, I. E.: Water column oxygenation by Posidonia oceanica seagrass meadows in coastal areas: A modelling approach, Sci. Total Environ., 942, 173805, https://doi.org/10.1016/j.scitotenv.2024.173805, 2024.
Al-Haj, A. N., Chidsey, T., Fulweiler, R. W., Rosentreter, J. A., Al-Haj, A. N., Fulweiler, R. W., Williamson, P., Laruelle, G. G., Bange, H. W., Bianchi, T. S., Busecke, J. J. M., Cai, W. J., Eyre, B. D., Forbrich, I., Kwon, E. Y., Maavara, T., Moosdorf, N., Najjar, R. G., Sarma, V. V. S. S., Van Dam, B., and Regnier, P.: Two temperate seagrass meadows are negligible sources of methane and nitrous oxide, Nat. Clim. Change, 35, 579–587, https://doi.org/10.1002/lno.12250, 2021.
Álvarez-Salgado, X. A. and Miller, A. E. J.: Simultaneous determination of dissolved organic carbon and total dissolved nitrogen in seawater by high temperature catalytic oxidation: Conditions for precise shipboard measurements, Mar. Chem., 62, 325–333, https://doi.org/10.1016/S0304-4203(98)00037-1, 1998.
Arias, P., Bellouin, N., Coppola, E., Jones, R., Krinner, G., Marotzke, J., Naik, V., Palmer, M., Plattner, G.-K., and Rogelj, J.: Climate Change 2021: The Physical Science Basis. Contribution of Working Group I to the Sixth Assessment Report of the Intergovernmental Panel on Climate Change, Technical Summary, ISBN 9781009157896, https://doi.org/10.1017/9781009157896, 2021.
Babbin, A. R., Bianchi, D., Jayakumar, A., and Ward, B. B.: Rapid nitrous oxide cycling in the suboxic ocean, Science, 348, 1127–1129, https://doi.org/10.1126/science.aaa8380, 2015.
Bakker, D. C. E., Bange, H. W., Gruber, N., Johannessen, T., Upstill-Goddard, R. C., Borges, A. V., Delille, B., Löscher, C. R., Naqvi, S. W. A., Omar, A. M., and Magdalena Santana-Casiano, J.: Air–sea interactions of natural long-lived greenhouse gases (CO2, N2O, CH4) in a changing climate, in: Ocean–Atmosphere Interactions of Gases and Particles, Springer Berlin Heidelberg, https://doi.org/10.1007/978-3-642-25643-1_3, 113–169, 2014.
Bange, H. W.: Nitrous oxide and methane in European coastal waters, Estuar. Coast Shelf S., 70, 361–374, https://doi.org/10.1016/j.ecss.2006.05.042, 2006.
Bange, H. W., Rapsomanikis, S., and Andreae, M. O.: Nitrous oxide in coastal waters, Global Biogeochem. Cy., 10, 197–207, https://doi.org/10.1029/95GB03834, 1996.
Barbier, E. B., Hacker, S. D., Kennedy, C., Koch, E. W., Stier, A. C., and Silliman, B. R.: The value of estuarine and coastal ecosystem services, Ecol. Monogr., 81, 169–193, https://doi.org/10.1890/10-1510.1, 2011.
Basterretxea, G., Tovar-Sanchez, A., Beck, A. J., Masqué, P., Bokuniewicz, H. J., Coffey, R., Duarte, C. M., Garcia-Orellana, J., Garcia-Solsona, E., Martinez-Ribes, L., and Vaquer-Sunyer, R.: Submarine groundwater discharge to the coastal environment of a Mediterranean island (Majorca, Spain): Ecosystem and biogeochemical significance, Ecosystems, 13, 629–643, https://doi.org/10.1007/s10021-010-9334-5, 2010.
Benson, B. B. and Krause Jr., D.: The concentration and isotopic fractionation of oxygen dissolved in freshwater and seawater in equilibrium with the atmosphere, Limnol. Oceanogr., 29, 620–632, https://doi.org/10.4319/lo.1984.29.3.0620, 1984.
Benson, B. B. and Krause, D.: A thermodynamic treatment of dilute solutions of gases in liquids, J. Solution Chem., 18, 803–821, https://doi.org/10.1007/BF00685061, 1989.
Bianchi, C. N. and Morri, C.: Marine biodiversity of the Mediterranean Sea: Situation, problems and prospects for future research, Mar. Pollut. Bull., 40, 367–376, https://doi.org/10.1016/S0025-326X(00)00027-8, 2000.
Burgos, M., Ortega, T., and Forja, J. M.: Temporal and spatial variation of N2O production from estuarine and marine shallow systems of Cadiz Bay (SW, Spain), Sci. Total Environ., 607–608, https://doi.org/10.1016/j.scitotenv.2017.07.021, 2017.
Burlacot, A., Richaud, P., Gosset, A., Li-Beisson, Y., and Peltier, G.: Algal photosynthesis converts nitric oxide into nitrous oxide, P. Natl. Acad. Sci. USA, 117, 2704–2709, https://doi.org/10.1073/pnas.1915276117, 2020.
Calvo-Martin, E., de la Paz, M., Álvarez-Salgado, X. A., Pazó Fernández, M. J., Vieitez Dos Santos, V., and Ibánhez, J. S. P.: Transport and reactivity of nitrous oxide and methane in two contrasting subterranean estuaries, Limnol. Oceanogr., 69, 1810–1825, https://doi.org/10.1002/lno.12622, 2024.
Carstensen, J. and Duarte, C. M.: Drivers of pH Variability in Coastal Ecosystems, Environ. Sci. Technol., 53, 4020–4029, https://doi.org/10.1021/acs.est.8b03655, 2019.
Chen, J.-J., Wells, N. S., Erler, D. V., and Eyre, B. D.: Land-use intensity increases benthic N2O emissions across three sub-tropical estuaries, J. Geophys. Res.-Biogeo., 127, e2022JG006899, https://doi.org/10.1029/2022JG006899, 2022.
Chen, T. and Guestrin, C.: XGBoost: A Scalable Tree Boosting System, in: KDD '16: The 22nd ACM SIGKDD International Conference on Knowledge Discovery and Data Mining, 13–17 August 2016, San Francisco, California, USA, 785–794, https://doi.org/10.1145/2939672.2939785, 2016.
Chen, X., Ma, X., Gu, X., Liu, S., Song, G., Jin, H., and Zhang, G.: Seasonal and spatial variations of N2O distribution and emission in the East China Sea and South Yellow Sea, Sci. Total Environ., 775, 145715, https://doi.org/10.1016/j.scitotenv.2021.145715, 2021.
Codispoti, L. A.: Interesting Times for Marine N2O, Science (1979), 327, 1339–1340, https://doi.org/10.1126/science.1184945, 2010.
Cole, J. J. and Caraco, N. F.: Atmospheric exchange of carbon dioxide in a low-wind oligotrophic lake measured by the addition of SF6, Limnol. Oceanogr., 43, 647–656, https://doi.org/10.4319/lo.1998.43.4.0647, 1998.
de la Paz, M., Huertas, I. E., Flecha, S., Ríos, A. F., and Pérez, F. F.: Nitrous oxide and methane in Atlantic and Mediterranean waters in the Strait of Gibraltar: Air–sea fluxes and inter-basin exchange, Prog. Oceanogr., 138, 18–31, https://doi.org/10.1016/j.pocean.2015.09.009, 2015.
de la Paz, M., Pérez, F. F., Álvarez, M., and Bode, A.: Seasonal ventilation controls nitrous oxide emission in the NW Iberian upwelling, Prog. Oceanogr., 224, 103261, https://doi.org/10.1016/j.pocean.2024.103261, 2024.
del Valle Villalonga, L., Pons, G. X., and Bardolet, M.: Posidonia oceanica Cartography and Evolution of the Balearic Sea (Western Mediterranean), Remote Sens.-Basel, 15, 5748, https://doi.org/10.3390/rs15245748, 2023.
Dobashi, R. and Ho, D. T.: Air–sea gas exchange in a seagrass ecosystem – results from a tracer release experiment, Biogeosciences, 20, 1075–1087, https://doi.org/10.5194/bg-20-1075-2023, 2023.
Doney, S. C.: The growing human footprint on coastal and open-ocean biogeochemistry, Science (1979), 328, 1512, 2010.
Duarte, C. M., Middelburg, J. J., and Caraco, N.: Major role of marine vegetation on the oceanic carbon cycle, Biogeosciences, 2, 1–8, https://doi.org/10.5194/bg-2-1-2005, 2005.
EEA: State and pressures of the marine and coastal Mediterranean environment, European Environment Agency, 1–44, 1999.
Farías, L., Paulmier, A., and Gallegos, M.: Nitrous oxide and N-nutrient cycling in the oxygen minimum zone off northern Chile, Deep-Sea Res. Pt. I, 54, 164–180, https://doi.org/10.1016/j.dsr.2006.11.003, 2007.
Flecha, S., Giménez-Romero, À., Tintoré, J., Pérez, F. F., Alou-Font, E., Matías, M. A., and Hendriks, I. E.: pH trends and seasonal cycle in the coastal Balearic Sea reconstructed through machine learning, Sci. Rep.-UK, 12, 12956, https://doi.org/10.1038/s41598-022-17253-5, 2022.
Flecha, S., Rueda, D., de la Paz, M., Pérez, F. F., Alou-Font, E., Tintoré, J., and Hendriks, I. E.: Spatial and temporal variation of methane emissions in the coastal Balearic Sea, Western Mediterranean, Sci. Total Environ., 865, 161249, https://doi.org/10.1016/j.scitotenv.2022.161249, 2023.
Freing, A., Wallace, D. W. R., and Bange, H. W.: Global oceanic production of nitrous oxide, Philos. T. Roy. Soc. B, 367, 1245–1255, https://doi.org/10.1098/rstb.2011.0360, 2012.
Giorgi, F.: Climate change hot-spots, Geophys. Res. Lett., 33, L08707, https://doi.org/10.1029/2006GL025734, 2006.
Giorgi, F. and Lionello, P.: Climate change projections for the Mediterranean region, Global Planet. Change, 63, 90–104, https://doi.org/10.1016/j.gloplacha.2007.09.005, 2008.
Gu, T., Jia, D., Wang, Z., Guo, Y., Xin, Y., Guo, C., Zhang, G., and Sun, J.: Regional distribution and environmental regulation mechanism of nitrous oxide in the Bohai Sea and North Yellow Sea: A preliminary study, Sci. Total Environ., 818, 151718, https://doi.org/10.1016/j.scitotenv.2021.151718, 2022.
Hendriks, I. E., Escolano-Moltó, A., Flecha, S., Vaquer-Sunyer, R., Wesselmann, M., and Marbà, N.: Mediterranean seagrasses as carbon sinks: methodological and regional differences, Biogeosciences, 19, 4619–4637, https://doi.org/10.5194/bg-19-4619-2022, 2022.
Hendriks, I. E., Flecha, S., de La Paz, M., Pérez, F. F., Morell, C., Tintoré, J., and Marbà, N.: Methane emissions in the coastal Balearic Sea between October 2019–October 2021, digital cisc [data set], https://doi.org/10.20350/digitalCSIC/15491, 2023.
Hendriks, I. E., Flecha, S., de la Paz, M., Pérez, F. F., Morell Lujan-Williams, A., Alou-Font, E., Marbà, N., and Tintoré, J.: Nitrous oxide emissions in the coastal Balearic Sea between August 2018–November 2023, digital dsic, [data set], https://doi.org/10.20350/digitalCSIC/17284, 2025.
Herbert, R. A.: Nitrogen cycling in coastal marine ecosystems, FEMS Microbiol. Rev., 23, 563–590, https://doi.org/10.1016/S0168-6445(99)00022-4, 1999.
Jordà, G., Marbà, N., and Duarte, C.: Mediterranean seagrass vulnerable to regional climate warming, Nat. Clim. Change, 2, 821–824, https://doi.org/10.1038/nclimate1533, 2012.
Knap, A., Michaels, A., Close, A., Ducklow, H., and Dickson, A.: Protocols for the Joint Global Ocean Flux Study (JGFOS) Core Measurements, JGOFS Reoprt Nr. 19, vi+170 pp., 198, https://unesdoc.unesco.org/ark:/48223/pf0000099739 (last access: 30 October 2024), 1996.
Lan, X., Mund, J. W., Crotwell, A. M., Thoning, K. W., Moglia, E., Madronich, M., Baugh, K., Petron, G., Crotwell, M. J., Neff, D., Wolter, S., Mefford, T., and DeVogel, S.: Atmospheric Nitrous Oxide Dry Air Mole Fractions from the NOAA GML Carbon Cycle Cooperative Global Air Sampling Network, 1997–2023, NOAA, https://doi.org/10.15138/53g1-x417, 2024.
Lin, H., Dai, M., Kao, S.-J., Wang, L., Roberts, E., Yang, J.-Y. T., Huang, T., and He, B.: Spatiotemporal variability of nitrous oxide in a large eutrophic estuarine system: The Pearl River Estuary, China, Mar. Chem., 182, 14–24, 2016.
Ma, X., Lennartz, S. T., and Bange, H. W.: A multi-year observation of nitrous oxide at the Boknis Eck Time Series Station in the Eckernförde Bay (southwestern Baltic Sea), Biogeosciences, 16, 4097–4111, https://doi.org/10.5194/bg-16-4097-2019, 2019.
Masson-Delmotte, V., Zhai, P., Pirani, A., Connors, S. L., Péan, C., Berger, S., Caud, N., Chen, Y., Goldfarb, L., Gomis, M. I., Huang, M., Leitzell, K., Lonnoy, E., Matthews, J. B. R., Maycock, T. K., Waterfield, T., Yelekçi, O., Yu, R., and Zhou, B.: Climate Change 2021: The Physical Science Basis. Contribution of Working Group I to the Sixth Assessment Report of the Intergovernmental Panel on Climate Change, in: Sixth Assessment Report of the Intergovernmental Panel on Climate Change, Cambridge University Press, ISBN 9781009157896, https://doi.org/10.1017/9781009157896, 2021.
Micheli, F., Halpern, B. S., Walbridge, S., Ciriaco, S., Ferretti, F., Fraschetti, S., Lewison, R., Nykjaer, L., and Rosenberg, A. A.: Cumulative human impacts on Mediterranean and Black Sea marine ecosystems: assessing current pressures and opportunities, PLOS ONE, 8, e79889, https://doi.org/10.1371/journal.pone.0079889, 2013.
Mouillot, D., Albouy, C., Guilhaumon, F., Ben Rais Lasram, F., Coll, M., Devictor, V., Meynard, C. N., Pauly, D., Tomasini, J. A., Troussellier, M., Velez, L., Watson, R., Douzery, E. J. P., and Mouquet, N.: Protected and threatened components of fish biodiversity in the mediterranean sea, Curr. Biol., 21, 1044–1050, https://doi.org/10.1016/j.cub.2011.05.005, 2011.
Nevison, C. D., Weiss, R. F., and Erickson III, D. J.: Global oceanic emissions of nitrous oxide, J. Geophys. Res.-Oceans, 100, 15809–15820, https://doi.org/10.1029/95JC00684, 1995.
Ravishankara, A. R., Daniel, J. S., and Portmann, R. W.: Nitrous oxide (N2O): The dominant ozone-depleting substance emitted in the 21st century, Science, 326, 123–125. https://doi.org/10.1126/science.1176985, 2009.
Resplandy, L., Hogikyan, A., Müller, J. D., Najjar, R. G., Bange, H. W., Bianchi, D., Weber, T., Cai, W.-J., Doney, S. C., Fennel, K., Gehlen, M., Hauck, J., Lacroix, F., Landschützer, P., Le Quéré, C., Roobaert, A., Schwinger, J., Berthet, S., Bopp, L., Chau, T. T. T., Dai, M., Gruber, N., Ilyina, T., Kock, A., Manizza, M., Lachkar, Z., Laruelle, G. G., Liao, E., Lima, I. D., Nissen, C., Rödenbeck, C., Séférian, R., Toyama, K., Tsujino, H., and Regnier, P.: A Synthesis of Global Coastal Ocean Greenhouse Gas Fluxes, Global Biogeochem. Cy., 38, e2023GB007803, https://doi.org/10.1029/2023GB007803, 2024.
Rosentreter, J. A., Laruelle, G. G., Bange, H. W., Bianchi, T. S., Busecke, J. J. M., Cai, W. J., Eyre, B. D., Forbrich, I., Kwon, E. Y., Maavara, T., Moosdorf, N., Najjar, R. G., Sarma, V. V. S. S., Van Dam, B., and Regnier, P.: Coastal vegetation and estuaries are collectively a greenhouse gas sink, Nat. Clim. Change, 13, 579–587, https://doi.org/10.1038/s41558-023-01682-9, 2023.
Seabold, S. and Perktold, J.: statsmodels: Econometric and statistical modeling with Python, in: 9th Python in Science Conference, SciPy 2010, 28 June–3 July 2010, Austin, Texas, https://doi.org/10.25080/Majora-92bf1922-011, 2010.
Servén, D. and Brummitt, C.: pyGAM: Generalized additive models in python, Zenodo [code], https://doi.org/10.5281/zenodo1208723, 2018.
Sierra, A., Jiménez-López, D., Ortega, T., Gómez-Parra, A., and Forja, J.: Factors controlling the variability and emissions of greenhouse gases (CO2, CH4 and N2O) in three estuaries of the Southern Iberian Atlantic Basin during July 2017, Mar. Chem., 226, 103867, https://doi.org/10.1016/j.marchem.2020.103867, 2020.
Solomon, S., Qin, D., Manning, M., Averyt, K., and Marquis, M.: Climate change 2007 – the physical science basis: Working group I contribution to the fourth assessment report of the IPCC, Cambridge University Press, Cambridge, United Kingdom and New York, NY, USA, 2007.
Sospedra, J., Niencheski, L. F. H., Falco, S., Andrade, C. F. F., Attisano, K. K., and Rodilla, M.: Identifying the main sources of silicate in coastal waters of the Southern Gulf of Valencia (Western Mediterranean Sea), Oceanologia, 60, 52–64, https://doi.org/10.1016/j.oceano.2017.07.004, 2018.
Tian, H., Pan, N., Thompson, R. L., Canadell, J. G., Suntharalingam, P., Regnier, P., Davidson, E. A., Prather, M., Ciais, P., Muntean, M., Pan, S., Winiwarter, W., Zaehle, S., Zhou, F., Jackson, R. B., Bange, H. W., Berthet, S., Bian, Z., Bianchi, D., Bouwman, A. F., Buitenhuis, E. T., Dutton, G., Hu, M., Ito, A., Jain, A. K., Jeltsch-Thömmes, A., Joos, F., Kou-Giesbrecht, S., Krummel, P. B., Lan, X., Landolfi, A., Lauerwald, R., Li, Y., Lu, C., Maavara, T., Manizza, M., Millet, D. B., Mühle, J., Patra, P. K., Peters, G. P., Qin, X., Raymond, P., Resplandy, L., Rosentreter, J. A., Shi, H., Sun, Q., Tonina, D., Tubiello, F. N., van der Werf, G. R., Vuichard, N., Wang, J., Wells, K. C., Western, L. M., Wilson, C., Yang, J., Yao, Y., You, Y., and Zhu, Q.: Global nitrous oxide budget (1980–2020), Earth Syst. Sci. Data, 16, 2543–2604, https://doi.org/10.5194/essd-16-2543-2024, 2024.
Tintoré, J. and Casas, B.: Buoy Bahía de Palma Physicochemical parameters of sea water data [Dataset], Balearic Islands Coastal Observing and Forecasting System, SOCIB [data set], https://doi.org/10.25704/s6jb-ck61, 2022.
Tintoré, J., Vizoso, G., Casas, B., Heslop, E., Pascual, A., Orfila, A., Ruiz, S., Martínez-Ledesma, M. M., Torner, M., Cusí, S., Diedrich, A., Balaguer, P., Gómez-Pujol, L., Álvarez-Ellacuria, A., Gómara, S., Sebastian, K., Lora, S., Beltrán, J. P., Renault, L., Juzà, M., Álvarez, D., March, D., Garau, B. B., Castilla, C., Cañellas, T., Roque, D., Lizarán, I., Pitarch, S., Carrasco, M. A., Lana, A. A., Mason, E., Escudier, R., Conti, D., Sayol, J. M., Barceló, B., Alemany, F. F., Reglero, P., Massuti, E., Vélez-Belchí, P., Ruiz, J., Oguz, T., Gómez, M., Álvarez, E., Ansorena, L. L., Manriquez, M., Barceló-Llull, B., Alemany, F. F., Reglero, P., Massutí, E., Vélez-Belchí, P., Ruiz Segura, J., Oguz, T., Gómez, M., Álvarez-Fanjul, E., Ansorena, L. L., and Manríquez, M.: SOCIB: The Balearic Islands Coastal Ocean Observing and Forecasting System Responding to Science, Technology and Society Needs, Mar. Technol. Soc. J., 47, 101–117, https://doi.org/10.4031/MTSJ.47.1.10, 2013.
Tintoré, J., Pinardi, N., Álvarez-Fanjul, E., Aguiar, E., Álvarez-Berastegui, D., Bajo, M., Balbin, R., Bozzano, R., Nardelli, B. B., Cardin, V., Casas, B., Charcos-Llorens, M., Chiggiato, J., Clementi, E., Coppini, G., Coppola, L., Cossarini, G., Deidun, A., Deudero, S., D'Ortenzio, F., Drago, A., Drudi, M., El Serafy, G., Escudier, R., Farcy, P., Federico, I., Fernández, J. G., Ferrarin, C., Fossi, C., Frangoulis, C., Galgani, F., Gana, S., García Lafuente, J., Sotillo, M. G., Garreau, P., Gertman, I., Gómez-Pujol, L., Grandi, A., Hayes, D., Hernández-Lasheras, J., Herut, B., Heslop, E., Hilmi, K., Juza, M., Kallos, G., Korres, G., Lecci, R., Lazzari, P., Lorente, P., Liubartseva, S., Louanchi, F., Malacic, V., Mannarini, G., March, D., Marullo, S., Mauri, E., Meszaros, L., Mourre, B., Mortier, L., Muñoz-Mas, C., Novellino, A., Obaton, D., Orfila, A., Pascual, A., Pensieri, S., Pérez Gómez, B., Pérez Rubio, S., Perivoliotis, L., Petihakis, G., de la Villéon, L. P., Pistoia, J., Poulain, P. M., Pouliquen, S., Prieto, L., Raimbault, P., Reglero, P., Reyes, E., Rotllan, P., Ruiz, S., Ruiz, J., Ruiz, I., Ruiz-Orejón, L. F., Salihoglu, B., Salon, S., Sammartino, S., Sánchez Arcilla, A., Sannino, G., Sannino, G., Santoleri, R., Sardá, R., Schroeder, K., Simoncelli, S., Sofianos, S., Sylaios, G., Tanhua, T., Teruzzi, A., Testor, P., Tezcan, D., Torner, M., Trotta, F., Umgiesser, G., von Shuckmann, K., Verri, G., Vilibic, I., Yuvel, M., Zavatarelli, M., and Zodiatis, G.: Challenges for Sustained Observing and Forecasting Systems in the Mediterranean Sea, Front. Mar. Sci., 6, 568, https://doi.org/10.3389/fmars.2019.00568, 2019.
UNEP/MAP – United Nations Environment Programme/Mediterranean Action Plan – Barcelona Convention: State of the Mediterranean Marine and Coastal Environment, UNEP/MAP – Barcelona Convention, https://wedocs.unep.org/20.500.11822/375 (last access: 15 November 2024), 2012.
Virtanen, P., Gommers, R., Oliphant, T. E., Haberland, M., Reddy, T., Cournapeau, D., Burovski, E., Peterson, P., Weckesser, W., Bright, J., van der Walt, S. J., Brett, M., Wilson, J., Millman, K. J., Mayorov, N., Nelson, A. R. J., Jones, E., Kern, R., Larson, E., Carey, C. J., Polat, İ., Feng, Y., Moore, E. W., VanderPlas, J., Laxalde, D., Perktold, J., Cimrman, R., Henriksen, I., Quintero, E. A., Harris, C. R., Archibald, A. M., Ribeiro, A. H., Pedregosa, F., van Mulbregt, P., Vijaykumar, A., Bardelli, A. Pietro, Rothberg, A., Hilboll, A., Kloeckner, A., Scopatz, A., Lee, A., Rokem, A., Woods, C. N., Fulton, C., Masson, C., Häggström, C., Fitzgerald, C., Nicholson, D. A., Hagen, D. R., Pasechnik, D. V., Olivetti, E., Martin, E., Wieser, E., Silva, F., Lenders, F., Wilhelm, F., Young, G., Price, G. A., Ingold, G. L., Allen, G. E., Lee, G. R., Audren, H., Probst, I., Dietrich, J. P., Silterra, J., Webber, J. T., Slavič, J., Nothman, J., Buchner, J., Kulick, J., Schönberger, J. L., de Miranda Cardoso, J. V., Reimer, J., Harrington, J., Rodríguez, J. L. C., Nunez-Iglesias, J., Kuczynski, J., Tritz, K., Thoma, M., Newville, M., Kümmerer, M., Bolingbroke, M., Tartre, M., Pak, M., Smith, N. J., Nowaczyk, N., Shebanov, N., Pavlyk, O., Brodtkorb, P. A., Lee, P., McGibbon, R. T., Feldbauer, R., Lewis, S., Tygier, S., Sievert, S., Vigna, S., Peterson, S., More, S., Pudlik, T., Oshima, T., Pingel, T. J., Robitaille, T. P., Spura, T. J., Thouis R. C., Tim, L., Zito, T., Krauss, T., Upadhyay, U., Halchenko, Y. O., and Vázquez-Baeza, Y.: SciPy 1.0: fundamental algorithms for scientific computing in Python, Nat. Methods, 17, 261–272, https://doi.org/10.1038/s41592-019-0686-2, 2020.
Wan, X. S., Sheng, H. X., Dai, M., Casciotti, K. L., Church, M. J., Zou, W., Liu, L., Shen, H., Zhou, K., Ward, B. B., and Kao, S. J.: Epipelagic nitrous oxide production offsets carbon sequestration by the biological pump, Nat. Geosci., 16, 29–36, https://doi.org/10.1038/s41561-022-01090-2, 2023.
Wanninkhof, R.: Relationship between wind speed and gas exchange over the ocean revisited, Limnol. Oceanogr.-Meth., 12, 351–362, https://doi.org/10.4319/lom.2014.12.351, 2014.
Weiss, R. F., Price, B. A., Canada, E., Rochette, P., Hutchinson, G. L., Jayasundara, S., and Wagner-Riddle, C.: Nitrous oxide solubility in water and seawater, Agr. Syst., 8, 247–286, 1980.
Wilson, S. T., Ferrón, S., and Karl, D. M.: Interannual Variability of Methane and Nitrous Oxide in the North Pacific Subtropical Gyre, Geophys. Res. Lett., 44, 9885–9892, https://doi.org/10.1002/2017GL074458, 2017.
Wilson, S. T., Bange, H. W., Arévalo-Martínez, D. L., Barnes, J., Borges, A. V., Brown, I., Bullister, J. L., Burgos, M., Capelle, D. W., Casso, M., de la Paz, M., Farías, L., Fenwick, L., Ferrón, S., Garcia, G., Glockzin, M., Karl, D. M., Kock, A., Laperriere, S., Law, C. S., Manning, C. C., Marriner, A., Myllykangas, J.-P., Pohlman, J. W., Rees, A. P., Santoro, A. E., Tortell, P. D., Upstill-Goddard, R. C., Wisegarver, D. P., Zhang, G.-L., and Rehder, G.: An intercomparison of oceanic methane and nitrous oxide measurements, Biogeosciences, 15, 5891–5907, https://doi.org/10.5194/bg-15-5891-2018, 2018.
Wu, B., Liu, F., Weiser, M. D., Ning, D., Okie, J. G., Shen, L., Li, J., Chai, B., Deng, Y., and Feng, K.: Temperature determines the diversity and structure of N2O-reducing microbial assemblages, Funct. Ecol., 32, 1867–1878, 2018.
Yang, J., Zhang, G. L., Zheng, L. X., and Zhang, F.: Seasonal variations of fluxes and distributions of dissolved N2O in the North Yellow Sea, Huanjing Kexue/Environmental Science, 30, 656–662, 2009.
Yang, S., Chang, B. X., Warner, M. J., Weber, T. S., Bourbonnais, A. M., Santoro, A. E., Kock, A., Sonnerup, R. E., Bullister, J. L., Wilson, S. T., and Bianchi, D.: Global reconstruction reduces the uncertainty of oceanic nitrous oxide emissions and reveals a vigorous seasonal cycle, P. Natl. Acad. Sci. USA, 117, 11954–11960, https://doi.org/10.1073/pnas.1921914117, 2020.
Zhang, G., Zhang, J., Ren, J., Li, J., and Liu, S.: Distributions and sea-to-air fluxes of methane and nitrous oxide in the North East China Sea in summer, Mar. Chem., 110, 42–55, https://doi.org/10.1016/j.marchem.2008.02.005, 2008.
Zhou, J., Zheng, Y., Hou, L., An, Z., Chen, F., Liu, B., Wu, L., Qi, L., Dong, H., and Han, P.: Effects of acidification on nitrification and associated nitrous oxide emission in estuarine and coastal waters, Nat. Commun., 14, 1380, https://doi.org/10.1038/s41467-023-37104-9, 2023.
Nitrous oxide (N2O), a potent greenhouse gas, is understudied in coastal zones. We present N2O concentrations and air–sea fluxes from the Balearic coast (2018–2023). Concentrations varied slightly across sites, with areas acting as weak sources or being near equilibrium. Temperature was the main driver of seasonal changes. These findings improve our understanding of coastal N2O emissions.
Nitrous oxide (N2O), a potent greenhouse gas, is understudied in coastal zones. We present N2O...