the Creative Commons Attribution 4.0 License.
the Creative Commons Attribution 4.0 License.
Surface circulation characterization along the middle southern coastal region of Vietnam from high-frequency radar and numerical modeling
Thanh Huyen Tran
Alexei Sentchev
Thai To Duy
Marine Herrmann
Sylvain Ouillon
Kim Cuong Nguyen
Coastal water dynamics along the Vietnamese middle southern coast (VMSC) region, part of the South China Sea, are highly complex with large spatiotemporal variability whose drivers are not yet well understood. For the first time, high-resolution surface current data from high-frequency radar (HFR) measurements were obtained in this region during the early (transition) phase of the Asian summer monsoon. The data were used for comparison with simulation results from a circulation model, SYMPHONIE, and ultimately to optimize the wind forcing in the model. Both modeling and HFR were able to show the spatial and temporal evolution of the surface circulation, but some discrepancies were found between model and HFR data on some days, coinciding with the evolution of the wind. Two methods were used to optimize the wind forcing, namely the ensemble perturbation smoother (EnPS) and the wind correction method using wind-driven surface currents (EkW). Both methods achieved a significant reduction (∼ 36 %–40 %) in the error of the surface current velocity fields compared to the measured data. Optimized winds obtained from the two methods were compared with satellite wind data for validation. The results show that both optimization methods performed better in the far field, where topography no longer affects the coastal surface circulation. The optimization results revealed that the surface circulation is driven not only by winds but also by other factors such as intrinsic ocean variability, which is not entirely controlled by boundary conditions. This indicates the potential usefulness of large velocity datasets and other data fusion methods to effectively improve modeling results.
- Article
(10003 KB) - Full-text XML
- BibTeX
- EndNote
The coastal waters of Vietnam are parts of the South China Sea (SCS) (“East Sea” in Vietnamese), one of the world's largest marginal seas, where various meteorological and oceanographic processes contribute to its circulation variability at different scales. The region is under the influence of two monsoonal wind regimes: the southwest monsoon usually starts in June, while the northeast monsoon usually begins in late November and is fully developed by January (Potemra and Qu, 2009; Wang et al., 2021). The large-scale circulation in the SCS is mainly driven by winds (Potemra and Qu, 2009), resulting in seasonal patterns and phenomena which have been documented in many studies: SCS western boundary current (Fang et al., 2012), a dipole structure characterized by cyclonic and anti-cyclonic gyres offshore of Vietnam (Chen et al., 2012; To Duy et al., 2022; Wang et al., 2006), and a southern Vietnam upwelling (SVU) which usually occurs in summer (Chen et al., 2012; Da et al., 2019; To Duy et al., 2022; Herrmann and To Duy, 2023; Herrmann et al., 2024). In particular, along the middle southern coast of Vietnam (hereafter called VMSC), shown in Fig. 1b, all three features of circulation mentioned above are present. Moreover, the coastal dynamics along the VMSC are strongly influenced by ocean intrinsic variability (OIV): producing variations in upwelling expansion and affecting location of current jets and submesoscale eddies (their intensity and size) (Li et al., 2014; To Duy et al., 2022; Da et al., 2019; Herrmann et al., 2023). These findings have emphasized that the dynamics of the VMSC are highly complex with large spatial and temporal variability governed by different factors which are still not well understood.
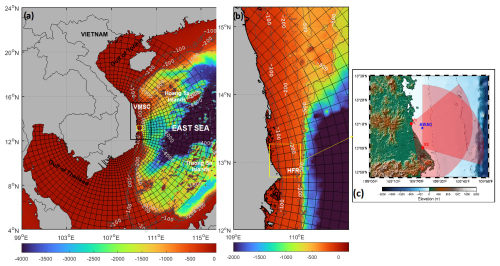
Figure 1(a) Bathymetry map of the EASTSEA domain and (b) the VMSC domain (right) (bathymetry data source: GEBCO_2022). The VMSC domain is bounded with the black box and the HFR domain with the yellow box. The computation orthogonal curvilinear grid is illustrated by solid black curves (the grid node density was reduced for better demonstrative purpose); (c) spatial coverage by WERA radars installed in April–May 2019 at the Phu Yen coast, VMSC. Red dots show the two HFR stations V1 and V2. The blue star shows the location of the AWAC. Bathymetry contours are shown by solid black lines.
The limitation of existing studies in the SCS, in particular along the VMSC, is that their research mostly relied on coarse-resolution modeling, intermittent satellite data and discrete measurements. Furthermore, it is worth noting that the majority of recent studies in the region mainly focused on the ocean dynamics and circulation variability during the mature monsoon periods, while knowledge about ocean dynamics during the transition periods is still lacking. During the transition period, the wind changes direction in complex ways, thus affecting the temporal and spatial variability of the surface currents. These, among others, can generate various dynamic structures, i.e., submesoscale eddies and divergence and convergence zones. The modeling approach, to some extent, can help us to acquire a general understanding of the ocean circulation with sufficient and reliable forcing inputs. However, for Vietnam coastal regions, atmospheric forcing data, especially winds, are very limited and often come from global data sources with low spatial resolution; thus, some dynamic features at local and regional scales can be poorly presented or even neglected. Nguyen-Duy et al. (2023) have conducted sensitivity tests of Red River plume dynamics to wind fields in the Gulf of Tonkin. The river plume was found to be sensitive to wind variations which generate a clear reversal of the circulation pattern and affect the plume thickness variability. Furthermore, as was demonstrated in our preliminary work, during the transition period of the summer monsoon from April to May, the VMSC coastal dynamics experienced a high variability in terms of both temporal and spatial scales associated with large variability in wind fields (Tran et al., 2022b). Thus, in order to deliver a comprehensive understanding of the coastal dynamics during the monsoonal transition period, high-resolution datasets and better, reliable model simulation results are necessary.
The questions now are how high-resolution measurements can be used and how numerical models can be improved for better simulating fine-scale processes in coastal regions and, in particular, along the VMSC. In past years, drifters and satellite-derived data have been used in many studies as the sources of observation data. Centurioni et al. (2009) used Surface Velocity Program drifters with reanalysis wind and satellite altimetry data to construct 2D circulation maps in the SCS at 1° resolution. A similar approach has been employed for estimating mean geostrophic currents in the SCS with Argo profiling floats and altimeter data (Yang et al., 2019; Zhou et al., 2010). Nonetheless, these products only provide estimated or derived sea surface currents (SSCs). Up to now, no direct measurements with high spatiotemporal resolution have been available for the VMSC. High-frequency radar (HFR), a land-based remote sensing technique, has been widely used in oceanographic studies since the system has the ability to monitor SSCs directly with high temporal and spatial coverage (Mantovani et al., 2020). The capability of HFRs in monitoring surface currents in the tropic coastal regions has been proven in a number of existing studies within a wide range of oceanographic applications, e.g., coastal circulation characterization (Cosoli et al., 2020), assessing the turbulence dispersion of passive tracers and particulate materials (Tran et al., 2022a), and coastal circulation response to climatic variabilities (Gu and Mao, 2024). On the Vietnamese coasts, two different radar systems have been installed: three CODAR SeaSondes at ∼ 6 km resolution in the Gulf of Tonkin, north of the SCS (Rogowski et al., 2019), and two wave radars (WERAs) at 1 km resolution in the VMSC. Our preliminary results showed that HFRs could demonstrate well the fine-scale structure of coastal circulations during the transition monsoon period (Tran et al., 2022b). In terms of modeling, in the most recent studies of Herrmann et al. (2024), Herrmann and To Duy (2023), and To Duy et al. (2022), the high-resolution circulation model SYMPHONIE was used to investigate the interannual variabilities in SVU in the SCS including the VMSC. However, no current velocity measurements have been used for model validation or optimization.
There are several approaches in model forcing optimization, for example, correcting the model boundary conditions (tides and winds). In this method, sets of perturbed wind and tidal forcing ensembles were generated with the inverse fast Fourier transform (FFT) method. Subsequently, tidal and wind forcing were optimized via data assimilation techniques (Barth et al., 2009, 2011; Marmain et al., 2014). In the Gulf of Tonkin, European Center for Medium-Range Weather Forecasts (ECMWF) wind forcing was perturbed by using empirical orthogonal function (EOF) analysis for model cluster analysis (Nguyen, 2022). Differing from these two methods, our research introduces a physical approach which quantifies the surface current component induced by winds using HFR data without ensemble simulation. The method allows the wind forcing input of the 3D ocean circulation model SYMPHONIE to be optimized with the expectation of improving the capabilities of the model to simulate fine-scale coastal current structures of the VMSC during the onset of the summer monsoon.
2.1 HFR measurements in the VMSC region
The HFR system used in the study is a pair of WERA ocean radars with the central operating frequency of 16.15 MHz. Radial surface current velocities were measured by two radar stations (denoted as V1 and V2 in Fig. 1c) during the measurement campaign in Phu Yen, VMSC, from 14 April to 16 May 2019. The measurement domain spanned from [12°53′ N, 109°16′ E] to [13°22′ N, 109°47′ E] with a spatial resolution of 1 km. The raw radial velocities were treated with root-mean-squared error (RMSE) threshold filtering in order to be free of spikes. Surface current velocity vectors were then reconstructed from the noise-removed radial velocities with the 2D-Var or EOF method (Yaremchuk and Sentchev, 2009, 2011). The interpolation and gap-filling procedure has been explained in our previous work (Tran et al., 2022b).
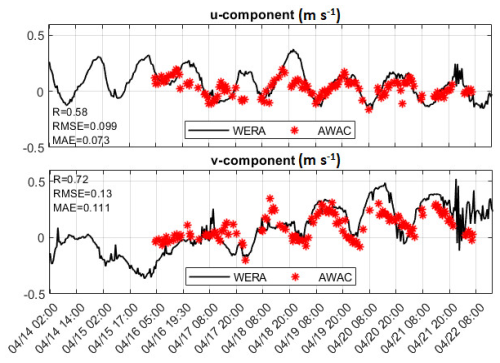
The surface currents derived from the HFR data have been validated with 7 d surface current velocity measurements obtained from a bottom-mounted AWAC (acoustic wave and current profiler) during 16–22 April 2019. The velocity time series from HFR measurements has been extracted from the grid cell in closest proximity to the AWAC location.
Three metrics of evaluation have been used to compare the current velocity time series from AWAC and HFR: correlation (R), RMSE and mean absolute error (MAE) of surface current velocities. The results show that velocity time series obtained from HFR and AWAC were in a fairly good agreement (R = 0.58, RMSE = 0.10 m s−1, MAE = 0.07 m s−1 for the u component and R = 0.72, RMSE = 0.13 m s−1, MAE = 0.11 m s−1 for the v component) (Fig. 2). The discrepancy between the two velocity time series may be attributed primarily to the velocity shear affecting the surface layer and different depths of AWAC and HFR measurements. AWAC velocities were recorded and averaged in the 1.5 m depth layer (the bin size) closest to the sea surface. Furthermore, the effective depth of HFR at 16.15 MHz was determined to be 0.74 m. Moreover, Fig. 2 clearly shows the impact of surface waves and tidal stage in contaminating AWAC measurements, particularly during the peak flow.
2.2 The 3D circulation model SYMPHONIE
The 3D ocean circulation model SYMPHONIE is a Boussinesq hydrostatic ocean circulation model developed by the SIROCCO group (CNRS and Toulouse University, France). Based on an Arakawa curvilinear C grid, momentum and tracer fluxes are computed using an energy-conserving finite-difference method (Marsaleix et al., 2008). The model adopts the time-stepping method using a “leapfrog” scheme combined with a Laplacian filter (Marsaleix et al., 2012); the K-epsilon turbulence closure scheme and pressure gradient Jacobian scheme (Marsaleix et al., 2008) were used to describe the physics within the model. A description of various boundary conditions including lateral open boundaries, rivers and surface conditions can be found in Estournel et al. (2009).
The model configuration used in this research was adopted from the regional model configuration described and used in Duy et al. (2022), Herrmann et al. (2024), Herrmann and To Duy (2023), and Trinh et al. (2024). The grid resolution is ∼ 1 km nearshore and coarsens gradually to ∼ 4.5 km in the open seas. The atmospheric forcing is introduced via the bulk formulae of Large and Yeager (2004) using the 3-hourly output of the ECMWF ° atmospheric analysis. Initial ocean conditions and lateral ocean boundary conditions are prescribed from the daily outputs of the global ocean ° analysis PSY4QV3R1 from the Copernicus Marine and Environment Monitoring Service (CMEMS). Tidal data were taken from the 2014 release of the finite-element solution (FES2014) global tidal model. Nine tidal constituents have been taken into account. River forcing was enabled with the information of river systems along the coasts and was described in To Duy et al. (2022).
The model domains are shown in Fig. 1. The first simulation ran from January to June 2019 on the entire SCS domain (Fig. 1a) (EASTSEA run) in order to obtain open boundary conditions (OBCs) for the VMSC domain (Fig. 1b). The second simulation (VMSC run) was conducted in the VMSC domain from 1 March to 5 May 2019 to generate initial conditions before the optimization procedure was executed. The VMSC domain has the same grid resolution as the EASTSEA domain. Details of the experiment setup are described in Sect. 2.4.
2.3 Methods of wind forcing optimization
2.3.1 Ensemble perturbation smoother (EnPS)
The wind optimization procedure, adopted from Barth et al. (2011) and Marmain et al. (2014), consists of two steps: (1) ensemble perturbation and (2) data assimilation.
A total of 30 ensembles were generated during a period of 2 months (April–May 2019) by using wind fields with perturbation data.
The perturbations (wp(xyt)) were computed from the real parts of a quantity which are the sum of the multiplication of a random, complex, normal-distribution time series (zk(t)) and decomposed wind fields (ak(xy)) obtained from fast Fourier transform (FFT):
N is the total time-series length of wind data during the 2 months, and α is the scaling factor between the final expected wind error and temporal error. With this method of perturbation, the spatial and temporal distributions of wind perturbation errors were assumed to be similar to those of ECMWF winds in order to avoid errors induced by nonlinear variabilities.
EnPS is a non-sequential method where all observations are used to generate the optimal state (an analysis) for a specific data assimilation (DA) time window. The analysis of wind wa is yielded from the equation
where wb is the background wind, and wincr is the increment added to the background field. This increment can be achieved from the relationship of a number of quantities: the covariance matrix of wind ensembles (S), the covariance matrix of so-called “observation operators” that link model surface currents with wind forcing (E), the observation error matrix R, and the difference between observations y0 and the model operators h(wb). Hence, Eq. (2) can be rewritten as
in which SET represents the covariance matrix between wind forcing and the model (surface currents), while the covariance matrix of model surface currents is represented by EET:
The detailed explanation of the DA scheme and the components of the formula can be found in Barth et al. (2009, 2011).
In this research, we conducted DA for a 10 d long analysis period (5–14 May 2019) with a time window of 24 h. For each DA run, 8 instances of wind data (3 h interval) corresponding to 24 instances of surface current data (1 h interval) were used.
2.3.2 Wind correction from wind-driven surface currents (EkW)
We assume that the uncertainty of model surface current simulations comes only from the inaccuracy of wind forcing without consideration of other sources of uncertainties (i.e., open boundary conditions, initial conditions and other forcing fields). In other words, the wind-driven component of surface currents was not properly reproduced in the model due to coarse-resolution wind data. This uncertainty can be compensated by a correction of model surface currents (ucor) represented by the difference between observations, i.e., surface currents obtained from HFR (uR) and the model (uM):
For each value of wind data, surface currents at neighboring points located within a certain distance R to the wind data point were considered. In order to validate the method later with the same measurement data from HFR, only 60 % of the data points in the HFR current field were randomly selected for the wind forcing correction. The remaining 40 % of data were used for the evaluation of the optimization method skill.
We quantified the contribution of the sea state (surface waves) to the surface current obtained from HFR using Eqs. (A4) and (A5) in the paper of Sentchev et al. (2013). The contribution of Stokes drift to the total velocity measured by HFR was estimated at a maximum of around 4 %–5 % of the velocity value, i.e., at a maximum 0.02 m s−1.
Due to the insignificant contribution of the wave-induced velocity component, it can be neglected when estimating wind-induced velocity, which is assumed to make the main contribution to the discrepancy between model and radar velocity. The correction of wind speed wcor then could be estimated from the surface current velocities using the empirical formula of Weber (1983):
where is a constant drag coefficient; ρa and ρ0 are the air and water densities, respectively; and indicates the spatial average of velocities over a circular area with a radius R = 13 km (∼ 0.125°).
As the temporal and spatial resolution of wind and surface current velocities are different, we applied a least-squares method to calculate 3 h analysis wind from a series of 1 h surface current velocities. The cost function in the least-squares method is henceforth described in the following equation:
Here, H is an operator projecting the current velocities at locations (xi,yi) onto the wind vector location.
The corrections of wind were finally added to the background wind field to obtain the analysis wind as in Eq. (2) of the EnPS method.
2.4 Experiment design
Since the focus of the paper is the VMSC region, we implemented the optimization steps only for the VMSC domain in order to reduce the cost of computation. The period chosen for model optimization spanned 5–14 May 2019. This period featured a significant change in wind direction which resulted in a notable discrepancy between the velocities from the model and HFR. A more detailed description of the analyzed period can be found in Sect. 3.3. Before conducting the optimization procedure, OBCs and initial states of the model have to be generated. The first simulation was made for the entire EASTSEA domain to obtain OBCs for the VMSC domain. Subsequently, initial states were created from the VMSC run. Three simulations, VMSC_ref, VMSC_EkW and VMSC_EnPS, used the same initial states provided by the VMSC run on 5 May 2019 but with three different wind forcing conditions (Table 1).
The skill of the two optimization methods was evaluated by using the RMSE and MAE of surface currents to compare the remaining 40 % of the HFR measurement data with modeling results at corresponding point locations. For validating the performance of the two optimization methods, wind data from Advanced Scatterometer (ASCAT) Data Products at 0.25° resolution were used for a comparison with EnPS and EkW wind data.
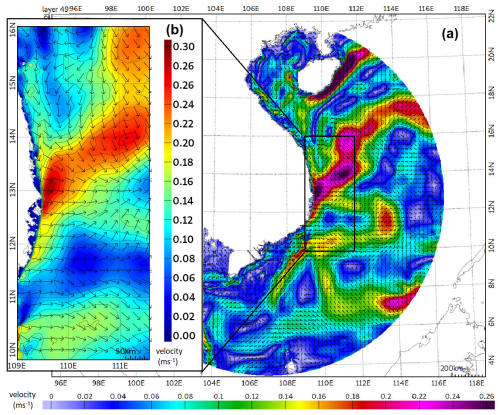
Figure 5(a) Surface circulation in the western SCS in April–May from the EASTSEA run. The current velocity fields have been averaged for the 10-year period of 2009–2018. (b) A zoom-in on the VMSC domain. The color scale depicts the velocity of surface currents (in ms−1). A large upwelling and current separation already occur at latitudes of 10–14° N during this time of the year (Tran et al., 2022a).
3.1 Spectral analysis
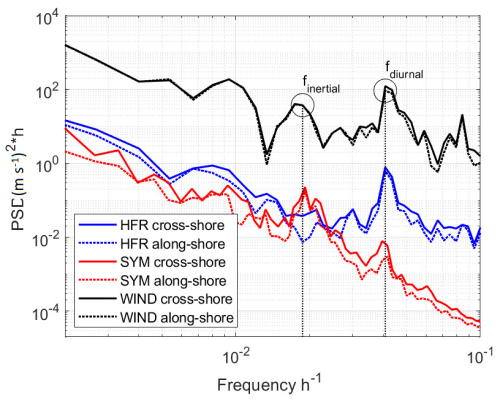
Spatially averaged power spectral density (PSD) has been computed for the surface current velocity time series obtained from HFR and VMSC_ref as well as for the wind velocity time series from ECMWF during the measurement period (Fig. 3). In all cases, the power spectra have a similar shape for both cross-shore and along-shore dimensions. There are two prominent peaks in PSD of wind associated with inertial and diurnal periods. The diurnal cycle of winds is governed by the difference in surface heating between land and sea, which leads to thermal exchanges and generates a sea breeze. Moreover, a peak at 0.08 h−1 (12 h period) observed in the PSD curve accounts for semi-diurnal variability in wind, which was also well reproduced in ECMWF wind data. This variability can result from the modulation of atmospheric circulation by tides and gravitational waves (Wu et al., 2022). Regarding the PSD of current velocity, a frequency of ∼ 0.04 h−1 (24 h period) associated with diurnal tidal motions is found in both VMSC_ref and HFR; however, the level of energy differs considerably between the two time series. Lower-frequency band processes were also detected during this period of analysis including inertial motion caused by Coriolis force. Regarding the inertial period, a significant peak was found for VMSC_ref's time series associated with wind time series but not for HFR measurements. The energy levels of VMSC_ref and HFR power spectra are comparable in the low-frequency band until approximately 0.025 h−1 (∼ 40 h period), and then the energy in VMSC_ref's power spectra declines drastically in the high-frequency band compared to that in HFR measurements. Furthermore, on the left side of the spectra, there are some slight shifts at longer periods (more than 1.5 d) between along-shore and cross-shore spectra. At synoptic scale (several days), wind and HFR spectra have a peak at a frequency band of approx. 0.0095 h−1 (4–5 d); however the process in surface currents is shown to be more resistant (wider peak) in time compared to that of wind (sharper peak). This pattern is not clearly observed in the spectrum of VMSC_ref's current velocity.
In contrast to the PSD spectra of VMSC_ref's SSC, which show a clear energy cascade from larger to smaller scales, the steep slope in the high-frequency band (less than 24 h period) is not visible for wind speed and velocity obtained from HFR measurements. The processes that govern wind variability operate on different scales compared to oceanic processes. In the sub-inertial band, the power-law scaling for wind (depicted by the black curves in Fig. 3) exhibits a slope close to −1, which provides an indication of the wall turbulence (Ting, 2016; Sim et al., 2023). In this specific case, the wind variability is significantly influenced by the characteristics of the surrounding terrain (Sim et al., 2023). In the case of currents, the flattening of the PSD curve in the sub-diurnal frequency band is likely attributable to noise affecting HFR data and the accuracy of current vector reconstruction from HFR measurements at two sites. Figure A1 in the Appendix illustrates a relatively high level of noise at mid- and far ranges of the radar coverage that was induced by the power supply. In addition, the semi-diurnal peak (0.08 h−1) is present in HFR spectra but is not statistically significant due to its submergence in the noise. However, this peak is absent in the model spectra. One potential explanation is that the low-resolution forcing data used in the model simulation prevents the reconstruction of higher-frequency variabilities in surface circulation. A similar situation has been documented in previous studies from Cosoli et al. (2013) and Lauton et al. (2023). Their findings indicated that the model exhibited a strong coherence with observations in the low-frequency band. However, this was not the case in the high-frequency band.
3.2 Tidal analyses
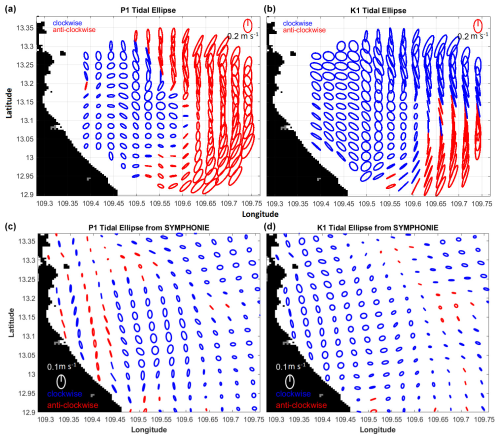
The tidal components of surface currents were estimated for the measurement period using “Unified Tidal Analysis and Prediction” MATLAB functions (UTide) developed by the University of Rhode Island (Codiga, 2011). The tidal regime in the region is predominately diurnal with three main tidal constituents: K1, P1 and O1. There are some differences in tidal ellipse spatial distributions between VMSC_ref and HFR. The HFR tidal ellipse maps show that clockwise-rotating ellipses are observed near the coast, whereas counterclockwise ellipses are located offshore and in the southeastern part of the domain. The shape of ellipses is more circular nearshore and more elongated seaward. The velocity magnitude is also larger offshore than nearshore (Fig. 4).
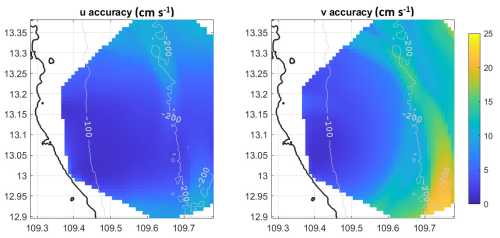
Furthermore, this elongation of ellipses offshore is not visible in VMSC_ref. The magnitude of tidal currents from VMSC_ref is overall smaller than that from HFR. The better agreements between VMSC_ref and HFR are found in the middle field of the HFR domain (13–13.2° N, 109.4–109.6° E). Figure A1 in the Appendix shows that higher uncertainties of both u and v components of SSCs from HFR measurements are found in the offshore range starting from a distance of ∼ 40 km. This pattern coincides with the discrepancies in tidal ellipse distribution maps between HFR and VMSC_ref.
3.3 SSC variability
Before analyzing the results during the analysis period (April–May 2019), we investigate the variability in the SSC field during the same months over the past 10 years. SSCs during April–May in the years 2009–2018 were simulated by SYMPHONIE for the EASTSEA domain. The 10-year average of the SSC field over these 2 months is shown in Fig. 5a and b. It clearly shows a seaward current occurring within the latitude of 10–14° N. This dynamic feature results in an associated upwelling which starts to form offshore of the VMSC during summer.
For the current period of analysis (April–May 2019), Fig. 6 shows a remarkable consistency between the HFR and EASTSEA run. An intense flow at the southeastern part of the HFR domain has been detected (Fig. 6a, d). This was influenced by the effects of the large-scale South China Sea western boundary current (SCSWBC) represented by a strong northeastward current. As the monsoon wind changes, the SSC field has a bimodal behavior, where the trace of the SCSWBC in winter (strong current with southerly-southwestward direction) and some features of summer traits (strong jet with eastward–northeastward direction) were both observed in HFR data and presented well in the EASTSEA run at, respectively, the end of April and the middle of May (Fig. 6a–b). The weakening of winter SCSWBC together with the strengthening of southwest monsoon wind caused a seaward flow which was captured both in EASTSEA run and by HFR (Fig. 6c). During calm wind conditions, the southward current prevailed over the HFR domain (Fig. 6b). In the meantime, the currents change direction to the northward and northeastward–eastward directions as southerly–southwesterly wind became stronger (Fig. 6a, c).
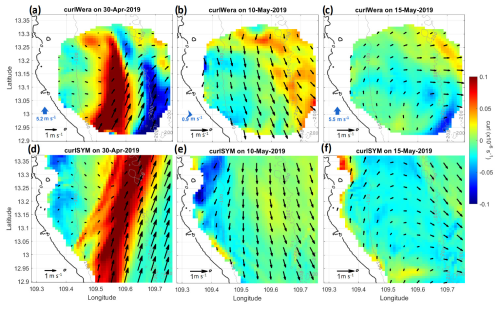
Figure 6SSC vectors obtained from HFR (a–c) and SYMPHONIE (EASTSEA run) (d–e) of the superimposing curl of the SSC field. Blue arrows in the southwest corner denote averaged wind directions and magnitudes over the HFR domain. Isobaths are given as solid gray lines, and coastlines are represented as solid black lines.
Two different evolutions were observed in both time series of HFR and the two model runs (EASTSEA and VMSC_ref) (Fig. 7). From mid-April until the first week of May, strong positive meridional currents were observed in the mid- and far fields of the domain, whereas, at the end of the measurement period, the v component of SSCs was inverted to negative and smaller values. This behavior coincides with the evolution of wind time series, where wind started to change its direction from southerly-southeasterly to southerly-southwesterly. The magnitudes of the SSC v component are found to be strongly correlated in time with wind. However, a large discrepancy in time series of the v component of SSCs was spotted between EASTSEA, VMSC_ref and HFR for the first 20 d associated with southerly–southeasterly wind. During southerly–southwesterly wind conditions, the EASTSEA results show better agreement with HFR. In addition, the zonal component of SSCs was generally underestimated and the meridional component, in contrast, was overestimated in VMSC_ref and EASTSEA compared to those derived from HFR measurements (Fig. 7a–c). This could come from the uncertainty of the wind forcing input used in EASTSEA and VMSC_ref, where the impact of local effects is not described well in the global atmospheric models.
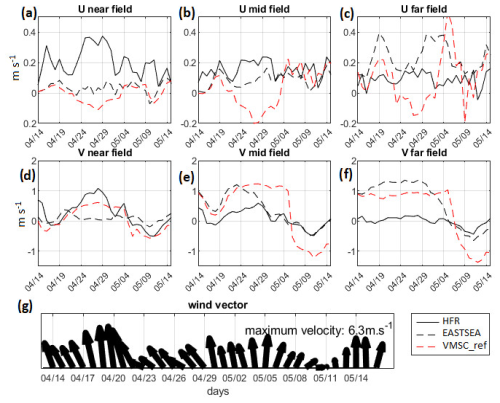
Figure 7Time series of u and v components of SSCs from HFR, EASTSEA and VMSC_ref (a–f). Vector time series of ECMWF wind (g).
The time series of u and, in particular, v components of SSCs show significant differences between EASTSEA and VMSC_ref despite a similar trend being observed. The two runs started deviating after the third week of April (Fig. 7a–f), associated with a dramatic change in wind direction from strong southerly wind to weak easterly wind (Fig. 7g). After the first 10 d of May, the u component of EASTSEA and VMSC_ref show a better agreement, whereas the VMSC_ref still underestimated the v component of SSCs compared to EASTSEA. The cause for this deviation will be discussed in Sect. 5.
The SSC velocities from VMSC_ref, VMSC_EkW and VMSC_EnPS are compared with SSC velocities obtained from HFR measurements. The vector difference map in Fig. 8 reveals that the EkW method seems to deliver a better result for vector error reduction in the middle of the domain, as the SSC vector differences in VMSC_EkW (red arrows) are substantially smaller than those in VMSC_EnPS (blue arrows).
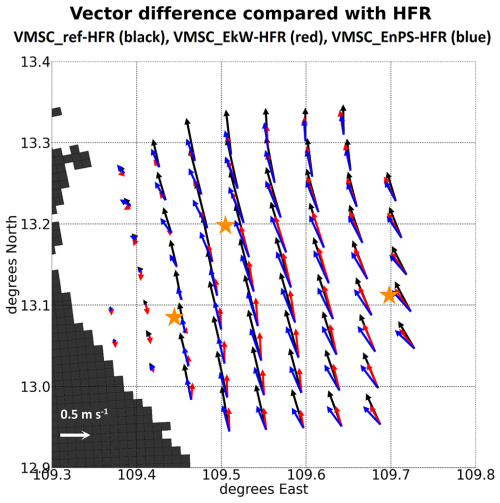
Figure 8Vector differences of SSCs (temporally averaged over the analysis period) between three simulations compared to HFR measurements: VMSC_ref-HFR (black arrow), VMSC_EkW-HFR (red arrow) and VMSC_EnPS-HFR (blue arrow). Locations of three selected points are denoted by orange stars. Vectors were plotted with a three vector point spacing.
In order to evaluate the temporal evolution of velocity fields resulting from different runs (VMSC_ref, VMSC_EnPS and VMSC_EkW) more comprehensively, three points located at near field, mid-field and far field of the HFR domain have been selected for comparison (Fig. 9). Moreover, three subdomains representing near, mid- and far fields, where radar measurements were available, were also defined. The near field is limited within 109.3–109.45° E, mid-field within 109.45–109.6° E and far field within 109.6–109.75° E.
At the near field point, the SSC vectors started rotating from the second day of the period (6 May 2019) to the southeastward direction and had a similar evolution to that of HFR. In the meantime, at mid- and far field points, the SSC time series during the first 2–3 d of the analysis period show no significant response to the change in wind fields. This time lag corresponds to the slow adaptation of surface currents to wind forcing.
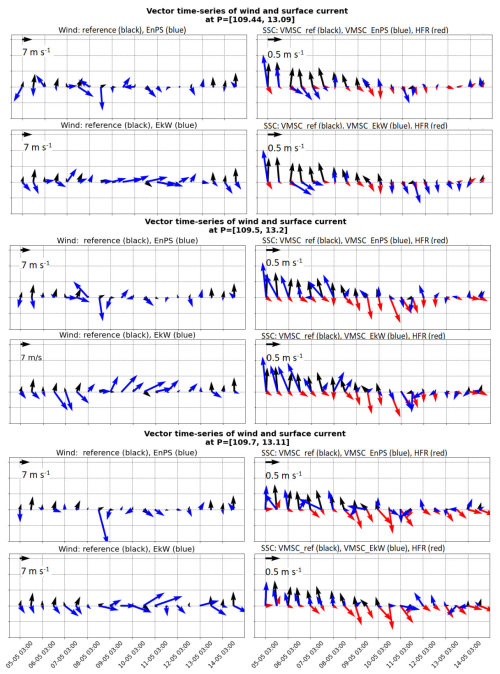
Figure 9Vector time series of wind (reference, EnPS, EkW) and SSCs (VMSC_ref, VMSC_EnPS, VMSC_EkW and HFR) of three points located at near, mid- and far fields of the HFR domain.
ASCAT wind time series at near, mid- and far fields were extracted for comparison with EnPS and EkW winds (Fig. 10). The EnPS wind speed time series has a better agreement with ASCAT wind compared to that in EkW (Fig. 10a–c). Wind speed at mid- and far fields was improved with the EnPS method during 11–13 May (Fig. 10b–c) when the wind blew in the southerly–southwesterly direction (Fig. 7g). Figure 10a–c also reveal that the wind speed in the middle of the analysis period (especially during calm wind conditions) is overestimated in the EkW method, whereas EnPS wind speed curves evolved in a similar manner to ASCAT. In terms of the v component of wind, EkW seems to achieve a better fit to ASCAT at far field (Fig. 10f). The discrepancy between both methods and ASCAT started to increase from 13 May (the gray box on the right of Fig. 10a–f), when the wind speed started to increase considerably (Fig. 7g). The two methods seem to perform well in the middle of the analysis period (8–13 May).
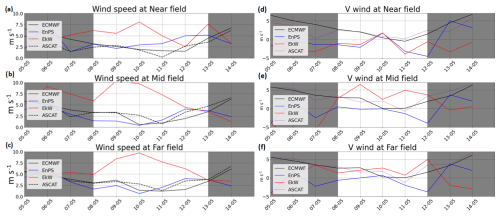
Figure 10Columns: wind speed time series from different wind data (a, b, c) and time series of the v component of wind from wind data (d, e, f). Rows: three subdomains – near field, mid-field and far field.
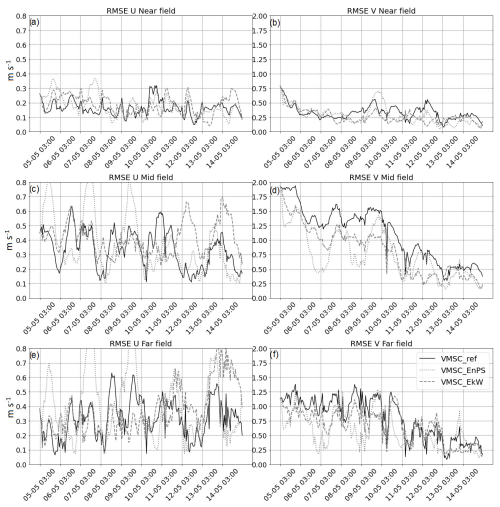
Figure 11RMSE of u and v components of SSCs during the analysis period from different simulations, spatially averaged over three subdomains.
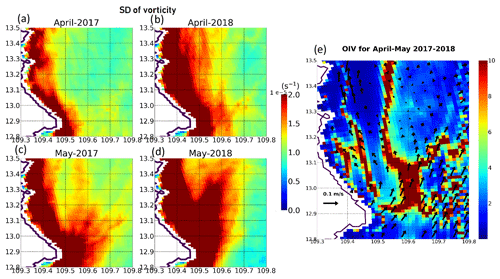
Figure 12(a–d) Monthly mean standard deviation of SSC vorticity for the ensembles. (e) OIV index superimposed with multiannual monthly averaged SSC vectors for April–May 2017–2018.
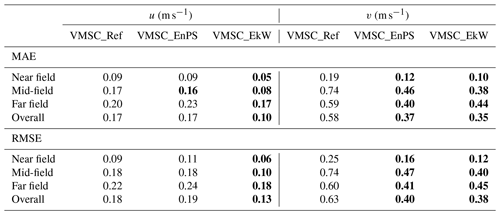
Spatially averaged RMSEs of surface currents between VMSC_ref, VMSC_EkW and VMSC_EnPS against HFR were calculated for the three subdomains. As a result, the RMSE time series of the u component of the SSCs show no clear improvements from both optimization methods (Fig. 11a, c, e). Furthermore, for the v component, the RMSE in VMSC_EkW was reduced significantly (on average, 25 % and 46 % for mid- and far fields, respectively) during the analysis period (Fig. 11b, d, f). For the first 3 d, the RMSE at near field in VMSC_EkW (dash-line) was found to be overall higher than that in the VMSC_ref; however, the RMSE dropped below the reference RMSE line (solid) from 8–14 May (Fig. 11b). For evaluating the optimization performance between EkW and EnPS methods, spatially averaged RMSE and MAE for the three subdomains are used as the evaluation metrics and summarized in Table 2. In most cases, EkW and EnPS errors are reduced compared to the reference run. Both EkW and EnPS are able to mitigate the errors in the v component of SSCs significantly; however, only the EkW method can achieve the error reduction in the u component of SSCs. The subdomain which has the most remarkable improvement after the optimization procedure is the mid-field (36 %–46 % of error reduction).
For the first time, high-resolution surface current velocity data were obtained from HFR measurements along the VMSC. The radar coverage represents approx. 4.5 % of the area of the VMSC domain configured in the model, where the interaction of sea and land and other small-scale coastal processes are in place. These processes are typically not well represented in model simulations due to the lack of high-resolution model forcing data and high-resolution bathymetry. The measurements revealed significant differences between model and data, despite temporal evolutions of all time series (HFR, EASTSEA and VMSC) showing similar trends. Interestingly, surface current velocity fields obtained from EASTSEA and VMSC runs show large variations over time and also a significant difference during some periods of time. This discrepancy could be due to the deviation arising from the forcing propagation at the open boundaries to the smaller-size model domain of computation. In a previous study, in the northwestern Mediterranean Sea, Marmain et al. (2014) concluded that unexpected features of ocean dynamics could come from a small inconsistency at open boundaries. An additional factor that contributes to this discrepancy is the ocean intrinsic variability (OIV), which operates independently of any change in atmospheric forcing conditions. To support the assumption of an important contribution of OIV to coastal flow variability, we investigated the SSC fields using April–May outputs of the SYMPHONIE ensemble simulations performed by Herrmann et al. (2023) over the EASTSEA domain for the years 2017–2018. A total of 10 ensemble simulations were conducted to examine surface currents and upwelling variability off the Vietnamese coast using the concept of OIV. To generate ensembles, small-scale perturbations were introduced in the model initial fields without disturbing the whole forcing data (see Herrmann et al., 2023, for details). Subsequently, the SSC data obtained from these ensemble runs were used to calculate the OIV index and the monthly mean standard deviation of ensemble vorticity () from the SSC field in April–May 2017–2018. The OIV index, explained in Herrmann et al. (2023), is the ratio between the ensemble standard deviation and the ensemble mean of the temporal average over a given period of time of surface currents. It quantifies the contribution of OIV to SSC variability over the selected period, April–May 2017–2018. The analysis of model outputs showed that high values of are found near the coasts of the HFR domain, revealing large fluctuations within the ensembles induced by OIV (Fig. 12a–d). In terms of OIV index, high values (OIV > 10) are observed near the coasts, in particular around 15 km offshore along 12.9–13.1° N, associated with the specific feature of the coastal circulation, i.e., northeastward current jet (Fig. 12e). This result emphasizes that the SSC variability in our study region is significantly influenced by OIV, regardless of external forcing. Similar conclusions and relevant discussions have been raised in previous studies for this region under different names, such as the North Coastal Upwelling (Ngo and Hsin, 2021; To Duy et al., 2022), southern Vietnam upwelling (Da, 2018) and Vietnamese coasts (Metzger, 2003).
The study results above highlight that winds play an important role in the variability of coastal surface currents in the VMSC at small temporal and spatial scales. Different wind forcing conditions used in different model simulations (VMSC_ref, VMSC_EkW and VMSC_EnPS) yielded notably different SSC fields at 1 km resolution during a short time of analysis (5–14 May 2019). As illustrated in Fig. 9e–f, opposite directions of SSC vectors between HFR and VMSC_ref were observed, which indicates that no northeastward current occurred in the HFR domain during the time of analysis, whereas this strong northeastward jet presented clearly in the VMSC_ref simulation. Previous studies also pointed out that Ekman transport associated with winds can modify the position of the northeastward jet and upwelling at the latitudes of 12–14° N (Metzger, 2003; Shaw and Chao, 1994). Moreover, De Gaetano et al. (2010) confirmed the great impacts of different resolutions of wind on the inshore features of surface circulations, especially small-scale processes, i.e., submesoscale eddy formation. Thus, the limitation of grid resolution of the global atmospheric model can cause the incapability to capture the local effects on the wind field, i.e., orographic effects induced by complex terrains and the coastal wind variability during the monsoon transition period. In this particular case, two mountain ranges and a cape in the south of the domain (Fig. 1c) form a “corridor” for winds to blow seaward in a cross-shelf direction. The increase in surface heat at a valley between two mountains causes high convection and a convergence zone at the coasts (Bei et al., 2018). Furthermore, when the activity of larger-scale winds is weak, this phenomenon becomes dominant. Counting the high wind variation during the transition period, the behavior of coastal winds becomes more complex and cannot be resolved at the grid scale of global models. Previously, a warning has been given in Metzger (2003) when using the ECMWF wind product in coastal model as spurious wind stress curls along the coastal boundaries, especially in regions with a complex orography, could reproduce misleading small-scale circulation along the coasts. Another point to be discussed is a poor availability of independently observed wind data for the coastal regions in Vietnam. There are two meteorological stations located in the vicinity of the study area. A comparison was conducted between wind time-series data from these two meteorological stations and wind data from the ECMWF, EkW and EnPS during the analysis period. The resulting correlations were found to be relatively low (less than 0.3) due to their distance inland from the coastline (10 and 15 km), indicating that the data are not representative of winds in the open sea. In contrast, the ASCAT wind data used for validation have a very coarse resolution (0.25° ∼ 25 km) assumed to be insufficient for representing the wind field close to the coastlines. The comparison between model runs and ASCAT data in Fig. 10 already shows that the behaviors of winds amongst different wind time series are more comparable at far field, where the land morphology and orography no longer have impacts on coastal dynamics.
The EnPS and EkW methods have been applied to different periods (both April and May), but only the period from 5–14 May was selected for analysis. During this period, the current velocity maps from HFR demonstrated large variability in circulation patterns (Fig. 6a, b, c) which were not consistent with the evolution of the ECMWF wind. Furthermore, a significant discrepancy was observed between the model and observations in the v component of the surface currents accompanied by a considerable change in wind direction (Fig. 7e, f, g). In light of this evidence, our hypothesis was that wind forcing was the primary source of errors in model simulations. However, the optimization results showed that both methods exhibited limitations in producing an optimal wind field for the entire analysis period. At mid-field and far field, the EnPS method achieved a better wind field compared to ECMWF wind data; however, large discrepancies still occurred during the period when the ECMWF showed good agreements with ASCAT winds. This could be explained by the fact that nearshore circulations (the first ∼ 30 km offshore) are governed not only by winds but by other processes, as explained above. Moreover, the optimization methods performed better during southerly and southwesterly winds and are sensitive to the change in wind direction and when wind speed is weak. This constraint could be due to the insufficient number of ensembles used in the EnPS method. In this research, only a cluster of 50 wind forcing ensemble members were used, while Barth et al. (2011) used 100 wind ensemble members for correcting the model surface currents to obtain good statistics for calculating covariances. In the case of the EkW method, a constant drag coefficient was used instead of a wind-dependent one. The sensitivity to the drag coefficient variation has not yet been tested.
The coastal dynamics of the VMSC, especially within the HFR measurement domain, during the transition period of the summer monsoon are influenced by various factors, amongst others winds, coastal topography and larger-scale background circulation variability. Compared to SSCs obtained from HFR measurements, the SYMPHONIE model is able to characterize the coastal circulation variability as it could capture relatively well the spatial patterns of SSCs. However, a large discrepancy in velocity time series between model and HFR is found in April associated with the easterly and southeasterly winds. This is a limitation of the model in simulating coastal circulation under complex variation in wind.
The EnPS and EkW methods show improvements in the v component of SSCs as RMSE and MAE reduced remarkably (36 %–40 %), whereas there are no significant improvements in the u component. The bottleneck of this study is that there are no nearby offshore wind stations or wind measurements during the HFR measurement period for validation. Wind data records at two nearest meteorological stations are not representative as the stations are located inland and far from the shore. The ASCAT wind data used for validation have a very coarse resolution that thus cannot describe the wind behavior due to orographic effects close to the coasts. Therefore, a comprehensive measurement campaign including wind measurements should be considered in the next step of our future work on the region.
Although the overall discrepancies were reduced by ∼ 40 %, a good agreement between the SSC time series obtained from HFR measurements and that from wind-optimized model runs has still not yet been established. Especially during calm wind conditions, strong southeastward current velocities are still present all over the HFR domain. This phenomenon could be governed by different processes, for instance, the background circulation at larger scales from outside of the VMSC domain. Thus, wind optimization alone is not capable of delivering sufficient improvement to simulation results of surface currents. For this reason, OBC optimization should be tested in the next step of our study with an expectation to obtain a better model simulation of the coastal dynamical processes in the VMSC region.
Last but not least, the optimization results revealed that the surface circulation is influenced not only by winds but also by other factors such as intrinsic ocean variability, which is not entirely controlled by boundary conditions. Another factor which contributes to the variability in the velocity field within the study region could be the interaction of a powerful flow with headlands: the cape located in the south of the domain produces small-scale features of circulation, i.e., eddies. This indicates the potential usefulness of large velocity datasets, amongst others an adequate monitoring network with good coverage and temporal resolution, i.e., HFR systems, and other data fusion methods to effectively improve modeling results in such highly dynamic regions.
Figure A1 shows accuracy values which were extracted from the standard WERA Data Viewer provided by the HFR manufacturer. Higher uncertainties of both u and v components of SSCs from HFR measurements are found in the offshore range starting from a distance of ∼ 40 km. The high values (high noise level) are associated with the occurrence of a 50 Hz noise band and its harmonics caused by the electrical power supply in the surrounding areas of WERA locations. Spurious radial currents are the result of the smeared-out signal of noise with the first-order peaks (which give the information of radial currents) in the Doppler spectra. Although most of the spikes in the original HFR data have been removed, the noise still contaminated some parts of the domain, in particular at a range of more than 40 km, where 50 Hz harmonic noise bands are present.
The SYMPHONIE model can be downloaded free of charge from https://sirocco.obs-mip.fr/ocean-models/s-model/download/ and is presented in Marsaleix et al. (2008). Atmospheric forcing data and ocean data used as initial ocean conditions and lateral ocean boundary conditions are available at https://doi.org/10.5281/zenodo.13253327 (Tran and Herrmann, 2024). Measurement data (HFR and AWAC) should be requested from CEFD-HUS/VNU and cannot be provided by the authors. The code of the optimization methods can be provided upon request.
TTD and MH built the model configuration and ran the simulation from 2009–2018. MH provided model forcing data and ensemble outputs for OIV analysis. AS and THT worked on the optimization and analysis methods and designed the experiments. SO contributed to paper writing. KCN provided measurement data from HFR and was responsible for the project funding. THT prepared the paper and collected all contributions from other authors.
The contact author has declared that none of the authors has any competing interests.
Publisher's note: Copernicus Publications remains neutral with regard to jurisdictional claims made in the text, published maps, institutional affiliations, or any other geographical representation in this paper. While Copernicus Publications makes every effort to include appropriate place names, the final responsibility lies with the authors.
The first author was supported by the joint Doctoral Program between the University of the Littoral Opal Coast (ULCO) and the University of Science and Technology of Hanoi (USTH), the LOTUS international joint laboratory program (lotus.usth.edu.vn), and the Vietnam Academy of Science and Technology (grant no. VAST06.05/22-23). This research was funded by the Vingroup Innovation Foundation (VINIF) under project code VINIF.2023.DA151. The HFR data were collected from the measurement campaign in Phu Yen in 2019 and provided by the Center for Environmental Fluid Dynamics, University of Science, Vietnam National University (CEFD-HUS/VNU).
This research has been supported by the Quy Đoi mói sáng tạo Vingroup (grant no. VINIF.2023.DA151).
This paper was edited by John M. Huthnance and reviewed by two anonymous referees.
Barth, A., Alvera-Azcárate, A., Beckers, J. M., Weisberg, R. H., Vandenbulcke, L., Lenartz, F., and Rixen, M.: Dynamically constrained ensemble perturbations – Application to tides on theWest Florida Shelf, Ocean Sci., 5, 259–270, https://doi.org/10.5194/os-5-259-2009, 2009.
Barth, A., Alvera-Azcárate, A., Beckers, J. M., Staneva, J., Stanev, E. V., and Schulz-Stellenfleth, J.: Correcting surface winds by assimilating high-frequency radar surface currents in the German Bight, Ocean Dynam., 61, 599–610, https://doi.org/10.1007/s10236-010-0369-0, 2011.
Bei, N., Zhao, L., Wu, J., Li, X., Feng, T., and Li, G.: Impacts of sea-land and mountain-valley circulations on the air pollution in Beijing-Tianjin-Hebei (BTH): A case study, Environ. Pollut., 234, 429–438, https://doi.org/10.1016/j.envpol.2017.11.066, 2018.
Centurioni, L. R., Niiler, P. N., and Lee, D. K.: Near-surface circulation in the South China Sea during the winter monsoon, Geophys. Res. Lett., 36, 1–6, https://doi.org/10.1029/2008GL037076, 2009.
Chen, C., Lai, Z., Beardsley, R. C., Xu, Q., Lin, H., and Viet, N. T.: Current separation and upwelling over the southeast shelf of Vietnam in the South China Sea, J. Geophys. Res.-Ocean., 117, 1–16, https://doi.org/10.1029/2011JC007150, 2012.
Codiga, D. L.: Unified Tidal Analysis and Prediction Using the UTide MatlabFunctions, Technical Report 2011-01, Graduate School of Oceanography, University of Rhode Island, Narragansett, RI, 59 pp., https://doi.org/10.13140/RG.2.1.3761.2008, 2011.
Cosoli, S., Ličer, M., Vodopivec, M., and Malačič, V.: Surface circulation in the Gulf of Trieste (northern Adriatic Sea) from radar, model, and ADCP comparisons, J. Geophys. Res.-Ocean., 118, 6183–6200, https://doi.org/10.1002/2013JC009261, 2013.
Cosoli, S., Pattiaratchi, C., and Hetzel, Y.: High-Frequency Radar Observations of Surface Circulation Features along the South-Western Australian Coast, J. Mar. Sci. Eng., 8, 97, https://doi.org/10.3390/jmse8020097, 2020.
Da, N. D.: The interannual variability of the South Vietnam Upwelling: contributions of atmospheric, oceanic, hydrologic forcing and the ocean intrinsic variability, Ocean, Atmosphere, PhD. Thesis, Université Toulouse 3 Paul Sabatier (UT3 Paul Sabatier), 168 pp., HAL: tel-01849114, 2018.
Da, N. D., Herrmann, M., Morrow, R., Niño, F., Huan, N. M., and Trinh, N. Q.: Contributions of Wind, Ocean Intrinsic Variability, and ENSO to the Interannual Variability of the South Vietnam Upwelling: A Modeling Study, J. Geophys. Res.-Ocean., 124, 6545–6574, https://doi.org/10.1029/2018JC014647, 2019.
Ting, D. S.-K.: Wall Turbulence, in: Basics of Engineering Turbulence, edited by: David, S.-K. T., Elsevier Inc., 119–138, https://doi.org/10.1016/C2015-0-00322-7, 2016.
De Gaetano, P., Burlando, M., Doglioli, A. M., and Petrenko, A. A.: Wind forcing effects on coastal circulation and eddy formation around a cape, Ocean Sci. Discuss., 7, 207–249, https://doi.org/10.5194/osd-7-207-2010, 2010.
Duy, T., Herrmann, M., Estournel, C., Marsaleix, P., Duhaut, T., Bui Hong, L., and Trinh Bich, N.: The role of wind, mesoscale dynamics, and coastal circulation in the interannual variability of the South Vietnam Upwelling, South China Sea – answers from a high-resolution ocean model, Ocean Sci., 18, 1131–1161, https://doi.org/10.5194/os-18-1131-2022, 2022.
Estournel, C., Auclair, F., Lux, M., Nguyen, C., and Marsaleix, P.: “Scale oriented” embedded modeling of the North-Western Mediterranean in the frame of MFSTEP, Ocean Sci., 5, 73–90, https://doi.org/10.5194/os-5-73-2009, 2009.
Fang, G., Wang, G., Fang, Y., and Fang, W.: A review on the South China Sea western boundary current, Acta Oceanol. Sin., 31, 1–10, https://doi.org/10.1007/s13131-012-0231-y, 2012.
Gu, H. and Mao, Y.: Multi-Timescale Characteristics of Southwestern Australia Nearshore Surface Current and Its Response to ENSO Revealed by High-Frequency Radar, Remote Sens., 16, 209, https://doi.org/10.3390/rs16010209, 2024.
Herrmann, M. and To Duy, T.: Mechanisms and intraseasonal variability of the South Vietnam Upwelling, South China Sea: role of circulation, tides and rivers, EGUsphere [preprint], https://doi.org/10.5194/egusphere-2024-368, 2024.
Herrmann, M., To Duy, T., and Estournel, C.: Intraseasonal variability of the South Vietnam upwelling, South China Sea: influence of atmospheric forcing and ocean intrinsic variability, Ocean Sci., 19, 453–467, https://doi.org/10.5194/os-19-453-2023, 2023.
Large, W. G. and Yeager, S.:Diurnal to decadal global forcing for ocean and sea-ice models: The data sets and flux climatologies, University Corporation for Atmospheric Research, https://doi.org/10.5065/D6KK98Q6, 2004.
Lauton, G., Marta-Almeida, M., and Lentini, C. A. D.: The Effect of Currents on Large Surface Gravity Waves Under Cyclonic Conditions in the South/Southeastern Brazil, J. Geophys. Res.-Ocean., 128, 1–16, https://doi.org/10.1029/2022JC018472, 2023.
Li, Y., Han, W., Wilkin, J. L., Zhang, W. G., Arango, H., Zavala-Garay, J., Levin, J., and Castruccio, F. S.: Interannual variability of the surface summertime eastward jet in the South China Sea, J. Geophys. Res.-Ocean., 119, 7205–7228, https://doi.org/10.1002/2014JC010206, 2014.
Mantovani, C., Corgnati, L., Horstmann, J., Rubio, A., Reyes, E., Quentin, C., Cosoli, S., Asensio, J. L., Mader, J., and Griffa, A.: Best Practices on High Frequency Radar Deployment and Operation for Ocean Current Measurement, Front. Mar. Sci., 7, 1–21, https://doi.org/10.3389/fmars.2020.00210, 2020.
Marmain, J., Molcard, A., Forget, P., Barth, A., and Ourmieres, Y.: Assimilation of hf radar surface currents to optimize forcing in the northwestern mediterranean sea, Nonlinear Process. Geophys., 21, 659–675, https://doi.org/10.5194/npg-21-659-2014, 2014.
Marsaleix, P., Auclair, F., Floor, J. W., Herrmann, M. J., Estournel, C., Pairaud, I., and Ulses, C.: Energy conservation issues in sigma-coordinate free-surface ocean models, Ocean Model., 20, 61–89, https://doi.org/10.1016/j.ocemod.2007.07.005, 2008 (code available at https://sirocco.obs-mip.fr/ocean-models/s-model/download/, last access: 20 April 2023).
Marsaleix, P., Auclair, F., Duhaut, T., Estournel, C., Nguyen, C., and Ulses, C.: Alternatives to the Robert–Asselin filter, Ocean Model., 41, 53–66, https://doi.org/10.1016/j.ocemod.2011.11.002, 2012.
Metzger, E. J.: Upper ocean sensitivity to wind forcing in the South China Sea, J. Oceanogr., 59, 783–798, https://doi.org/10.1023/B:JOCE.0000009570.41358.c5, 2003.
Ngo, M. H. and Hsin, Y. C.: Impacts of Wind and Current on the Interannual Variation of the Summertime Upwelling Off Southern Vietnam in the South China Sea, J. Geophys. Res.-Ocean., 126, 1–23, https://doi.org/10.1029/2020JC016892, 2021.
Nguyen, D. T.: Variability of the Red River plume in the Gulf of Tonkin from stochastic modeling and cluster analysis, Ocean, Atmosphere, PhD Thesis, Université Paul Sabatier, Toulouse III, 178 pp., NNT: 2022TOU30089, HAL: tel-03828544, 2022.
Nguyen-Duy, T., Ayoub, N. K., De-Mey-Frémaux, P., and Ngo-Duc, T.: How sensitive is a simulated river plume to uncertainties in wind forcing? A case study for the Red River plume (Vietnam), Ocean Model., 186, 102256, https://doi.org/10.1016/j.ocemod.2023.102256, 2023.
Potemra, J. T. and Qu, T.: Ocean currents -The Oceans: The Parcific Ocean, Nature, 3, 117–118, https://doi.org/10.1038/003469a0, 2009.
Rogowski, P., Zavala-Garay, J., Shearman, K., Terrill, E., Wilkin, J., and Lam, T. H.: Air-Sea-Land Forcing in the Gulf of Tonkin: Assessing Seasonal Variability Using Modern Tools, Oceanography, 32, 150–161, https://doi.org/10.5670/oceanog.2019.223, 2019.
Sentchev, A., Forget, P., Barbin, Y., and Yaremchuk, M.: Surface circulation in the Iroise Sea (W. Brittany) from high resolution HF radar mapping, J. Mar. Syst., 109–110, S153–S168, https://doi.org/10.1016/j.jmarsys.2011.11.024, 2013.
Shaw, P. T. and Chao, S. Y.: Surface circulation in the South China Sea, Deep-Sea Res. Pt. I, 41, 1663–1683, https://doi.org/10.1016/0967-0637(94)90067-1, 1994.
Sim, S. K., Peinke, J., and Maass, P.: Signatures of geostrophic turbulence in power spectra and third – order structure function of offshore wind speed fluctuations, Sci. Rep., 13, 13411, https://doi.org/10.1038/s41598-023-40450-9, 2023.
To Duy, T., Herrmann, M., Estournel, C., Marsaleix, P., Duhaut, T., Bui Hong, L., and Trinh Bich, N.: The role of wind, mesoscale dynamics, and coastal circulation in the interannual variability of the South Vietnam Upwelling, South China Sea – answers from a high-resolution ocean model, Ocean Sci., 18, 1131–1161, https://doi.org/10.5194/os-18-1131-2022, 2022.
Tran, M. C., Sentchev, A., Berti, S., Ayoub, N. K., Nguyen-Duy, T., and Cuong, N. K.: Assessment of relative dispersion in the Gulf of Tonkin using numerical modeling and HF radar observations of surface currents, Cont. Shelf Res., 245, 104784, https://doi.org/10.1016/j.csr.2022.104784, 2022a.
Tran, T. H. and Herrmann, M.: Atmospheric forcing and OGCM conditions for the year 2019 over the South China Sea, Zenodo [data set], https://doi.org/10.5281/zenodo.13253327, 2024.
Tran, T. H., Sentchev, A., Tran, M. C., Duc Dang, D., and Helzel, T.: Assessments of surface current variability along the mid-southern coast of Vietnam from high-frequency (HF) radar measurements, OCEANS 2022 – Chennai, Chennai, India, 21–24 February 2022, 1–5, https://doi.org/10.1109/OCEANSChennai45887.2022.9775414, 2022b.
Trinh, N. B., Herrmann, M., Ulses, C., Marsaleix, P., Duhaut, T., To Duy, T., Estournel, C., and Shearman, R. K.: New insights into the South China Sea throughflow and water budget seasonal cycle: evaluation and analysis of a high-resolution configuration of the ocean model SYMPHONIE version 2.4, Geosci. Model Dev., 17, 1831–1867, https://doi.org/10.5194/gmd-17-1831-2024, 2024.
Wang, G., Chen, D., and Su, J.: Generation and life cycle of the dipole in the South China Sea summer circulation, J. Geophys. Res.-Ocean., 111, C06002, https://doi.org/10.1029/2005JC003314, 2006.
Wang, L., Chen, H., Chowdary, J. S., Ha, K.-J., Kajikawa, Y., and Martin, G.: Editorial: The Asian Monsoon, Front. Earth Sci., 9, 748811, https://doi.org/10.3389/feart.2021.748811, 2021.
Weber, J. E.: Steady Wind- and Wave-Induced Currents in the Open Ocean, Phys. Oceanogr., 13, 524–530, 1983.
Wu, Y., Tang, Q., Chen, Z., Liu, Y., and Zhou, C.: Diurnal and Seasonal Variation of High-Frequency Gravity Waves at Mohe and Wuhan, Atmosphere, 13, 1069, https://doi.org/10.3390/atmos13071069, 2022.
Yang, Z., Wang, G., and Chen, C.: Horizontal velocity structure of mesoscale eddies in the South China Sea, Deep-Sea Res. Pt. I, 149, 103055, https://doi.org/10.1016/j.dsr.2019.06.001, 2019.
Yaremchuk, M. and Sentchev, A.: Mapping radar-derived sea surface currents with a variational method, Cont. Shelf Res., 29, 1711–1722, https://doi.org/10.1016/j.csr.2009.05.016, 2009.
Yaremchuk, M. and Sentchev, A.: A combined EOF/variational approach for mapping radar-derived sea surface currents, Cont. Shelf Res., 31, 758–768, https://doi.org/10.1016/j.csr.2011.01.009, 2011.
Zhou, H., Yuan, D., Li, R., and He, L.: The western South China Sea currents from measurements by Argo profiling floats during October to December 2007, Chinese J. Oceanol. Limnol., 28, 398–406, https://doi.org/10.1007/s00343-010-9052-z, 2010.
- Abstract
- Introduction
- Methodology
- The VMSC hydrodynamics characterization during the monsoon transition period (April–May)
- Evaluation of modeled surface currents resulting from wind forcing optimization
- Discussion
- Conclusion and future work
- Appendix A
- Code and data availability
- Author contributions
- Competing interests
- Disclaimer
- Acknowledgements
- Financial support
- Review statement
- References


