the Creative Commons Attribution 4.0 License.
the Creative Commons Attribution 4.0 License.
Hydrography and circulation below Fimbulisen Ice Shelf, East Antarctica, from 14 years of moored observations
Tore Hattermann
Laura de Steur
Elin Darelius
Agneta Fransson
Future mass loss from the East Antarctic Ice Sheet represents a major uncertainty in projections of future sea level rise. Recent studies have highlighted the potential vulnerability of the East Antarctic Ice Sheet to atmospheric and oceanic changes, but long-term observations inside the ice shelf cavities are rare. Here, we present new insights from observations from three oceanic moorings below Fimbulisen Ice Shelf from 2009 to 2023. We examine the characteristics of intrusions of modified Warm Deep Water (mWDW) across a sill connecting the cavity to the open ocean and investigate seasonal variability of the circulation and water masses inside the cavity using an optimum multiparameter analysis. In autumn, the water below the 345 m deep central part of the ice shelf is composed of up to 30 % solar-heated, buoyant Antarctic Surface Water (ASW), separating colder Ice Shelf Water from the ice base and affecting the cavity circulation on seasonal timescales. At depth, the occurrence of mWDW is associated with the advection of cyclonic eddies across the sill into the cavity. These eddies reach up to the ice base. The warm intrusions are observed most often from January to March and from September to November, and traces of mWDW-derived meltwater close to the ice base imply an overturning of these warm intrusions inside the cavity. We suggest that this timing is set by both the offshore thermocline depth and the interactions of the Antarctic Slope Current with the ice shelf topography over the continental slope. Our findings provide a better understanding of the interplay between shallow inflows of ASW contributions and deep inflows of mWDW for basal melting at Fimbulisen Ice Shelf, with implications for the potential vulnerability of the ice shelf to climate change.
- Article
(10006 KB) - Full-text XML
- BibTeX
- EndNote
Mass loss from the Antarctic ice sheet is certain to contribute to future sea level rise (DeConto and Pollard, 2016; DeConto et al., 2021). Ice shelf thinning through basal melting (Pritchard et al., 2012) and iceberg calving (Greene et al., 2022) is the main source for this mass loss as it reduces the buttressing of the inland ice and can accelerate its discharge (Dupont and Alley, 2005; Reese et al., 2018). Still, major uncertainties in future sea level rise projections originate from the Antarctic ice sheet (Edwards et al., 2021). The West Antarctic ice shelves are subject to rapid basal mass loss of up to tens of meters per year (Rignot et al., 2013; Adusumilli et al., 2020a), which has been attributed to direct access of Circumpolar Deep Water (CDW) to the cavities (e.g., Dutrieux et al., 2014; Jenkins et al., 2018). In contrast, most East Antarctic ice shelves experience lower basal melt rates on the order of 1 m yr−1 (Adusumilli et al., 2020a). However, in recent years, observations have revealed that some East Antarctic ice shelves are more exposed to warm water masses and subject to basal melting that is higher than previously thought (Rintoul et al., 2016; Hirano et al., 2020; Lauber et al., 2023; Ribeiro et al., 2023). These localized observations coincide with a long-term warming and poleward shift in CDW off East Antarctica, with possible implications of increased basal melting of this part of the ice sheet (Herraiz-Borreguero and Naveira Garabato, 2022). Yet most East Antarctic ice shelf cavities remain unexplored to date, so the governing oceanic processes and the response of the ice shelves to oceanic changes remain uncertain.
Fimbulisen Ice Shelf (referred to as Fimbulisen in the following) is located around the prime meridian at the coast of Dronning Maud Land. The ice shelf is an important buttress of the inland ice (Fürst et al., 2016) and is located within a catchment that contains ice equivalent to 3.1 m of global sea level rise (Tinto et al., 2019). In this region and along the whole Dronning Maud Land coast, Warm Deep Water (WDW), a derivative of CDW that has been advected poleward within the eastern limb of the Weddell Gyre, is located in the direct vicinity of the ice shelves off the narrow continental shelf. In front of the ice shelves, the WDW is depressed due to prevailing easterly winds, which induce a southward Ekman transport and downwelling at the coast (Sverdrup, 1954). This creates the Antarctic Slope Front (ASF) and the associated westward geostrophic Antarctic Slope Current (ASC; Jacobs, 1991; Thompson et al., 2018). The ASF shields the cavities from most of the WDW and thus prevents high basal melt rates, although small amounts of WDW have been observed to access the continental shelf through eddies as part of the ASF overturning (Nøst et al., 2011).
Most of the water inside the Fimbulisen cavity is close to the surface freezing temperature (Nicholls et al., 2006, 2008). This water mass originates from surface cooling and the addition of salt during the sea ice freezing season in the open ocean and is referred to as Winter Water (WW; Nicholls et al., 2009). In turn, surface warming and sea ice melt around summer add heat and freshwater to the coastal water column, creating a lighter water mass called Antarctic Surface Water (ASW; Nicholls et al., 2009). When wind-driven downwelling of ASW exceeds the ice shelf draft, ASW can enter below Fimbulisen (Zhou et al., 2014; Hattermann et al., 2012). When any of the three coastal water masses (ASW, WW, or WDW) comes in direct contact with the ice shelf, the ice will melt at a rate depending on the thermal forcing (Jenkins, 1999), i.e., the difference between the ocean temperature and the in situ freezing point. Turbulence in the ice–ocean boundary layer below the ice controls the efficiency of the heat transfer toward the ice base (McPhee and Morison, 2001). Basal melting produces glacial meltwater (GMW; Jenkins, 1999), and if the mixing product with the adjacent cavity water masses is colder than the surface freezing temperature, the water is called Ice Shelf Water (ISW; Foldvik et al., 2004). Due to the GMW input, ISW is less saline and hence more buoyant than its oceanic source, such that it typically rises along the ice shelf base (Nøst and Foldvik, 1994). The mixing of a water mass with GMW occurs along a straight line (along which density decreases) in temperature–salinity space (Gade, 1979). These mixing lines have been used to infer overturning inside the Fimbulisen cavity by relating water masses observed close to the seafloor and below the ice base (Nicholls et al., 2008; Hattermann et al., 2012).
Several modeling studies have investigated the oceanic conditions below Fimbulisen. In particular, Smedsrud et al. (2006) suggested that the deep ASC modulates the inflow of WDW into the cavity via bottom Ekman transport. This mechanism was supported by observations of the ASC in front of the ice shelf (Núñez-Riboni and Fahrbach, 2009). Hattermann et al. (2014) found that, during summer, the circulation below Fimbulisen at the seafloor follows the bathymetry, and the circulation at the ice base follows the ice shelf draft. These baroclinic conditions were attributed to increased stratification during that season. In winter, Hattermann et al. (2014) found more barotropic conditions due to a well-mixed water column that allows for less vertical shear. Furthermore, Hattermann et al. (2014) found a distinct seasonal cycle in modified WDW (mWDW, a mixture between WW and WDW) inflow related to seasonal temperature variations of 0.4 °C in the inflow path. The timing of the mWDW inflow in their model did not, however, coincide with the seasonal minimum in the offshore WDW layer depth. These modeling results have only been validated by direct observations to a very limited extent and contrast upstream (Hirano et al., 2020; Ohshima et al., 1996) and downstream (Ryan et al., 2017, 2020; Semper and Darelius, 2017) observations showing a coinciding timing of a shallow offshore thermocline and mWDW/WDW inflow.
Hattermann et al. (2012) and Lauber et al. (2023) have discussed the interannual variability in inflows of mWDW below Fimbulisen. Lauber et al. (2023) argued that these warm inflows occurred more frequently when the offshore WDW (and the associated thermocline) shoaled and shifted southward, driven by changes in local and remote winds and sea ice cover, although the detailed dynamics of the warm inflows were not further investigated. The thermocline above the continental slope in the southern Weddell Gyre is known to shoal during summer (Hattermann, 2018; Darelius et al., 2024), and over the 1100 m isobath 450 km upstream of Fimbulisen, the shallowest thermocline has been observed in March (Lauber et al., 2024a). However, there was no evident increase in sub-ice-shelf temperatures during this month. Lauber et al. (2024a) therefore suggested that additional processes like bottom Ekman transport (Smedsrud et al., 2006; Núñez-Riboni and Fahrbach, 2009) and potential vorticity dynamics at the ice front (Wåhlin et al., 2020; Steiger et al., 2022) may locally modulate the mWDW access to the cavity.
A regime shift toward more sustained mWDW inflow below Fimbulisen was observed in 2016, associated with an almost doubling of the long-term basal melt rate of 0.67 m yr−1 (Lauber et al., 2023). To improve projections of future changes, a more detailed understanding of the oceanic processes below the ice shelf is needed. To address this issue, we analyze 14 years (2009–2023) of near-continuous oceanographic observations of temperature, dissolved oxygen, velocity, and (to a limited extent) salinity from six instruments on three moorings below Fimbulisen. Based on these data, we investigate the hourly to seasonal variability in the hydrography and circulation inside the cavity. We characterize the mWDW intrusions at depth and perform an optimum multiparameter analysis to quantify the water mass composition inside the cavity. The sub-ice-shelf moorings, auxiliary data of open-ocean hydrography, and methods are described in Sect. 2. The mooring time series, derived water mass distributions, and details of mWDW intrusions are presented in Sect. 3. Implications of the results are discussed in Sect. 4 and conclusions are summarized in Sect. 5.
2.1 Ice shelf geometry
Fimbulisen is the seaward extension of the Jutulstraumen ice stream, creating a north–south-oriented keel centered on the prime meridian. Here, the ice shelf draft is more than 300 m deep compared to 100 to 200 m west and east of the keel (Fig. 1a; Morlighem et al., 2020). The keel is cross-cut by basal channels of up to a few kilometers in width, and its thickness increases to more than 1000 m in the grounding zone.
The bathymetry below Fimbulisen has been mapped at 183 seismic stations (Nøst, 2004) and has been later refined based on airborne gravity data (Eisermann et al., 2020a). These data reveal a more than 1000 m deep basin below the central part of Fimbulisen, with the deepest connection to the open ocean being a 570 m deep sill crosscutting the continental slope (Fig. 1b; referred to as main sill hereafter). The main sill is the most obvious pathway for mWDW/WDW to enter the cavity. Another inflow pathway has been proposed over a shallower sill of 420 m depth below the eastern part of Fimbulisen (referred to as eastern sill hereafter; Nicholls et al., 2006). A unique feature of the geometry of Fimbulisen is that the ice shelf extends several tens of kilometers northward of the continental shelf break. This part of the ice shelf is called Trolltunga and is known to be directly exposed to the ASC (Price et al., 2008; Walkden et al., 2009).
The water column thickness is the difference between the bottom depth and the ice draft (Fig. 1c). Modeling results of the Fimbulisen cavity have shown that the flow is oriented along isolines of water column thickness when the stratification is weak (Hattermann et al., 2014). At the ice front, the water column thickness features a discontinuity that may modulate the local flow dynamics (Wåhlin et al., 2020).
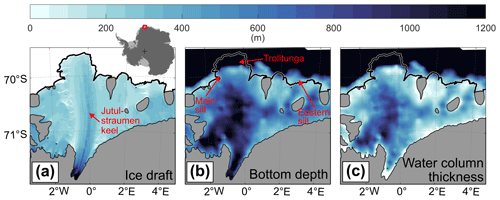
Figure 1(a) Ice draft (Morlighem et al., 2020), (b) bottom depth (Eisermann et al., 2020a), and (c) water column thickness (depth with the ice draft subtracted) of Fimbulisen. The black line indicates the ice front and coastline, and gray patches are grounded ice (Mouginot et al., 2017). Place names mentioned in the text are marked.
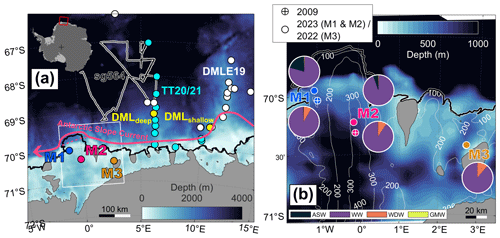
Figure 2(a) Map of the study area indicating the positions of the sub-ice-shelf moorings M1 and M2 in 2023 and M3 in 2022 (blue, red, and orange dots), offshore moorings DMLdeep and DMLshallow (yellow dots), Troll Transect 2020/21 CTD stations (TT20/21, cyan dots), Southern Ocean Ecosystem cruise 2019 CTD stations (DMLE19, white dots), and track of Seaglider sg564 (black–white line). The white box marks the zoomed-in area in panel (b). The color map shows the bathymetry from Eisermann et al. (2020a) south of 69° S, from Eisermann et al. (2024) east of 8° E, and from BedMachine (Morlighem et al., 2020) otherwise. The black line indicates the ice front and coastline (Mouginot et al., 2017), and gray patches are grounded ice (Mouginot et al., 2017). (b) Zoomed area showing the M1 and M2 positions in 2009 and 2023 and the M3 position in 2009 and 2022. Pie charts indicate the mean water mass distribution in 2010 estimated from the optimum multiparameter analysis for all upper (indicated north of the location) and lower (indicated south of the location) instruments (except M3upper due to missing salinity). The corresponding values are given in Table 3. The color map shows the bathymetry from Eisermann et al. (2020a), and the white contours indicate the 10 km smoothed ice shelf draft in meters (Morlighem et al., 2020).
2.2 Sub-ice-shelf moorings
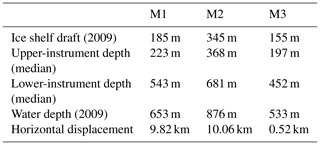
Three oceanographic moorings (M1-3) were deployed below Fimbulisen through hot-water-drilled boreholes in December 2009 (Fig. 2; Hattermann et al., 2012). M1 was placed over the main sill to monitor intrusions of mWDW/WDW. M2 was located 50 km southeast of M1 following contours of water column thickness into the cavity. M3 was located downstream of the eastern sill. The moorings were equipped with two instruments each, an upper one around 30 m below the ice base and a lower one around 100 m above the seafloor. In the following, these instruments are referred to as M1lower, M2upper, etc. With respect to the ice draft, M1 was located on the western side of the Jutulstraumen keel, and M2 was located right below it in a southwest–northeast-oriented 1.5 km wide and 75 m deep basal channel. M3 was deployed east of the Jutulstraumen keel. The depths of the instruments, the ice draft and water depth at the moorings, and their horizontal displacement due to ice velocity are given in Table 1. All six instruments were Aanderaa RCM9 equipped with an Oxygen Optode 3830 and measured temperature (at a primary and secondary sensor), conductivity, dissolved oxygen, horizontal velocity, and pressure at hourly intervals. All sensors except the secondary temperature sensor were calibrated before deployment. The data up to January 2012 have been analyzed by Hattermann et al. (2012) and the data up to January 2019 by Lauber et al. (2023). The latest data were recovered in December 2023 at M1 and M2 and in January 2022 at M3. Gaps in some variables were caused by temporary or permanent instrument failures. Spikes outside the reasonable ranges of the variables were removed after visual inspection.
The primary temperature sensors did not show any obvious drift over the 14 years, except at M3lower, where the sensor drifted from 2014 on. Therefore, after this point in time, the temperatures recorded by the secondary sensor (corrected by the time-mean offset between the two sensors before the drift) were used at M3lower (Lauber et al., 2024c). The observed in situ temperature was converted into conservative temperature following TEOS-10 and the Gibbs-SeaWater Toolbox (McDougall and Barker, 2011).
The conductivity sensors on all instruments drifted from the end of 2010 on, and records thereafter were discarded. At M3upper, no conductivity measurements were recorded at all. At M1upper, Hattermann et al. (2012) attributed a sensor drift from May 2010 to ice accretion at the sensor, and the conductivity was corrected using an exponential fit. Using the Gibbs-SeaWater Toolbox, conductivity was converted into absolute salinity. Temperature and salinity measurements from the moored instruments were compared to conductivity–temperature–depth (CTD) profiles taken at deployment time. Based on that, the salinity at M3lower was corrected for a constant offset. In addition, a linear drift of the salinity was identified and corrected at M3lower. Details of these corrections are described in the documentation of the published data set (Lauber et al., 2024c).
The dissolved oxygen data did not show any obvious sensor drift, but the values at all six instruments were systematically 0.39 mL L−1 higher than in comparable data sets (Sect. 2.3). In addition, the oxygen records contained noise in the form of downward spikes, mainly at the lowest measured temperatures. Detailed steps to remove the offset and the noise are described in Appendix A. Discarding bad data during the correction process introduced data gaps of up to several months toward the end of the record at M2upper and M3upper.
The measured velocities were corrected for magnetic declination using magnetic field data from the International Geomagnetic Reference Field (Alken et al., 2021) at hourly resolution.
We used the following toolboxes for data analysis and visualization: jLab (Lilly, 2021), M_Map (Pawlowicz, 2020), cmocean (Thyng et al., 2016), and Antarctic Mapping Tools (Greene et al., 2017).
2.3 Auxiliary data sets
For comparison to the sub-ice-shelf mooring observations, we used open-ocean temperature, salinity, and dissolved oxygen data collected in front of Fimbulisen (Fig. 2a): we used CTD data from 14 stations taken during the Troll Transect cruise on board M/V Malik Arctica in December 2020 and January 2021 using a Sea-Bird SBE911+ CTD (Lauber et al., 2024a). Additionally, we used hourly mooring data from three Sea-Bird SBE37 MicroCATs at two locations on the continental slope from March 2019 to December 2020. Of these three MicroCATs, one was mounted on mooring DMLdeep at a depth of 130 m, and two were mounted on DMLshallow at depths of 210 and 390 m (Lauber et al., 2024a). We also used dissolved oxygen data obtained from Winkler titration of 136 water samples from 17 stations taken during the Southern Ocean Ecosystem cruise onboard R/V Kronprins Haakon in March 2019. The respective temperature and salinity values were taken from Sea-Bird SBE911+ CTD measurements. The MicroCAT and CTD oxygen sensors were calibrated before and after deployment, but the Winkler titration provides the most reliable measurements of dissolved oxygen concentrations. In addition, we used temperature and salinity records obtained from Seaglider sg564 operating between December 2020 and April 2021.
Monthly values of thermocline depth, defined as the depth of the −0.3 °C isotherm, were extracted from a hydrographic climatology at 17° W (Hattermann, 2018) and from the DMLshallow mooring record.
2.4 Optimum multiparameter analysis
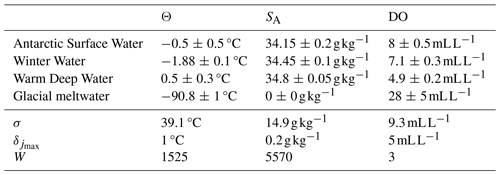
We investigated the water mass composition at the sub-ice-shelf instruments using optimum multiparameter analysis (OMP; Tomczak, 1981; Tomczak and Large, 1989; Mackas et al., 1987). With this method, the concentrations of given source water masses within an observed water mass can be obtained by solving a linear system of equations, assuming the conservation of specified tracers. In our case, the source water masses were ASW, WW, WDW, and GMW, and the tracers were conservative temperature (Θ), absolute salinity (SA), and dissolved oxygen (DO). The latter can be regarded as a conservative tracer below an ice shelf, assuming that biological productivity and respiration, which would modify oxygen levels, are negligible (Jenkins, 1999). The equation system then reads
where the source water property constants, Θ, SA, and DO, are summarized in matrix A. The concentrations of the source water masses are given in vector x, and the observed properties are contained in vector b. The equation in the last row of the system is mass conservation, i.e., the concentrations in x have to sum up to 1.
A and b were normalized, denoted as Anorm and bnorm, respectively, to make the tracers with differing units comparable. In addition, the tracers were given different relative weights in the equations using a diagonal weighting matrix W:
We calculated the weights following Tomczak and Large (1989) according to
where is the variance of the jth property across all four source water masses and is the maximum variance in the jth property between all source water masses. These values are given in Table 2. Wmass was set to the maximum of the three weights for the tracers. The normalized versions of A and b were then multiplied by W:
The system of equations was solved for x by minimizing the residual as follows:
where the subscript 2 denotes the Euclidean norm and a non-negativity constraint is imposed on x to avoid non-physical concentrations of negative x. The algorithm by Lawson and Hanson (1974) was used to solve the linear equation system under this constraint. We conducted the OMP analysis for daily averages of the tracers at all instruments (except M3upper due to missing salinity) up to the end of 2010 when simultaneous records of all three tracers were available.
The source water properties of ASW, WW, and WDW were derived from Θ–SA and Θ–DO diagrams (Fig. B1) from the auxiliary CTD, mooring, Seaglider, and Winkler titration data described in Sect. 2.3. ASW and WW seasonally transition into each other through surface heat and freshwater fluxes, representing end members of time-varying surface water mass properties. In our analysis, we defined a constant ASW end member with properties of °C, , and DO and a constant WW end member with properties of °C, , and DO, representing the extremes of these seasonally varying surface water masses. In this way, we can identify when water masses other than those spanning the WW–WDW–GMW space contribute to the composition of the water inside the cavity. Hence, the quantified concentrations of ASW refer only to our defined end-member properties. A more exact quantification of the contribution from a gradually varying surface water mass end member would also depend on the timescale by which the seasonal signal is propagated to the mooring sites. In addition, the properties of ASW can vary in time and space (Fahrbach et al., 1992; Hattermann, 2018) in such a way that ASW with differing properties may also contribute to the water mass composition. This scatter is addressed by assigning relatively large uncertainties to the ASW source water properties (see Table 2).
The salinity of GMW was set to and its conservative temperature to a theoretical value that accounts for the absorption of latent heat during the phase change (Jenkins, 1999). This temperature is the y-axis intercept of a meltwater mixing line in Θ–SA space (Gade, 1979). Following Nakayama et al. (2013), Biddle et al. (2017), and Zheng et al. (2021), this theoretical temperature was set to °C. Dissolved oxygen values for GMW have, in earlier studies, been obtained by extrapolating CDW–GMW mixing lines to a salinity of 0 g kg−1 in SA–DO space, resulting in a range of 25 mL L−1 to 30 mL L−1 (Hellmer et al., 1998; Jenkins, 1999; Jenkins and Jacobs, 2008). Since these meltwater mixing lines are not observed in our mooring data, we set DO for GMW following the latter and other studies (Nakayama et al., 2013; Biddle et al., 2017; Wåhlin et al., 2021). In Θ–DO space, meltwater mixing lines were estimated via a straight line to the GMW end member at DO and °C. The WDW end member was defined as ΘWDW=0.5 °C, , and DO. Note that ISW, defined as water with a temperature below the surface freezing point, is not a source water mass but a mixture of one of the other source water masses and GMW.
The source water masses represent a range rather than a point in Θ–SA–DO space (Table 2 and Fig. B1), and the measured variables from the instruments can contain offsets due to drift and accuracy of the sensors. To quantify how much both of these factors influence the results of the OMP analysis, we used a Monte Carlo approach to estimate the propagated uncertainties: first, uncertainties were assigned to the tracer properties of the source water masses (Table 2) and the measured tracers (σΘ=0.05 °C, , ). Then, the OMP calculations were re-run 105 times, but with all source water properties and measured values perturbed by a randomly drawn value of a Gaussian distribution with zero mean and the respective uncertainty in the tracers as the standard deviation. The standard deviation of the concentrations from all perturbed runs was then taken as the error in the water mass concentrations. Note that this method does not account for the possibly non-Gaussian variability in the ASW end member and that the given uncertainties may not capture the full range of ASW properties.
Table 2End-member values and uncertainties in the source water mass conservative temperature (Θ), absolute salinity (SA), and dissolved oxygen (DO) and the values for calculating the weight W in Eq. (3).
2.5 Thermal wind
The water mass estimates described above were complemented by estimates of horizontal density gradients, derived from velocity shear via the thermal wind equation as follows:
where ρ is the density; is the Coriolis parameter; is a reference density; is the gravitational acceleration; Δu and Δv are the differences for eastward and northward velocity, respectively, between upper and lower instruments at each mooring; and Δz is the vertical distance between the two instruments. The calculation was done using monthly averaged velocities and involves the assumption that the upper instruments are outside of the turbulent ice shelf–ocean boundary layer (the minimum distance of an upper instrument to the ice shelf base at deployment was 23 m at M2upper).
The distance over which the density gradients are valid is the baroclinic Rossby radius of deformation. Following Chelton et al. (1998), we estimated the first mode of the baroclinic Rossby radius according to
where H is the water depth, D is the depth of the ice draft, z is the vertical coordinate, Δz=1 m is the depth increment, and N is the Brunt–Väisälä frequency, calculated from the CTD profiles obtained at the mooring sites before mooring deployment (Hattermann et al., 2012) using the Gibbs-SeaWater Toolbox. Across repeated profiles at the three sites, this yields a baroclinic Rossby radius of around R=1 to 10 km.
The magnitude of the velocity difference vector (Δu,Δv) between upper and lower instruments (referred to as hereafter) serves as a measure of how baroclinic the flow is, i.e., the size of the depth-varying component of the flow. A small and large magnitude indicate weaker and stronger baroclinic conditions, respectively.
2.6 Warm events
As inflows of mWDW into the cavity at M1lower are of particular interest for basal melting at Fimbulisen (Lauber et al., 2023), we investigated the oceanic conditions before, during, and after such warm events. There were 2023 hourly measurements (1.8 % of all measurements) of temperatures above a threshold of −1.34 °C (the long-term mean with added 3 standard deviations) at M1lower. These measurements were split into 189 individual warm events separated by periods when the temperature dropped below the threshold for at least one hourly measurement.
To investigate the cavity hydrography and circulation associated with the warm events, composites of the evolution of temperature, oxygen, and velocity from 10 d before to 10 d after all warm events were computed. For that purpose, hourly time series before the warm events were aligned to the first record of each event and averaged across all events. Likewise, hourly time series after the warm events were aligned with the last record of each event and averaged across all events. All values during the warm events were averaged into one value at zero offset. The time of zero offset is referred to as t0 hereafter. When warm events were separated by less than 10 d, the composite averages contained autocorrelations. To minimize the effect of these, other warm events occurring within 10 d before or after a warm event were excluded from the respective average.
To assess the robustness of the composite averages, significance values were calculated using a Monte Carlo approach: it was tested 105 times how often the composite average of a variable is greater or lower than an average based on the same number of values randomly drawn from the respective full time series, i.e., without taking warm events into account. If for at least 99 % of the tests the composite average was larger or for at least 99 % of the tests the composite average was smaller than the average calculated from the randomly drawn values, the composite average was considered significant. The uncertainty in the composite averages was assessed by taking the standard deviation of the respective average across all events.
2.7 Contribution of water masses to ice shelf mass loss
We assessed the contribution of ASW, WW, and WDW to the mass loss of Fimbulisen using the rough values of the derived water mass concentrations below certain ice drafts. We furthermore utilized data of the mean basal melt rate of Fimbulisen during 2010–2018 (Adusumilli et al., 2020a) and of the ice draft (Morlighem et al., 2020). From these two data sets, we calculated the mean basal melt rate, B, and the total area, A, binned in intervals of 50 m of the ice draft for the central part of the ice shelf (3° W–3° E). We then calculated the product of thermal forcing and concentration of the three water masses for each water mass and each ice draft bin. The relative magnitude of this product for one water mass compared to the sum of the products for all three water masses then gives the contribution of this water mass for mass loss at the respective ice draft bin; i.e., the following applies:
where is the density of ice, Cj is the concentration of the jth water mass (ASW, WW or WDW), and ΔTj is the respective thermal forcing. We calculated the uncertainty in this estimate through Gaussian error propagation of the uncertainties in the water mass concentrations and the source water temperatures.
3.1 Mooring observations
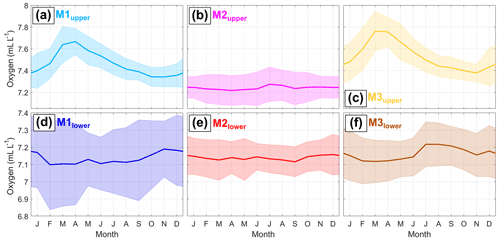
The temperature, oxygen, and velocity records from all six mooring instruments are presented in Fig. 3. At the upper instruments, 87 % of all temperature measurements are lower than the surface freezing point of −1.88 °C (Fig. 3a–c). This shows the presence of buoyant ISW, commonly found close to the ice base due to GMW input (Nøst and Foldvik, 1994). Oxygen values range from 7 to 8 mL L−1. At M1upper and M3upper, temperatures reach a maximum of up to −1.3 °C every year, coinciding with oxygen maxima of up to 8.1 mL L−1 (Fig. 3a, c). These temperature and oxygen maxima can be attributed to shallow intrusions of ASW traces in autumn below the ice drafts shallower than 185 m (Hattermann et al., 2012). The velocities at M1upper and M3upper are predominantly directed southward into the cavity with mean speeds of around 5 cm s−1. At M2upper (Fig. 3b), temperature maxima (up to −1.8 °C) and minima (down to −2.1 °C) are lower than at M1upper and M3upper, which is consistent with less influence of ASW and a lower in situ freezing point below the 345 m deep ice draft. Oxygen background values at M2upper are on average 0.2 mL L−1 lower than at M1upper and M3upper, and maxima remain below 7.6 mL L−1. The velocity at M2upper is predominantly directed toward the northeast along the basal channel at a speed of around 2 cm s−1.
At the lower instruments, 73 % of temperature observations lie above the surface freezing point, with oxygen values of around 7 mL L−1 (Fig. 3d–f). Temperature maxima reach 0.2 °C at M1lower, −0.9 °C at M2lower, and −1.5 °C at M3lower. These maxima are accompanied by a decrease in oxygen down to 5.1 mL L−1 and can be attributed to intrusions of mWDW into the cavity at depth (Hattermann et al., 2012; Lauber et al., 2023). At all lower instruments, minimum temperatures of down to −2.0 °C are observed in May/June in the years 2014 to 2016, indicating the presence of ISW in the lower part of the cavity. Before 2014, mean velocities at M1lower remained below 2 cm s−1 and varied in direction (Fig. 3d). Afterward, the flow direction at M1lower alternates seasonally between northwestward (out of the cavity) and southeastward (into the cavity) at mean speeds of up to 8 cm s−1. At M2lower, a near-continuous eastward flow of around 2 cm s−1 roughly follows contours of water column thickness into the cavity (Fig. 3e). At M3lower, the flow is southwestward along contours of water column thickness at speeds around 4 cm s−1 (Fig. 3f). This shows that mWDW also enters the cavity at the eastern sill as previously hypothesized by Nicholls et al. (2006).
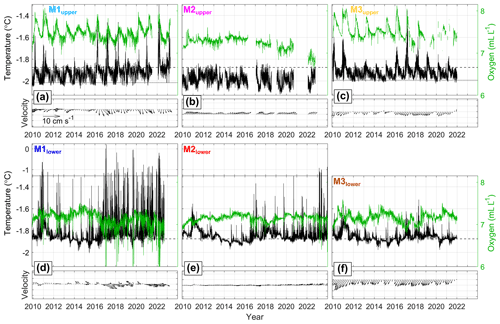
Figure 3Time series of hourly in situ temperature (left axis, black), daily averaged dissolved oxygen (right axis, green), and 60 d binned and four-bin (=240 d) filtered horizontal velocity (black arrows) at (a) M1upper, (b) M2upper, (c) M3upper, (d) M1lower, (e) M2lower, and (f) M3lower. The freezing temperature for water at a reference salinity of 34.4 g kg−1 at surface pressure (dashed line) and the depth of the ice base (dotted line in upper-instrument time series; Table 1) are indicated. At M2upper, the in situ freezing temperature of −2.14 °C lies outside of the shown temperature range.
To assess patterns of seasonal temperature variability, we examine the frequency of the occurrence of different temperature intervals during each month in Fig. 4, with red lines indicating percentiles of the monthly varying temperature distribution. At M1upper and M3upper, a pattern of higher temperatures is more frequently observed from December to May, showing the arrival of contributions of solar-heated ASW after it has been depressed below the depths of the ice shelf draft in autumn (Fig. 4a, c; Zhou et al., 2014). This variability is also reflected in the mean and all shown percentiles, which resemble the consistent seasonal variability of the respective full time series (Fig. 3a, c). At M2upper, we observe a somewhat reversed temperature seasonality (Fig. 4b): from April to June, the more frequent occurrence of temperatures below −2 °C indicates the presence of the coldest ISW during this period. During the rest of the year, the mean temperature is around −1.95 °C.
At M1lower, the most commonly observed temperatures lie around the surface freezing point throughout the year, with 64 % of all hourly temperature observations ranging between −1.8 and −1.9 °C (Fig. 4d). The monthly temperature distributions at M1lower show a long tail toward high values corresponding to mWDW. This tail is most pronounced between January and March and between September and November, as shown by the 80th and 99th percentiles. Between May and August, such high-temperature excursions are less frequent, and temperatures below the surface freezing point are more frequent. This is also seen in the 1st percentile and shows the presence of ISW. In summary, the temperature distribution at M1lower is the result of the superposition of three different modes: (i) a constant background temperature at the surface freezing point, (ii) warm mWDW presence in (a) January to March and (b) September to November, and (iii) cold ISW presence between May and August.
At M2lower, all three modes from M1lower are evident (Fig. 4e). This similarity is consistent with the regional proximity of the two sites and their connection by contours of constant water column thickness. mWDW is generally colder, and ISW is warmer at M2lower than at M1lower. At M3lower, the same three modes are present, but two of them are somewhat modified (Fig. 4f): mWDW is observed predominantly between February and April and is somewhat limited during the rest of the year. Furthermore, most ISW occurs between March and May, i.e., around 2 months earlier than at M1lower and M2lower.
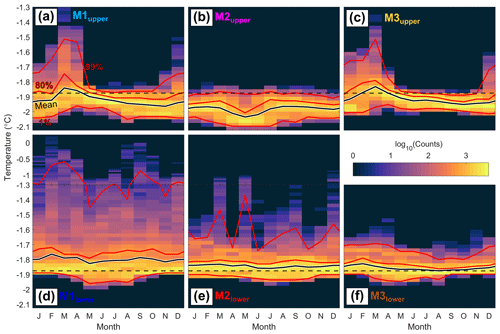
Figure 4Histograms of hourly temperature observations binned into monthly temperature intervals at (a) M1upper, (b) M2upper, (c) M3upper, (d) M1lower, (e) M2lower, and (f) M3lower. Please note the compression in the extended y axes of panels (d) and (e). The black lines are the mean temperature, and the red lines are the 1st, 80th, and 99th percentiles during the respective month. The horizontal dashed black lines indicate the surface freezing point for a salinity of 34.4 g kg−1.
To investigate the seasonal variability in velocities and their connections to the temperature, monthly mean arrows of the observed velocities and associated variance ellipses are shown in Fig. 5. At M1upper, the velocities reach a maximum speed of 4 cm s−1 in the south-southwest direction in April (Fig. 5a). This shows that the ASW traces observed during this time (Fig. 4a) intrude into the cavity along the western side of the Jutulstraumen keel (Fig. 2b). After July, increased velocity variability across the keel coincides with a lower influence of ASW. Similar to M1upper, the current speed at M3upper is at its maximum of 3 cm s−1 toward the southwest in March, when ASW traces are observed (Figs. 5c and 4c). At M2upper, highest speeds of 2 cm s−1 toward the northeast are observed together with the lowest temperatures in May (Figs. 5b and 4b). This coincidence of strong currents and low temperatures supports the picture of a buoyancy-driven flow, where ISW has been freshened along a meltwater mixing line, decreasing its density and hence rising faster along the ice base. The northeastward direction of the flow and its relatively small variability at M2upper aligns with the orientation of the basal channel in which the instrument is located and which seems to guide ISW from west to east across the Jutulstraumen keel at this location.
At M1lower, the velocity is directed toward the northwest (out of the cavity) at a speed of 4 cm s−1 in April and May and toward the southeast (into the cavity) at a speed of 4 cm s−1 from September to January (Fig. 5d). The timing of the outflow coincides with the lowest temperatures (Fig. 4d), i.e., ISW flows out of the cavity. The timing of the inflow coincides with the period when the highest temperature excursions are observed and no ISW is present. The flow at M2lower does not seasonally reverse its direction as at the main sill, but the eastward velocity is the highest at 3 cm s−1 in November (Fig. 5e), when the inflow at M1lower is close to being the strongest. This supports the connection between the M1lower and M2lower locations within the cavity. At M3lower, the southwestward (into the cavity) velocity reaches a maximum of 5 cm s−1 from April to June (Fig. 5f). The inflow is weakest in September and October, similarly to the flow below the ice base at M3upper (Fig. 5c). That is, the seasonal variability in the deep hydrography and currents at the main sill is different from that at the eastern sill and is further investigated in Sect. 4.1.

Figure 5Monthly climatology and variance ellipses of horizontal velocity at (a) M1upper, (b) M2upper, (c) M3upper, (d) M1lower, (e) M2lower, and (f) M3lower. For clarity, the size of the variance ellipses has been divided by a factor of 2 in all panels. The reference arrow in panel (a) is valid for all panels. Up: northward, right: eastward.
3.2 Water mass distribution
The water mass characteristics inside the Fimbulisen cavity and on the continental slope are shown in a volumetric Θ–SA diagram in Fig. 6a for 2010, when salinity data are available. The most frequently observed water masses evolve along a meltwater mixing line that intersects with temperatures around the surface freezing point and salinities around 34.4 g kg−1, indicating the presence of WW and ISW derived from them. In addition, water masses located along the WW–WDW mixing line at the three lower instruments verify the presence of mWDW at depth. The two available upper instruments also show water masses with temperatures above the surface freezing point and salinities lower than 34.2 g kg−1. Hattermann et al. (2012) showed that these water masses relate to the intrusions of ASW traces although contributions from meltwater that have been derived from mWDW cannot be ruled out based on the Θ–SA properties alone. Because of missing salinity data, the evolution of the Θ–SA characteristics inside the cavity after 2010 remains unclear although some inferences can be made based on the temperature time series and the knowledge about the stability of the open-ocean source water masses.
Further insights into the water mass distribution are provided by a Θ–DO diagram (Fig. 6b), which includes data from nearly the full length of the mooring record. The three auxiliary data sets (introduced in Sect. 2.3) show a pronounced mixing line at a constant slope between warm/oxygen-poor WDW and cold/oxygen-rich WW, which is the most abundant source water mass at all sub-ice-shelf instruments. This mixing line is also present in the data from the lower sub-ice-shelf instruments and could be utilized to identify noise of unrealistically low DO values and to correct a systematic offset of 0.39 mL L−1 in the lower sub-ice-shelf data compared to the auxiliary data (details described in Appendix A).
The presence of ASW at the upper instruments is characterized by a higher DO concentration than that of the WDW and WW (Fig. 6b). However, because ASW properties generally span a larger range of water mass properties than WDW, the mixing with WW does not happen along a unique line in Θ–DO space. Hence, we could not use the Θ–DO properties to determine an offset between the upper sub-ice-shelf data and auxiliary data. Instead, we used the water mass relations in SA–DO space (Fig. A2), which give the same systematic offset of 0.39 mL L−1 as for the lower instruments (details described in Appendix A). In Θ–DO space, the interaction with the ice shelf cools and adds oxygen to a given source water mass. As such, following meltwater mixing lines, the ISW observed at the upper instruments can be traced back to mainly originate from ice shelf melting by water composed of ASW and WW (Fig. 6b).
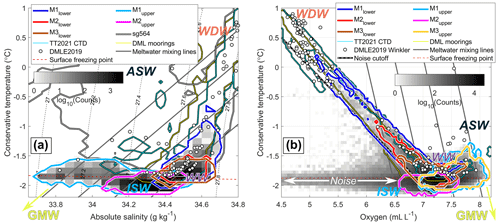
Figure 6(a) Conservative temperature–absolute salinity diagram of the sub-ice-shelf mooring data (except M3upper due to missing salinity) and auxiliary data. The gray shading is a histogram of all hourly upper and lower mooring data up to the end of 2010. Colored lines show the range of the single mooring instruments (1 count contour), of the mooring data (yellow, 5 counts contour), of the Troll Transect 2020/21 CTD data (cyan, 5 counts contour), and of Seaglider sg564 (black/white, 5 counts contour). White dots are the corresponding data to the Winkler titration data in panel (b). The gray lines are meltwater mixing lines. Dashed contours indicate the potential density in kg m−3. (b) Conservative temperature–dissolved oxygen diagram of the sub-ice-shelf mooring data and auxiliary data. The gray shading is a histogram of all hourly upper and lower mooring data (offset removed, noise not removed). Colored lines show the range from the individual mooring instruments (1 count contour, noise removed), of the mooring data (yellow, 5 counts contour), and of the Troll Transect 2020/21 CTD data (cyan, 5 counts contour). White dots show oxygen concentrations obtained from Winkler titration and temperature from CTD stations during the Southern Ocean Ecosystem cruise 2019. The gray lines are meltwater mixing lines and the dashed black/white line is the threshold below which the oxygen data from the lower sub-ice-shelf mooring instruments are considered noise.
We apply the OMP analysis to quantify the concentrations of the source water masses at all instrument sites (except M3upper due to missing salinity) up to the end of 2010. The results are shown in Fig. 7, and the time-mean concentrations are given in Table 3 and shown as pie charts in Fig. 2b. At M1upper (Fig. 7a), WW accounts for nearly 100 % of the observed water mass composition in December, the beginning of summer, with an admixture of 0.2 % GMW. From mid-February to mid-March, the ASW concentration increases to a maximum of 78 %, while the WW concentration reduces to 13 %. At the same time, the GMW concentration increases by an order of magnitude to 1.4 %. This suggests that the ASW traces arriving at M1upper have contributed to ice shelf melting on their pathway from the ice front to the instrument. The higher ASW concentration coincides with an increase in the WDW concentration, but the mean magnitude of the latter is 5 times smaller than its uncertainty, and we suspect that the OMP method detects a portion of ASW as WDW due to the similar temperature signatures of the two water masses. After March, a decrease in the ASW and GMW concentrations and an increase in the WW concentration happen more slowly than the changes before March. Between October and December, the water mass again consists almost entirely of WW. On average, an ASW concentration of 21 % is found at M1upper (Table 3).
At M2upper (Fig. 7b), the water mass evolution differs from that at M1upper: from January to April, the WW concentration is close to 100 %, with only occasional contributions of ASW, WDW, and GMW below 5 % during this period. In May and June, the ASW concentration increases to 30 % during two 2 and 8 d long pulses together with an increase in the GMW concentration to around 0.6 %. In July, the ASW concentration again increases to 20 % but slowly decreases over the following 6 months. This shows that water partly composed of ASW can reach below a 345 m deep ice draft and as far into the cavity as M2upper in winter. While ASW is primarily formed during the sea ice melt period up to February, the seasonal delay of its arrival inside the ice shelf cavity is consistent with the wind-driven deepening of ASW at the ice front in autumn/winter over the timescale of months (Zhou et al., 2014). During the decrease in the ASW concentration after July, the WW concentration again increases. On average, an ASW concentration of 5 % is found at M2upper (Table 3).
Traces of ASW are also found at M3lower in July (Fig. 7e; related to maxima in temperature and oxygen), indicating that remnants of ASW are downwelled to the seabed on the eastern continental shelf region in mid-winter. Traces of ASW at M1lower (Fig. 7c) and M2lower (Fig. 7d) are probably false detections, representing the freshest WW as no maxima in temperature and oxygen are observed at these times. At all lower instruments, WDW concentrations of around 10 % and WW concentrations of around 90 % are observed up to July. Afterward, the WDW concentration increases to up to 32 % and the WW concentration reduces down to 60 % at both M1lower and M3lower. Coherent concentrations of WDW concentrations of more than 10 % at M2lower throughout most of the year indicate that WDW contributes considerably to the water mass composition of the deeper part of the cavity. On average, a WDW concentration of 8 % to 11 % is found at the lower instruments (Table 3).
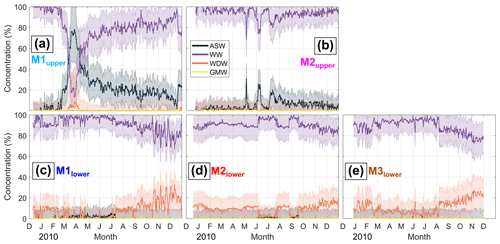
Figure 7Time series of concentrations of the source water masses defined in Table 2 during 2010, obtained from optimum multiparameter analysis for (a) M1upper, (b) M2upper, (c) M1lower, (d) M2lower, and (e) M3lower. Envelopes indicate the uncertainty.
Table 3Mean concentrations and uncertainties (in %) of the source water masses at M1-3 (except M3upper due to missing salinity) during 2010 from the optimum multiparameter analysis.

The occasional non-zero WDW concentrations from December to July at M2upper confirm the presence of an overturning circulation inside the cavity (Nøst and Foldvik, 1994), where mWDW/WDW enters the cavity at the seafloor, causing melting at deeper parts of the ice shelf, and rises along the ice base as it gains buoyancy from the GMW input. Although associated with large uncertainties in the OMP analysis, in Θ–DO space (Fig. 6b), the influence of mWDW below the deeper parts of the ice base is indicated by the low-oxygen ISW at M2upper that connects via GMW mixing lines to mWDW with temperatures of up to −0.8 °C. Consistently, decreasing DO values at M2upper (Fig. 3b) confirm an intensification of this overturning circulation when higher temperatures and lower oxygen values at M1lower and M2lower indicate an enhanced contribution of WDW at the seafloor after 2016 (Fig. 3d–e). This is consistent with results from Lauber et al. (2023), who suggested that increased flow speeds at the ice base after 2016 may be an imprint of increased inflow of mWDW at depth.
Due to the lack of good salinity data, the water mass composition cannot be quantified after 2010. However, at M1upper, temperature (Fig. 4a) and oxygen (Fig. 8a) maxima around March/April imply that the water mass evolution shown in Fig. 7a is generally valid for the whole mooring record. At M3upper, coinciding temperature (Fig. 4c) and oxygen (Fig. 8c) maxima and absolute values (Fig. 6b) compared to M1upper show that the hydrographic conditions at the two sites are comparable. We also note coinciding maxima in the long-term mean oxygen at M2upper and M3lower in July (Fig. 8b, f), indicating that traces of ASW reach down to M2upper at 370 m depth and even to M3lower at 450 m depth every year. Mixing with GMW has cooled this ASW-containing water down to the surface freezing temperature (Fig. 4b, f), but it may still provide heat for basal melting during times of strong currents (Lindbäck et al., 2023). At the lower instruments, the increase in WDW concentration after July is related to an event of anomalous deep warm inflow lasting up to mid-2011 (Hattermann et al., 2012; Lauber et al., 2023). In the long-term climatologies, no distinct temperature maxima (Fig. 4d–f) and oxygen minima (Fig. 8d–f) are found after July, indicating that the temporal evolution of the water mass concentrations at the lower instruments in 2010 is not representative of the long-term seasonal cycle.
3.3 Dynamic structure in the cavity
3.3.1 Density gradients
In order to investigate seasonal variations in the spatial distribution of the water masses in the cavity, we estimate the velocity shear and infer the local density gradients at the three sites (Fig. 9) from thermal wind balance (Eqs. 7 and 8). Density gradients obtained this way are assumed to be valid over length scales larger than the baroclinic Rossby radius of . The density difference between the water masses in the cavity is larger between ASW and WW () and ISW and WW () than between WW and mWDW (; Hattermann et al., 2012). Therefore, large density gradients imply that water composed of ASW and/or ISW is present close to the ice base. Based on changes in the direction and magnitude of the density gradients, we separate the following description into August to February and March to July and define two phases in Sect. 3.3.2.
From August to February, (defined as the magnitude of the velocity difference vector between upper and lower instruments) remains below 10 cm s−1 for 93 % of all measurements across all three sites (Fig. 9a, c, e). At M1, the velocity at the upper instrument is directed southwestward, and at the lower instrument southeastward (Fig. 5a, d); i.e., the difference between the upper and lower instrument is a westward velocity. This is associated with a northward density gradient, i.e., denser water north of the M1 site (Fig. 9b). At M2, the density gradient is northeastward and has a magnitude 3 times smaller compared to M1 (Fig. 9d). Density gradients at this site may also be affected by the local flow in the 1.5 km wide basal channel that M2upper is located in. At M3, the gradient is eastward and half the magnitude of that at M1 (Fig. 9f).
From March to July, increases to values of up to 41 cm s−1 at M1 and 30 cm s−1 at M3, showing an increase in baroclinicity during this period compared to the previously discussed period (Fig. 9a, e). At M2, no significant increase in is observed (Fig. 9c). The density gradient at M1 rotates toward the west-southwest after February, reaching a maximum in April and May (Fig. 9b). During the same months, the density gradients at M2 and M3 are at their seasonal maximum and directed southeastward (Fig. 9d, f).
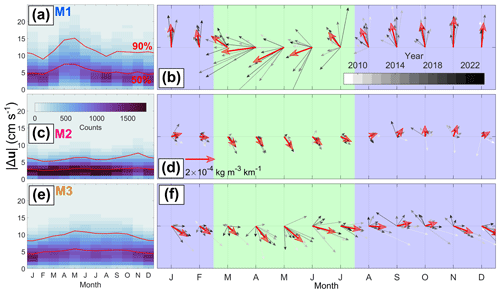
Figure 9Histograms of hourly values of binned on monthly intervals for (a) M1, (c) M2, and (e) M3. is defined as the magnitude of the velocity difference vector between the upper and lower instrument and is therefore greater or equal to zero. The red lines are the 50th and 90th percentiles during the respective month. Horizontal density gradients estimated from Eqs. (7) and (8) using the velocity difference between the upper and lower instruments at (b) M1, (d) M2, and (f) M3. The bold red arrows are the long-term monthly averages, and thin grayscale arrows are the monthly averages of individual years as indicated by the color bar. Green and blue shading marks the two periods sketched in Fig. 10. The reference arrow in panel (d) is also valid for panels (b) and (f).
3.3.2 Seasonal phases
The changes in the baroclinicity and density gradients suggest that the cavity circulation alternates between two phases throughout the year. We now describe these two phases by including the previously presented findings (Fig. 10).
From August to February (Fig. 10a), ISW is abundant close to the ice base (Fig. 4a–c), and the shallow inflow of open-ocean water masses is limited (Fig. 5a–c). The density gradients (Fig. 9b, d, f) suggest a front between lighter ISW inside the cavity and denser WW toward the ice front. At the same time, the velocity at the main sill is directed into the cavity (Fig. 5d), and the temperature distributions at M1lower and M2lower show more frequent inflows of mWDW (Fig. 4d–e). Traces of WDW derived at M2upper (Fig. 7b) confirm the contribution of this water mass to basal melting, presumably happening at a greater depth further inside the cavity. Assuming a velocity of 2 cm s−1 along contours of water column thickness at M2lower (Fig. 5e) and a length scale of 200 km to the grounding line (Fig. 2a), enhanced intrusions of mWDW at the main sill between January and March may indeed explain the cooling and acceleration of the ISW 2 to 4 months later at M2upper (Figs. 4b and 5b), implying a strengthening of the mWDW-driven cavity overturning during this period.
From March to July (Fig. 10b), ASW traces enter the cavity close to the ice base (Figs. 4a–c and 7a, b). The derived density gradients at M1 and M2 (Fig. 9b, d) and velocity at M1upper (Fig. 5a) indicate that these ASW traces intrude the cavity along ice draft contours below the western side of the Jutulstraumen keel and increase the baroclinic circulation inside the cavity. This is consistent with the shallow and deep flow being oriented along contours of ice draft and bathymetry, respectively, due to baroclinic conditions during this time of the year (Hattermann et al., 2014). As ASW is generally lighter than ISW (Hattermann et al., 2012), we expect the ASW-rich water to act as a wedge between the ice base and ISW, displacing the latter to greater depths. This provides a possible explanation for the occurrence of ISW at all lower instruments 1 to 3 months after ASW traces are observed at the upper instruments (Fig. 4). At the same time, the presence of ASW traces at the ice base increases the thermal forcing and, therefore, the potential for basal melting. Below the relatively shallow ice at M1upper and M3upper (185 and 155 m, respectively), melting is enhanced by the excess heat of the ASW from solar heating (i.e., water temperatures above the surface freezing point), as is confirmed by the increase in GMW concentration when the ASW concentration is highest (Fig. 7a). At the 345 m deep ice draft of M2upper, another effect comes into play: although the traces of ASW arriving at this site have depleted most of the solar heat (presumably due to melting and mixing with WW), the water temperature around the surface freezing point (Fig. 4b) still exceeds the local freezing point by 0.3 °C, replacing the colder ISW that had reached its seasonal temperature minimum at this site before the arrival of the ASW traces. The distance from the ice front to M2upper is about 70 km via M1 and 150 km via M3. Although the exact pathway of the ASW traces to M2upper remains unclear, the coinciding oxygen maxima in July (Fig. 8b, f) at M3lower (450 m depth) and M2upper (370 m depth) indicate that a larger portion of the deeper ice of Fimbulisen may be influenced by this water mass.
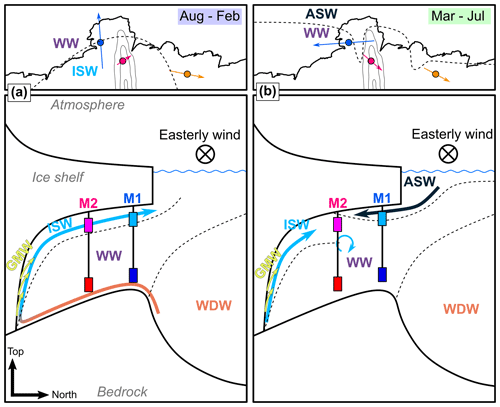
Figure 10Sketches of the estimated water mass distribution at Fimbulisen in (a) August–February and (b) March–July. The upper panels are schematic maps (valid for the upper 100 m of the water column), where the thick black line shows the ice front (Mouginot et al., 2017) and the thin black lines show the smoothed 250, 300, and 350 m contours of the ice draft (Morlighem et al., 2020). Colored arrows at the mooring locations show the mean density gradient from Fig. 9 during the respective period. Dashed lines roughly separate the water masses. The lower panels are north–south cross sections. The locations of M1 and M2 are indicated, but the relative depth of the instruments is not to scale.
3.4 Characteristics of warm events at M1lower
Warm events at depth, i.e., the second mode of the M1lower temperature distribution, have been associated with increased basal melting of Fimbulisen (Lauber et al., 2023) and hence require particular attention. To understand the dynamics of these warm events at the main sill, we characterize the temporal evolution of temperature, oxygen, and velocity at M1lower and M1upper by constructing composite averages of these variables before and after the 189 recorded warm events. A warm event is defined as a period of subsequent measurements of hourly temperatures above −1.34 °C at M1lower, and the time of the event is referred to as t0 (see Sect. 2.6 for details). The median duration (upper/lower quartile) of individual events was 3 h (10/1 h), and the longest consecutive inflow event lasted for 142 h (Fig. 11a).
Changes in velocity at M1lower associated with a warm event are visualized in a hodograph (showing the tip of the composite velocity vector from 6 d before to 6 d after t0, Fig. 11d): starting around 3 d before and ending around 2 d after t0, the velocity signature follows an counterclockwise-rotating ellipse with a maximum speed of toward the southeast, i.e., into the cavity, at t0. The corresponding composite temperature increases to a maximum of °C (Fig. 11b, d). Oxygen decreases down to during the same time (Fig. 11c). This observed co-varying signal of rotating velocity vector and rapid change in hydrography is the typical signature of a coherent eddy advected past a mooring. Following Lilly and Rhines (2002), we can quantify the following mean properties of these eddies based on the composite velocity time series at M1lower around t0: a radius of , a half-duration of , an azimuthal speed of , an advection speed of , and an advection direction of ° (i.e., toward the southeast into the cavity; 0° is to the east). The given uncertainties were estimated by calculating the properties for every event separately and then taking the standard deviation of each property across the events. The resulting uncertainties exceed the spread of the mean properties when varying the temperature threshold defining warm events between 1 and 5 standard deviations (−1.65 to −1.04 °C). The sense of the rotation of the eddy is not necessarily equal to the rotation visualized in the hodograph (Fig. 11d) as the latter shows the temporal evolution seen by the fixed mooring instrument. Instead, the rotational sense of the eddies can be inferred from a change in the sign of the cross-stream velocity component, vn, relative to the advection direction (Lilly and Rhines, 2002): the sign of vn at M1lower changes from negative to positive (Fig. 11f), which means that eddies associated with warm events rotate cyclonically (i.e., clockwise in the Southern Hemisphere). The direct observational link between warm events at depth and eddies advected into the cavity confirms previous model-derived hypotheses of the dynamics of mWDW intrusions below Fimbulisen (Nøst et al., 2011; Hattermann et al., 2014).
The temperature maximum at M1lower occurs by definition at t0 (Fig. 11b, d). The change from negative to positive vn also happens at t0 and does not result from the temperature-based definition of the warm events (Fig. 11f). This change in vn indicates that the core of the eddy coincides with the highest temperature, i.e., the highest concentration of dense WDW. The sign of the associated radially inward density gradient is in balance with cyclonic rotation according to thermal wind balance. This is in agreement with the cyclonic rotation derived from vn at M1lower. The estimated radius of r=6 km is in agreement with the magnitude of the baroclinic Rossby radius of R=1 to 10 km in the region. The signature of an eddy in vn depends on the properties of the eddy and at which cross-stream radius the eddy passes the mooring (Lilly and Rhines, 2002). The spread in vn across the 189 identified events (Fig. 11f) shows that eddies with a variety of properties (as also indicated by the high uncertainties in their estimated mean) pass M1lower throughout the length of the record.
To assess the dynamics below the ice base associated with warm events at depth, Fig. 11e shows a hodograph for M1upper, and Fig. 11f shows the corresponding time series of vn. Similar to M1lower, the hodograph at M1upper rotates counterclockwise around t0. In addition, the time series of vn (relative to φ=325°) agrees well with vn at M1lower, indicating that the eddies associated with warm events at depth extend up to the ice base. At M1upper, the composite temperature and oxygen show significantly high values before and during t0, when the temperature is at a maximum of °C (Fig. 11b, c).
We also observe a statistically significant temperature maximum of °C at M2lower 5 to 9 d after t0 (Fig. 11b). This shows that the mWDW advected into the cavity at the main sill via eddies follows, at least to some extent, the contours of water column thickness toward the grounding line as proposed by Hattermann et al. (2012) and modeled by Hattermann et al. (2014). Unlike at M1, the temperature maxima at M2lower are not associated with the distinct signature of an eddy.
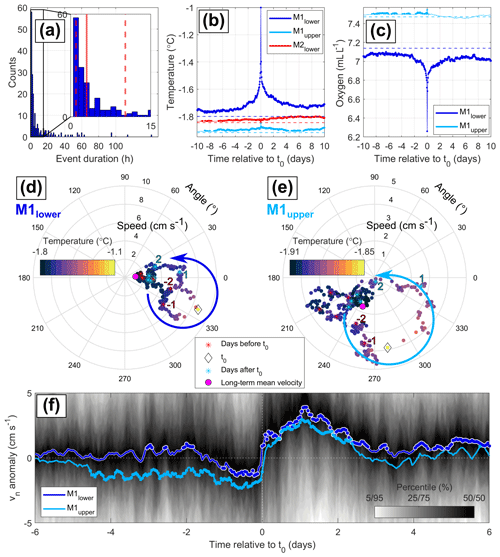
Figure 11Oceanic conditions around warm events at M1lower at hourly resolution, as defined in Sect. 2.6. (a) Histogram of the event duration. Composite averages of (b) temperature and (c) dissolved oxygen before, during, and after an event. Dots on the time series indicate a significant deviation from the long-term mean (dashed lines). Hodographs (tip of the velocity vector) showing the composite average velocity from 6 d before to 6 d after a warm event at t0 at (d) M1lower and (e) M1upper. The color map indicates the respective composite average temperatures at both instruments. Stars indicate the time in days relative to t0. The magenta dot shows the mean velocity during the whole mooring period. Note the different radial velocity scales between the two hodographs. (f) Composite average cross-stream velocity anomaly (compared to the long-term mean from panels d–e) at M1lower and M1upper after rotation into the estimated eddy advection direction (φ=325°). Dots on the time series indicate a significant deviation from zero (dashed white line). The gray shading shows the percentiles of the velocity distribution at M1lower across all 189 events.
4.1 Favorable conditions for warm events
We have shown that the highest temperatures at the main sill occur preferably from January to March and from September to November (Figs. 4d and 12b) and that these excursions are associated with eddies advected into the cavity (Fig. 11). We did, however, not find statistically significant changes in the eddy characteristics between these two warm periods. In the following, we discuss potential favorable conditions for warm inflows during the two periods, incorporating observations from outside the cavity (Hattermann, 2018; Lauber et al., 2024a).
Modeling studies have suggested that warm intrusions at the main sill occur when the offshore WDW and the associated thermocline are lifted over the main sill (Smedsrud et al., 2006; Nicholls et al., 2008; Nøst et al., 2011). Variations in the thermocline depth on monthly timescales are driven by the strength of the alongshore winds and freshwater forcing from sea ice melt (referred to as external forcing in the following; Lauber et al., 2024a). Downstream, at 17° W, the coastal thermocline is shallowest in February (Fig. 12c; Hattermann, 2018). Upstream, at 10° E, observations at DMLshallow (Fig. 2a) show the shallowest thermocline in March (Fig. 12c), but the minimum in thermocline depth closer to the coast likely occurs earlier than that (Lauber et al., 2024a). Therefore, the shallowest externally forced thermocline depth can explain the mWDW inflow that occurs from January to March at M1lower (Fig. 12b) but not the mWDW inflow from September to November.
On the upstream and downstream continental shelves, respectively, mooring observations have shown the highest temperatures at depth from January to February at 39° E in front of Shirase Glacier Tongue (Hirano et al., 2020) and from April to May at 31° W in front of Filchner–Ronne Ice Shelf (Ryan et al., 2017, 2020). This timing of deep warm inflow is consistent with the shallowest externally forced thermocline above the continental slope in these regions (Ohshima et al., 1996; Semper and Darelius, 2017). Likewise, at the eastern sill of Fimbulisen, the highest observed temperatures between January and April (Figs. 4f and 12b) coincide with the shallowest externally forced thermocline (Fig. 12c).
The most obvious difference between the other locations and the main sill of Fimbulisen is the unique geometric configuration of Trolltunga, which overhangs the continental slope. We hypothesize that the seasonal interplay of the ASC with the ice shelf plays a role in setting up favorable conditions for mWDW intrusions at times other than at the externally forced thermocline depth minimum. Recent observational and modeling studies have highlighted the role of conservation of potential vorticity for the interaction of the ASC with an ice shelf (Wåhlin et al., 2020; Steiger et al., 2022). As the ASC follows the contours of water column thickness (Thompson et al., 2018), the presence of Trolltunga may displace the upstream ASC (Fig. 12d) up to 2 km northward in front of the main sill (Fig. 12a). This displacement is expected to vary seasonally as the potential vorticity constraint depends on stratification (Steiger et al., 2022) and baroclinicity (Hattermann et al., 2014; estimated by at M1, Fig. 12d). Depending on the strength and direction of the ASC in front of the main sill, anomalies in bottom Ekman transport may further adjust the depth of the body of WDW on the continental slope (Smedsrud et al., 2006; Webb et al., 2019). We suggest that this setting of mechanisms provides favorable conditions for the advection of warm eddies across the main sill between September and November.
Potential mechanisms for the generation of the eddies found in Sect. 3.4 are (i) detaching as baroclinic instabilities from the locally shoaled body of WDW below Trolltunga (Nøst et al., 2011) or (ii) shedding of barotropic meanders from the edges of Trolltunga (Walkden et al., 2009). The advection of the eddies across the main sill may be facilitated by a mean flow into the cavity from August to February (Fig. 5d). It is unclear if this mean flow causes the warm intrusions and/or if it is the result of the seasonal reorganization of water masses inside the cavity (Fig. 9). Although a detailed understanding will require further research, it appears plausible that the interplay of the discussed processes associated with Trolltunga and the externally forced thermocline depth modulates the inflow conditions at the main sill on seasonal timescales.
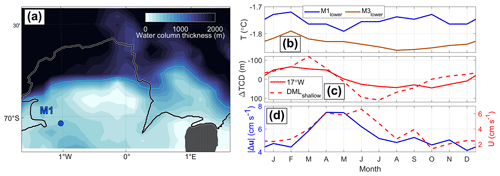
Figure 12(a) Water column thickness at Trolltunga (Eisermann et al., 2020a; Morlighem et al., 2020). The black line shows the ice front (Mouginot et al., 2017), the solid cyan line shows the 1000 m water column thickness contour, and the dashed cyan line is the 1000 m isobath. (b) 80th percentile of the monthly binned temperature distribution at M1lower and M3lower (middle red lines in Fig. 4d, f). (c) Climatology of monthly thermocline depth anomaly (compared to the respective annual mean) at the coast at 17° W (Hattermann, 2018) and at DMLshallow (Lauber et al., 2024a). (d) 50th percentile of monthly binned at M1 (left axis, lower red line in Fig. 9a) and monthly mean along-stream velocity at the depth of the main sill of 570 m at DMLshallow (Lauber et al., 2024a).
4.2 Basal melting
We have quantified the water mass concentrations at five different depths below Fimbulisen (i.e., at all instruments except M3upper), and we now use these results to estimate the contributions of ASW, WW, and WDW to basal melting. For the calculation, we assume that the water inside the Fimbulisen cavity is composed on average of 20 % ASW down to a 200 m deep ice draft and 10 % WDW below 500 m ice draft and that the remaining water over the whole range of ice drafts is WW. We calculate the mass loss contribution of all three water masses by weighing the total mass loss by their thermal forcing and concentration at ice draft bins of 50 m. The resulting contribution is shown in Fig. 13: ASW causes 79 % of the mass loss above 200 m and 21 % of the total mass loss. As the local freezing temperature decreases with depth, the relative mass loss caused by WW increases down to 200 m. As ASW and WDW are absent between 200 and 500 m in our assumed water mass distribution, all mass loss in this depth interval is caused by WW, which accounts for 73 % of the total ice shelf mass loss. Below 500 m, WDW causes 37 % of the mass loss, resulting from its high thermal forcing despite its relatively low concentration compared to WW. WDW accounts for 6 % of the total ice shelf mass loss.
Melting by WW through the effect of decreasing in situ freezing temperature with increasing pressure (Jacobs et al., 1992) is typical of the ice shelves along the coast of Dronning Maud Land. Our result of WW causing the largest portion of the mass loss of Fimbulisen is consistent with this view. However, both WW and ASW contributions to basal melting are associated with an uncertainty of around 50 % (Fig. 13). This large uncertainty arises from uncertainties in the concentrations and temperatures of the source water masses. As mass loss is highest around 200 m ice draft, which is also our defined lower boundary of ASW contribution, the quantified contributions of ASW and WW are highly sensitive to our definition of these two water masses, representing the two extremes of water masses that seasonally transition into each other through surface forcing. The relative contribution of WDW to mass loss is less sensitive to changes in concentration and end-member temperature. However, based on the absolute mass loss attributed to the present water mass concentrations, a doubling in WDW concentration from, e.g., 10 % to 20 % and a corresponding decrease in WW concentration from 90 % to 80 % below 500 m ice draft would increase the absolute mass loss below this depth by 30 %. Such melting of the deeper parts of the ice shelf and associated changes in ice shelf geometry are more relevant for impacts on the buttressing of the inland ice (Dupont and Alley, 2005).
The contributions of the water masses to the basal melting of Fimbulisen may change in the future. We observed the highest ASW-related temperatures of up to −1.3 °C after 2016 (Fig. 3a, c) when the sea ice concentration in the Weddell Sea and in front of Fimbulisen was at a record low (Turner et al., 2020). Similarly, Lindbäck et al. (2019) found a sudden increase in basal melt rates close to the ice front of Nivlisen Ice Shelf at 11° E during periods when no sea ice was present in front of the ice shelf. These observations are consistent with increased solar heating of ASW in the absence of sea ice cover (Kusahara and Hasumi, 2013; Porter et al., 2019). In this context, our findings highlight that changes in Southern Ocean heat content (Prince and L'Ecuyer, 2024) and possibly associated changes in ASW temperature may increase basal melting below the shallow ice drafts of Fimbulisen.
The observed timing of mWDW occurrence below Fimbulisen suggests that the presence of Trolltunga plays an important role for the inflow dynamics into the cavity. This highlights the potential consequences of the unique setup of the ice shelf and continental slope at Fimbulisen on its mass balance, where future changes in the extent of the ice tongue (such as the major calving event in 1967; Swithinbank et al., 1977) may impact the extent to which mWDW can access the cavity and contribute to the basal melting. However, linking Trolltunga and associated processes more robustly with warm intrusions across the main sill and basal melting of the ice shelf requires further research, e.g., using high-resolution numerical modeling.
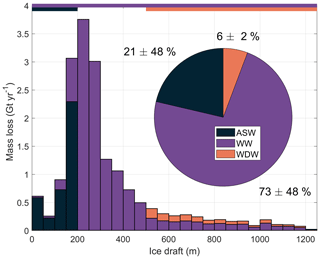
Figure 13Mean basal mass loss of Fimbulisen during 2010–2018 per ice draft bin. Colors indicate the estimated contributions from ASW, WW, and WDW to mass loss at the respective bin. Horizontal bars at the top show at which depth bins water masses are assumed to be present. The pie chart shows the relative contribution of the three water masses to basal melting summed over all ice draft bins.
The 14 years of temperature, oxygen, and velocity observations below Fimbulisen have provided new insights into the processes guiding heat into the cavity both through contributions from ASW at the ice base and from WDW near the seafloor. Key features identified in the cavity hydrography and circulation are as follows:
-
Traces of ASW intrude into the cavity below the ice base every year, contributing up to 78 % to the observed water mass composition at 220 m depth in March (M1) and up to 30 % at 370 m depth after May (M2), increasing the thermal forcing and separating ISW from the ice base.
-
The inflow of ASW traces along the western side of the Jutulstraumen keel in autumn is in agreement with density gradients inferred from velocity shear by thermal wind balance.
-
Below a deeper ice draft (345 m), the OMP analysis and meltwater mixing lines suggest that ISW near the ice base partly originates from melting by mWDW.
-
The temperature distribution at the main sill is a superposition of three distinct modes: (i) a background temperature at the surface freezing point, (ii) warm mWDW inflow from (a) January to March and (b) September to November, and (iii) cold ISW outflow from May to August.
-
Warm events at the main sill are associated with cyclonic eddies that reach up to the ice base.
These results complement the previous mooring studies from Hattermann et al. (2012) and Lauber et al. (2023) by providing long-term evidence of the temporal and spatial variability of the water masses within the cavity. The findings highlight the potential future relevance of basal melting of Fimbulisen by ASW and WDW, adding to our understanding of the processes that are important to assess future mass loss of the Antarctic ice sheet and associated sea level rise in a warming climate.
The Oxygen Optodes 3830 mounted on the RCM9s measured the partial pressure of the oxygen dissolved in the seawater through a foil that is permeable to gas but not water or salt. The large amount of noise at low values in the oxygen records from the optodes requires careful processing of these data. No noise is present at higher oxygen values, making high values generally more reliable. The steps undertaken to process the data are summarized below:
-
Salinity and pressure correction.
The raw data from the instruments were corrected for the effects of salinity and pressure. This was done following the procedure recommended by the manufacturer (Aanderaa Data Instruments, 2007):
where DOcorr is the corrected oxygen, DOuncorr is the uncorrected oxygen, and fS and fP are factors compensating for the effects of salinity and pressure, respectively. These factors are given by
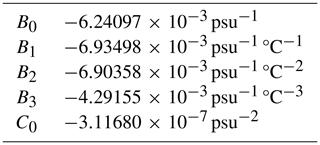
where S is the practical salinity measured by the RCM9, Sint=1 psu is a fixed internal salinity setting of the optode, TS is the scaled temperature (defined below), B0…3 and C0 are constants (given in Table A1), and D is the depth of the sensor. As salinity measurements were only available up to the end of 2010, S was set to the time-mean of each instrument over this period. An increase in S by 0.1 psu leads to a decrease in DOcorr by 0.005 mL L−1 at the typically measured salinities, i.e., the sensitivity of DOcorr to temporal changes in salinity is negligible. At M3upper, where no salinity measurements were available, S was set to the mean salinity of M1upper. The scaled temperature, TS, is given by
where T is the in situ temperature in °C measured by the RCM9.
-
Unit conversion.
The unit given by the instrument is µmoL L−1. This unit was converted into mL L−1:
where is the molar volume of an ideal gas at standard temperature and pressure.
-
Offset removal.
We identified an offset of 0.39 mL L−1 in the sub-ice-shelf oxygen data compared to the auxiliary data sets. At the lower instruments, this offset was obtained by minimizing the root mean square difference between the respective WDW–WW mixing lines in the Θ–DO diagram (Fig. 6b). This mixing line is most pronounced at M1lower (due to the strongest WDW influence) but is also present to some extent at M2lower and M3lower. To remove the offset, we added a constant value of 0.39 mL L−1 to the oxygen data from all lower instruments.
At the upper instruments, an offset is more difficult to identify than at the lower instruments in the Θ–DO diagram (Fig. 6b) as the water masses do not follow a clear mixing line. A mixing line between ASW and WW is more pronounced in the Winkler titration data in a SA–DO diagram (Fig. A2, based only on data up to the end of 2010). The slope of the ASW–WW mixing line at M1upper agrees with the slope of the line from the Winkler titration data, yielding the same offset of 0.39 mL L−1 as for the lower instruments. For M2upper, the SA–DO diagram is less conclusive since most of the observed water is ISW, which is not represented in the auxiliary data. However, after adding the same offset to the M2upper oxygen data, the SA–DO properties of this instrument can be traced back along a meltwater mixing line to originate from the WW in all three auxiliary data sets (Fig. A2). At M3upper, no comparison in SA–DO space can be done due to missing salinity data. However, because of similar temperature values (Fig. 3a, c) and a similar seasonal variability in temperature (Fig. 4a, c) and oxygen (Fig. 8a, c) at M3upper compared to M1upper and because the magnitude of the oxygen offset was the same at all five other instruments, the constant of 0.39 mL L−1 was also added to the oxygen records at M3upper.
The oxygen sensors at all six instruments were calibrated by the manufacturer before deployment and, after consulting the manufacturer, we cannot determine the origin of this offset.
-
Noise removal.
This step was done separately for the upper and lower sensors due to different temperature–oxygen properties below the ice base compared with close to the seabed.
-
For the upper oxygen sensors, all values below a threshold of 6 mL L−1 were discarded. After that, the hourly data were subsampled by selecting the maximum hourly measurement for each day. If one or more measurements during one day had already been discarded, no measurement was kept for the respective day. This method yields the upper envelope of the oxygen time series and strictly removes any suspicious spikes toward low values.
-
For all lower oxygen sensors, low oxygen values accompanied by an increase in temperature were identified as real features in Fig. 6b as they lay on the WW–WDW mixing line. Using the same method as for the upper sensors would remove these values. To avoid this, we define a threshold based on both oxygen and temperature below which all data oxygen measurements were removed. This threshold is set directly below the WW–WDW mixing line (dashed black–white line in Fig. 6b) and is described by the following equation:
A direct comparison of the oxygen time series before and after noise removal is shown in Fig. A1. To account for any remaining artifacts in the absolute values of dissolved oxygen, we used an uncertainty of in the OMP calculations (see the “Data and methods” section).
-
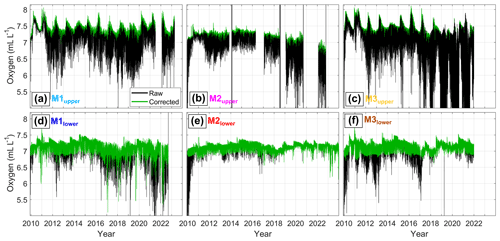
Figure A1Comparison between raw and corrected dissolved oxygen data at (a) M1upper, (b) M2upper, (c) M3upper, (d) M1lower, (e) M2lower, and (f) M3lower. Note that the offset has been removed for better comparability.
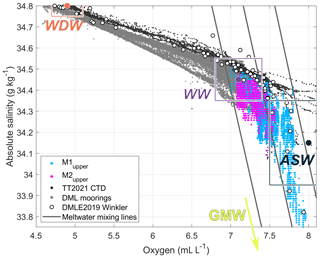
Figure A2Absolute salinity–dissolved oxygen diagram of M1upper and M2upper after removal of the constant offset and noise up to the end of 2010 (since no salinity data are available afterward). The same auxiliary data sets as in Figs. 6 and B1 are shown. Colored dots with boxes indicate the mean properties and uncertainties in ASW, WW, and WDW (see also Table 2).
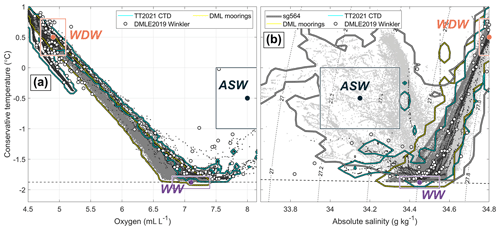
Figure B1Mean properties and uncertainties in the source water masses (except glacial meltwater). (a) Conservative temperature–dissolved oxygen diagram and (b) conservative temperature–absolute salinity diagram. The same auxiliary data sets as in Fig. 6 are shown, with all data points indicated in gray tones. Colored dots with boxes indicate the mean properties and uncertainties in ASW, WW, and WDW (see also Table 2).
The code to analyze the data and create the figures is available from the corresponding author upon request. The M1-3 mooring data are available at https://doi.org/10.21334/npolar.2024.58a50745 (Lauber et al., 2024c). The Winkler titration data are available at https://doi.org/10.21334/npolar.2024.ce7f9866 (Fransson and Chierici, 2024). The seaglider data are available at https://doi.org/10.21334/npolar.2024.1959df96 (Hattermann and Lauber, 2024). The DML mooring data are available at https://doi.org/10.21334/npolar.2023.45d176be (Lauber et al., 2024b). The CTD data from the Troll Transect 2020/21 cruise are available at https://doi.org/10.21334/npolar.2023.b1504a66 (Lauber et al., 2024d). The hydrographic climatology at 17° W is available at https://doi.org/10.1594/PANGAEA.893199 (Hattermann and Rohardt, 2018). Bathymetric data are available at https://doi.org/10.1594/PANGAEA.913742 (Eisermann et al., 2020b), https://doi.org/10.1594/PANGAEA.963737 (Eisermann, 2024), and https://doi.org/10.5067/FPSU0V1MWUB6 (Morlighem, 2022). Ice shelf draft data are available at https://doi.org/10.5067/FPSU0V1MWUB6 (Morlighem, 2022). Basal melt rate data are available at https://doi.org/10.6075/J04Q7SHT (Adusumilli et al., 2020b).
JL processed the data, conducted the analyses, prepared the figures, and wrote the initial manuscript. TH participated in the fieldwork and provided supervision. JL, TH, LdS, ED and AF discussed and improved the manuscript.
The contact author has declared that none of the authors has any competing interests.
Publisher’s note: Copernicus Publications remains neutral with regard to jurisdictional claims made in the text, published maps, institutional affiliations, or any other geographical representation in this paper. While Copernicus Publications makes every effort to include appropriate place names, the final responsibility lies with the authors.
The authors thank the sections Maritime and Technical Support and Operations and Logistics Antarctica from NPI for their support involving the moorings. The authors also thank Louise Biddle, Johannes Karstensen, and Morven Muilwijk for helpful discussions on optimum multiparameter analysis.
This research has been supported by the Research Council of Norway (RCN) through the KLIMAFORSK program (project iMelt; grant no. 295075). The installation of the Fimbulisen moorings through the project “ICE Fimbulisen – top to bottom” in 2009 was financed by the Centre for Ice, Climate and Ecosystems (ICE), Norwegian Polar Institute (NPI); and the moorings were maintained by NPI through ICE; the Norwegian Antarctic Research Expedition (IceRises 759; grant no. 3801-103); iMelt; and the Troll Observing Network (TONe) RCN-supported infrastructure project (grant no. 322466). The DML moorings were financed and installed by NPI. Julius Lauber was funded by iMelt and TONe. Tore Hattermann acknowledges funding through the RCN through its Centres of Excellence funding scheme via iC3, Centre for ice, Cryosphere, Carbon and Climate (project no. 332635).
This paper was edited by Karen J. Heywood and reviewed by Laurence Padman and one anonymous referee.
Aanderaa Data Instruments: TD 218 Operating Manual Oxygen Optode 3830, 3835, 3930, 3975, 4130, 4175, Bergen, Norway, http://www.argodatamgt.org/content/download/26531/181223/file/Aanderaa_TD218_OperatingManual_OxygenOptode_3830_3835_3930_3975_4130_4175_RevApr2007.pdf (last access: 15 November 2024), 2007. a
Adusumilli, S., Fricker, H. A., Medley, B., Padman, L., and Siegfried, M. R.: Interannual variations in meltwater input to the Southern Ocean from Antarctic ice shelves, Nat. Geosci., 13, 616–620, 2020a. a, b, c
Adusumilli, S., Fricker, H. A., Medley, B. C., Padman, L., and Siegfried, M. R.: Data from: Interannual variations in meltwater input to the Southern Ocean from Antarctic ice shelves, UC San Diego Library Digital Collections [data set], https://doi.org/10.6075/J04Q7SHT, 2020b. a
Alken, P., Thébault, E., Beggan, C. D., Amit, H., Aubert, J., Baerenzung, J., Bondar, T., Brown, W., Califf, S., Chambodut, A., Chulliat, A., Cox, G. A., Finlay, C. C., Fournier, A., Gillet, N., Grayver, A., Hammer, M. D., Holschneider, M., Huder, L., Hulot, G., Jager, T., Kloss, C., Korte, M., Kuang, W., Kuvshinov, A., Langlais, B., Léger, J.-M., Lesur, V., Livermore, P. W., Lowes, F. J., Macmillan, S., Magnes, W., Mandea, M., Marsal, S., Matzka, J., Metman, M. C., Minami, T., Morschhauser, A., Mound, J. E., Nair, M., Nakano, S., Olsen, N., Pavón-Carrasco, F. J., Petrov, V. G., Ropp, G., Rother, M., Sabaka, T. J., Sanchez, S., Saturnino, D., Schnepf, N. R., Shen, X., Stolle, C., Tangborn, A., Tøffner-Clausen, L., Toh, H., Torta, J. M., Varner, J., Vervelidou, F., Vigneron, P., Wardinski, I., Wicht, J., Woods, A., Yang, Y., Zeren, Z., and Zhou, B.: International Geomagnetic Reference Field: the thirteenth generation, Earth, Planet. Space, 73, 1–25, https://doi.org/10.1186/s40623-020-01288-x, 2021. a
Biddle, L. C., Heywood, K. J., Kaiser, J., and Jenkins, A.: Glacial Meltwater Identification in the Amundsen Sea, J. Phys. Oceanogr., 47, 933–954, https://doi.org/10.1175/JPO-D-16-0221.1, 2017. a, b
Chelton, D. B., deSzoeke, R. A., Schlax, M. G., Naggar, K. E., and Siwertz, N.: Geographical Variability of the First Baroclinic Rossby Radius of Deformation, J. Phys. Oceanogr., 28, 433–460, https://doi.org/10.1175/1520-0485(1998)028<0433:GVOTFB>2.0.CO;2, 1998. a
Darelius, E., Fer, I., Janout, M., Daae, K., and Steiger, N.: Observations of the Antarctic Slope Current in the Southeastern Weddell Sea: A Bottom-Enhanced Current and Its Seasonal Variability, J. Geophys. Res.-Oceans, 129, e2023JC020666, https://doi.org/10.1029/2023JC020666, 2024. a
DeConto, R. M. and Pollard, D.: Contribution of Antarctica to past and future sea-level rise, Nature, 531, 591–597, 2016. a
DeConto, R. M., Pollard, D., Alley, R. B., Velicogna, I., Gasson, E., Gomez, N., Sadai, S., Condron, A., Gilford, D. M., Ashe, E. L., Kopp, R. E., Li, D., and Dutton, A.: The Paris Climate Agreement and future sea-level rise from Antarctica, Nature, 593, 83–89, 2021. a
Dupont, T. K. and Alley, R. B.: Assessment of the importance of ice-shelf buttressing to ice-sheet flow, Geophys. Res. Lett., 32, L04503, https://doi.org/10.1029/2004GL022024, 2005. a, b
Dutrieux, P., Rydt, J. D., Jenkins, A., Holland, P. R., Ha, H. K., Lee, S. H., Steig, E. J., Ding, Q., Abrahamsen, E. P., and Schröder, M.: Strong Sensitivity of Pine Island Ice-Shelf Melting to Climatic Variability, Science, 343, 174–178, https://doi.org/10.1126/science.1244341, 2014. a
Edwards, T. L., Nowicki, S., Marzeion, B., Hock, R., Goelzer, H., Seroussi, H., Jourdain, N. C., Slater, D. A., Turner, F. E., Smith, C. J., et al.: Projected land ice contributions to twenty-first-century sea level rise, Nature, 593, 74–82, 2021. a
Eisermann, H.: Bathymetric model beneath Nivl and Lazarev ice shelves, and across Astrid Ridge embedded within IBCSOV2, PANGAEA [data set], https://doi.org/10.1594/PANGAEA.963737, 2024. a
Eisermann, H., Eagles, G., Ruppel, A., Smith, E. C., and Jokat, W.: Bathymetry Beneath Ice Shelves of Western Dronning Maud Land, East Antarctica, and Implications on Ice Shelf Stability, Geophys. Res. Lett., 47, 1–10, 2020a. a, b, c, d, e
Eisermann, H., Eagles, G., Ruppel, A., Smith, E. C., and Jokat, W.: Bathymetry beneath ice shelves of western Dronning Maud Land, East Antarctica, PANGAEA [data set], https://doi.org/10.1594/PANGAEA.913742, 2020b. a
Eisermann, H., Eagles, G., and Jokat, W.: Coastal bathymetry in central Dronning Maud Land controls ice shelf stability, Sci. Rep., 14, 1–13, https://doi.org/10.1038/s41598-024-51882-2, 2024. a
Fahrbach, E., Rohardt, G., and Krause, G.: The Antarctic coastal current in the southeastern Weddell Sea, Polar Biol., 12, 171–182, https://doi.org/10.1007/BF00238257, 1992. a
Foldvik, A., Gammelsrød, T., Østerhus, S., Fahrbach, E., Rohardt, G., Schröder, M., Nicholls, K. W., Padman, L., and Woodgate, R. A.: Ice shelf water overflow and bottom water formation in the southern Weddell Sea, J. Geophys. Res.-Oceans, 109, 1–15, 2004. a
Fransson, A. and Chierici, M.: Dissolved oxygen winkler data in 2019 from the water column in Dronning Maud Land – Kong Håkon VII Hav, Southern Ocean, Antarctica, Norwegian Polar Institute, Tromsø [data set], https://doi.org/10.21334/npolar.2024.ce7f9866, 2024. a
Fürst, J. J., Durand, G., Gillet-Chaulet, F., Tavard, L., Rankl, M., Braun, M., and Gagliardini, O.: The safety band of Antarctic ice shelves, Nat. Clim. Change, 6, 479–482, https://doi.org/10.1038/nclimate2912, 2016. a
Gade, H. G.: Melting of Ice in Sea Water: A Primitive Model with Application to the Antarctic Ice Shelf and Icebergs, J. Phys. Oceanogr., 9, 189–198, https://doi.org/10.1175/1520-0485(1979)009<0189:MOIISW>2.0.CO;2, 1979. a, b
Greene, C. A., Gwyther, D. E., and Blankenship, D. D.: Antarctic Mapping Tools for Matlab, Comput. Geosci., 104, 151–157, https://doi.org/10.1016/j.cageo.2016.08.003, 2017. a
Greene, C. A., Gardner, A. S., Schlegel, N.-J., and Fraser, A. D.: Antarctic calving loss rivals ice-shelf thinning, Nature, 609, 948–953, 2022. a
Hattermann, T.: Antarctic Thermocline Dynamics along a Narrow Shelf with Easterly Winds, J. Phys. Oceanogr., 48, 2419–2443, 2018. a, b, c, d, e, f
Hattermann, T. and Lauber, J.: Oceanographic data from Seaglider deployment during Troll Transect cruise 2020–2021, Kong Håkon VII Hav, Antarctica, Norwegian Polar Institute, Tromsø [data set], https://doi.org/10.21334/npolar.2024.1959df96, 2024. a
Hattermann, T. and Rohardt, G.: Kapp Norvegia Antarctic Slope Front climatology, PANGAEA [data set], https://doi.org/10.1594/PANGAEA.893199, 2018. a
Hattermann, T., Nøst, O. A., Lilly, J. M., and Smedsrud, L. H.: Two years of oceanic observations below the Fimbul Ice Shelf, Antarctica, Geophys. Res. Lett., 39, 1–6, 2012. a, b, c, d, e, f, g, h, i, j, k, l, m, n, o
Hattermann, T., Smedsrud, L. H., Nøst, O. A., Lilly, J. M., and Galton-Fenzi, B. K.: Eddy-resolving simulations of the Fimbul Ice Shelf cavity circulation: Basal melting and exchange with open ocean, Ocean Model., 82, 28–44, 2014. a, b, c, d, e, f, g, h
Hellmer, H. H., Jacobs, S. S., and Jenkins, A.: Ocean, Ice, and Atmosphere: Interactions at the Antarctic Continental Margin, chap. Oceanic Erosion of a Floating Antarctic Glacier in the Amundsen Sea, American Geophysical Union (AGU), 83–99, https://doi.org/10.1029/AR075p0083, 1998. a
Herraiz-Borreguero, L. and Naveira Garabato, A. C.: Poleward shift of Circumpolar Deep Water threatens the East Antarctic Ice Sheet, Nat. Clim. Change, 12, 728–734, 2022. a
Hirano, D., Tamura, T., Kusahara, K., Ohshima, K. I., Nicholls, K. W., Ushio, S., Simizu, D., Ono, K., Fujii, M., Nogi, Y., and Aoki, S.: Strong ice-ocean interaction beneath Shirase Glacier Tongue in East Antarctica, Nat. Commun., 11, 1–12, 2020. a, b, c
Jacobs, S. S.: On the nature and significance of the Antarctic Slope Front, Mar. Chem., 35, 9–24, https://doi.org/10.1016/S0304-4203(09)90005-6, 1991. a
Jacobs, S. S., Hellmer, H. H., Doake, C. S. M., Jenkins, A., and Frolich, R. M.: Melting of ice shelves and the mass balance of Antarctica, J. Glaciol., 38, 375–387, 1992. a
Jenkins, A.: The Impact of Melting Ice on Ocean Waters, J. Phys. Oceanogr., 29, 2370–2381, https://doi.org/10.1175/1520-0485(1999)029<2370:TIOMIO>2.0.CO;2, 1999. a, b, c, d, e
Jenkins, A. and Jacobs, S.: Circulation and melting beneath George VI Ice Shelf, Antarctica, J. Geophys. Res.-Oceans, 113, C04013, https://doi.org/10.1029/2007JC004449, 2008. a
Jenkins, A., Shoosmith, D., Dutrieux, P., Jacobs, S., Kim, T. W., Lee, S. H., Ha, H. K., and Stammerjohn, S.: West Antarctic Ice Sheet retreat in the Amundsen Sea driven by decadal oceanic variability, Nat. Geosci., 11, 733–738, 2018. a
Kusahara, K. and Hasumi, H.: Modeling Antarctic ice shelf responses to future climate changes and impacts on the ocean, J. Geophys. Res.-Oceans, 118, 2454–2475, https://doi.org/10.1002/jgrc.20166, 2013. a
Lauber, J., Hattermann, T., de Steur, L., Darelius, E., Auger, M., Nøst, O., and Moholdt, G.: Warming beneath an East Antarctic ice shelf due to increased subpolar westerlies and reduced sea ice, Nat. Geosci., 16, 877–885, https://doi.org/10.1038/s41561-023-01273-5, 2023. a, b, c, d, e, f, g, h, i, j, k
Lauber, J., de Steur, L., Hattermann, T., and Darelius, E.: Observed Seasonal Evolution of the Antarctic Slope Current System off the Coast of Dronning Maud Land, East Antarctica, J. Geophys. Res.-Oceans, 129, e2023JC020540, https://doi.org/10.1029/2023JC020540, 2024a. a, b, c, d, e, f, g, h, i
Lauber, J., de Steur, L., Hattermann, T., and Lundesgaard, Ø.: Hydrography and current meter data from two ocean moorings off the coast of Dronning Maud Land 2019–2021, Norwegian Polar Institute, Tromsø, [data set], https://doi.org/10.21334/npolar.2023.45d176be, 2024b. a
Lauber, J., Hattermann, T., de Steur, L., and Foss, Ø.: Sub-Ice Shelf Mooring Data from Fimbulisen, East Antarctica: Hourly Time Series of Ocean Currents, Temperature, Salinity, Pressure, and Dissolved Oxygen since 2009, Norwegian Polar Institute, Tromsø, [data set], https://doi.org/10.21334/npolar.2024.58a50745, 2024c. a, b, c
Lauber, J., Hattermann, T., Moreau, S., Dundas, V., and Lundesgaard, Ø.: CTD profiles from Troll Transect cruise 2020–2021 to Dronning Maud Land, Antarctica , Norwegian Polar Institute, Tromsø, [data set], https://doi.org/10.21334/npolar.2023.b1504a66, 2024d. a
Lawson, C. L. and Hanson, R. J.: Solving Least Squares Problems, chap. Linear Least Squares with Linear Inequality Constraints, Prentice Hall, Hoboken, New Jersey, 158–173, https://doi.org/10.1137/1.9781611971217.ch23, 1974. a
Lilly, J. M.: jLab: A data analysis package for Matlab, v.1.7.1, Zenodo [software], https://doi.org/10.5281/zenodo.4547006, 2021. a
Lilly, J. M. and Rhines, P. B.: Coherent Eddies in the Labrador Sea Observed from a Mooring, J. Phys. Oceanogr., 32, 585–598, https://doi.org/10.1175/1520-0485(2002)032<0585:CEITLS>2.0.CO;2, 2002. a, b, c
Lindbäck, K., Moholdt, G., Nicholls, K. W., Hattermann, T., Pratap, B., Thamban, M., and Matsuoka, K.: Spatial and temporal variations in basal melting at Nivlisen ice shelf, East Antarctica, derived from phase-sensitive radars, The Cryosphere, 13, 2579–2595, https://doi.org/10.5194/tc-13-2579-2019, 2019. a
Lindbäck, K., Darelius, E., Moholdt, G., Vaňková, I., Hattermann, T., Lauber, J., and de Steur, L.: Basal melting and oceanic observations beneath Fimbulisen, East Antarctica, ESS Open Archive, preprint, https://doi.org/10.22541/essoar.170365303.33631810/v1, 2023. a
Mackas, D. L., Denman, K. L., and Bennett, A. F.: Least squares multiple tracer analysis of water mass composition, J. Geophys. Res.-Oceans, 92, 2907–2918, https://doi.org/10.1029/JC092iC03p02907, 1987. a
McDougall, T. J. and Barker, P. M.: Getting started with TEOS-10 and the Gibbs Seawater (GSW) Oceanographic Toolbox, Scor/Iapso WG127, 1–32, https://www.teos-10.org/pubs/gsw/v3_04/pdf/Getting_Started.pdf (last access: 15 November 2024), 2011. a
McPhee, M. and Morison, J.: Under-ice boundary layer, Encyclopedia of Ocean Sciences, 3071–3078, https://doi.org/10.1006/rwos.2001.0146, 2001. a
Morlighem, M.: MEaSUREs BedMachine Antarctica, Version 3., NASA National Snow and Ice Data Center Distributed Active Archive Center [data set], Boulder/Colorado/USA, https://doi.org/10.5067/FPSU0V1MWUB6, 2022. a, b
Morlighem, M., Rignot, E., Binder, T., Blankenship, D., Drews, R., Eagles, G., Eisen, O., Ferraccioli, F., Forsberg, R., Fretwell, P., et al.: Deep glacial troughs and stabilizing ridges unveiled beneath the margins of the Antarctic ice sheet, Nat. Geosci., 13, 132–137, 2020. a, b, c, d, e, f, g
Mouginot, J., Scheuchl, B., and Rignot, E.: MEaSUREs Antarctic Boundaries for IPY 2007–2009 from Satellite Radar, Version 2. [Coastline_Antarctica_v02, GroundingLine_Antarctica_v02], NASA National Snow and Ice Data Center Distributed Active Archive Center, Boulder/Colorado/USA, [data set], https://doi.org/10.5067/AXE4121732AD, 2017. a, b, c, d, e
Nakayama, Y., Schröder, M., and Hellmer, H.: From circumpolar deep water to the glacial meltwater plume on the eastern Amundsen Shelf, Deep-Sea Res. Pt. I, 77, 50–62, https://doi.org/10.1016/j.dsr.2013.04.001, 2013. a, b
Nicholls, K. W., Abrahamsen, E. P., Buck, J. J. H., Dodd, P. A., Goldblatt, C., Griffiths, G., Heywood, K. J., Hughes, N. E., Kaletzky, A., Lane-Serff, G. F., McPhail, S. D., Millard, N. W., Oliver, K. I. C., Perrett, J., Price, M. R., Pudsey, C. J., Saw, K., Stansfield, K., Stott, M. J., Wadhams, P., Webb, A. T., and Wilkinson, J. P.: Measurements beneath an Antarctic ice shelf using an autonomous underwater vehicle, Geophys. Res. Lett., 33, 1–4, https://doi.org/10.1029/2006GL025998, 2006. a, b, c
Nicholls, K. W., Abrahamsen, E. P., Heywood, K. J., Stansfield, K., and Østerhus, S.: High-latitude oceanography using the Autosub autonomous underwater vehicle, Limnol. Oceanogr., 53, 2309–2320, https://doi.org/10.4319/lo.2008.53.5_part_2.2309, 2008. a, b, c
Nicholls, K. W., Østerhus, S., Makinson, K., Gammelsrød, T., and Fahrbach, E.: Ice-ocean processes over the continental shelf of the southern Weddell Sea, Antarctica: A review, Rev. Geophys., 47, 1–23, 2009. a, b
Nøst, O. A.: Measurements of ice thickness and seabed topography under the Fimbul Ice Shelf, Dronning Maud Land, Antarctica, J. Geophys. Res.-Oceans, 109, 1–14, 2004. a
Nøst, O. A. and Foldvik, A.: A model of ice shelf-ocean interaction with application to the Filcher-Ronne and Ross Ice Shelves, J. Geophys. Res.-Oceans, 99, 14243–14254, https://doi.org/10.1029/94JC00769, 1994. a, b, c
Nøst, O. A., Biuw, M., Tverberg, V., Lydersen, C., Hattermann, T., Zhou, Q., Smedsrud, L. H., and Kovacs, K. M.: Eddy overturning of the Antarctic Slope Front controls glacial melting in the Eastern Weddell Sea, J. Geophys. Res.-Oceans, 116, 1–17, 2011. a, b, c, d
Núñez-Riboni, I. and Fahrbach, E.: Seasonal variability of the Antarctic Coastal Current and its driving mechanisms in the Weddell Sea, Deep-Sea Res. Pt. I, 56, 1927–1941, 2009. a, b
Ohshima, K. I., Takizawa, T., Ushio, S., and Kawamura, T.: Seasonal variations of the Antarctic coastal ocean in the vicinity of Lützow-Holm Bay, J. Geophys. Res.-Oceans, 101, 20617–20628, https://doi.org/10.1029/96JC01752, 1996. a, b
Pawlowicz, R.: M_Map: A mapping package for MATLAB, version 1.4o, [software], https://www.eoas.ubc.ca/~rich/map.html, last access: 12 May 2020. a
Porter, D. F., Springer, S. R., Padman, L., Fricker, H. A., Tinto, K. J., Riser, S. C., Bell, R. E., and the ROSETTA-Ice Team: Evolution of the Seasonal Surface Mixed Layer of the Ross Sea, Antarctica, Observed With Autonomous Profiling Floats, J. Geophys. Res.-Oceans, 124, 4934–4953, https://doi.org/10.1029/2018JC014683, 2019. a
Price, M. R., Heywood, K. J., and Nicholls, K. W.: Ice-shelf – ocean interactions at Fimbul Ice Shelf, Antarctica from oxygen isotope ratio measurements, Ocean Sci., 4, 89–98, https://doi.org/10.5194/os-4-89-2008, 2008. a
Prince, H. D. and L'Ecuyer, T. S.: Observed energetic adjustment of the Arctic and Antarctic in a warming world, J. Climate, https://doi.org/10.1175/JCLI-D-23-0294.1, 2024. a
Pritchard, H. D., Ligtenberg, S. R. M., Fricker, H. A., Vaughan, D. G., van den Broeke, M. R., and Padman, L.: Antarctic ice-sheet loss driven by basal melting of ice shelves, Nature, 484, 502–505, 2012. a
Reese, R., Gudmundsson, G. H., Levermann, A., and Winkelmann, R.: The far reach of ice-shelf thinning in Antarctica, Nat. Clim. Change, 8, 53–57, 2018. a
Ribeiro, N., Herraiz-Borreguero, L., Rintoul, S. R., Williams, G., McMahon, C. R., Hindell, M., and Guinet, C.: Oceanic Regime Shift to a Warmer Continental Shelf Adjacent to the Shackleton Ice Shelf, East Antarctica, J. Geophys. Res.-Oceans, 128, e2023JC019882, https://doi.org/10.1029/2023JC019882, 2023. a
Rignot, E., Jacobs, S., Mouginot, J., and Scheuchl, B.: Ice Shelf Melting Around Antarctica, Science, 341, 266–270, 2013. a
Rintoul, S. R., Silvano, A., Pena-Molino, B., van Wijk, E., Rosenberg, M., Greenbaum, J. S., and Blankenship, D. D.: Ocean heat drives rapid basal melt of the Totten Ice Shelf, Sci. Adv., 2, e1601610, https://doi.org/10.1126/sciadv.1601610, 2016. a
Ryan, S., Hattermann, T., Darelius, E., and Schröder, M.: Seasonal cycle of hydrography on the eastern shelf of the Filchner Trough, Weddell Sea, Antarctica, J. Geophys. Res.-Oceans, 122, 6437–6453, 2017. a, b
Ryan, S., Hellmer, H. H., Janout, M., Darelius, E., Vignes, L., and Schröder, M.: Exceptionally Warm and Prolonged Flow of Warm Deep Water toward the Filchner-Ronne Ice Shelf in 2017, Geophys. Res. Lett., 47, 1–20, 2020. a, b
Semper, S. and Darelius, E.: Seasonal resonance of diurnal coastal trapped waves in the southern Weddell Sea, Antarctica, Ocean Sci., 13, 77–93, https://doi.org/10.5194/os-13-77-2017, 2017. a, b
Smedsrud, L. H., Jenkins, A., Holland, D. M., and Nøst, O. A.: Modeling ocean processes below Fimbulisen, Antarctica, J. Geophys. Res.-Oceans, 111, 1–13, 2006. a, b, c, d
Steiger, N., Darelius, E., Kimura, S., Patmore, R. D., and Wåhlin, A. K.: The Dynamics of a Barotropic Current Impinging on an Ice Front, J. Phys. Oceanogr., 52, 2957–2973, https://doi.org/10.1175/JPO-D-21-0312.1, 2022. a, b, c
Sverdrup, H. U.: The Currents off the Coast of Queen Maud Land, Norsk Geogr. Tidsskr., 14, 239–249, 1954. a
Swithinbank, C., McClain, P., and Little, P.: Drift tracks of Antarctic icebergs, Polar Record, 18, 495–501, https://doi.org/10.1017/S0032247400000991, 1977. a
Thompson, A. F., Stewart, A. L., Spence, P., and Heywood, K. J.: The Antarctic Slope Current in a Changing Climate, Rev. Geophys., 56, 741–770, 2018. a, b
Thyng, K. M., Greene, C. A., Hetland, R. D., Zimmerle, H. M., and DiMarco, S. F.: True Colors of Oceanography: Guidelines for Effective and Accurate Colormap Selection, Oceanography, 29, 9–13, 2016. a
Tinto, K. J., Padman, L., Siddoway, C. S., Springer, S. R., Fricker, H. A., Das, I., Tontini, F. C., Porter, D. F., Frearson, N. P., Howard, S. L., Siegfried, M. R., Mosbeux, C., Becker, M. K., Bertinato, C., Boghosian, A., Brady, N., Burton, B. L., Chu, W., Cordero, S. I., Dhakal, T., Dong, L., Gustafson, C. D., Keeshin, S., Locke, C., Lockett, A., O’Brien, G., Spergel, J. J., Starke, S. E., Tankersley, M., Wearing, M. G., and Bell, R. E.: Ross Ice Shelf response to climate driven by the tectonic imprint on seafloor bathymetry, Nat. Geosci., 12, 441–449, 2019. a
Tomczak, M.: A multi-parameter extension of temperature/salinity diagram techniques for the analysis of non-isopycnal mixing, Prog. Oceanogr., 10, 147–171, https://doi.org/10.1016/0079-6611(81)90010-0, 1981. a
Tomczak, M. and Large, D. G. B.: Optimum multiparameter analysis of mixing in the thermocline of the eastern Indian Ocean, J. Geophys. Res.-Oceans, 94, 16141–16149, https://doi.org/10.1029/JC094iC11p16141, 1989. a, b
Turner, J., Guarino, M. V., Arnatt, J., Jena, B., Marshall, G. J., Phillips, T., Bajish, C. C., Clem, K., Wang, Z., Andersson, T., Murphy, E. J., and Cavanagh, R.: Recent Decrease of Summer Sea Ice in the Weddell Sea, Antarctica, Geophys. Res. Lett., 47, 1–11, 2020. a
Wåhlin, A. K., Steiger, N., Darelius, E., Assmann, K. M., Glessmer, M. S., Ha, H. K., Herraiz-Borreguero, L., Heuzé, C., Jenkins, A., Kim, T. W., Sommeria, J., and Viboud, S.: Ice front blocking of ocean heat transport to an Antarctic ice shelf, Nature, 578, 568–571, 2020. a, b, c
Walkden, G. J., Heywood, K. J., Nicholls, K. W., and Abrahamsen, P.: Freshwater transport at Fimbulisen, Antarctica, J. Geophys. Res.-Oceans, 114, C08014, https://doi.org/10.1029/2008JC005028, 2009. a, b
Webb, D. J., Holmes, R. M., Spence, P., and England, M. H.: Barotropic Kelvin Wave-Induced Bottom Boundary Layer Warming Along the West Antarctic Peninsula, J. Geophys. Res.-Oceans, 124, 1595–1615, 2019. a
Wåhlin, A. K., Graham, A. G. C., Hogan, K. A., Queste, B. Y., Boehme, L., Larter, R. D., Pettit, E. C., Wellner, J., and Heywood, K. J.: Pathways and modification of warm water flowing beneath Thwaites Ice Shelf, West Antarctica, Sci. Adv., 7, eabd7254, https://doi.org/10.1126/sciadv.abd7254, 2021. a
Zheng, Y., Heywood, K. J., Webber, B. G., Stevens, D. P., Biddle, L. C., Boehme, L., and Loose, B.: Winter seal-based observations reveal glacial meltwater surfacing in the southeastern Amundsen Sea, Commun. Earth Environ., 2, 1–9, 2021. a
Zhou, Q., Hattermann, T., Nøst, O. A., Biuw, M., Kovacs, K. M., and Lydersen, C.: Wind-driven spreading of fresh surface water beneath ice shelves in the Eastern Weddell Sea, J. Geophys. Res.-Oceans, 119, 3818–3833, 2014. a, b, c


